Embed Size (px)
Citation preview
CBN Journal of Applied Statistics Vol. 6 No. 1(a) (June, 2015) 153
Is Real Exchange Rate Misalignment a Leading Indicator of
Currency Crises in Nigeria?1
Babatunde S. Omotosho2
This paper constructs an early warning system for currency crises in Nigeria
based on selected key macroeconomic indicators. It estimates the probabilities
of currency crises as a logistic function of the included variables within the
framework of a logit model. Particularly, the extent to which real exchange
rate misalignment (RERMIS) could be used as a leading indicator of currency
crisis is investigated by including its lag in the model. Our findings show that
the likelihood of currency crisis increases when the real exchange rate is
misaligned; the exchange rate is volatile; oil price declines; debt/GDP ratio
increases; and the current account balance to GDP ratio declines. The study
confirms that RERMIS represents a useful leading indicator of currency crisis
in the country. The paper therefore recommends regular assessment of the
Naira exchange rate vis-à-vis its equilibrium level with a view to
implementing appropriate policy responses to rein in or avoid prolonged and
substantial misalignments. Since all the variables enter the equation in their
one period lags, the estimated model constitutes a reliable early warning
system to policy makers on the possibility of impending currency crisis in the
country.
Keywords: Real exchange rate misalignment, exchange market pressure,
currency crises, logit model
JEL Classification: C33, F31, F41.
1.0 Introduction
Following the collapse of the Bretton Woods system of fixed exchange rates
in March 1973, the frequency and costs of currency crises have increased
substantially. This unfortunate collapse led many developed countries to adopt
the flexible exchange rate system while some developing ones responded by
sustaining their fixed exchange rate parities. Eventually, a number of these
developing countries abolished the fixed exchange rate system and embraced
intermittent adjustments by implementing regimes such as the crawling pegs
1This article is an expanded version of a paper titled ‘Modeling Crisis in Nigeria: An
Application of Logit Model’ presented by the author at the 59th
World Statistics Congress held
in Hong Kong during August 26-30, 2013. The author is grateful to Dr. S. I. Doguwa for his
insightful comments and guidance in the course of preparing the paper. The views expressed
are those of the author and do not represent the views of the Central Bank of Nigeria.
2 Statistics Department, Central Bank of Nigeria, Abuja. [email protected]
154 Is Real Exchange Rate Misalignment a Leading Indicator
Currency Crises in Nigeria? Omotosho
or the managed float. Consequently, exchange rate setting in those countries
became the role and concern of monetary authorities rather than that of the
market forces. Over the years, the strategy has been that of avoiding current
account problems and currency crises via exchange rate policies.
In Nigeria, for instance, exchange rate policies are implemented by the
Central Bank of Nigeria (CBN) and consistently targeted at avoiding
substantial misalignments as well as achieving a realistic Naira exchange rate
that is capable of addressing the basic problems of the country’s external
sector. The policies implemented over the years have ranged from a fixed
exchange rate regime prior to 1986 to various forms of floating exchange rate
system, following the liberalization of the foreign exchange market in 1986.
The Second-tier Foreign Exchange Market (SFEM) was introduced in
September, 2006 as a market-driven mechanism for foreingn exchange
allocation. Currently, foreign exchange transactions in the country are guided
by the Retail Dutch Auction System (rDAS). This replaced the Wholesale
Dutch Auction System (wDAS), which was introduced on the 20th of
February, 2006.
Historically, many currencies of the world have suffered crashes. These
include the Bretton Woods system collapse of 1971-73, the British pound
crisis of 1976, the European Exchange Rate Mechanism (EERM) mayhem of
1992-93, the Mexican peso crisis of 1994-95 and the Russian rubble crisis of
1998, amongst others. In fact, Hutchison and Noy (2002) noted that more than
51 currency crises episodes occurred in emerging-market economies between
1976 and 2001. The pervasive socio-economic costs of these crises have been
widely documented in countries of diverse economic structures and monetary
policy frameworks. For instance, Hutchison and Noy (2002) found a 5-8 per
cent currency-crises-caused output reduction in emerging market economies
while Bordo et al. (2001) estimated currency crisis cost amounting to 5-10 per
cent of global GDP. There is also evidence that currency crises can result to
banking crises (i.e. the twin crises), especially when the banking sector holds
substantial unhedged foreign liabilities during periods of sharp exchange rate
depreciation (Glick and Hutchison, 2001). In this regards, the balance sheets
of banks are negatively affected as the domestic currency value of their
foreign liabilities become bloated. These historical perspective as well as the
experiences of the 2008-09 financial crisis underscores the pervasiveness as
CBN Journal of Applied Statistics Vol. 6 No. 1(a) (June, 2015) 155
well as the spread of currency crises via contagion and the need for early
warning systems.
To the knowledge of this study, no empirical work has been done to model
currency crises in Nigeria, especially following the 2008/09 global financial
crisis during which the Central Bank was believed to have substantially
intervened in the foreign exchange market in order to avoid large changes in
the Naira exchange rate. This paper seeks to bridge this gap using quarterly
data for the period 1990:Q1 - 2011:Q2. A major innovation of this study is the
disentanglement of the impacts of exchange rate volatility and real exchange
rate misalignment on the probability of currency crisis in the country.
The paper is structured into six sections. Following the introduction is section
two, which presents some stylized facts on exchange rate management in
Nigeria. Section three reviews related empirical literature, with particular
focus on conceptual definitions and measurement methods. The study
methodology is discussed in section four while results are presented in section
five. The final section concludes the paper with some recommendations.
2.0 Stylized Facts on Exchange Rate Policy in Nigeria
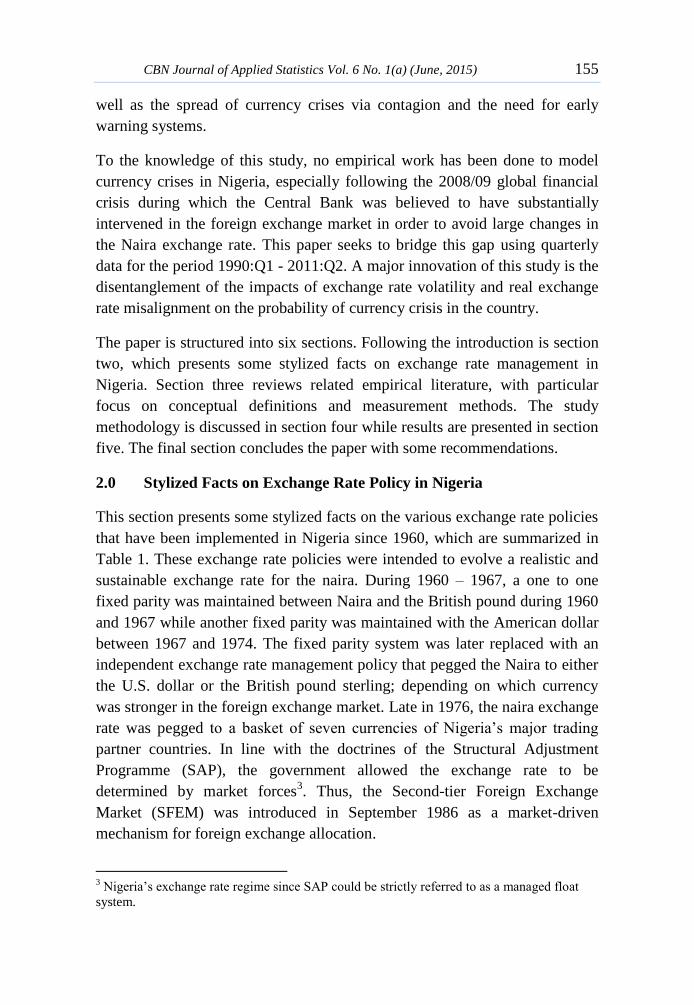
This section presents some stylized facts on the various exchange rate policies
that have been implemented in Nigeria since 1960, which are summarized in
Table 1. These exchange rate policies were intended to evolve a realistic and
sustainable exchange rate for the naira. During 1960 – 1967, a one to one
fixed parity was maintained between Naira and the British pound during 1960
and 1967 while another fixed parity was maintained with the American dollar
between 1967 and 1974. The fixed parity system was later replaced with an
independent exchange rate management policy that pegged the Naira to either
the U.S. dollar or the British pound sterling; depending on which currency
was stronger in the foreign exchange market. Late in 1976, the naira exchange
rate was pegged to a basket of seven currencies of Nigeria’s major trading
partner countries. In line with the doctrines of the Structural Adjustment
Programme (SAP), the government allowed the exchange rate to be
determined by market forces3. Thus, the Second-tier Foreign Exchange
Market (SFEM) was introduced in September 1986 as a market-driven
mechanism for foreign exchange allocation.
3 Nigeria’s exchange rate regime since SAP could be strictly referred to as a managed float
system.
156 Is Real Exchange Rate Misalignment a Leading Indicator
Currency Crises in Nigeria? Omotosho
In July 1987, the first and the second tier markets were merged into an
enlarged foreign exchange market while the exchange rate was determined via
various pricing methods such as marginal, weighted average, and Dutch
Auction System. The average annual official exchange rate, which was about
N2.0 per US dollar in 1986 depreciated rapidly to about N4.3 per US$ during
1987. In a policy reversal, the naira exchange rate was again pegged in 1994.
During this period, the naira exchange rate was pegged at N21.89/US$.
Table 1: Exchange Rate Regimes/Policy in Nigeria, 1960 – 2013
However, an Autonomous Foreign Exchange Market (AFEM) was introduced
in 1995 in an attempt to liberalize the market. Whereas the fixed exchange
rate of N21.9 per dollar was applied to official transactions, the market
determined AFEM rates were used for other transactions. This policy
encouraged round tripping and other sharp practices which led the monetary
authority to abolish the fixed exchange rate system at the official segment of
the market in 1999.
In order to further deepen the market, an Inter-bank Foreign Exchange Market
(IFEM) was introduced in 1999. The system allowed oil companies, hotels
and authorized dealers to buy and sell foreign exchange thereby relieving the
Exchange Rate Regime/Method of Exchange Rate Determination Date Average Exchange Rate
Fixed (Pegged to British pound sterling/US Dollars) 1960 - 1972 0.7085
Managed float 1973 - 1978 0.6354
Basket of currencies approach 1978 0.8938
Dual exchange rate system (Introduction of Second Tier FEM) September 1986 2.0206
Dutch Auction System (DAS) of bidding April 1987 4.0179
Single enlarged Foreign Exhange Market with various pricing methods July 1987 4.2723
Creation of Interbank Foreign Exchange Market (IFEM) January 1989 12.9377
Pegged exchange rate system 1994 21.8861
Autonomous Foreign Exchange Market (AFEM) 1995 21.8861
Reintroduction of IFEM October 1999 108.0000
Retail Dutch Auction System (rDAS) of foreign exchange management July 2002 130.8500
Wholesale Dutch Auction System (wDAS) February 2006 - October, 2013 141.7600
Retail Dutch Auction System (rDAS) of foreign exchange management October 2 - 31, 2013 157.4166
CBN Journal of Applied Statistics Vol. 6 No. 1(a) (June, 2015) 157
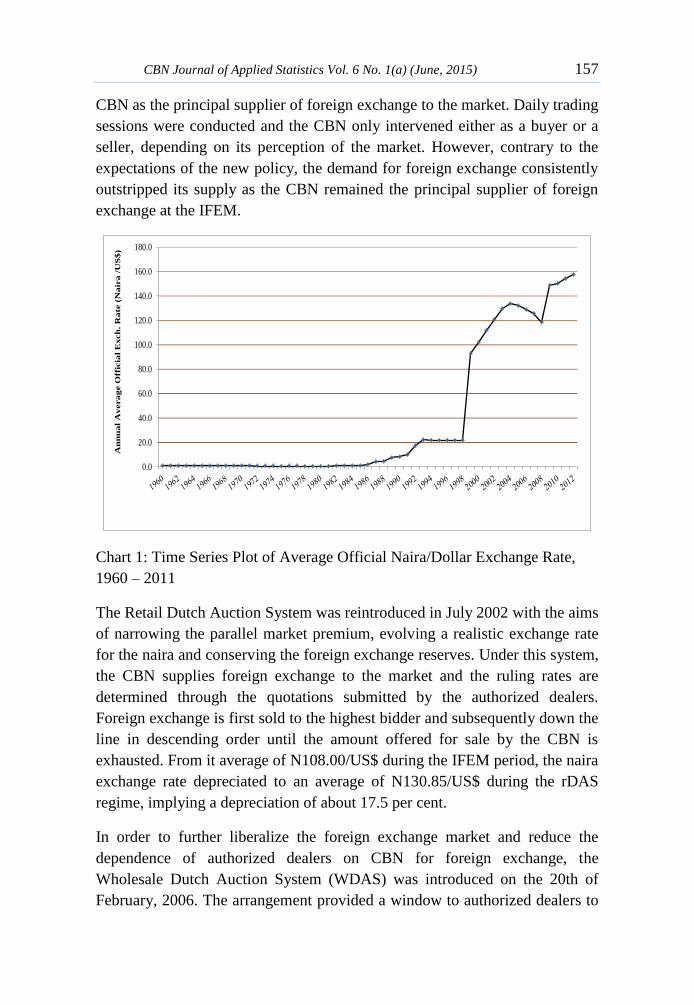
CBN as the principal supplier of foreign exchange to the market. Daily trading
sessions were conducted and the CBN only intervened either as a buyer or a
seller, depending on its perception of the market. However, contrary to the
expectations of the new policy, the demand for foreign exchange consistently
outstripped its supply as the CBN remained the principal supplier of foreign
exchange at the IFEM.
Chart 1: Time Series Plot of Average Official Naira/Dollar Exchange Rate,
1960 – 2011
The Retail Dutch Auction System was reintroduced in July 2002 with the aims
of narrowing the parallel market premium, evolving a realistic exchange rate
for the naira and conserving the foreign exchange reserves. Under this system,
the CBN supplies foreign exchange to the market and the ruling rates are
determined through the quotations submitted by the authorized dealers.
Foreign exchange is first sold to the highest bidder and subsequently down the
line in descending order until the amount offered for sale by the CBN is
exhausted. From it average of N108.00/US$ during the IFEM period, the naira
exchange rate depreciated to an average of N130.85/US$ during the rDAS
regime, implying a depreciation of about 17.5 per cent.
In order to further liberalize the foreign exchange market and reduce the
dependence of authorized dealers on CBN for foreign exchange, the
Wholesale Dutch Auction System (WDAS) was introduced on the 20th of
February, 2006. The arrangement provided a window to authorized dealers to
0.0
20.0
40.0
60.0
80.0
100.0
120.0
140.0
160.0
180.0
An
nu
al
Av
era
ge O
ffic
ial
Exch
. R
ate
(N
air
a /
US
$)
158 Is Real Exchange Rate Misalignment a Leading Indicator
Currency Crises in Nigeria? Omotosho
bid for foreign exchange on their own account as against the practice in
RDAS where they were expected to bid on behalf of their customers. This led
to an appreciation of the exchange rate from its average level of N132.15/US$
in 2005 to N128.65/US$, N125.83/US$ and N118.57/US$ in 2006, 2007 and
2008, respectively (Chart 1). However, the impacts of the global financial
crisis manifested in the rate as there were depreciation pressures on the naira
causing the exchange rate to move from N117.97/US$ at the end of 2007 to
about N149.58/US$ at the end of 2009. The RDAS was reintroduced on
October 2, 2013 as a new framework for exchange rate allocation in the
economy.
3.0 Literature Review
3.1 Real Exchange Rate Misalignment
The exchange rate is an important concept in economics and it connotes the
prices at which currencies trade for each other. Its importance stems from the
fact that it links the general price level within the economy with prices in the
rest of the world while also affecting other prices within the system. To
central banks, exchange rate is a key variable as it could be used as a target, an
instrument or simply an anchor, depending on the monetary policy framework
being operated in the economy Thus, exchange rate is at the core of any
serious economic stabilization programme.
The Real Exchange Rate (RER) refers to inflation adjusted nominal exchange
rate and it is often used as a measure of an economy’s competitiveness.
However, beyond the RER is a the Equilibrium Real Exchange Rate (ERER),
which is an “ideal” real exchange rate that prevails in the absence of price
rigidities, frictions and other short run factors in an economy. A deviation of
the RER from its equilibrium values is often regarded as real exchange rate
misalignment4 (Razin and Collins, 1997). The effects of real exchange rate
misalignments can be damaging on an economy. For instance, RER
overvaluation discourages export production by rendering exports more
expensive and less competitive. It makes imports cheaper thereby increasing
demand for them. The increase in import demand increases the tendency for
external borrowing and balance of payments disequilibrium5, which may
4 This could manifest in form of overvaluation or undervaluation
5 Obadan (1994) supported this view.
CBN Journal of Applied Statistics Vol. 6 No. 1(a) (June, 2015) 159
eventually lead to currency crisis. Furthermore, overvaluation discourages
domestic production as producers are confronted with unfavorable
competition from foreign imports.
In view of these implications, the concept of real exchange rate misalignment
has become a recurrent topic in both international, monetary as well as growth
economics and the literature is replete with its varying influences on
macroeconomic performance. In Nigeria, studies that have been conducted to
investigate the extent and negative consequences of Naira real exchange rate
misalignment include Soludo and Adenikinju (1997), Obaseki (1998), Agu
(2002) and Aliyu (2011). These studies found varying levels of real exchange
rate misalignment. It is important to highlight that Soludo and Adenikinju
(1997) found that exchange rate misalignment affected the country’s
manufacturing investment negatively. Also, Agu (2002) found that real
exchange rate misalignment and its volatility affected trade in Nigeria
negatively during 1970 and 1998. The findings are similar for both country-
specific and cross-country studies conducted in other countries. Table 2
provides a summary of some selected studies on real exchange rate
misalignments that were reviewed.
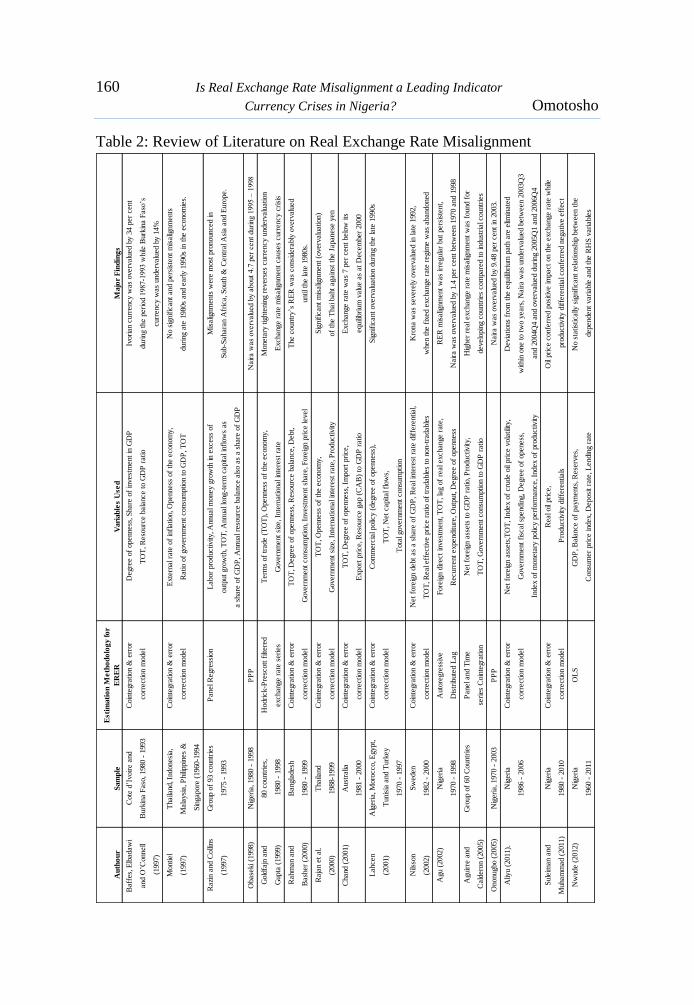
Most of the studies reviewed applied time series analysis (i.e. cointegration
and error correction mechanism) to estimate the equilibrium real exchange
rate while a few others used the Purchasing Power Parity (PPP) and Ordinary
Least Squares (OLS) approaches. The variables included in the real exchange
rate models include degree of openness of the economy, terms of trade,
government expenditure, productivity differential, capital flows, interest rate
differential and gross domestic product, amongst others. The literature is
replete with empirical evidence supporting the fact that different currencies
have suffered varying levels of misalignment, depending on the estimation
technique as well as the exchange rate regime and other macroeconomic
developments prevailing in the economy being investigated. For instance, the
Ivorian currency was found to be misaligned by 34.0 per cent during 1987 –
1993 (Baffes et al., 1997). In Nigeria, studies by Obaseki (1998), Agu (2002),
Ononugbo (2005) found Naira real exchange rate misalignment levels of 4.7
per cent (during 1995 – 1998), 1.4 per cent (during 1970 – 1998) and 9.5 per
cent (in 2003), respectively.
160 Is Real Exchange Rate Misalignment a Leading Indicator
Currency Crises in Nigeria? Omotosho
Table 2: Review of Literature on Real Exchange Rate Misalignment
Au
tho
ur
Sam
ple
Esti
mati
on
Me
tho
do
log
y f
or
ER
ER
Vari
ab
les U
se
dM
ajo
r F
ind
ing
s
Baff
es,
Elb
adaw
i C
ote
d’I
voir
e a
nd
Coin
tegra
tion &
err
or
Degre
e o
f openness
, S
hare
of
invest
ment
in G
DP
Ivori
an c
urr
ency w
as
overv
alu
ed b
y 3
4 p
er
cent
and O
’Connell
Burk
ina F
aso
, 1980 -
1993
corr
ection m
odel
TO
T, R
eso
urc
e b
ala
nce t
o G
DP
ratio
duri
ng t
he p
eri
od 1
987-1
993 w
hile
Burk
ina F
aso
’s
(1997)
curr
ency w
as
underv
alu
ed b
y 1
4%
Montiel
Thaila
nd, In
donesi
a,
Coin
tegra
tion &
err
or
Exte
rnal ra
te o
f in
flation, O
penness
of
the e
conom
y,
No s
ignif
icant
and p
ers
iste
nt
mis
alig
nm
ents
(1997)
Mala
ysi
a, P
hili
ppin
es
& c
orr
ection m
odel
Ratio o
f govern
ment
consu
mption t
o G
DP
, T
OT
duri
ng a
te 1
980s
and e
arl
y 1
990s
in t
he e
conom
ies.
Sin
gapore
(1960-1
994
Razi
n a
nd C
olli
ns
Gro
up o
f 93 c
ountr
ies
Panel R
egre
ssio
nL
abor
pro
ductivity, A
nnual m
oney g
row
th in e
xcess
of
Mis
alig
nm
ents
were
most
pro
nounced in
(1997)
1975 -
1993
outp
ut
gro
wth
, T
OT
, A
nnual lo
ng-t
erm
capital in
flow
s as
Sub-S
ahara
n A
fric
a, S
outh
& C
entr
al A
sia a
nd E
uro
pe.
a s
hare
of
GD
P, A
nnual re
sourc
e b
ala
nce a
lso a
s a s
hare
of
GD
P
Obase
ki (1
998)
Nig
eri
a, 1980 -
1998
PP
P
Nair
a w
as
overv
alu
ed b
y a
bout
4.7
per
cent
duri
ng 1
995 –
1998
Gold
fajn
and
80 c
ountr
ies,
H
odri
ck-P
resc
ott
filt
ere
d
Term
s of
trade (
TO
T),
Openness
of
the e
conom
y,
Moneta
ry t
ighte
nin
g r
evers
es
curr
ency u
nderv
alu
ation
Gupta
(1999)
1980 -
1998
exchange r
ate
seri
es
Govern
ment
size
, In
tern
ational in
tere
st r
ate
Exchange r
ate
mis
alig
nm
ent
cause
s curr
ency c
risi
s
Rahm
an a
nd
Bangla
desh
C
oin
tegra
tion &
err
or
TO
T, D
egre
e o
f openness
, R
eso
urc
e b
ala
nce, D
ebt,
The c
ountr
y’s
RE
R w
as
consi
dera
bly
overv
alu
ed
Bash
er
(2000)
1980 -
1999
corr
ection m
odel
Govern
ment
consu
mption, In
vest
ment
share
, F
ore
ign p
rice level
until th
e late
1980s.
Raja
n e
t al.
Thaila
nd
Coin
tegra
tion &
err
or
TO
T, O
penness
of
the e
conom
y,
Sig
nif
icant
mis
alig
nm
ent
(overv
alu
ation)
(2000)
1988-1
999
corr
ection m
odel
Govern
ment
size
, In
tern
ational in
tere
st r
ate
, P
roductivity
of
the T
hai baht
again
st t
he J
apanese
yen
Chand (
2001)
Aust
ralia
Coin
tegra
tion &
err
or
TO
T, D
egre
e o
f openness
, Im
port
pri
ce,
Exchange r
ate
was
7 p
er
cent
belo
w its
1981 -
2000
corr
ection m
odel
Export
pri
ce, R
eso
urc
e g
ap (
CA
B)
to G
DP
ratio
equili
bri
um
valu
e a
s at
Decem
ber
2000
Lahcen
Alg
eri
a, M
oro
cco, E
gypt,
Coin
tegra
tion &
err
or
Com
merc
ial polic
y (
degre
e o
f openness
),S
ignif
icant
overv
alu
ation d
uri
ng t
he late
1990s
(2001)
Tunis
ia a
nd T
urk
ey
corr
ection m
odel
TO
T, N
et
capital fl
ow
s,
1970 -
1997
Tota
l govern
ment
consu
mption
Nils
son
Sw
eden
Coin
tegra
tion &
err
or
Net
fore
ign d
ebt
as
a s
hare
of
GD
P, R
eal in
tere
st r
ate
dif
fere
ntial,
Kro
na w
as
severe
ly o
verv
alu
ed in late
1992,
(2002)
1982 -
2000
corr
ection m
odel
TO
T, R
eal eff
ective p
rice r
atio o
f tr
adable
s to
non-t
radable
sw
hen t
he f
ixed e
xchange r
ate
regim
e w
as
abandoned
Agu (
2002)
Nig
eri
a
Auto
regre
ssiv
e
Fore
ign d
irect
invest
ment, T
OT
, la
g o
f re
al exchange r
ate
, R
ER
mis
alig
nm
ent
was
irre
gula
r but
pers
iste
nt,
1970 -
1998
Dis
trib
ute
d L
ag
Recurr
ent
expenditure
, O
utp
ut, D
egre
e o
f openness
Nair
a w
as
overv
alu
ed b
y 1
.4 p
er
cent
betw
een 1
970 a
nd 1
998
Aguir
re a
nd
Gro
up o
f 60 C
ountr
ies
Panel and T
ime
Net
fore
ign a
ssets
to G
DP
ratio, P
roductivity,
Hig
her
real exchange r
ate
mis
alig
nm
ent
was
found f
or
Cald
ero
n (
2005)
seri
es
Coin
tegra
tion
TO
T, G
overn
ment
consu
mption t
o G
DP
ratio
develo
pin
g c
ountr
ies
com
pare
d t
o indust
rial countr
ies
Ononugbo (
2005)
Nig
eri
a, 1970 -
2003
PP
P
Nair
a w
as
overv
alu
ed b
y 9
.48 p
er
cent
in 2
003.
Aliy
u (
2011).
N
igeri
a
Coin
tegra
tion &
err
or
Net
fore
ign a
ssets
,TO
T, In
dex o
f cru
de o
il pri
ce v
ola
tilit
y,
Devia
tions
from
the e
quili
bri
um
path
are
elim
inate
d
1986 -
2006
corr
ection m
odel
Govern
ment
fisc
al sp
endin
g, D
egre
e o
f openess
,w
ithin
one t
o t
wo y
ears
, N
air
a w
as
underv
alu
ed b
etw
een 2
003Q
3
Index o
f m
oneta
ry p
olic
y p
erf
orm
ance, In
dex o
f pro
ductivity
and 2
004Q
4 a
nd o
verv
alu
ed d
uri
ng 2
005Q
1 a
nd 2
006Q
4
Sule
iman a
nd
Nig
eri
a
Coin
tegra
tion &
err
or
Real oil
pri
ce,
Oil
pri
ce c
onfe
rred p
osi
tive im
pact
on t
he e
xchange r
ate
while
Muham
mad (
2011)
1980 -
2010
corr
ection m
odel
Pro
ductivity d
iffe
rentials
pro
ductivity d
iffe
rential confe
rred n
egative e
ffect
Nw
ude (
2012)
Nig
eri
a
OL
SG
DP
, B
ala
nce o
f paym
ents
, R
ese
rves,
N
o s
tatist
ically
sig
nif
icant
rela
tionsh
ip b
etw
een t
he
1960 -
2011
Consu
mer
pri
ce index, D
eposi
t ra
te, L
endin
g r
ate
dependent
vari
able
and t
he R
HS
vari
able
s
CBN Journal of Applied Statistics Vol. 5 No. 2(b) (December, 2014) 161
3.2 Measurement of Currency Crises
The first step in the measurement of currency crisis relates to crisis definition.
A narrow definition includes successful attack on the currency that results in a
substantial depreciation of the exchange rate. Based on this definition, studies
such as Frankel and Rose (1996) define currency crisis as a nominal
depreciation of 25 per cent or greater, which is at least 10 per cent greater than
the depreciation in the preceding year. Raising the threshold a little, Leaven
and Fabian (2008) define a currency crisis as a nominal depreciation of the
currency of at least 30 per cent that is also at least 10 per cent increase in the
rate of depreciation compared to the year before.
In a broader sense, currency crisis is defined as a speculative attack on a
country’s currency that can result in a sharp depreciation or the need for the
government to intervene in the market by selling foreign exchange reserves.
This definition includes episodes of unsuccessful attacks as captured by large
changes in the index of Exchange Market Pressure (EMP), defined as a
weighted average of exchange rate changes and reserve losses. The weights
attached to the exchange rate and reserves component of the currency pressure
index are inversely related to the variance of changes of each component over
the sample. The intuition behind the EMP is that if there is an attack on the
currency, either the exchange rate would depreciate or the central bank would
sell foreign currency to support the exchange rate.
Changes in the EMP above some threshold are deemed to represent crisis,
defined as zeros and ones binary variable (one for crisis periods and zero for
tranquil periods). For instance, Eichengreen, et al (1995) used a threshold of
one and a half standard deviation above the mean EMP, Glick and Hutchison
(2005) used a 2 standard deviation threshold, while Kaminsky and Reinhart
(1999) used a three standard deviation cutoff.
3.3 Currency Crises Prediction
In the literature, two popular methodologies have been extensively used in the
construction of early warning systems for currency crisis; namely, signaling
approach (which is non-parametric approach) and the probit/logit model
(which is a parametric approach to the anticipation of a currency crisis). The
signaling approach was introduced by Kaminsky et al. (1998), and further
developed by Edison (2003). Kaminsky et al. (1998) monitored the evolution
of several indicators with a view to assessing their relevance, individually in
162 Is Real Exchange Rate Misalignment a Leading Indicator
Currency Crises in Nigeria? Omotosho
predicting currency crisis. Thus, if any of the macro-financial variables of a
specific country tends to exceed a given threshold during the period preceding
a crisis; it is interpreted as a warning signal indicating that a currency crisis in
that specific country may take place soon. In this approach, the researcher
adjusts the threshold in order to maintain a balance between type I errors (i.e.
that the model fails to predict crises when they actually take place) and type II
4.0 Methodology and Data
4.1 Model of Equilibrium Real Exchange Rate and its Misalignment
The study adopted the behavioral equilibrium exchange rate approach to
estimate Naira equilibrium value. This approach was enunciated by
MacDonald (1997) and has been used by authors such as Aliyu (2011) and
Omotosho and Wambai (2012) to model equilibrium real exchange rate and
its misalignment in Nigeria. We made use of nine economic variables to
capture both transitory and structural movements in naira real exchange rate.
These include total government expenditure (TGE), productivity (PRO),
nominal exchange rate (NER), interest rate differential between Nigeria and
the United States of America (IRD), capital inflow (FDI), degree of openness
(DOO), oil price (OIL), reserves to GDP ratio (RES) and total inward
remittance (REM). These variables are selected based on their theoretical,
empirical and situational relevance. The functional form of the Naira
equilibrium real exchange rate model as well as the expected signs of the
regressors (in parenthesis) is specified as
𝑳𝑹𝑬𝑹𝒕 = 𝜶𝟎 + ∑ 𝜷𝒓 𝑿𝒓,𝒕
𝟗
𝒓=𝟏
+ 𝜺𝒕 (1)
Where X is a vector of nine independent variables, namely: LTGE (log of
total government expenditure), LPRO (log of productivity differential), LNER
(log of nominal exchange rate), IRD (interest rate differential), LFDI (log of
capital inflow - proxied by the sum of foreign direct and portfolio
investments), LDOO (log of degree of openness), LOIL (log of oil price),
LRES (log of reserves to GDP ratio), LREM (log of inward remittance), and t
CBN Journal of Applied Statistics Vol. 5 No. 2(b) (December, 2014) 163
is the random error. In order to estimate equation (1)6, the theory of
cointegration and error correction model is applied.
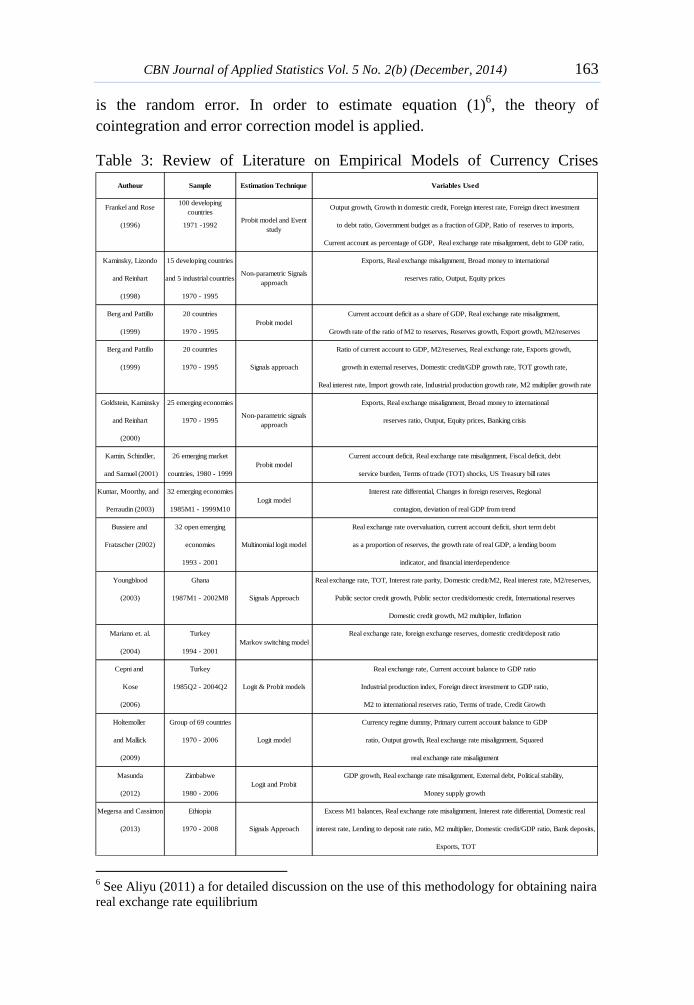
Table 3: Review of Literature on Empirical Models of Currency Crises
6 See Aliyu (2011) a for detailed discussion on the use of this methodology for obtaining naira
real exchange rate equilibrium
Authour Sample Estimation Technique Variables Used
Frankel and Rose100 developing
countriesOutput growth, Growth in domestic credit, Foreign interest rate, Foreign direct investment
(1996) 1971 -1992 to debt ratio, Government budget as a fraction of GDP, Ratio of reserves to imports,
Current account as percentage of GDP, Real exchange rate misalignment, debt to GDP ratio,
Kaminsky, Lizondo 15 developing countries Exports, Real exchange misalignment, Broad money to international
and Reinhart and 5 industrial countries reserves ratio, Output, Equity prices
(1998) 1970 - 1995
Berg and Pattillo 20 countries Current account deficit as a share of GDP, Real exchange rate misalignment,
(1999) 1970 - 1995 Growth rate of the ratio of M2 to reserves, Reserves growth, Export growth, M2/reserves
Berg and Pattillo 20 countries Ratio of current account to GDP, M2/reserves, Real exchange rate, Exports growth,
(1999) 1970 - 1995 growth in external reserves, Domestic credit/GDP growth rate, TOT growth rate,
Real interest rate, Import growth rate, Industrial production growth rate, M2 multiplier growth rate
Goldstein, Kaminsky 25 emerging economies Exports, Real exchange misalignment, Broad money to international
and Reinhart 1970 - 1995 reserves ratio, Output, Equity prices, Banking crisis
(2000)
Kamin, Schindler, 26 emerging market Current account deficit, Real exchange rate misalignment, Fiscal deficit, debt
and Samuel (2001) countries, 1980 - 1999 service burden, Terms of trade (TOT) shocks, US Treasury bill rates
Kumar, Moorthy, and 32 emerging economies Interest rate differential, Changes in foreign reserves, Regional
Perraudin (2003) 1985M1 - 1999M10 contagion, deviation of real GDP from trend
Bussiere and 32 open emerging Real exchange rate overvaluation, current account deficit, short term debt
Fratzscher (2002) economies as a proportion of reserves, the growth rate of real GDP, a lending boom
1993 - 2001 indicator, and financial interdependence
Youngblood Ghana Real exchange rate, TOT, Interest rate parity, Domestic credit/M2, Real interest rate, M2/reserves,
(2003) 1987M1 - 2002M8 Public sector credit growth, Public sector credit/domestic credit, International reserves
Domestic credit growth, M2 multiplier, Inflation
Mariano et. al. Turkey Real exchange rate, foreign exchange reserves, domestic credit/deposit ratio
(2004) 1994 - 2001
Cepni and Turkey Real exchange rate, Current account balance to GDP ratio
Kose 1985Q2 - 2004Q2 Industrial production index, Foreign direct investment to GDP ratio,
(2006) M2 to international reserves ratio, Terms of trade, Credit Growth
Holtemoller Group of 69 countries Currency regime dummy, Primary current account balance to GDP
and Mallick 1970 - 2006 ratio, Output growth, Real exchange rate misalignment, Squared
(2009) real exchange rate misalignment
Masunda Zimbabwe GDP growth, Real exchange rate misalignment, External debt, Political stability,
(2012) 1980 - 2006 Money supply growth
Megersa and Cassimon Ethiopia Excess M1 balances, Real exchange rate misalignment, Interest rate differential, Domestic real
(2013) 1970 - 2008 interest rate, Lending to deposit rate ratio, M2 multiplier, Domestic credit/GDP ratio, Bank deposits,
Exports, TOT
Signals Approach
Probit model and Event
study
Non-parametric Signals
approach
Signals approach
Non-parametric signals
approach
Multinomial logit model
Logit & Probit models
Logit model
Signals Approach
Probit model
Probit model
Markov switching model
Logit and Probit
Logit model
164 Is Real Exchange Rate Misalignment a Leading Indicator
Currency Crises in Nigeria? Omotosho
Firstly, we conduct stationarity test in order to ascertain their correct order of
integration of the variables and avoid the spurious regression problem. In this
regard, the ADF unit root test is employed. In the second step, the Engle &
Granger (1987) residual based cointegration approach is used to test for
cointegration amongst the variables included in equation (1). This is to ensure
that the linear combinations of the variables in equation (1) exhibit stable
properties in the long run. The third step involves estimating the Naira RER
error correction model, which is of the form:
∆𝐿𝑅𝐸𝑅𝑡 = 𝛼0 + ∑ ∑ 𝛽𝑟,𝑖 ∆𝑋𝑟,𝑡−𝑖
𝑠
𝑖=0
9
𝑟=1
+ ∑ 𝛾𝑗 ∆𝐿𝑅𝐸𝑅𝑡−𝑗
𝑞
𝑗=1
+ 𝜌𝜀𝑡−1 + 𝜇𝑡
where denotes the first difference operator, Ɛt is the estimated residual from
equation (1), s and q are the number of lag lengths, LRERt is the dependent
variable while Xt is the vector of exogenous variables listed in equation (1). If
the system is stable, the coefficient will be negative and statistically
significant. Moreover, the value of measures the speed of adjustment of the
dependent variable to the value implied by the long run equilibrium
relationship. The fourth stage involves the computation of the equilibrium real
exchange rate based on sustainable values7 of the exogenous variables. In the
final stage, the percentage difference between the estimated equilibrium real
exchange rates (e*) and the observed real exchange rate (e) is calculated in a
time series perspective and regarded as the extent of misalignment. Thus, if:
𝑒∗ − 𝑒 > 0, 𝑡ℎ𝑒 𝑅𝐸𝑅 𝑖𝑠 𝑜𝑣𝑒𝑟𝑣𝑎𝑙𝑢𝑒𝑑 (3)
𝑒∗ − 𝑒 < 0, 𝑡ℎ𝑒 𝑅𝐸𝑅 𝑖𝑠 𝑢𝑛𝑑𝑒𝑟𝑣𝑎𝑙𝑢𝑒𝑑 (4)
𝑒∗ − 𝑒 = 0, 𝑡ℎ𝑒 𝑅𝐸𝑅 𝑠𝑢𝑓𝑓𝑒𝑟𝑠 𝑛𝑜 𝑚𝑖𝑠𝑎𝑙𝑖𝑔𝑛𝑚𝑒𝑛𝑡 (5)
4.2 Measurement of Currency Crisis
In this paper, the broader definition of currency crises is employed as it
provides a more comprehensive perspective than the narrow definition by
capturing both successful and unsuccessful attacks on the currency. Thus, we
adopt the definition based on the concept of ’exchange market pressure’
developed by Girton and Roper (1977). This way of defining crises has an
7 The Hodrick Prescott filter is used to derive sustainable values of the fundamentals.
CBN Journal of Applied Statistics Vol. 5 No. 2(b) (December, 2014) 165
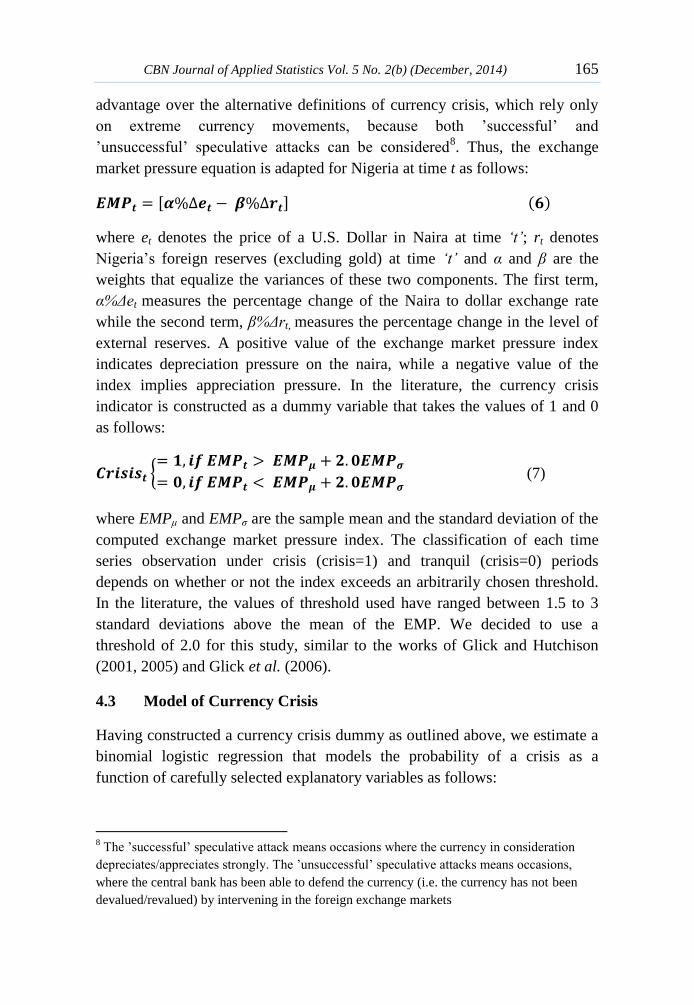
advantage over the alternative definitions of currency crisis, which rely only
on extreme currency movements, because both ’successful’ and
’unsuccessful’ speculative attacks can be considered8. Thus, the exchange
market pressure equation is adapted for Nigeria at time t as follows:
𝑬𝑴𝑷𝒕 = [𝜶%∆𝒆𝒕 − 𝜷%∆𝒓𝒕] (𝟔)
where et denotes the price of a U.S. Dollar in Naira at time ‘t’; rt denotes
Nigeria’s foreign reserves (excluding gold) at time ‘t’ and α and β are the
weights that equalize the variances of these two components. The first term,
α%Δet measures the percentage change of the Naira to dollar exchange rate
while the second term, β%Δrt, measures the percentage change in the level of
external reserves. A positive value of the exchange market pressure index
indicates depreciation pressure on the naira, while a negative value of the
index implies appreciation pressure. In the literature, the currency crisis
indicator is constructed as a dummy variable that takes the values of 1 and 0
as follows:
𝑪𝒓𝒊𝒔𝒊𝒔𝒕 {= 𝟏, 𝒊𝒇 𝑬𝑴𝑷𝒕 > 𝑬𝑴𝑷𝝁 + 𝟐. 𝟎𝑬𝑴𝑷𝝈
= 𝟎, 𝒊𝒇 𝑬𝑴𝑷𝒕 < 𝑬𝑴𝑷𝝁 + 𝟐. 𝟎𝑬𝑴𝑷𝝈 (7)
where EMPμ and EMPσ are the sample mean and the standard deviation of the
computed exchange market pressure index. The classification of each time
series observation under crisis (crisis=1) and tranquil (crisis=0) periods
depends on whether or not the index exceeds an arbitrarily chosen threshold.
In the literature, the values of threshold used have ranged between 1.5 to 3
standard deviations above the mean of the EMP. We decided to use a
threshold of 2.0 for this study, similar to the works of Glick and Hutchison
(2001, 2005) and Glick et al. (2006).
4.3 Model of Currency Crisis
Having constructed a currency crisis dummy as outlined above, we estimate a
binomial logistic regression that models the probability of a crisis as a
function of carefully selected explanatory variables as follows:
8 The ’successful’ speculative attack means occasions where the currency in consideration
depreciates/appreciates strongly. The ’unsuccessful’ speculative attacks means occasions,
where the central bank has been able to defend the currency (i.e. the currency has not been
devalued/revalued) by intervening in the foreign exchange markets

166 Is Real Exchange Rate Misalignment a Leading Indicator
Currency Crises in Nigeria? Omotosho
𝑃𝑡 =1
1 + 𝑒−(𝛽1+𝛽2𝑥1+⋯+𝛽𝑘𝑥𝑘+𝜇𝑡) (8)
Where Pt is the probability that there is currency crisis (i.e. 𝐶𝑟𝑖𝑠𝑖𝑠𝑡 = 1). The
probability of currency crisis is related to a set of explanatory variables x1,
x2,…,xk. 𝛽1 is the constant term while 𝛽2, 𝛽3, … , 𝛽𝑘 are the coefficients of the
explanatory variables. The included input variables are: government
expenditure as a ratio of Gross Domestic Product (Government Size), Output
Gap, high inflation dummy, Ratio of broad money to external reserves
(M2/Reserves), debt/GDP ratio, oil price growth, current account
balance/GDP ratio (CAB/GDP), foreign private investment gap (FPIGap),
exports growth, real exchange rate, real exchange rate volatility, and real
exchange rate misalignment. Data on real exchange rate misalignment was
based on computed deviations of the actual real exchange rate from its long
run equilibrium path described in section 4.1. Also, data on exchange rate
volatility was obtained from variance series derived based on an estimated
Generalized Autoregressive Conditional Heteroscedasticity (GARCH) model
of the naira-dollar real exchange rate.
The choice of the independent variables was based on theoretical models of
currency crisis, which aim to capture both domestic and external conditions of
the economy. In addition, all used variables have been found to be related to
currency crises in the empirical literature reviewed in section 3. For instance,
the simple monetary model of exchange rate determination, predicts that
money growth in excess of the anchor currency’s money growth will cause
higher inflation that creates pressure for depreciation of the home currency. If
the home country successively resists depreciation for a time, the ultimate fall
in the exchange rate may occur as a large discrete movement in the form of a
currency crisis. Also, higher foreign reserve holdings imply greater ability to
respond to speculative depreciation attacks. The ratio of M2 to reserves
captures the extent to which the liabilities of the banking system are backed
by international reserves. In the event of a currency crisis, bank depositors
may rush to convert their domestic currency assets into foreign currency, so
that this ratio captures the ability of the central bank to meet those demands
and stabilize the currency. It is also documented in literature that relatively
large exchange rate misalignment is associated with increased likelihood of a
currency crisis because of the negative effects on competitiveness (Frankel
and Rose, 1996 and Berg and Pattillo, 1999).
CBN Journal of Applied Statistics Vol. 5 No. 2(b) (December, 2014) 167
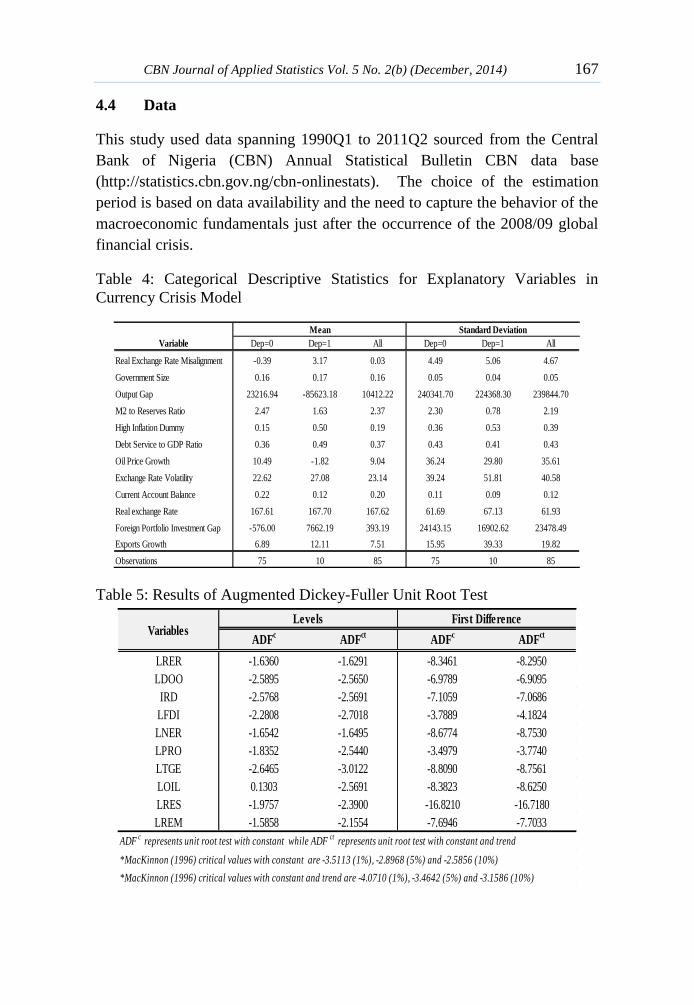
4.4 Data
This study used data spanning 1990Q1 to 2011Q2 sourced from the Central
Bank of Nigeria (CBN) Annual Statistical Bulletin CBN data base
(http://statistics.cbn.gov.ng/cbn-onlinestats). The choice of the estimation
period is based on data availability and the need to capture the behavior of the
macroeconomic fundamentals just after the occurrence of the 2008/09 global
financial crisis.
Table 4: Categorical Descriptive Statistics for Explanatory Variables in
Currency Crisis Model
Table 5: Results of Augmented Dickey-Fuller Unit Root Test
Variable Dep=0 Dep=1 All Dep=0 Dep=1 All
Real Exchange Rate Misalignment -0.39 3.17 0.03 4.49 5.06 4.67
Government Size 0.16 0.17 0.16 0.05 0.04 0.05
Output Gap 23216.94 -85623.18 10412.22 240341.70 224368.30 239844.70
M2 to Reserves Ratio 2.47 1.63 2.37 2.30 0.78 2.19
High Inflation Dummy 0.15 0.50 0.19 0.36 0.53 0.39
Debt Service to GDP Ratio 0.36 0.49 0.37 0.43 0.41 0.43
Oil Price Growth 10.49 -1.82 9.04 36.24 29.80 35.61
Exchange Rate Volatility 22.62 27.08 23.14 39.24 51.81 40.58
Current Account Balance 0.22 0.12 0.20 0.11 0.09 0.12
Real exchange Rate 167.61 167.70 167.62 61.69 67.13 61.93
Foreign Portfolio Investment Gap -576.00 7662.19 393.19 24143.15 16902.62 23478.49
Exports Growth 6.89 12.11 7.51 15.95 39.33 19.82
Observations 75 10 85 75 10 85
Mean Standard Deviation
ADFc
ADFct
ADFc
ADFct
LRER -1.6360 -1.6291 -8.3461 -8.2950
LDOO -2.5895 -2.5650 -6.9789 -6.9095
IRD -2.5768 -2.5691 -7.1059 -7.0686
LFDI -2.2808 -2.7018 -3.7889 -4.1824
LNER -1.6542 -1.6495 -8.6774 -8.7530
LPRO -1.8352 -2.5440 -3.4979 -3.7740
LTGE -2.6465 -3.0122 -8.8090 -8.7561
LOIL 0.1303 -2.5691 -8.3823 -8.6250
LRES -1.9757 -2.3900 -16.8210 -16.7180
LREM -1.5858 -2.1554 -7.6946 -7.7033
ADFc represents unit root test with constant while ADF
ct represents unit root test with constant and trend
*MacKinnon (1996) critical values with constant are -3.5113 (1%), -2.8968 (5%) and -2.5856 (10%)
*MacKinnon (1996) critical values with constant and trend are -4.0710 (1%), -3.4642 (5%) and -3.1586 (10%)
VariablesLevels First Difference
168 Is Real Exchange Rate Misalignment a Leading Indicator
Currency Crises in Nigeria? Omotosho
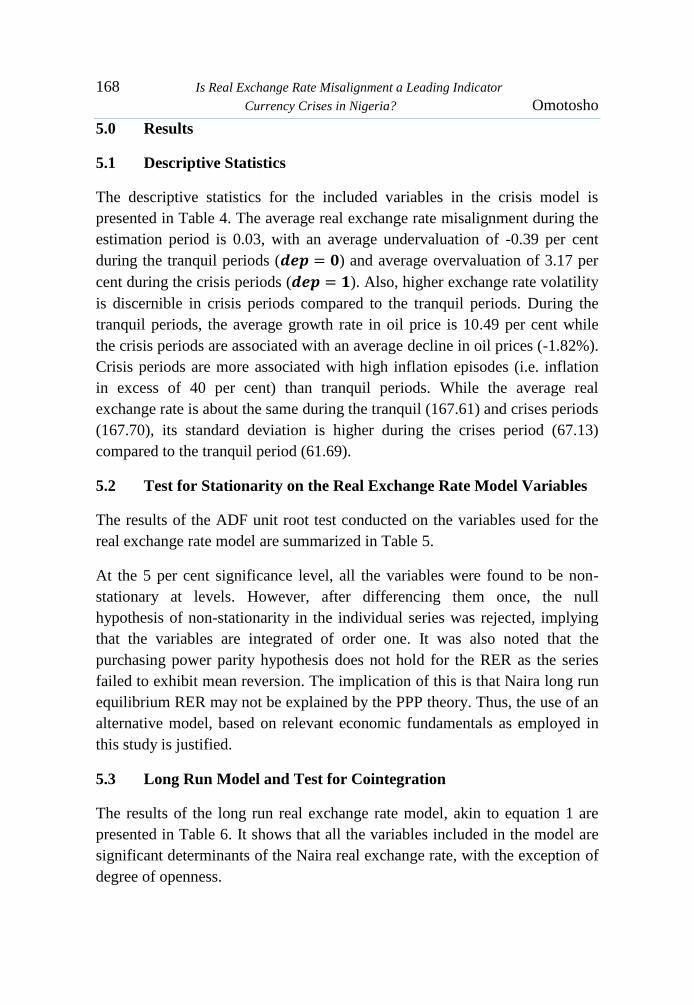
5.0 Results
5.1 Descriptive Statistics
The descriptive statistics for the included variables in the crisis model is
presented in Table 4. The average real exchange rate misalignment during the
estimation period is 0.03, with an average undervaluation of -0.39 per cent
during the tranquil periods (𝒅𝒆𝒑 = 𝟎) and average overvaluation of 3.17 per
cent during the crisis periods (𝒅𝒆𝒑 = 𝟏). Also, higher exchange rate volatility
is discernible in crisis periods compared to the tranquil periods. During the
tranquil periods, the average growth rate in oil price is 10.49 per cent while
the crisis periods are associated with an average decline in oil prices (-1.82%).
Crisis periods are more associated with high inflation episodes (i.e. inflation
in excess of 40 per cent) than tranquil periods. While the average real
exchange rate is about the same during the tranquil (167.61) and crises periods
(167.70), its standard deviation is higher during the crises period (67.13)
compared to the tranquil period (61.69).
5.2 Test for Stationarity on the Real Exchange Rate Model Variables
The results of the ADF unit root test conducted on the variables used for the
real exchange rate model are summarized in Table 5.
At the 5 per cent significance level, all the variables were found to be non-
stationary at levels. However, after differencing them once, the null
hypothesis of non-stationarity in the individual series was rejected, implying
that the variables are integrated of order one. It was also noted that the
purchasing power parity hypothesis does not hold for the RER as the series
failed to exhibit mean reversion. The implication of this is that Naira long run
equilibrium RER may not be explained by the PPP theory. Thus, the use of an
alternative model, based on relevant economic fundamentals as employed in
this study is justified.
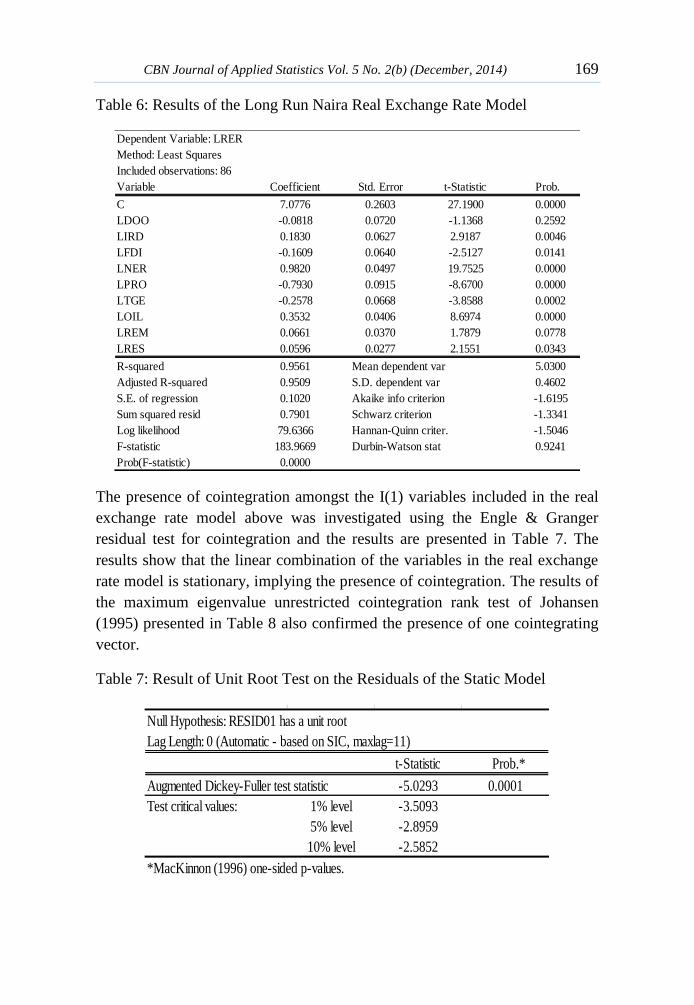
5.3 Long Run Model and Test for Cointegration
The results of the long run real exchange rate model, akin to equation 1 are
presented in Table 6. It shows that all the variables included in the model are
significant determinants of the Naira real exchange rate, with the exception of
degree of openness.
CBN Journal of Applied Statistics Vol. 5 No. 2(b) (December, 2014) 169
Table 6: Results of the Long Run Naira Real Exchange Rate Model
The presence of cointegration amongst the I(1) variables included in the real
exchange rate model above was investigated using the Engle & Granger
residual test for cointegration and the results are presented in Table 7. The
results show that the linear combination of the variables in the real exchange
rate model is stationary, implying the presence of cointegration. The results of
the maximum eigenvalue unrestricted cointegration rank test of Johansen
(1995) presented in Table 8 also confirmed the presence of one cointegrating
vector.
Table 7: Result of Unit Root Test on the Residuals of the Static Model
Dependent Variable: LRER
Method: Least Squares
Included observations: 86
Variable Coefficient Std. Error t-Statistic Prob.
C 7.0776 0.2603 27.1900 0.0000
LDOO -0.0818 0.0720 -1.1368 0.2592
LIRD 0.1830 0.0627 2.9187 0.0046
LFDI -0.1609 0.0640 -2.5127 0.0141
LNER 0.9820 0.0497 19.7525 0.0000
LPRO -0.7930 0.0915 -8.6700 0.0000
LTGE -0.2578 0.0668 -3.8588 0.0002
LOIL 0.3532 0.0406 8.6974 0.0000
LREM 0.0661 0.0370 1.7879 0.0778
LRES 0.0596 0.0277 2.1551 0.0343
R-squared 0.9561 Mean dependent var 5.0300
Adjusted R-squared 0.9509 S.D. dependent var 0.4602
S.E. of regression 0.1020 Akaike info criterion -1.6195
Sum squared resid 0.7901 Schwarz criterion -1.3341
Log likelihood 79.6366 Hannan-Quinn criter. -1.5046
F-statistic 183.9669 Durbin-Watson stat 0.9241
Prob(F-statistic) 0.0000
Null Hypothesis: RESID01 has a unit root
Lag Length: 0 (Automatic - based on SIC, maxlag=11)
t-Statistic Prob.*
Augmented Dickey-Fuller test statistic -5.0293 0.0001
Test critical values: 1% level -3.5093
5% level -2.8959
10% level -2.5852
*MacKinnon (1996) one-sided p-values.
170 Is Real Exchange Rate Misalignment a Leading Indicator
Currency Crises in Nigeria? Omotosho
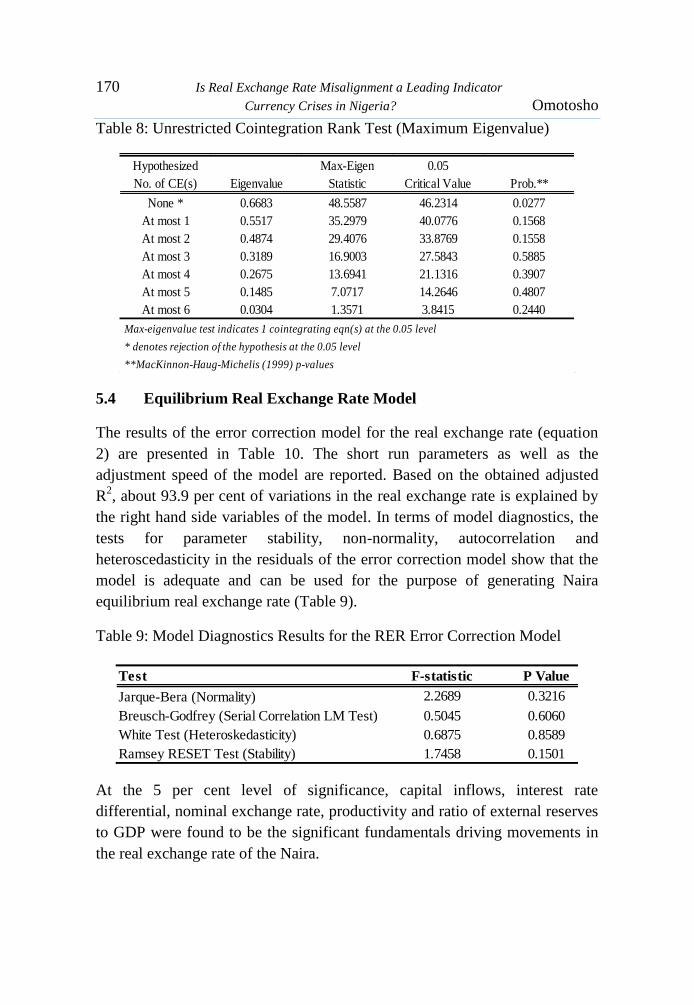
Table 8: Unrestricted Cointegration Rank Test (Maximum Eigenvalue)
5.4 Equilibrium Real Exchange Rate Model
The results of the error correction model for the real exchange rate (equation
2) are presented in Table 10. The short run parameters as well as the
adjustment speed of the model are reported. Based on the obtained adjusted
R2, about 93.9 per cent of variations in the real exchange rate is explained by
the right hand side variables of the model. In terms of model diagnostics, the
tests for parameter stability, non-normality, autocorrelation and
heteroscedasticity in the residuals of the error correction model show that the
model is adequate and can be used for the purpose of generating Naira
equilibrium real exchange rate (Table 9).
Table 9: Model Diagnostics Results for the RER Error Correction Model
At the 5 per cent level of significance, capital inflows, interest rate
differential, nominal exchange rate, productivity and ratio of external reserves
to GDP were found to be the significant fundamentals driving movements in
the real exchange rate of the Naira.
Hypothesized Max-Eigen 0.05
No. of CE(s) Eigenvalue Statistic Critical Value Prob.**
None * 0.6683 48.5587 46.2314 0.0277
At most 1 0.5517 35.2979 40.0776 0.1568
At most 2 0.4874 29.4076 33.8769 0.1558
At most 3 0.3189 16.9003 27.5843 0.5885
At most 4 0.2675 13.6941 21.1316 0.3907
At most 5 0.1485 7.0717 14.2646 0.4807
At most 6 0.0304 1.3571 3.8415 0.2440
Max-eigenvalue test indicates 1 cointegrating eqn(s) at the 0.05 level
* denotes rejection of the hypothesis at the 0.05 level
**MacKinnon-Haug-Michelis (1999) p-values
Test F-statistic P Value
Jarque-Bera (Normality) 2.2689 0.3216
Breusch-Godfrey (Serial Correlation LM Test) 0.5045 0.6060
White Test (Heteroskedasticity) 0.6875 0.8589
Ramsey RESET Test (Stability) 1.7458 0.1501
CBN Journal of Applied Statistics Vol. 5 No. 2(b) (December, 2014) 171
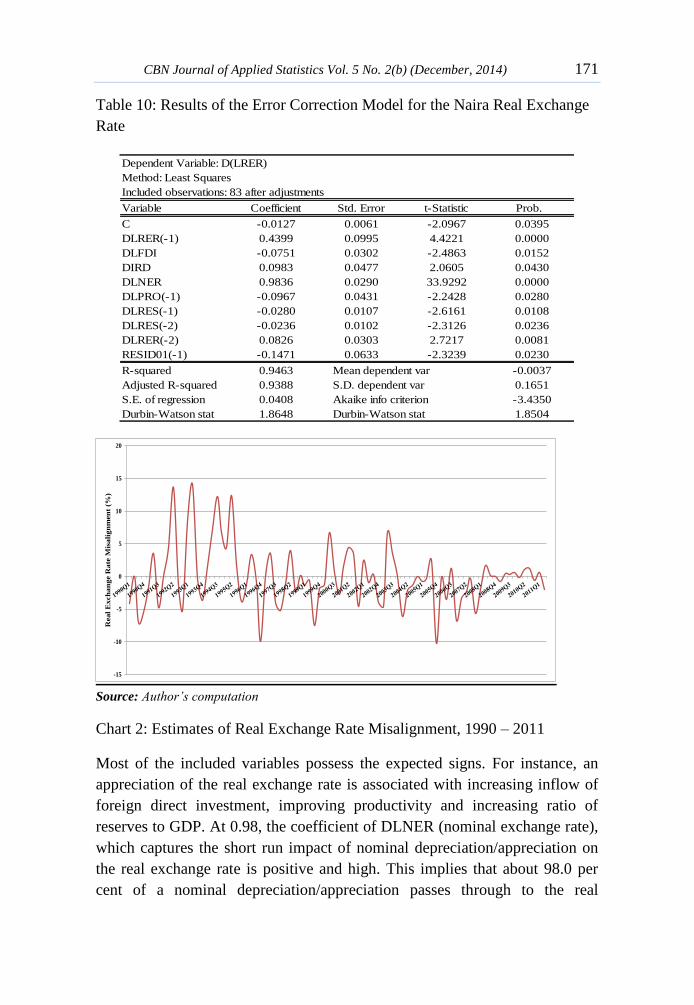
Table 10: Results of the Error Correction Model for the Naira Real Exchange
Rate
Source: Author’s computation
Chart 2: Estimates of Real Exchange Rate Misalignment, 1990 – 2011
Most of the included variables possess the expected signs. For instance, an
appreciation of the real exchange rate is associated with increasing inflow of
foreign direct investment, improving productivity and increasing ratio of
reserves to GDP. At 0.98, the coefficient of DLNER (nominal exchange rate),
which captures the short run impact of nominal depreciation/appreciation on
the real exchange rate is positive and high. This implies that about 98.0 per
cent of a nominal depreciation/appreciation passes through to the real
Dependent Variable: D(LRER)
Method: Least Squares
Included observations: 83 after adjustments
Variable Coefficient Std. Error t-Statistic Prob.
C -0.0127 0.0061 -2.0967 0.0395
DLRER(-1) 0.4399 0.0995 4.4221 0.0000
DLFDI -0.0751 0.0302 -2.4863 0.0152
DIRD 0.0983 0.0477 2.0605 0.0430
DLNER 0.9836 0.0290 33.9292 0.0000
DLPRO(-1) -0.0967 0.0431 -2.2428 0.0280
DLRES(-1) -0.0280 0.0107 -2.6161 0.0108
DLRES(-2) -0.0236 0.0102 -2.3126 0.0236
DLRER(-2) 0.0826 0.0303 2.7217 0.0081
RESID01(-1) -0.1471 0.0633 -2.3239 0.0230
R-squared 0.9463 Mean dependent var -0.0037
Adjusted R-squared 0.9388 S.D. dependent var 0.1651
S.E. of regression 0.0408 Akaike info criterion -3.4350
Durbin-Watson stat 1.8648 Durbin-Watson stat 1.8504
-15
-10
-5
0
5
10
15
20
Rea
l E
xch
an
ge R
ate
Mis
ali
gn
men
t (%
)
172 Is Real Exchange Rate Misalignment a Leading Indicator
Currency Crises in Nigeria? Omotosho
exchange rate. The error correction coefficient, which is -0.1471, is relatively
low but statistically significant, implying that about 14.7 per cent of deviation
in the real exchange rate from its equilibrium path is corrected within the next
quarter. This low level of adjustment many not be unconnected with the fixed
exchange rate regime of the 1990s.
5.5 Real Exchange Rate Misalignment
The estimated naira RER misalignment is presented in Chart 2. Overall, the
observed RER was overvalued by an average of 0.03 per cent during the study
period, with 49 cases of undervaluation and 37 cases of overvaluation.
Analysis of estimated RER misalignment levels in a time series context shows
that periods of significant misalignments (i.e. overvaluation or
undervaluation) are associated with identifiable government policy shifts and
shocks emanating from both the domestic and global economies. The periods
of control (i.e. pegged exchange rate system and AFEM, 1992 - 1996) are
notably periods of overvaluation. The introduction of the rDAS in Q3 2002
led to a correction to equilibrium, after which the naira RER became
undervalued in Q1 2003. Following the introduction of wDAS in Q1 2006, the
naira real exchange rate oscillated closely around its long run equilibrium
path, except for the distortions of 2008 and 2009 that emanated from the
impact of the 2008/09 global financial crisis. The crisis mounted serious
depreciation pressures on the naira RER leading to an undervaluation of about
9.82 per cent at the peak of the crisis impact in Q1 2009. The extent to which
this estimated levels of misalignment constitutes a reliable leading indicator of
currency crisis in Nigeria is investigated in this paper.
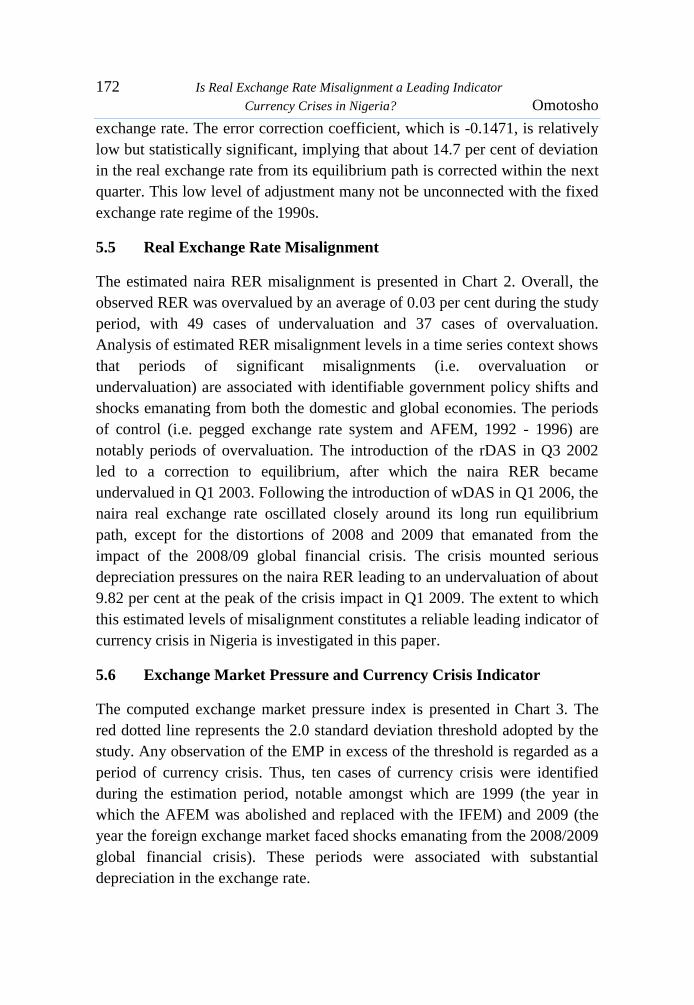
5.6 Exchange Market Pressure and Currency Crisis Indicator
The computed exchange market pressure index is presented in Chart 3. The
red dotted line represents the 2.0 standard deviation threshold adopted by the
study. Any observation of the EMP in excess of the threshold is regarded as a
period of currency crisis. Thus, ten cases of currency crisis were identified
during the estimation period, notable amongst which are 1999 (the year in
which the AFEM was abolished and replaced with the IFEM) and 2009 (the
year the foreign exchange market faced shocks emanating from the 2008/2009
global financial crisis). These periods were associated with substantial
depreciation in the exchange rate.
CBN Journal of Applied Statistics Vol. 5 No. 2(b) (December, 2014) 173
Source: Author’s computation
Chart 3: Exchange Market Pressure Index, 1990Q1 – 2011Q2
5.6 Currency Crisis Model
Table 11 presents the results of three variants of equation (8) fitted to
investigate the determinants of currency crisis in Nigeria. Model 1 excludes
the exchange rate indicators while model 2 includes both the real exchange
rate and its volatility. In Model 3 real exchange rate misalignment was added
to the variables included in Model 2. With or without the inclusion of the
exchange rate indicators in the logit model, the signs of the other coefficients
remained the same, implying some level of consistency and robustness of the
estimates. The inclusion of real exchange rate, its volatility and misalignment
significantly improved model performance as the deviance statistics (a
measure of lack of model fit) reduced significantly from 26.3 (Model 1) to
10.83 (Model 3). At 0.82, the McFadden R-Squared for model 3 is the highest
thus making it our preferred model.
Most of the coefficients of the preferred models are correctly signed and in
line with theoretical expectations. The 12 variables included in the model are
significant at the 1 per cent level, confirming their relevance in predicting
currency crises in Nigeria. Since the variables enter the model in their one
period lags, we confirm that government size, output gap, ratio of M2/external
reserves, high inflation, debt to GDP ratio, oil price growth, FPIGap, exports
growth as well as exchange rate indicators, such as real exchange rate,
-200
-100
0
100
200
300
400
Exchange Mkt. Pressure Index Threshold
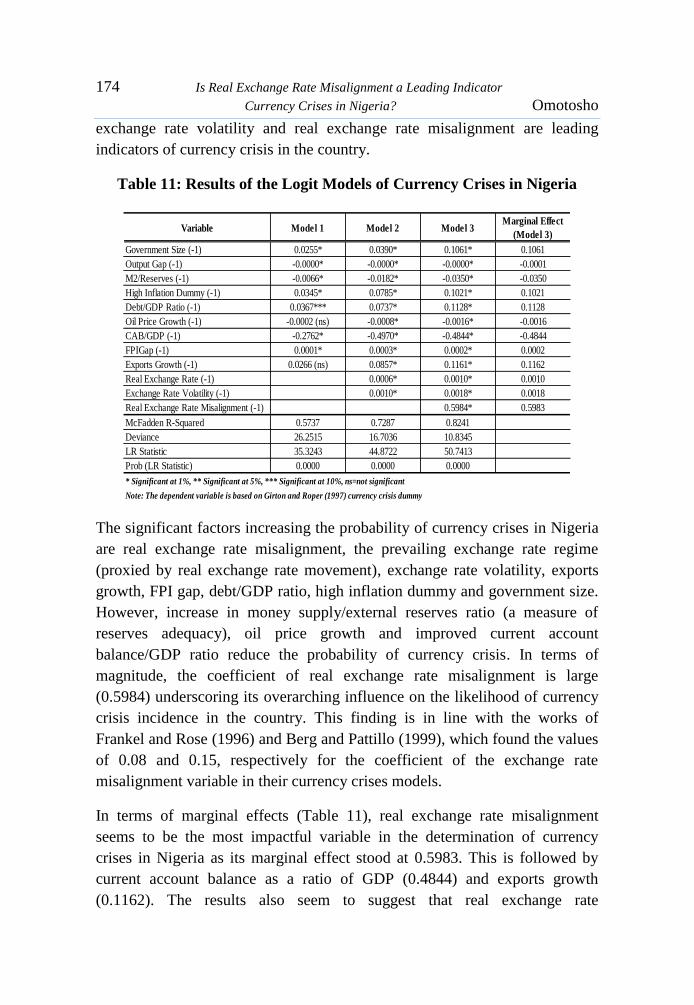
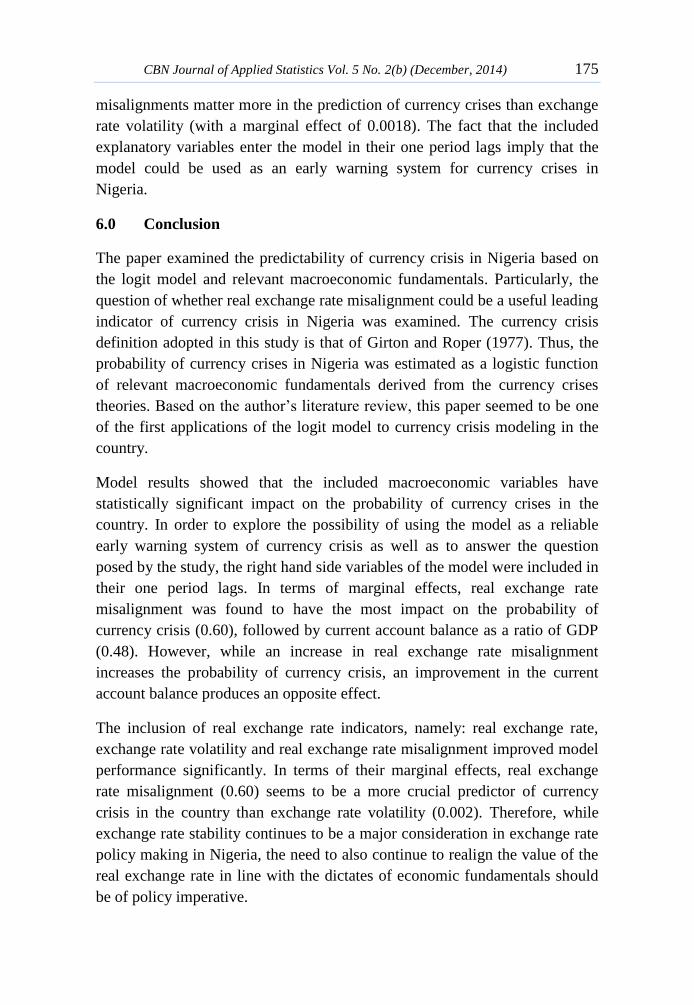
174 Is Real Exchange Rate Misalignment a Leading Indicator
Currency Crises in Nigeria? Omotosho
exchange rate volatility and real exchange rate misalignment are leading
indicators of currency crisis in the country.
Table 11: Results of the Logit Models of Currency Crises in Nigeria
The significant factors increasing the probability of currency crises in Nigeria
are real exchange rate misalignment, the prevailing exchange rate regime
(proxied by real exchange rate movement), exchange rate volatility, exports
growth, FPI gap, debt/GDP ratio, high inflation dummy and government size.
However, increase in money supply/external reserves ratio (a measure of
reserves adequacy), oil price growth and improved current account
balance/GDP ratio reduce the probability of currency crisis. In terms of
magnitude, the coefficient of real exchange rate misalignment is large
(0.5984) underscoring its overarching influence on the likelihood of currency
crisis incidence in the country. This finding is in line with the works of
Frankel and Rose (1996) and Berg and Pattillo (1999), which found the values
of 0.08 and 0.15, respectively for the coefficient of the exchange rate
misalignment variable in their currency crises models.
In terms of marginal effects (Table 11), real exchange rate misalignment
seems to be the most impactful variable in the determination of currency
crises in Nigeria as its marginal effect stood at 0.5983. This is followed by
current account balance as a ratio of GDP (0.4844) and exports growth
(0.1162). The results also seem to suggest that real exchange rate
Variable Model 1 Model 2 Model 3Marginal Effect
(Model 3)
Government Size (-1) 0.0255* 0.0390* 0.1061* 0.1061
Output Gap (-1) -0.0000* -0.0000* -0.0000* -0.0001
M2/Reserves (-1) -0.0066* -0.0182* -0.0350* -0.0350
High Inflation Dummy (-1) 0.0345* 0.0785* 0.1021* 0.1021
Debt/GDP Ratio (-1) 0.0367*** 0.0737* 0.1128* 0.1128
Oil Price Growth (-1) -0.0002 (ns) -0.0008* -0.0016* -0.0016
CAB/GDP (-1) -0.2762* -0.4970* -0.4844* -0.4844
FPIGap (-1) 0.0001* 0.0003* 0.0002* 0.0002
Exports Growth (-1) 0.0266 (ns) 0.0857* 0.1161* 0.1162
Real Exchange Rate (-1) 0.0006* 0.0010* 0.0010
Exchange Rate Volatility (-1) 0.0010* 0.0018* 0.0018
Real Exchange Rate Misalignment (-1) 0.5984* 0.5983
McFadden R-Squared 0.5737 0.7287 0.8241
Deviance 26.2515 16.7036 10.8345
LR Statistic 35.3243 44.8722 50.7413
Prob (LR Statistic) 0.0000 0.0000 0.0000
* Significant at 1%, ** Significant at 5%, *** Significant at 10%, ns=not significant
Note: The dependent variable is based on Girton and Roper (1997) currency crisis dummy
CBN Journal of Applied Statistics Vol. 5 No. 2(b) (December, 2014) 175
misalignments matter more in the prediction of currency crises than exchange
rate volatility (with a marginal effect of 0.0018). The fact that the included
explanatory variables enter the model in their one period lags imply that the
model could be used as an early warning system for currency crises in
Nigeria.
6.0 Conclusion
The paper examined the predictability of currency crisis in Nigeria based on
the logit model and relevant macroeconomic fundamentals. Particularly, the
question of whether real exchange rate misalignment could be a useful leading
indicator of currency crisis in Nigeria was examined. The currency crisis
definition adopted in this study is that of Girton and Roper (1977). Thus, the
probability of currency crises in Nigeria was estimated as a logistic function
of relevant macroeconomic fundamentals derived from the currency crises
theories. Based on the author’s literature review, this paper seemed to be one
of the first applications of the logit model to currency crisis modeling in the
country.
Model results showed that the included macroeconomic variables have
statistically significant impact on the probability of currency crises in the
country. In order to explore the possibility of using the model as a reliable
early warning system of currency crisis as well as to answer the question
posed by the study, the right hand side variables of the model were included in
their one period lags. In terms of marginal effects, real exchange rate
misalignment was found to have the most impact on the probability of
currency crisis (0.60), followed by current account balance as a ratio of GDP
(0.48). However, while an increase in real exchange rate misalignment
increases the probability of currency crisis, an improvement in the current
account balance produces an opposite effect.
The inclusion of real exchange rate indicators, namely: real exchange rate,
exchange rate volatility and real exchange rate misalignment improved model
performance significantly. In terms of their marginal effects, real exchange
rate misalignment (0.60) seems to be a more crucial predictor of currency
crisis in the country than exchange rate volatility (0.002). Therefore, while
exchange rate stability continues to be a major consideration in exchange rate
policy making in Nigeria, the need to also continue to realign the value of the
real exchange rate in line with the dictates of economic fundamentals should
be of policy imperative.
176 Is Real Exchange Rate Misalignment a Leading Indicator
Currency Crises in Nigeria? Omotosho
In conclusion, since real exchange rate misalignment entered the logit model
significantly in its one period lag, the answer to the question posed in the title
of the paper is ‘yes’. In other words, real exchange rate misalignment is a
leading indicator of currency crises in Nigeria. Therefore, we recommend a
continuous and credible assessment of the naira real exchange rate relative to
its long run equilibrium value with a view to ensuring that episodes of
substantial and prolonged misalignments are avoided. When such assessments
reveal a widening real exchange rate misalignment, the need for urgent policy
shift becomes paramount, if currency crisis is to be prevented. This paper
recommends the continued use of market-based exchange rate determination
arrangements that is capable of arresting misalignments and volatility in the
Naira exchange rate as an effective strategy for reducing the probability of
currency crisis in the country.
References
Agu, C. (2002). Real Exchange Rate Distortions and External Balance
Position of Nigeria: Issues and Policy Options. African Institute for
Applied Economics.
Aliyu, S.U.R. (2011). Real Exchange Rate Misalignment: An Application of
Behavioural Equilibrium Exchange Rate to Nigeria. CBN Occasional
paper, No. 41.
Baffes, J., Elbadawi, I. and O’Connell, S. (1997). Single-Equation Estimation
of the Equilibrium Real Exchange Rate. World Bank Policy Research
Working Paper.
Berg, A. and Pattillo, C. (1999). Are currency crises predictable? A Test.
International Monetary Fund Staff Papers, 2:107-138.
Bordo, M., Eichengreen, B., Klingebiel, D. and Martinez-Peria, M. S. (2001).
Is the crisis Problem growing more Severe? Economic Policy, 16(32):
53–82.
Bussiere, M. and Fratzscher, M. (2002). Towards a New Early Warning
System of Financial Crises. ECB Working Paper, No. 145.
CBN Journal of Applied Statistics Vol. 5 No. 2(b) (December, 2014) 177
Edison, H. J. (2003). Do Indicators of Financial Crises Work? An evaluation
of an Early Warning System. International Journal of Finance and
Economics, 8(1):11–53.
Eichengreen, B., Rose, A. and Wyplosz, C. (1995). Exchange Market
Mayhem: The Antecedents and Aftermath of Speculative Attacks.
Economic Policy, 21:249-312.
Eichengreen, B., Rose, A. and Wyplosz, C. (1996). Contagious Currency
Crises. NBER Working Paper, No. 5681.
Engle, R. and C. Granger, (1987). Co-Integration and Error-Correction:
Representation, Estimation and Testing. Econometrica 55:251-76.
Frankel, J. and Rose, A. (1996). Currency Crashes in Emerging Markets: An
Empirical Treatment. Journal of International Economics, 41:351-366.
Girton, L. and Roper, D. (1977). A Monetary Model of Exchange Market
Pressure Applied to the Postwar Canadian Experience. American
Economic Review, 67:537-548.
Glick, R. and Hutchison, M. (2001). Banking and Currency Crises: How
Common are Twins?” in Glick, R., Moreno, R. and Spiegel, M. M.
eds.: Financial Crises in Emerging Market (Cambridge University
Press, Cambridge; New York and Melbourne).
Glick, R. and Hutchison, M. (2005). Capital Controls and Exchange Rate
Instability in Developing Economies. Journal of International Money
and Finance 24 (3):387–412.
Glick, R., Guo, X. and Hutchison, M. (2006). Currency Crises, Capital
Account Liberalization, and Selection Bias. Review of Economics and
Statistics, 88(4):698-714.
Hutchison, M. and Noy, I. ( 2002). Output Costs of Currency and Balance of
Payments Crises in Emerging Markets. Comparative Economic Studies
44(2):27–44.
Johansen, S. (1995). Likelihood-Based Inference in Cointegrated Vector
Autoregressive Models. Oxford: Oxford University Press
178 Is Real Exchange Rate Misalignment a Leading Indicator
Currency Crises in Nigeria? Omotosho
Kaminsky, G. and Reinhart, C. M. (1999). The Twin Crises: The Causes of
Banking and Balance of Payments Problems. American Economic
Review, 89(3):473-500.
Kaminsky, G., Lizondo, S. and Reinhart, C. M. (1998). Leading Indicators of
Currency Crises. IMF Staff Papers, 45:1-10.
Komulainen T. and Lukkarila J. (2003). What Drives Financial Crises in
Emerging Markets? Emerging Markets Review, 4:248– 272.
Kumar, M., Moorthy, U. and Perraudin, W. (2003). Predicting Emerging
Market Currency Crashes,” Journal of Empirical Finance, 10:427-454.
Laeven, L. and Fabian, V. (2008). Systemic Banking Crises: A New Database.
International Monetary Fund Working Paper, No. 08/224.
MacDonald, R. (1997). What Determines Real Exchange Rates? The Long
and Short of It. IMF Working Paper, No. WP/97/21.
Obadan, M.I. (1994). “Real Exchange Rates in Nigeria: A Preliminary Study.”
NCEMA Monograph Series, No. 5.
Obaseki, P.J. (1998). The Purchasing Power Parity Measure of Naira’s
Equilibrium Exchange Rate. CBN Economic and Financial Review,
36(1).
Omotosho, B.S. and Wambai, M.U. (2012). “Is the Naira-US Dollar Real
Exchange Rate Misaligned?” CBN Economic and Financial Review,
50(2).
Ononugbo, M.C. (2005). Purchasing Power Parity and Exchange Rate in
Nigeria: A Regime Switching Approach. CBN Economic and
Financial Review 43(2).
Razin, O. and Collins, S.M. (1997). Real Exchange Rate Misalignments and
Growth. NBER Working Paper Series, No. 6174.
Soludo, C.C. and Adenikinju, A.F. (1997). Exchange Rate Misalignment and
Investment in Nigeria. Paper presented to OECD Development Centre,
Paris.
CBN Journal of Applied Statistics Vol. 5 No. 2(b) (December, 2014) 179
Singh, A. (2003). Capital Account Liberalization, Free Long-term Capital
Flows, Financial Crises and Economic Development. Eastern
Economic Journal, 29(2).