Embed Size (px)
Citation preview

School of Sustainable Development of Society and Technology
IS OPEC’S ALLOCATION OF CRUDE
OIL PRODUCTION EFFICIENT?
Bachelor Thesis in Economics

2
IS OPEC‟S ALLOCATION OF CRUDE
OIL PRODUCTION EFFICIENT?
(Bachelor Thesis in Economics)
MÄLARDALEN UNIVERSITY
SWEDEN
Tutor: Christos Papahristodoulou
Authors:
Fateh-ud-din [email protected]
Hazal Hazar [email protected]
Ali Salih [email protected]

3
ABSTRACT
Course: Bachelor Thesis in Economics
Title: Is OPEC‟s allocation of crude oil production efficient?
Authors: Fateh-ud-din, Ali Salih, Hazal Hazar
Supervisor: Christos Papahristodoulou
Introduction: The foundation of OPEC (Organization of Oil Exporting Countries) was
laid in the early 1960‟s by the five major oil exporters, Iran, Iraq, Kuwait,
Saudi Arabia and Venezuela, in Baghdad, Iraq. OPEC is supposed to
allocate its production level among its member countries based on cartel-
dominant firm model, for profit maximization.
Purpose: The aim of this thesis is to investigate to what extent OPEC as a whole
produced according to the dominant firm pricing model, given a number
of non-OPEC countries, and to what extent the allocated quotas to each
OPEC-member were optimal.
Method: Cartel model was used to calculate the optimal level of production for
OPEC.
Result: The values for the optimal production that we have calculated are always
higher than the actual production and actual allocation; actual production
is closer to optimal production compared to actual allocation.
Conclusion: We concluded that OPEC allocation is not optimal, but OPEC countries
are producing close to optimal level.

4
ACKNOWLEDGEMENT
First of all we would like to thank God for the strength and power that made us complete our work. Very
special thanks to our supervisor Christos Papahristodoulou for providing us with necessary data,
constructive suggestions and all the feedback. Finally we would like to thank our friends and families for
their moral support.
Fateh,Ali,Hazal

5
Contents
1. A brief history of OPEC ........................................................................................................................... 7
2. The problem .............................................................................................................................................. 9
3. A short review of the literature on the topic ........................................................................................... 10
4. The aim of the thesis ............................................................................................................................... 11
5. The limitations & Assumptions .............................................................................................................. 11
5.1 Technical limitations/assumptions .................................................................................................... 11
5.2 Data limitations/assumptions ............................................................................................................ 12
6. The methodology .................................................................................................................................... 13
7. The analysis ............................................................................................................................................ 15
7.1 Theoretical model of optimal level of production for OPEC ............................................................ 15
7.2 Calculation of MC of OPEC ............................................................................................................. 19
7.3 Calculation of optimal Production level for OPEC ........................................................................... 22
7.4 Optimal allocations for OPEC countries ........................................................................................... 24
8. The results ............................................................................................................................................... 27
9. Optimal allocation for OPEC with different MC for Saudi Arabia ........................................................ 32
10. Summary and Conclusions.................................................................................................................... 35
11. References ............................................................................................................................................. 36
Appendix ..................................................................................................................................................... 38
A-1 .......................................................................................................................................................... 38
A-2 .......................................................................................................................................................... 42
A-3 .......................................................................................................................................................... 43
A.4 ........................................................................................................................................................... 46

6
List of figures
Figure 1: Flow model of calculations for OPEC ......................................................................................................... 13
Figure 2: Flow model of calculations for OPEC countries ......................................................................................... 13
Figure 3: The OPEC oil cartel (Pindyck & Rubinfield 2004, p.464) ........................................................................ 15
Figure 4: Comparisons in level of production in different years. (Quantities are given in mbd) ............................... 22
Figure 5: Optimal vs. actual allocation for individual OPEC countries, with different percentage growth for Saudi
Arabia .......................................................................................................................................................................... 28
Figure 6: Optimal Vs actual allocation for OPEC countries in 1983 .......................................................................... 29
Figure 7: Optimal vs. actual allocation for OPEC countries in 1992 .......................................................................... 30
Figure 8: Optimal vs. actual allocation for OPEC countries in 1997 .......................................................................... 30
Figure 9: Optimal vs. actual allocation for OPEC countries in 1992 .......................................................................... 31
List of tables
Table 1: MC for respective production per country in mbd (Papahristodoulou C 1985, Statoil, Norway .................. 18
Table 2: MC functions for OPEC countries (1982) quantity is measured in mbd ...................................................... 19
Table 3: Results from the calculations of the optimal production level. Calculations are given in appendix ............. 22
Table 4: Marginal cost functions of OPEC countries in 1997. (Own table based on table 1) .................................... 23
Table 5: Actual and optimal level of production and allocation for individual countries in OPEC ............................ 24
Table 6. : Optimal allocation for Saudi Arabia with different MC functions ............................................................. 27
Table 7: Production, allocation and optimal level of output in different years for OPEC and non-OPEC countries
(quantities are in mbd) ................................................................................................................................................ 32
Table 8: Optimal allocations for individual OPEC countries in different years.......................................................... 41

7
1. A brief history of OPEC
The foundation of OPEC (Organization of Oil Exporting Countries) was laid in the early 1960‟s
by the five major oil exporters, Iran, Iraq, Kuwait, Saudi Arabia and Venezuela, in Baghdad,
Iraq. The headquarters were decided to be located in Vienna, Austria where the meetings are
held twice a year in order to allocate new quotas to hold an optimal price. By 1973 eight other
nations joined the organization; these countries were Algeria, Ecuador, Gabon, Indonesia, Libya,
Nigeria, Qatar, and the United Arab Emirates.
OPEC states that: “Any country with substantial net export of crude petroleum which has
fundamentally similar interests to those of member countries may become a full member of the
organization, if accepted by a majority of three-fourths of full members including the concurring
votes of all founder members.”1
There are 3 types of members in OPEC, the first type is the founder members that are the five
leading countries represented in the meeting; the second type is the full members who are
accepted by the conference of OPEC and the associate members who do not qualify for full
membership, but are still accepted under some special conditions.
The foundation of this unionization was as a response to the 1959 imposition of import quotas on
crude oil and refined products by the U.S. Subsequently, in September, OPEC was formed in
order to restrict the oil prices (Benjamin Zycher).
Another intention of this union was to raise the current economic rent on oil in order to avoid
inequalities in distribution of revenues. In 1960, the retail prices of oil surpassed $30 in most of
the European countries which were caused by serious excise taxes collected by the consuming
countries. The uneven allocation of revenues among the oil producing and oil consuming
countries triggered the founders of OPEC to unionize (Griffin, J M & Teece, D J 1982, p. 4).
Another primary goal of OPEC was to increase the taxes collected by producers that had been
declining since 1957. This decline in taxes led to a decline in revenues which can be traced to the
deduction in the world oil prices.
1 http://www.opec.org/library/what%20is%20OPEC/FAQ.pdf

8
A significant change was observed for OPEC the first period from 1960 to 1973. The economic
growth of the key oil consuming countries led to an expansion in their oil consumption as well.
With this significant growth, the market was shifting from an oversupply character to an excess
demand character which led to price increase in oil (Griffin, J M & Teece, D J 1982, p. 4).
From the unionization of OPEC to the present time, the oil market encountered four crises which
caused dramatic ups and downs in the price of oil. The first crisis was in 1973, the Arab oil
embargo on the U.S and the Netherlands, which caused a dramatic increase in the oil price1.
There are also other economists such as Benjamin Zycher that does not support the reason of the
crisis to the oil embargo, but to the reduction in the oil production of OPEC that grounds the
reason to the upswing.
The second crisis was the Iranian revolution in 1979 which also resulted in a peak of oil price.
The following oil crisis was a collapse of oil prices due the decreasing demand of oil after the
two crises in the 1970‟s. The last pricing crisis was prevented at the beginning of the 1990‟s,
when the Middle East outbreak of opposition occurred. But as a consequence a panic occurred in
the market and the prices increased dramatically2.
Behavior of OPEC and non-OPEC countries in history
The Iranian revolution was in the decade the oil market started to cause panic. The oil demand
for world dropped from 62.9 mbd to 53.5 mbd during 1979 to 1982. OPEC‟s output fell from
30.5 mbd to 18.7 mbd, a decrease of almost 40 %. The general belief of the reason for this
drastic fall was the recession itself, which was causing a decline in “commercial energy
consumption through conservation and the use of oil substitutes”.3
After the 1970‟s the discovery of new oil fields by the non-OPEC countries led to an increase in
supply of oil which caused a drop in the oil price. 7
In the beginning of the 1990‟s most OPEC members were producing more oil than their actual
allocation levels. This was mostly due to the economic tailspin the oil-rich countries were facing.
2 http://www.opec.org/aboutus/history/history.htm.
3Momayezi 2006, p. 1412.

9
Most of the OPEC countries‟ economies relied -and continues to rely- on oil. Even Saudi Arabia,
the leading oil producer in the world and the political leader of OPEC encountered economic
recessions. For example, in 1997 Saudi Arabia‟s revenues were about $45 billion from the oil
export, this amount dropped to $30 billion in 1998. As a matter of fact, each OPEC country had
an incentive to produce more oil. As a whole, both OPEC and non-OPEC countries were causing
an excessive production which was a natural consequence of the low oil prices during the 1990‟s.
Oil prices in the summer of 2000 were still about one-third below what they were in 1990 and
half of 1981 prices7
2. The problem
Oil market has a significant role in world economy. The main players in the oil market are OPEC
and non-OPEC oil producing countries. There have been different attempts in past2 which tried
to explain the oil market structure. In those attempts different results came out depending on the
time periods under considerations of respective studies. Some of them tried to prove if OPEC
was a cartel or not using different methods like Co-integration and Causality Tests3. Griffin
(1985) was the first person who systematically test OPEC‟s behavior and concluded that OPEC
countries constrain their coordinated production to raise the price and therefore maximize their
profits while non-OPEC producers act as competitive producers (Griffin 1985).
Carlton and Perloff concluded based on different studies that OPEC is behaving as a cartel, but
in different specific time periods. The basic characteristics, which are a large market share and
effect on price level of oil, are promotives of this cartel4. There are also some authors (like
A.F.Alhajji and David Huettner, 2000) who tried to prove that OPEC as a whole is not a cartel
and not behaving like optimal profit maximizes. In history OPEC has clearly affected oil prices,
but producer countries have not achieved profit maximization level (Hansen & Lindholt 2004, p.
22).This can be because of cheating and non-optimal level of allocation.
OPEC has a significant share in the crude oil market, and they had almost 78% of world oil
reserves in 20075, and it is considered as a dominator in crude oil market, but it is still not
controlling the oil price6 as it is assumed to do according to the theory of dominant firm model
(Carlton and Perloff, 2004). OPEC member countries produce about 45 % of the world‟s crude
10
oil , however OPEC‟s exports represents about 55 % of the crude oil traded internationally, so
OPEC can have big influence on the crude oil market by deciding its production levels so called
quotas.
Many studies have used firm-dominant model to explain OPEC‟s behavior as a whole (Mabro
1975) and also with individual core OPEC countries like Saudi Arabia is a dominant producer
within OPEC and remaining OPEC and non-OPEC member countries are fringe firms, like
“OPEC is Saudi Arabia” (Erickson 1980).
So as an overview for the problem, there are two players in the market, OPEC and non-OPEC.
OPEC is assumed to behave like a dominant firm and determine the market price but eventually
it might not.
3. A short review of the literature on the topic
Producers in a cartel explicitly agree to cooperate in setting prices and output levels. Not all of
the producers in an industry need to join the cartel, and most cartels involve only a subset of
producers. But if enough producers adhere to the cartel‟s agreements, and if market demand is
sufficiently inelastic, the cartel may drive prices well above competitive levels (Carlton &
Perloff, 2004).
As in many studies investigating oil market, authors divide the oil market model into two general
groups; cartel and non-cartel countries (we will consider countries, not individual firms to
simplify our assumptions). Some of the researchers go beyond to dominant and monopoly
models too (Griffin (1985) and Jones (1990)). OPEC is classified as a cartel but different studies
-as mentioned before- show that the organization has not been successful in achieving the profit
maximizing level that the basic cartel model assumes it to be. (Pindyck & Rubinfield 2004,
p.462).
11
4. The aim of the thesis
OPEC is classified as a cartel but has not been successful in achieving the profit maximizing
level or the control of the price according to different studies (i.e. Alhajji & Huettner 2000a).
The reason is due to the imperfect/non-optimal allocation or because of imperfect production of
each country.
The aim of this thesis is to investigate to what extent OPEC as a whole produces according to the
dominant firm pricing model, given a number of non-OPEC countries, and to what extent the
allocated quotas to each OPEC-member were optimal.
5. The limitations & Assumptions
Such an ambitious project depends of course on many assumptions and limitations that we will
have to make in order to simplify our calculations; interpret and analyze the data.
5.1 Technical limitations/assumptions
1. We will assume that world oil demand and the residual demand to be linear for simplification
of calculations. The demand function for the world that we will use is presented in Pindyck &
Rubinfield (2004, p. 53). Considering real life, demand and supply functions depend on many
variables. The only variables that we are taking into consideration in this work are price and
quantity to determine the world demand and non-OPEC supply. Whereas residual demand
function for OPEC is the difference of world demand and the supply from non-OPEC countries.
2. We will assume the supply function of non-OPEC countries and the marginal cost functions of
OPEC countries to be linear and increasing (with quantity and time) in order to simplify our
calculations.
3. Production of oil in real life does not take place or is not produced with full capacity everyday
of the year. On average we will assume that it is 330 days of full capacity per year. The data
collected from the web is taking thousand barrels per day (tbd) while the function presented in
the book is taking billion barrels per year (bby) into consideration. We will do our calculations in
million barrels per day (mbd).
12
4. Because oil is a nonrenewable natural resource, the price of oil is expected to rise over time
(as the supply runs out) regardless of the market structure.
5. The basic MC function is unchanged for each country throughout the years, but because of
many factors that can affect the marginal cost (i.e. GDP, income, depletion of fields, etc). For
simplicity we will assume that MC will be doubled in 20 years starting from 1982, in other
words it will increase without compounding by 5% each year.
6. We will assume the market to be in equilibrium.
7. The number of countries throughout the paper is assumed to be 11 due to unavailability of
allocation data for Gabon and Ecuador.
5.2 Data limitations/assumptions
1. The actual level of production for non-OPEC countries is assumed to be optimal.
2. We will focus our analysis of crude oil market with data from 1982 to 2005.
3. The main sources of our data will be from OPEC‟s4 and BP‟s (British Petroleum)
5 websites
and marginal cost given in table 1.
4. We will use nominal prices in our calculations6.
4 http://www.opec.org/library/Annual%20Statistical%20Bulletin/pdf/ASB2007.pdf
5http://www.bp.com/liveassets/bp_internet/globalbp/globalbp_uk_english/reports_and_publications/statistical_energ
y_review_2008/STAGING/local_assets/downloads/pdf/statistical_review_of_world_energy_full_review_2008.pdf
6 http://www.ioga.com/Special/crudeoil_Hist.htm
13
6. The methodology
We know from theory (Carlton & Perloff, 2004) that cartel behaves like a monopolist for the
residual demand, and if a group of producers in a market decides to cartelize then they will act
like a dominant firm in the market. So from the characteristics of a dominant firm and a cartel we
will try to find out if that really is the case for OPEC. Following are the economic terms that we
will use throughout our thesis:
Optimal production: By optimal production we mean the production level found based on our
calculations (based on the cartel model) which are given in appendix (A.1).
Actual allocation: By actual allocation we mean the individual OPEC members‟ quotas which
are decided twice a year in Vienna in order to keep the price at its wishful level.
Actual production: By actual production we mean the true production level by each member
and OPEC as a whole (the values are often higher than actual and optimal allocation because of
cheating).
There are two stages in our analysis part, in the first part we will analyze and compare the
optimal production level to actual allocation and actual production for OPEC as a whole and then
investigate OPEC countries individually.. The actual production and allocation levels will be
provided from the Annual Statistical Bulletin, from OPEC‟s homepage7. We will allocate the
marginal cost for OPEC that is already provided by data from table 1 and we will modify data in
order to get the marginal cost for each country at certain time periods. Then we will find the
optimal allocation according to the found MC.
At first we will try to find the optimal production of OPEC according to given data and MC
(Table 1) in different years. Afterwards we will find the optimal production of each country in
OPEC and will compare them with the actual allocation and production for that country in
respective years. Then we will compare the optimal allocation and production according to
individual MC functions of each country.
7http://www.opec.org/library/Annual%20Statistical%20Bulletin/pdf/ASB2007.pdf, p.6 and
http://www.opec.org/library/Annual%20statistical%20Bulletin/pdf/AB002002.pdf, p.10

14
(1) If actual allocation is same as optimal allocation we will conclude that OPEC is allocating
optimally.
(2) If actual production is close to the optimal allocation compared to the actual allocation we
will conclude that countries are trying to produce optimally, but actual allocation is not optimal.
Figure 1: Flow model of calculations for OPEC
Figure 2: Flow model of calculations for OPEC countries
Get World Demand and Non-OPEC supply
(From Pindyck)
and modify them according to respective
year.
Subtract Non-OPEC suppply from World
Demand to get Residual Demand
Get Marginal Revenue from Residual Demand
Set Marginal Revenue equal to Marginal Cost and get optimal level of
Production
Compare the optimal Production with actual allocation to check if
allocation was optimal, also check how much
they actually produced.
Find the MC function of specific country
depending on production level
Calculate the MC for specific year based on the assumption
that MC doubles in 20 years
Put MC from step two in the MC function that we find in step
one
Find the Optimal level of allocation
Compare the calculated production with actual allocation and actual production

15
7. The analysis
The members of OPEC set a target price that is approved and benefited by all the members
(Alhajji & Huettner 2000). The rest of the producer countries which include Mexico, the North
Sea area, United States, China, Russia, India, Argentina, Egypt etc, are competitive fringes. The
demand for OPEC is the residual demand, which is determined by subtracting the non-OPEC
supply from the world demand.
7.1 Theoretical model of optimal level of production for OPEC
We used the basic cartel model presented in Modern Industrial Organization (Carlton & Perloff
2004, p. 155) in order to define the fundamentals in our calculations.
(1)
First we tried to determine the general function by the help of figures given in Microeconomics
(Pindyck & Rubinfield 2004). Eventually we made some manipulations and adjustments of the
given function due to differences in the quantity and time.
To be more realistic we needed to change the supply function for non-OPEC countries entirely
by first starting with the inverse supply function (2).
(2)
“ ” is the point where MC of OPEC intercepts with non-OPEC supply in the price axis (the
production and the prices for non-OPEC countries are given in the appendix). Finally we solve
for and put it in the supply function (2a) in order to find .
(2a)
After calculating the constant and the slope for non-OPEC supply function we are now able to
state that for a price of 0 (zero) the quantity produced was negative, in other words this implies
that the countries wouldn‟t produce until price is greater than .
(3)
16
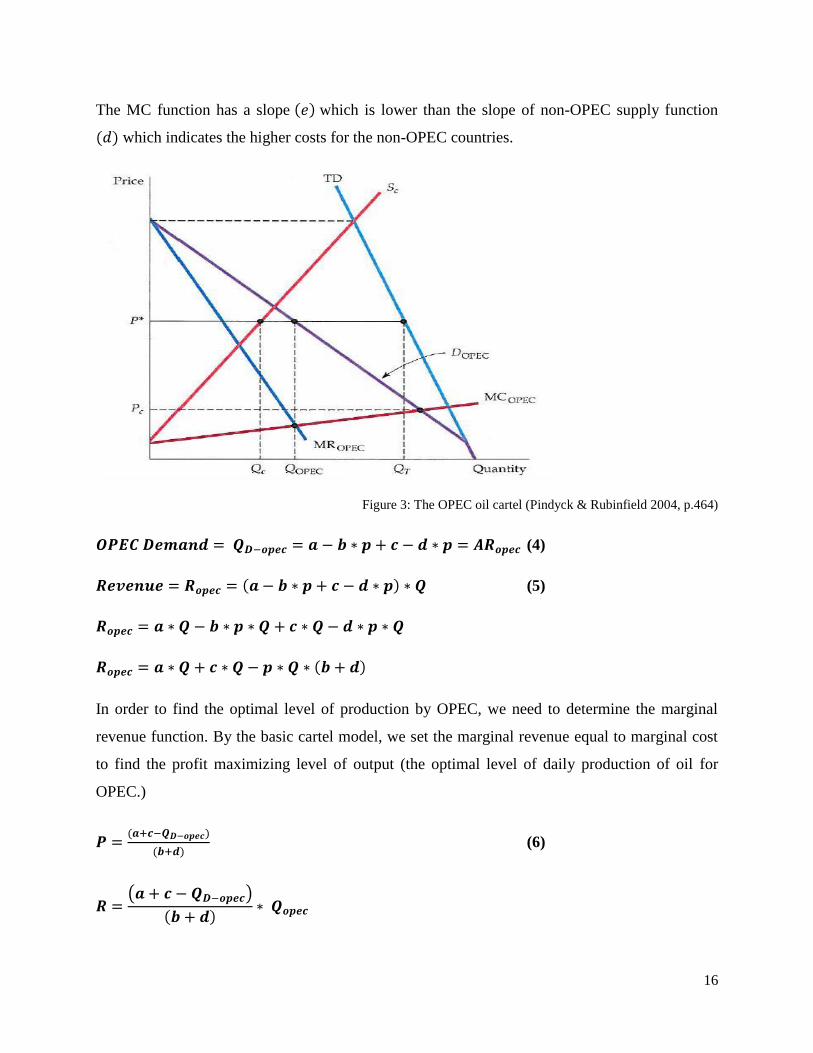
The MC function has a slope which is lower than the slope of non-OPEC supply function
which indicates the higher costs for the non-OPEC countries.
Figure 3: The OPEC oil cartel (Pindyck & Rubinfield 2004, p.464)
(4)
(5)
In order to find the optimal level of production by OPEC, we need to determine the marginal
revenue function. By the basic cartel model, we set the marginal revenue equal to marginal cost
to find the profit maximizing level of output (the optimal level of daily production of oil for
OPEC.)
(6)
17
(7)
Note: Replace with .
(8)
(9)
We put MR = MC to find optimal production level (eq. (3) = eq. (9))
(10)
So replace it in eq. (12)
(11)
If we derive equation (11) with respect to MC we will find out that it is negatively related to the
marginal cost this means that when marginal cost is increasing, the optimal level of production
will decrease everything else remain constant.
After putting the value of MC from eq. 3 in eq. 11 and after some simplifications we get;
(12)
“ ” is the optimal production level.
Let us now attempt to estimate the MC in OPEC. As is known from economics, MC is related to
variable costs. However to estimate MC is almost impossible because the data is very rare,
confidential and usually not appropriate for economic studies.

18
“Because of MC measure is rarely available many researchers use the price -average variable
cost margin instead of the appropriate price marginal cost margin. Their approximation to the
price average variable cost margin is typically as sales (revenues) minus payroll minus material
cost divided by sales. That is, they tend to ignore capital, research and development, and
advertising cost” (Carlton & Perloff 2004, p.254).
Why Non-OPEC countries have higher costs than OPEC countries?
As we also mentioned before a higher slope in the non-OPEC supply function is used to indicate
higher expenditures for the non-OPEC countries ( ).
Investment in an industry takes place when expected total revenue exceeds expected variable
cost which will be enough to cover the capital costs over time and will bring a sufficient profit.
Different factors should be taken into consideration before evaluating an investment such as
“current and expected prices, current and expected factor prices (i.e. interest rates, wages, energy
prices, etc.) and labor-capital productivity” (Papahristodoulou 1987, p.2).
There are differences in costs when the production fields are located onshore or offshore.
Observably, offshore production is more expensive. Among the reasons of being more expensive
than onshore production/drilling is the level of environmental risks, such as “discharges or spills
of toxic materials, interference with marine life, damage to coastal habitats, and effects on the
economic base of coastal communities”, etc. These factors cause the drilling process to be more
costly. For example offshore drilling currently accounts for 30% of total U.S. oil production.
They currently produce 1.5 million barrels of oil from offshore drilling, when compared to
consumption which equals to 21 million barrels daily, meaning 66% of U.S8 oil is being
imported. This is an indication of that the derived revenues from oil do not cover the cost of
offshore drilling.
Studies show that offshore production accounts for an important share of the oil reserves, which
in the future also will increase due to lack of reserves onshore9.
8 http://www.eia.doe.gov/pub/oil_gas/natural_gas/feature_articles/2005/offshore/offshore.pdf

19
The main factors of differences in unit cost of oil production are:
Field size
(Field sizes) and pay-zone depth
(Field sizes) and water depth
Distance to shore
Climate conditions
Field size is an important indicator of the cost. The larger the fields the cheaper the production
cost per barrel of oil. Most of the world‟s oil reserves are located in huge fields. Among the
onshore fields, a large portion of the Middle East‟s oil reserves are found in giant fields9.
When field size and the pay zone-depth (onshore) are considered, we can see from studies that
the unit costs are much higher when fields are undersized and have deeper pay zones. For
example, pay-zone depths in the Middle East (1-3 km) are considerable lower compared to North
America (3-5 km).9
Same implications can be reflected on the offshore cost measurement. Taking field size and
water depth into account, the unit costs are much higher when fields are small with a large water
depth. For instance, at a water depth of 200 meters, unit costs are 4 times higher for small fields
than for larger ones9.
Transportation costs are also implying that the longer the distance from the terminal to shore the
higher the unit costs are9.
7.2 Calculation of MC of OPEC
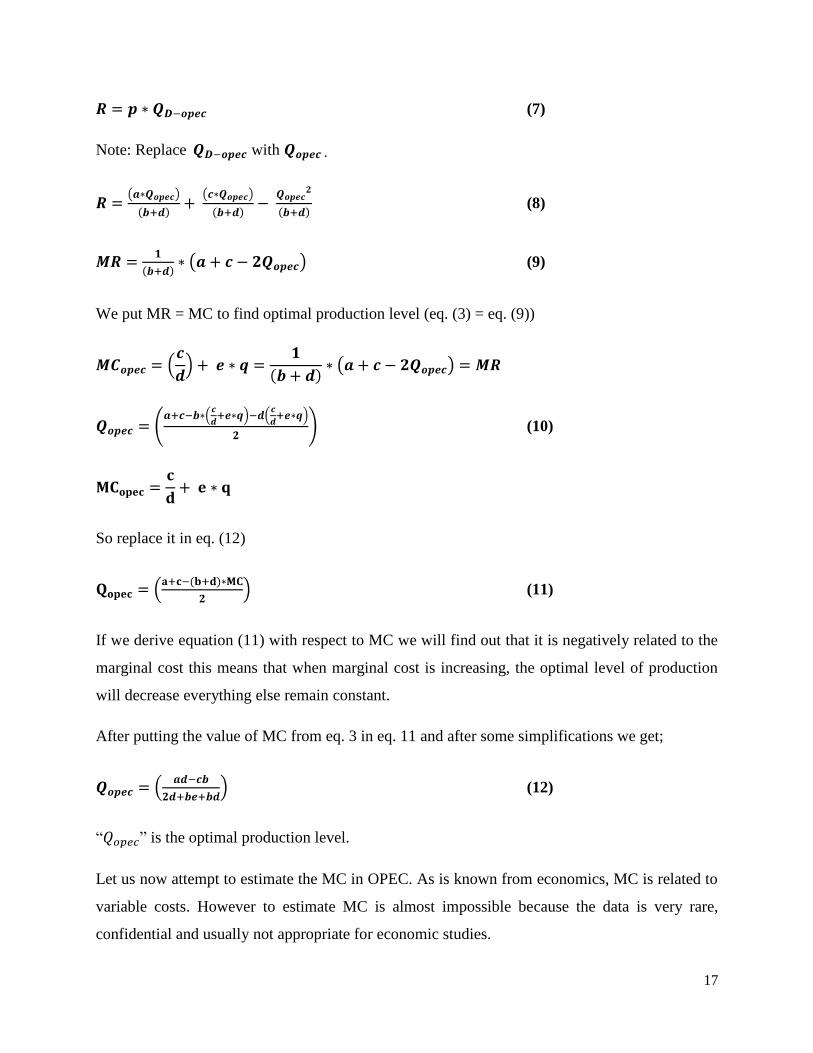
The first row in the table shows the various discontinuous levels of production, these are the
respective MC in dollar for all OPEC countries. The last column shows the allocation of that
year and the last row shows how much it would cost for every column. For instance the table
indicates that the marginal cost of Saudi Arabia is $ 0.9 per barrel until reach a level of 800 000
barrels/day, while the marginal cost of Qatar is $3/barrel for the same level of production.
9 (Papahristodoulou 1987, p. 4-10)
20
Country 0.2>Q 0.2≤Q<0.5 0.5≤Q<0.8 0.8≤Q<1 1≤Q<1.5 1.5≤Q<2 2≤Q<3 3≤Q Quota
Saudi A. 0,9 0,9 0,9 1 1,4 1,6 2 2,5 4,525
Iran 0,9 0,9 1,2 1,8 2 2,4 2,8 5,1 2,64
Iraq 0,9 0,9 1,3 1,8 2 2,5 2,9 5,1 2,64
Venezuela 0,9 1 1,5 2,1 2,6 3 5,1 7,1 1,64
Nigeria 0,9 1 1,7 2,3 2,8 3,5 5,1 7,1 1,36
Indonesia 0,9 1,2 1,9 2,5 2,9 3,8 5,1 8,1 1,24
Kuwait 0,9 1,5 2 2,5 2,9 4,1 5,1 8,1 1,04
Libya 0,9 1,6 2,1 2,5 2,9 4,1 6,1 9,1 1,04
UAE 0,9 1,7 2,3 2,7 3,5 4,1 6,1 9,1 1
Alger 1 1,9 2,5 3,1 3,7 4,1 6,1 9,1 0,7
Qatar 1 2,5 3 3,2 4 4,1 6,1 12,1 0,325
Ecuador 1,8 2,6 3 3,5 4,1 5,1 8,1 12,1 0,23
Gabon 2,2 2,9 3,5 3,8 4,1 5,1 8,1 12,1 0,17
Sum 14,1 20,6 26,9 32,8 38,9 47,5 68,7 106,7 18,55
Table.1: MC for respective production per country in mbd (Papahristodoulou C 1985, Statoil, Norway).
We have extended this table to every 100 000 barrels/day given in Appendix (A.4) and plotted
graphs using the xy – scattered built in function from the figures above (which is given in the
Appendix (A.3)) in order to find MC for each country. After the findings we drew a trend line in
order to get a linear MC function.

21
As can be observed, MC for Saudi Arabia, the fixed intersect is almost higher than most of the
countries‟, meaning that it has a higher MC initially, but with the increase in quantity, we can
observe the low MC level for Saudi Arabia compared to the other OPEC countries.
MCSaudi Arabia QSaudi Arabia
MCIran QIran
MCVenezuela QVenezuela
MCIraq QIraq
MCNigeria QNigeria
MCIndonesia QIndonesia
MCKuwait
MCLibya QLibya
MCUAE QUAE
MCAlgeria QAlgeria
MCQatar QQatar
Table 2: MC functions for OPEC countries (1982) quantity is measured in mbd.
It is almost impossible to get the exact MC functions because MC depends on many factors, and
we are considering only quantity, and data that we have for MC is also discontinuous. We solve
for all countries‟ Q first and then add over quantities and express this function in terms of MC.
QOPEC QSaudi Arabia QIran QVenezuela QIraq QNigeria QIndonesia QKuwait QLibya QUAE +
QQatar QAlgeria

22
Obviously there are factors that influence the MC to increase (depletion, more expensive oil
fields, etc) and the MC to decrease for instance; better technology, more capital, and intensive
production methods (i.e. the intercept might go more up but slope might be smaller). If we sum
all the factors that affect the MC we expect the increase to be stronger and therefore a 5%
increase/ year might be a good assumption to make.
Where t=0 for 1982
This means will be doubled in 20 years.
7.3 Calculation of optimal Production level for OPEC
We have modified the demand function for crude oil given in Microeconomics (Pindyck &
Rubinfield). Here we are illustrating an example of year 1997. The calculations for other years
(1983, 1992, and 2005) are given in Appendix (A.1).
For year 1997
a=77.2788; b=0.203;
c=2.78; d=2.4; t=15.
Residual demand for OPEC,
23
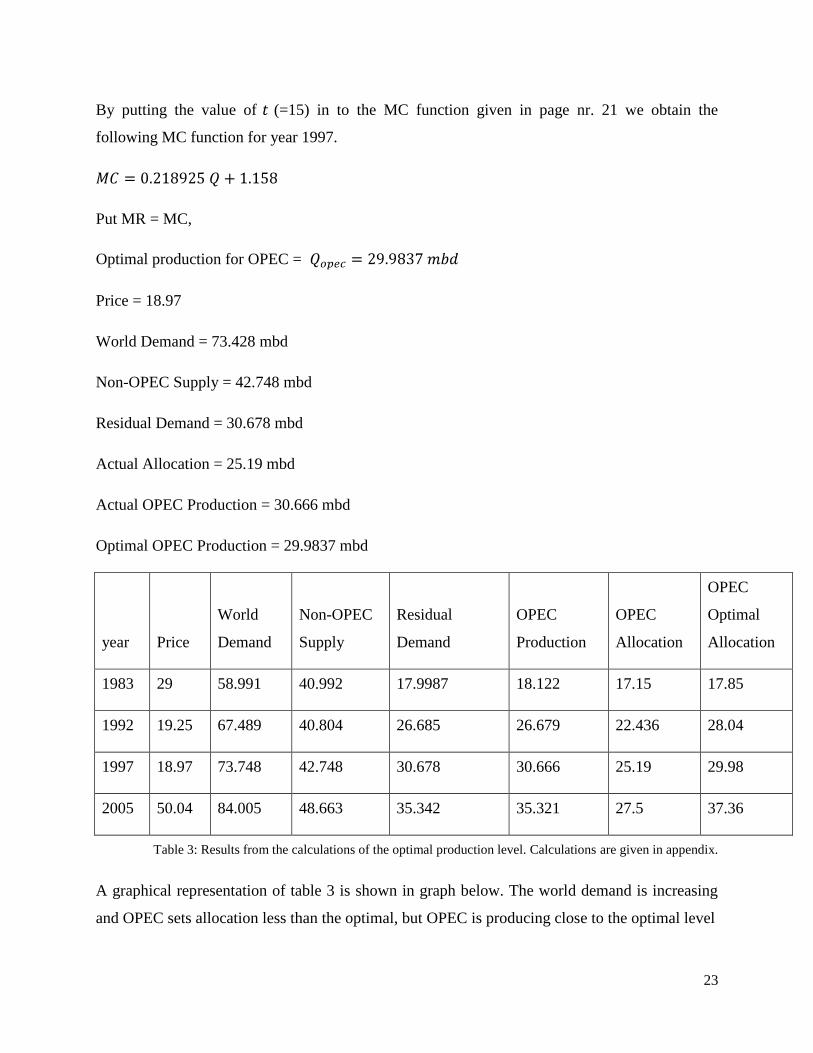
By putting the value of (=15) in to the MC function given in page nr. 21 we obtain the
following MC function for year 1997.
Put MR = MC,
Optimal production for OPEC =
Price = 18.97
World Demand = 73.428 mbd
Non-OPEC Supply = 42.748 mbd
Residual Demand = 30.678 mbd
Actual Allocation = 25.19 mbd
Actual OPEC Production = 30.666 mbd
Optimal OPEC Production = 29.9837 mbd
year Price
World
Demand
Non-OPEC
Supply
Residual
Demand
OPEC
Production
OPEC
Allocation
OPEC
Optimal
Allocation
1983 29 58.991 40.992 17.9987 18.122 17.15 17.85
1992 19.25 67.489 40.804 26.685 26.679 22.436 28.04
1997 18.97 73.748 42.748 30.678 30.666 25.19 29.98
2005 50.04 84.005 48.663 35.342 35.321 27.5 37.36
Table 3: Results from the calculations of the optimal production level. Calculations are given in appendix.
A graphical representation of table 3 is shown in graph below. The world demand is increasing
and OPEC sets allocation less than the optimal, but OPEC is producing close to the optimal level

24
Figure 4: Comparisons in level of production in different years. (Quantities are given in mbd)
7.4 Optimal allocations for OPEC countries
We find MC function of each country depending on quantity, from table 1, and set the MC equal
to MR in order to find the optimal level of production for respective country. We also have the
member countries‟ production allocations i.e. how much the countries in OPEC are allowed to
produce, and finally we have the crude oil production, which is given from the homepage of
OPEC8. Where quantities are in MBD (in million barrels per day) .Following marginal cost
functions are for year 1997.
0
10
20
30
40
50
60
70
80
90
1983 1992 1997 2005
World Demand
Non-OPEC Supply
OPEC-Production
Actual Allocation
Optimal Allocation

25
Where t=15 for 1997
Table.4: Marginal cost functions of OPEC countries in 1997. (Own table based on table 1)
Algeria MC = 3.5862Q + 1.7662
Indonesia MC= 3.2662Q + 1.0475
I.R. Iran MC= 1.7183Q + 1.0969
Iraq MC= 1.7624Q + 1.1222
Kuwait MC= 3.2508Q + 1.1714
S.P. Libyan MC= 3.9053Q + 0.8058
Nigeria MC = 3.2245Q + 0.7663
Qatar MC = 3.8101Q + 2.0202
Saudi Arabia MC = 0.8912Q + 1.2472
U.A.E. MC= 3.7579Q + 1.3027
Venezuela MC = 3.2261Q + 0.3972
26
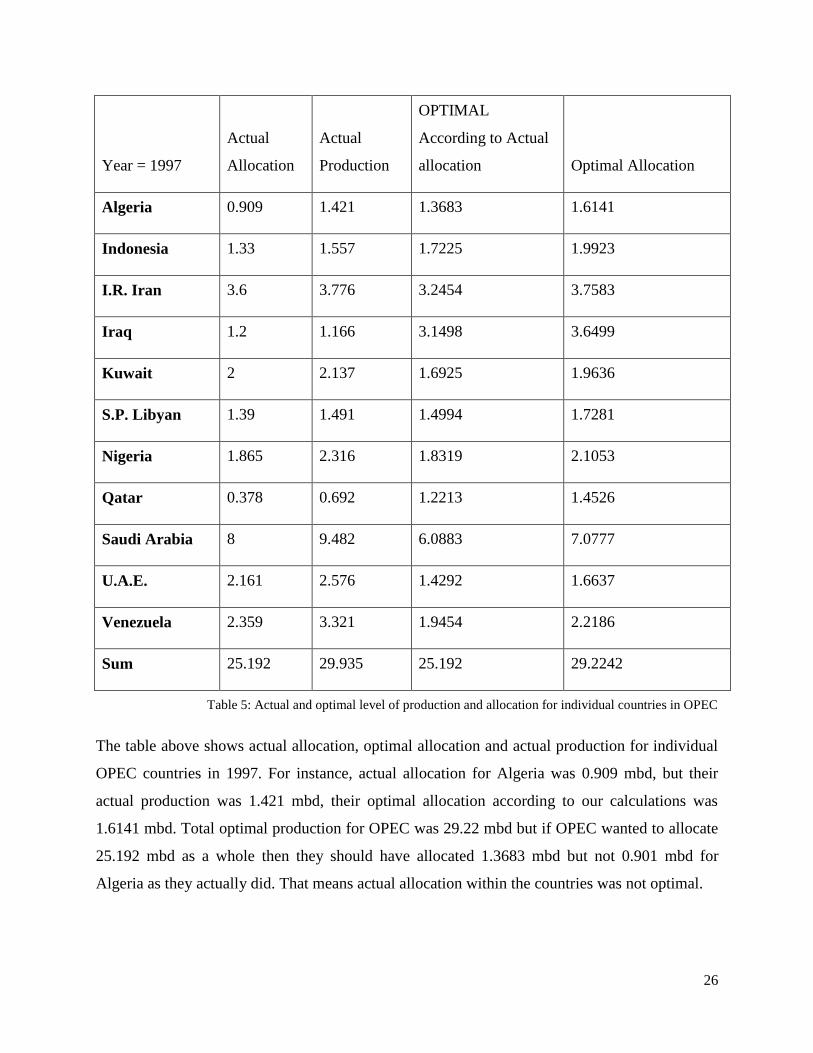
Year = 1997
Actual
Allocation
Actual
Production
OPTIMAL
According to Actual
allocation Optimal Allocation
Algeria 0.909 1.421 1.3683 1.6141
Indonesia 1.33 1.557 1.7225 1.9923
I.R. Iran 3.6 3.776 3.2454 3.7583
Iraq 1.2 1.166 3.1498 3.6499
Kuwait 2 2.137 1.6925 1.9636
S.P. Libyan 1.39 1.491 1.4994 1.7281
Nigeria 1.865 2.316 1.8319 2.1053
Qatar 0.378 0.692 1.2213 1.4526
Saudi Arabia 8 9.482 6.0883 7.0777
U.A.E. 2.161 2.576 1.4292 1.6637
Venezuela 2.359 3.321 1.9454 2.2186
Sum 25.192 29.935 25.192 29.2242
Table 5: Actual and optimal level of production and allocation for individual countries in OPEC
The table above shows actual allocation, optimal allocation and actual production for individual
OPEC countries in 1997. For instance, actual allocation for Algeria was 0.909 mbd, but their
actual production was 1.421 mbd, their optimal allocation according to our calculations was
1.6141 mbd. Total optimal production for OPEC was 29.22 mbd but if OPEC wanted to allocate
25.192 mbd as a whole then they should have allocated 1.3683 mbd but not 0.901 mbd for
Algeria as they actually did. That means actual allocation within the countries was not optimal.

27
8. The results
The values for the optimal production that we have calculated are always higher than the actual
production and actual allocation. In this work we are not considering all the variables which
affect the demand and supply of crude oil, and it is very complex to understand and measure all
the causes like politics, war, financial crisis etc. That is why the calculated optimal values are
always higher than the actual level of production. One of the reasons for the differences in
production levels might be of not using full production capacity.
1983
According to our calculations OPEC did not allocate optimally. Their actual production was
closer to their optimal allocation compared to the actual allocation. One big factor of the cut in
the allocation might be the war between Iran and Iraq which caused instability in the market.
Figure 6: Optimal Vs actual allocation for OPEC countries in 1983
0
1
2
3
4
5
6
7
Optimal Production According
to Actual Allocation
Actual Allocation
1983
28
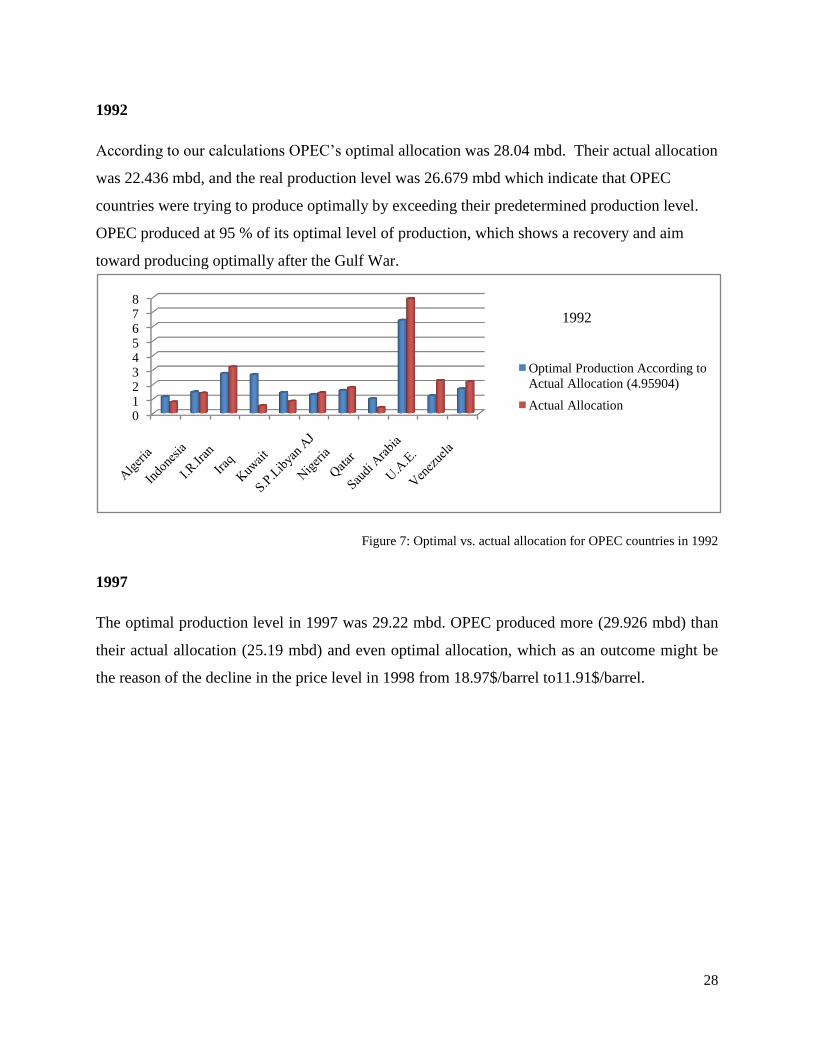
1992
According to our calculations OPEC‟s optimal allocation was 28.04 mbd. Their actual allocation
was 22.436 mbd, and the real production level was 26.679 mbd which indicate that OPEC
countries were trying to produce optimally by exceeding their predetermined production level.
OPEC produced at 95 % of its optimal level of production, which shows a recovery and aim
toward producing optimally after the Gulf War.
Figure 7: Optimal vs. actual allocation for OPEC countries in 1992
1997
The optimal production level in 1997 was 29.22 mbd. OPEC produced more (29.926 mbd) than
their actual allocation (25.19 mbd) and even optimal allocation, which as an outcome might be
the reason of the decline in the price level in 1998 from 18.97$/barrel to11.91$/barrel.
012345678
Optimal Production According to
Actual Allocation (4.95904)
Actual Allocation
1992

29
Figure 8: Optimal vs. actual allocation for OPEC countries in 1997
2005
In 2005 OPEC produced a bit close to its optimal production buy exceeding actual quota. OPEC
produced using it 80.87% of its optimal level of production. In 2005 OPEC decides to increase
production in march from 27 mbd to 27.5 mbd and in June again from 27.5 mbd to 28 mbd due
to increase in price.
Figure 9: Optimal vs. actual allocation for OPEC countries in 1992
0123456789
Optimal Production According
Actual Actual Allocation
(8.0933)
Actual Allocation
2005
0
1
2
3
4
5
6
7
8
Optimal Production According
to Actual Allocation (6.3215)
Actual Allocation
1997

30
Saudi Arabia is producing very unexpectedly , for example in 1983 it was allowed to produce 6
mbd but it produce 4.951 mbd, and in 1995, 1997 and 2005 it produced more than its allocations,
and further from its optimal production , that is why it is called Swing producer. For some years
Saudi Arabia could produce more than it actually produced but it didn‟t. One special thing about
Saudi Arabia is that, its MC is not increasing compared to other countries in preceding years.
Iran is the 2nd
largest oil producer after Saudi Arabia in OPEC. Iran has also changed its
production level of crude oil, but most of the times it was close to its optimal level of production.
Venezuela have also produced more than its optimal and actual quota in past years but in 2005 it
produced less than its actual quota but close to optimal level.
Indonesia is one of the countries for which optimal level of allocation is always higher than its
actual production and allocation except in 1983.
UAE is producing close to its actual allocation but a little more than its optimal allocation.
Nigeria was producing optimally but in recent years it produced more than its allocated and
optimal production.
S.P. Libyan AJ is producing more than its actual quota, but we found that actual allocation is
not optimal.
Kuwait is always producing more than its optimal and actual allocation, and its actual allocation
is more than its optimal production level.
Iraq has produced much less than it can produce. It is due to wars in Iraq, which might be one of
the reasons for price shocks in history.
Algeria is producing more than its actual quota, and its actual quota is always less than its
optimal production.
Qatar is the smallest producer among OPEC countries. In past its production was close to its
actual quota but less from its optimal level of production.

31
1983
1992
Actual
allocation
Actual
Production
Optimal
Allocation
Actual
allocation
Actual
Production
Optimal
Allocation
Price $25,38 $29,00 $29,07 $21,13 $19,25 $18,66
Non-OPEC Quantity 42,717 40,656 41,023 45,004 40,811 39,477
OPEC quantity 17,15 18,122 17,95 22,44 26,679 28,04
1997
2005
Actual
allocation
Actual
Production
Optimal
Allocation
Actual
allocation
Actual
Production
Optimal
Allocation
Price $21,08 $18,97 $19,53 $57,72 $50,04 $48,07
Non-OPEC Quantity 47,809 42,761 44,1 56,352 48,684 46,687
OPEC quantity 25,19 30,666 29,22 27,5 35,321 37,36
Table 7: Production, allocation and optimal level of output in different years for OPEC and non-OPEC countries
(quantities are in mbd).
This last table is summarizing the results we have found by also considering OPEC as a price
setter and if we assume the Non- OPEC countries to produce optimally according to their supply
function.
We can say that for all the years taken into account, the actual allocation is always lower than the
optimal allocation level. The actual production is always higher than the actual allocation which
is an indication of OPEC countries‟ intention to produce optimally for profit maximization. For
year 1983 and 1997, the production level is higher than the optimal level and vice versa for year
1992 and 2005 where the production level was lower than OPEC‟s optimal production.

32
9. Optimal allocation for OPEC with different MC for Saudi Arabia
The actual allocation for Saudi Arabia in year 1997 was 8 mbd, but their actual production was
9.482 mbd. According to our calculation their optimal allocation should have been 7.0777 mbd.
We might have overestimated the MC function for Saudi Arabia. In the next section we will
recalculate the optimal level of all the OPEC countries with a lower percentage increase for
Saudi Arabia.
In the first case MC was increased for each country with the same proportion every year. If we
assume that MC of OPEC is increasing with 5% every year, (from the assumption that OPEC‟s
MC is doubled in 20 years) then we can also assume that MC of Saudi Arabia is not increasing
with the same proportion as the other members‟, because of the low-cost condition. We are
assuming an increase of 2-3 %, which in average gives a 2.5% increase every year. In this case
we have calculated the optimal production for Saudi Arabia with a lower percentage increase in
order to find more accurate numbers, which also coincides with the actual production levels.
MC is increased with 2.5% for Saudi Arabia while the other member countries‟ MC‟s remains
the same.
Year Price
Actual
Allocation
Actual
Production
Old Optimal
Allocation
New Optimal
Allocation
1983 29 6.075 4.951 4.2727 4.21
1992 19.25 7.887 8.3317 6.4503 6.39
1997 18.97 8 9.482 6.7464 7.48
2005 50.04 8.937 11.09 8.2701 8.69
Table 6: Optimal allocations for Saudi Arabia with different MC functions.
We have found that optimal production for Saudi Arabia is more when increase in MC is 2.5 %
compare to optimal production with 5 % increase per year in MC. This is also correct according
to theory because if MC of Saudi Arabia is increasing less compare to other countries in OPEC
then it is cheaper to produce more in Saudi Arabia.

33
Saudi Arabia is called a swing producer because of the voluntary changes in the production
levels in different years in order to stabilize the price. In 1983 Saudi was allowed to produce 6.07
MBD but reduced their production to 4.9 MBD, on the other hand in 2005 Saudi Arabia was
allowed to produce 8.937 MBD but they produced 11.09 MBD which is close to their actual
production, according to our calculations. The reason for Saudi Arabia‟s behavior is to balance
the oil market. Most of the extra oil produced was to satisfy the demand by the U.S military
forces in the war against Iraq.
If we assume that allocation of Saudi Arabia is optimal then their MC is not increasing at the
same level every year, in fact in real life it is correct, because, level of reserves change each year.
We have estimated the MC of Saudi Arabia from table 1, and it is less than other OPEC
countries because of high level of reserves which make it easy to find and drill more oil, which is
an indication of the lower percentage increase in this specific country-in this case Saudi Arabia.
“The three biggest Persian Gulf countries, Saudi Arabia, Iran, and Iraq can potentially supply
50% of oil in world trade. If they cooperate with each other, as they have in the past, they could
dominate the world oil market.” (Momayezi 2006, p. 1412).
One of the three biggest oil producing countries, Saudi Arabia has a big influence on the world
oil market because of high level and easy reach of crude oil reserves compared to other oil
producing countries. Optimal allocation that we have found with 2.5 % increase in MC for Saudi
Arabia is closer to the actual allocation, for Saudi Arabia individually and OPEC as a whole, we
can compare the results from the following table except for year 1983 for Saudi Arabia, and in
2005 for Iraq, because of the war.
OPEC‟s optimal allocation with 2.5% MC for Saudi and 5% for rest of the OPEC‟s countries:

34
Figure 5: Optimal vs. actual allocation for individual OPEC countries, with different percentage growth for Saudi
Arabia.
012345678
Optimal Production According to
Actual Allocation (6.3215)
Actual Allocation
Change in MC of
Saudi 2.5% per year
and for other
countries 5 %
1997

35
10. Summary and Conclusions
The oil market has a complex structure to understand. The demand and supply functions used in
this paper are considering the quantity and price; the time factor is also included in the marginal
cost function. We have not considered the other variables such as GDP, war, financial crises, etc.
which also could give us more accurate and realistic figures but these were limited in order to
reduce the complexity.
OPEC have 11 member countries today, the price is not set by the organization as assumed by
the theory because of not having market power, which indicates they don‟t have the control of
the price level.
According to our calculations, and to the common characteristics, OPEC is not allocating
optimally but countries are trying to produce close to their optimal level of production. Also
OPEC does not have a complete control of the price as it is supposed to be in a cartel. One
reason for not allocating optimally might be due to the cheating of the OPEC member countries.
The reason for allocating less than their optimal level might be because of the acquaintance of
cheating in OPEC‟s history, so the allocation level was held low compared to the optimal level in
order to keep the actual allocation close to the optimal allocation.
OPEC has a significant share of the crude oil market as a cartel should have, but we will also
mention that the market share of the organization has been decreasing from almost 50% to 40%
since the 1970‟s.

36
11. References
Alhajji, A F & Huettner D (2000b), The Energy Journal 21 (3), OPEC and World Crude Oil
Markets from 1973 to 1994: Cartel, Oligopoly, or Competitive.
Alhajji, A F & Huettner D 2000a, „OPEC and world crude oil from 1973 to 1994: Cartel,
Oligopoly or Competitive?’ The Energy Journal, June,
<http://entrepreneur.com/tradejournals/article/64398086_1.html>
Carlton D W & Perloff J M 2004, Modern Industrial Organization, 4th
edn, Addison Wesley.
Connors, J 2009, „Offshore drilling: worth the oil, or false hope‟, SCIENCE & TECNOLOGY, 18
February, <http://www.treehugger.com/files/2009/02/offshore-drilling-oil-false-hope.php>.
Dahl, C & Yücel M 1999, „Testing Alternative Hypotheses of Oil Producer Behavior‟, The
Energy Journal 12(4).
Erickson, N 1980, "Developments in the World Oil Market.", International Energy Studies by
Pachauri R, Wiley and Sons, New York.
Griffin, J. M. 1985, “OPEC Behavior: A Test of Alternative Hypotheses.” American Economics
Review, 75(5), p. 954-963.
Griffin, J M & Teece, D J 1982, OPEC behaviour and world prices, Alien & Unwin, London.
Gülen S G 1996, Is OPEC a Cartel? Evidence from Cointegration and Causality Tests
Department of Economics ,Boston College ,Chestnut Hill, MA 02167 ,May 1996.
Hansen P V & Lindholt L 2004, „The market power of OPEC 1973-2001‟, Discussion Papers
No. 385, Statistics Norway, Research Department.
Leonard, T M 2006,‟Oversupply and OPEC‟ by Nasser Momayezi, ENCYCLOPEDIA OF THE
DEVELOPING WORLD, vol. A-E INDEX, Taylor & Francis, p. 1412.
Mabro, R 1975, “Can OPEC Hold the Line”, OPEC and the World Oil Market: The Genesis of
the 1986 Price Crisis, Oxford Institute for Energy Studies.
37
Organization of the Oil Exporting Countries, 2009, Internet Activity, Austria, March 2009,
Frequently Asked Questions, p. 3, Organization of the Oil Exporting Countries, Vienna.
<http://www.opec.org/library/what%20is%20OPEC/FAQ.pdf>.
Papahristodoulou, C 1987, ‘SALTER’s Model to predict the Price of Oil by the Year 2000’,
October, p. 2.
Pindyck, R S & Rubinfield D L 2004, Microeconomics, 6th
edn, Prentice Hall.
Zycher, B, „OPEC‟, THE CONCISE ENCYCLOPEDIA OF ECONOMICS,
http://www.econlib.org/library/Enc/OPEC.html
Web references:
http://www.opec.org/aboutus/history/history.htm.
http://wps.aw.com/aw_carltonper_modernio_4/0,9313,1424964-content,00.html
http://entrepreneur.com/tradejournals/article/64398086_1.html
http://www.opec.org/home/PowerPoint/Reserves/OPEC%20share.htm
http://www.opec.org/library/FAQs/aboutOPEC/q13.htmS
http://www.opec.org/library/Annual%20Statistical%20Bulletin/pdf/ASB2007.pdf
http://www.opec.org/library/Annual%20Statistical%20Bulletin/pdf/ASB2007.pdf, p.6 and
http://www.opec.org/library/Annual%20statistical%20Bulletin/pdf/AB002002.pdf, p.10
http://www.opec.org/library/Annual%20Statistical%20Bulletin/interactive/FileZ/Main.htm
http://www.bp.com/liveassets/bp_internet/globalbp/globalbp_uk_english/reports_and_publicatio
ns/statistical_energy_review_2008/STAGING/local_assets/downloads/pdf/statistical_review_of_
world_energy_full_review_2008.pdf
http://www.ioga.com/Special/crudeoil_Hist.htm

38
Appendix
A-1
Calculation for optimal level of production for OPEC:
(Pindyck & Rubinfield 2004, p.53)
, , =
1983
Residual demand for OPEC
Put MR = MC
Optimal production for OPEC =
Price = 29
World demand = 58.991 mbd
Actual Allocation = 17.15 mbd
Actual production = 18.122 mbd
Non-OPEC supply = 40.992 mbd
Residual Demand = 17.9987 mbd

39
Actual OPEC Production = 18.122 mbd
Optimal OPEC Production = 17.95 mbd
OPEC cut their quota allocation during 1982 to 1986 from 17.15 MBD to 14.58 MBD, in order
to increase the price, but OPEC didn‟t succeed because some OPEC countries produced more
than their allocations. Saudi Arabia tried to stop prices to fall down during this period by
producing less than its quota, but in beginning of august 1988 Saudi Arabia increased its
production from 3.9 MBD to 5.1 MBD and linked their oil prices to the spot market (Frederick
F.Ntido, Nigeria‟s Production Quota and Membership of OPEC – A Critical Analysis.
<http://geplaw.com/oil_gas.htm>); as a result price fell down from 26.5 to 14.64.
1992
Residual demand for OPEC
Put MR = MC
We get
Optimal production for OPEC =
Price = 19.25
World Demand = 67.489 mbd
Non-OPEC Supply = 40.804 mbd

40
Actual Allocation = 22.436 mbd
Actual Production = 26.6858 mbd
Optimal OPEC Production = 28.04 mbd
Oil prices increased in 1996 from 16.75 to 20.46 and OPEC allocation was 25 MBD but they
produced 27 MBD and then that increased from 25 to 28 MBD in 1998. This was the time for
increase in demand of oil because of strong economy in US and Asia.
2005
Residual demand for OPEC
Put MR = MC
In 2005 oil price increase from 34 to 50 that gives the incentives to OPEC countries and they
produced 35 MBD while allocation was 25 MBD.
World Demand = 84.005 mbd
Non-OPEC Supply = 48.663 mbd
Residual Demand =35.342 mbd

41
Actual Allocation = 27.5 mbd
Actual Production = 35.321 mbd

42
A-2
Optimal and Actual Production for OPEC with change in MC of Saudi 2.5% per year and
for other countries 5 %:
Table 8: Optimal allocations for individual OPEC countries in different years.
1983 1983 1992 1992 1997 1997 2005 2005
Country
Optimal
Allocation
for each
country
according
to total
actual
allocation
Actual
Allocation
Optimal
Allocation
for each
country
according
to total
actual
allocation
Actual
Allocation
Optimal
Allocation
for each
country
according
to total
actual
allocation
Actual
Allocation
Optimal
Allocation
for each
country
according
to total
actual
allocation
Actual
Allocation
Algeria 0.8692 0.6875 1.12 0.76 1.242 0.75 1.34 0.878
Indonesia 1.1744 1.3 1.45 1.37 1.584 1.33 1.7 1.425
I.R. Iran 2.2036 1.8 2.73 3.18 2.982 3.6 3.2 4.037
Iraq 2.134 1.2 2.65 0.51 2.893 1.2 3.1 0
Kuwait 1.1418 0.925 1.42 0.81 1.553 2 1.67 2.207
Libya 1.042 0.925 1.27 1.4 1.384 1.39 1.48 1.473
Nigeria 1.2768 1.3 1.56 1.75 1.692 1.865 1.81 2.265
Qatar 0.7515 0.3 0.99 0.38 1.103 0.378 1.2 0.713
Saudi 4.2133 6.075 6.39 7.89 7.485 8 8.69 8.937
U.A.E. 0.9528 1.05 1.19 2.24 1.309 2.161 1.41 2.4
Venezuela 1.3906 1.5875 1.67 2.15 1.805 2.359 1.92 3.165
Sum 17.15 17.15 22.4 22.4 25.03 25.03 27.5 27.5

43
A-3
MC functions for OPEC Countries:
y = 0.5093x + 0.7127
0
0.5
1
1.5
2
2.5
3
0 2 4
Saudi Arabia
Saudi
Linear
(Saudi)
y = 0.9819x + 0.6268
0
1
2
3
4
5
6
0 2 4
Iran
Iran
Linear
(Iran)
y = 1.0071x + 0.6413
0
1
2
3
4
5
6
0 2 4
Iraq
Irak
Linear
(Irak)
Linear
(Irak)
y = 1.8435x + 0.227
0
1
2
3
4
5
6
7
8
0 2 4
Venezuela
Venez
Linear
(Venez)

44
y = 1.8426x + 0.4379
0
1
2
3
4
5
6
7
8
0 2 4
Nigeria
Nigeria
Linear
(Nigeria)
y = 1.8664x + 0.5986
0
1
2
3
4
5
6
7
8
9
0 2 4
Indonesia
Indone
Linear
(Indone)
y = 1.8576x + 0.6694
0
2
4
6
8
10
0 2 4
Kuwait
Kuwait
Linear
(Kuwait)
y = 2.2361x + 0.4605
0
2
4
6
8
10
0 2 4
Libya
Libyea
Linear
(Libyea)
45
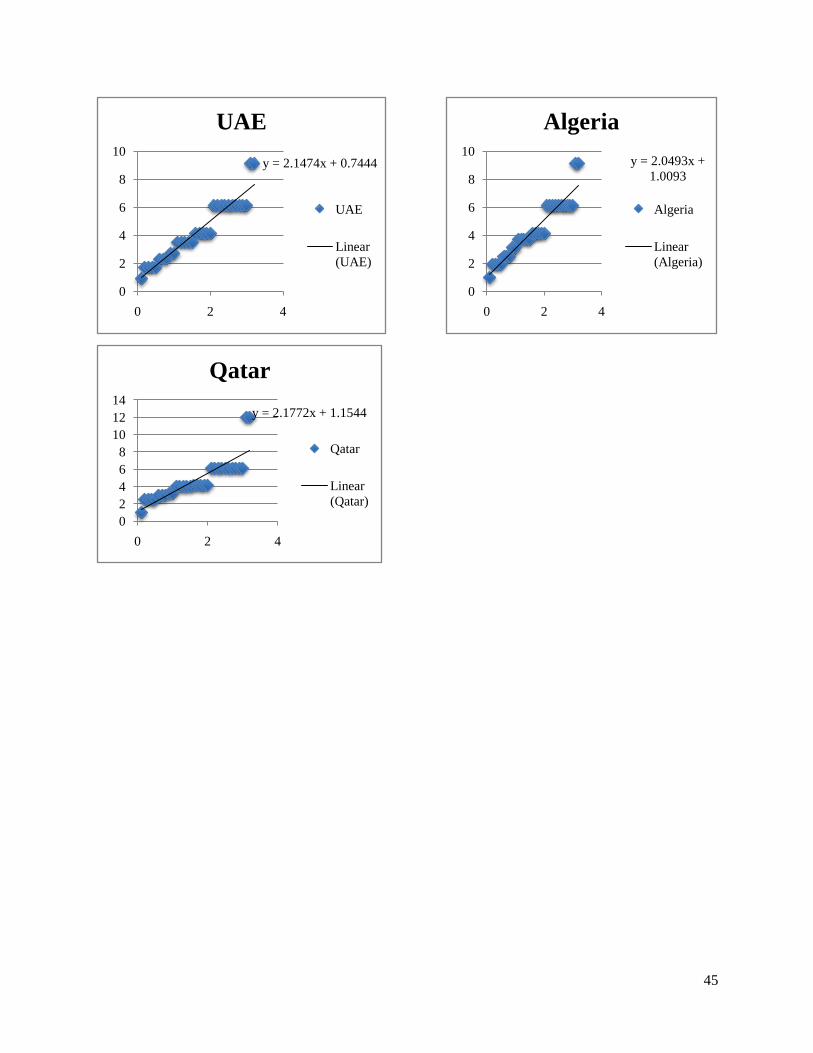
y = 2.1474x + 0.7444
0
2
4
6
8
10
0 2 4
UAE
UAE
Linear
(UAE)
y = 2.0493x +
1.0093
0
2
4
6
8
10
0 2 4
Algeria
Algeria
Linear
(Algeria)
y = 2.1772x + 1.1544
0
2
4
6
8
10
12
14
0 2 4
Qatar
Qatar
Linear
(Qatar)

46
A.4
MC of OPEC countries in 1982 with respective levels of production in 100,000 b/d .
Production Saudi Iran Iraq Venez Nigeria Indonesia Kuwait Libya UAE Algeria Qatar
0,1 0,9 0,9 0,9 0,9 0,9 0,9 0,9 0,9 0,9 1 1
0,2 0,9 0,9 0,9 0,9 1 1,2 0,9 1,6 1,7 1,9 2,5
0,3 0,9 0,9 0,9 1 1 1,2 1,5 1,6 1,7 1,9 2,5
0,4 0,9 0,9 0,9 1 1 1,2 1,5 1,6 1,7 1,9 2,5
0,5 0,9 0,9 0,9 1 1 1,2 1,5 1,6 1,7 1,9 2,5
0,6 1 1,2 1,3 1,5 1,7 1,9 2 2,1 2,3 2,5 3
0,7 1 1,2 1,3 1,5 1,7 1,9 2 2,1 2,3 2,5 3
0,8 1 1,2 1,3 1,5 1,7 2,5 2 2,1 2,3 2,5 3
0,9 1 1,8 1,8 2,1 2,3 2,5 2,5 2,5 2,7 3,1 3,2
1 1 1,8 1,8 2,1 2,3 2,5 2,5 2,5 2,7 3,1 3,2
1,1 1,4 2 2 2,6 2,8 2,9 2,9 2,9 3,5 3,7 4
1,2 1,4 2 2 2,6 2,8 2,9 2,9 2,9 3,5 3,7 4
1,3 1,4 2 2 2,6 2,8 2,9 2,9 2,9 3,5 3,7 4
1,4 1,4 2 2 2,6 2,8 2,9 2,9 2,9 3,5 3,7 4
1,5 1,6 2 2 2,6 2,8 2,9 2,9 2,9 3,5 3,7 4
1,6 1,6 2,4 2,5 3 3,5 3,8 4,1 4,1 4,1 4,1 4,1
1,7 1,6 2,4 2,5 3 3,5 3,8 4,1 4,1 4,1 4,1 4,1
1,8 1,6 2,4 2,5 3 3,5 3,8 4,1 4,1 4,1 4,1 4,1
1,9 1,6 2,4 2,5 3 3,5 3,8 4,1 4,1 4,1 4,1 4,1
2 1,6 2,4 2,5 3 3,5 3,8 4,1 4,1 4,1 4,1 4,1
2,1 2 2,8 2,9 3 5,1 5,1 5,1 6,1 6,1 6,1 6,1
2,2 2 2,8 2,9 5,1 5,1 5,1 5,1 6,1 6,1 6,1 6,1
2,3 2 2,8 2,9 5,1 5,1 5,1 5,1 6,1 6,1 6,1 6,1
2,4 2 2,8 2,9 5,1 5,1 5,1 5,1 6,1 6,1 6,1 6,1
2,5 2 2,8 2,9 5,1 5,1 5,1 5,1 6,1 6,1 6,1 6,1
2,6 2 2,8 2,9 5,1 5,1 5,1 5,1 6,1 6,1 6,1 6,1
2,7 2 2,8 2,9 5,1 5,1 5,1 5,1 6,1 6,1 6,1 6,1
2,8 2 2,8 2,9 5,1 5,1 5,1 5,1 6,1 6,1 6,1 6,1
2,9 2 2,8 2,9 5,1 5,1 5,1 5,1 6,1 6,1 6,1 6,1
3 2 2,8 2,9 5,1 5,1 5,1 5,1 6,1 6,1 6,1 6,1
3,1 2,5 5,1 5,1 7,1 7,1 8,1 8,1 9,1 9,1 9,1 12

47


![Pthreads and OpenMP - DiVA portal944063/FULLTEXT02.pdf · • C is procedural i.e it has support for functions[9]. • C has support for dynamic memory allocation and de-allocation](https://img.pdfslide.us/doc/110x75/5eba02e49d8a8539f72a14d1/pthreads-and-openmp-diva-944063fulltext02pdf-a-c-is-procedural-ie-it-has.jpg)