Embed Size (px)
Citation preview

IS NOW A GOOD TIME TO LOOK AT EMERGING MARKET DEBT?
OCTOBER 2018
L. BRYAN CARTER

2
Not your father’s benchmark
Sources: BNP Paribas AM, JP Morgan Global Index, October 2018
Estimated index weights provided by JP Morgan
JPM EMBI Global Diversified Hard Currency Index
Top 5 Countries (%)

3
EMFI a large and well established asset class
Sources: JP Morgan, Bloomberg, end May 2018
2000 2009 2018 YTD
EM local market Corporates 0 1.975 7.793
EM Local Market Sovereigns 204 4.367 8.380
EM External Sovereign 0 481 1.070
EM External Corporates 120 605 2.169
0
2.000
4.000
6.000
8.000
10.000
12.000
14.000
16.000
18.000
20.000
US
D B
illio
n
EM Debt Outstanding

EMFI sub-asset class returns – Dispersion increasing as
market matures
4
Source: JP Morgan, October 2018Past performance is not indicative of current or future performance.
-40%
-20%
0%
20%
40%
60%
80%
100%
2004 2005 2006 2007 2008 2009 2010 2011 2012 2013 2014 2015 2016 2017 2018YTD July
EMFI sub-asset class returns - High level of dispersion
EM USD Government Debt returns EM USD Corporate Debt returns
EM Local Currency Government Debt returns (USD unhedged) EM Local Currency Government Debt returns (USD hedged)
0%
20%
40%
60%
80%
100%
120%
2004 2005 2006 2007 2008 2009 2010 2011 2012 2013 2014 2015 2016 2017 2018
EM Local Currency – Quantile Dispersion
Top/Bottom 10% Return Dispersion

Three themes for 2019:
1) China is about to change
everything
5

Positive steps policymakers to open up capital market
October
2016
March
2017
June 2017
July 2017
November
2017
• Inclusion in the IMF Special Drawing Rights (SDR) basket
• Bloomberg Barclays launched a new Global Aggregate + China index, as well as EM + China
indices
• Citigroup announced that it would include China’s bonds in Emerging Market and Regional
indices
• MSCI announced that it would include China A-shares in the MSCI Emerging Markets Index
• Launch of the Bond Connect program for easier access to the onshore bond market by
offshore investors
• International credit rating agencies given access to rate onshore issuers
• PBOC issued detailed operational guidance for foreign investors’ onshore RMB bond
investments, including on account registration, settlements and tax rates
• China announced further opening up of its capital account by reducing limits around foreign
ownership in select finance businesses, as well as reducing tariffs on certain sectors
6
Source: BNPP AM, March 2018
March
2018
• Bloomberg announced that it would include onshore Chinese government and policy bank
bonds in the Bloomberg Barclays Global Aggregate Bond Index beginning in April 2019,
phased over 20 months, conditional upon resolving certain operational aspects
IMF -= International Monetary Fund; EM = Emerging Markets; PBoC = People’s Bank of China
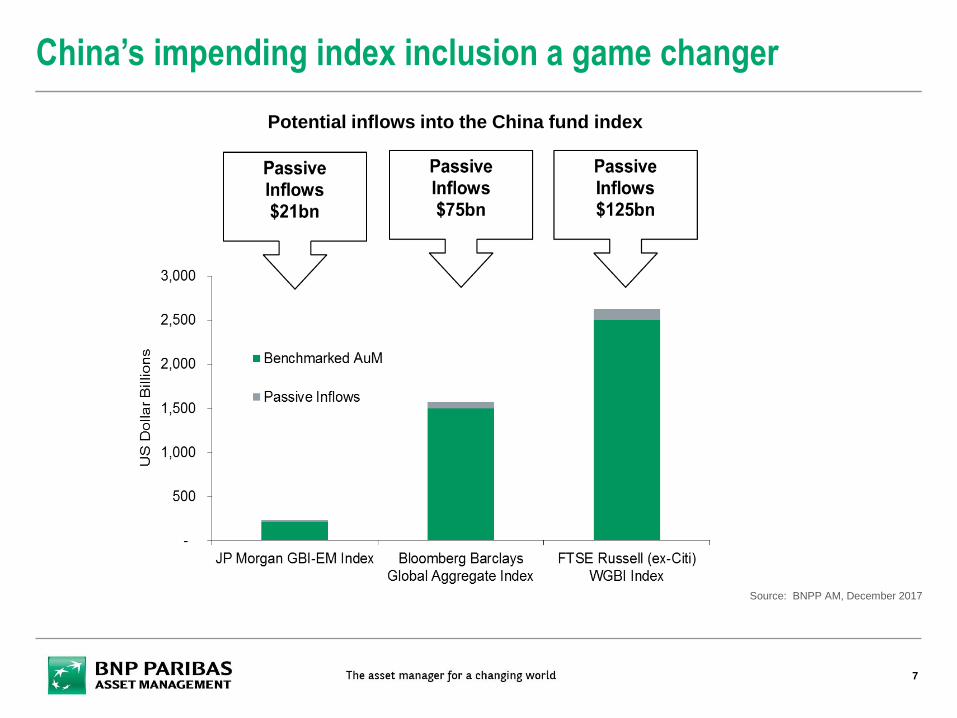
China’s impending index inclusion a game changer
7
Source: BNPP AM, December 2017
Potential inflows into the China fund index

Scale of Onshore Chinese bond market
8
Source: BNPP AM, Wind, April 2018CP = Commercial Paper; SCP = Super & short-term commercial paper; NCD = Negotiable Certificate of Deposit;
MTN = Medium term notes; PPN = Private placement notes

Foreign ownership of China onshore bonds
Foreign ownership of China onshore bonds
9
Source: PBOC, ChinaBond, JP Morgan, August 2018
Three themes for 2019:
2) GCC injects quality back into
the asset class
10

Regional Breakdown before and after inclusion of
GCC Countries
11
Source: BNP Paribas, JP Morgan EMGI Global
Diversified Index, October 2018
Latam37%
Europe25%
Middle East6%
Asia20%
Africa12%
Current Weight %
Latam32%
Europe22%
Middle East18%
Asia17%
Africa11%
Estimated Weights, inclusive of GCC

GCC Investments
12
Source: BNP Paribas, JP Morgan EMGI Global
Diversified Index, October 2018
• EMBI Index Inclusion in 2019: Saudi Arabia (3.1%), Qatar (2.7%), United Arab
Emirates (UAE, 2.6%), Kuwait (2.1%) & Bahrain (0.8%)
• Represents approximately 11.2% of index - $111billion face amount outstanding
from 15 eligible issuers
• EMBI Index will increase to 72 countries (from 67 countries), increasing
diversification
• Meaningful spread tightening (c.21bps) while the investment grade weight of
the index increases to 60% (though the average rating remains at BB+)
• Phased inclusion over 9 months

Three themes for 2019:
3) There is a debt crisis in EM
13

Frontier debt under pressure
14
Source: BNP Paribas, JP Morgan, October 2018
Four Sovereign defaults over the past 1.5 years:
• Venezuela
• Mozambique
• Congo
• Barbados
EM Sovereign historical defaults
HIPC & G7 debt
relief initiatives

EMBI Global Diversified Index
15
Source: BNP Paribas, JP Morgan,
October 2018
*Countries we consider “default candidates”
Country Mkt Cap % IG or HY "Default Candidates"
Mexico 5.2 IG
China 4.5 IG
Indonesia 4.3 IG
Russia 3.5 IG
Philippines 3.3 IG
Turkey 3.3 HY
Brazil 3.1 HY
Colombia 3.0 IG
Panama 2.9 IG
Peru 2.9 IG
Kazakhstan 2.8 HY
Chile 2.8 IG
Argentina 2.8 HY
Hungary 2.8 IG
South Africa 2.7 HY
Dominican Republic 2.7 HY
Malaysia 2.6 IG
Oman 2.6 IG
Ukraine 2.6 HY *Ecuador 2.5 HY
Egypt 2.5 HY
Uruguay 2.5 IG
Lebanon 2.3 IG
Poland 2.1 IG
Sri Lanka 2.0 HY
Country Mkt Cap % IG or HY "Default Candidates"
Croatia 1.7 HY
Nigeria 1.5 HY
Romania 1.4 IG
Azerbaijan 1.2 HY
El Salvador 1.1 HY
Pakistan 1.1 HY
Costa Rica 1.1 HY
Jamaica 1.1 HY
Angola 1.0 HY *Lithuania 1.0 IG
India 1.0 IG
Venezuela 0.9 HY *Cote D'Ivoire 0.8 HY
Ghana 0.8 HY
Kenya 0.7 HY
Serbia 0.7 HY
Paraguay 0.7 HY
Mongolia 0.7 HY *Iraq 0.7 HY
Jordan 0.5 HY
Guatemala 0.5 HY
Senegal 0.4 HY
Morocco 0.4 HY
Zambia 0.4 HY *Trinidad And Tobago 0.4 HY
Country Mkt Cap % IG or HY "Default Candidates"
Gabon 0.4 HY *Belarus 0.4 HY
Bolivia 0.4 HY
Honduras 0.4 HY
Vietnam 0.3 HY
Slovakia 0.3 IG
Namibia 0.2 HY
Georgia 0.2 HY
Armenia 0.2 HY
Ethiopia 0.2 HY
Tunisia 0.2 HY
Cameroon 0.2 HY
Latvia 0.1 IG
Mozambique 0.1 HY *Suriname 0.1 HY
Tajikistan 0.1 HY
Belize 0.1 HY *Congo N/A HY *
Investment Grade 51.3
High Yield 48.7

In Conclusion
16
• For the first time in years, the asset class is alpha-rich
• Can outperform by avoiding blow-ups!
Source: BNP Paribas, October 2018

Recent EMFI Market Performance
and Flows Update
17
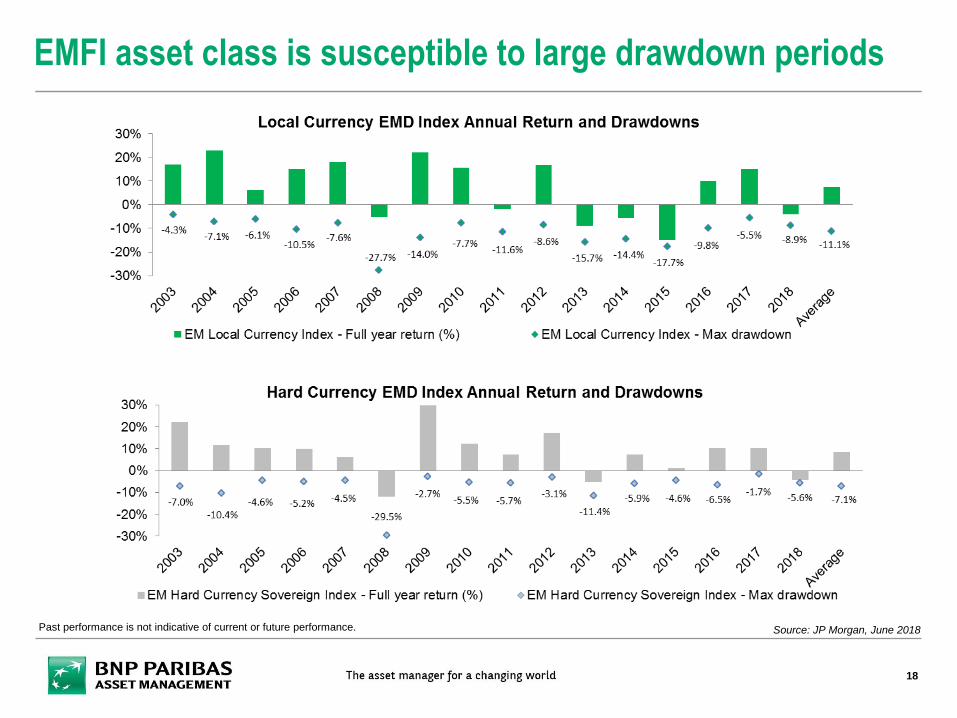
EMFI asset class is susceptible to large drawdown periods
18
Source: JP Morgan, June 2018Past performance is not indicative of current or future performance.

EMFI asset class selloff broad based in 2018 YTD
19
EMFI = Emerging Market Fixed Income; YTD = Year to Date
Source: BNP Paribas AM, JP Morgan, end September 2018Past performance is not indicative of current or future performance.
VIX Spike
EM Growth
Shock
Turkey &
Argentina
Contagion

8,0%
10,0%
12,0%
14,0%
16,0%
18,0%
20,0%
22,0%
24,0%
26,0%
28,0%
2007 2008 2009 2010 2011 2012 2013 2014 2015 2016 2017 2018
Recent EMFI outflows; foreign ownership has fallen
20
EM Foreign ownership of EMFI
ex China local curency government bonds: weighted average
% of amount outstanding
Source: JP Morgan, official sources, August 2018
Annual foreign purchases of EMFI
ex China local currency government bonds
USD billion, by region
Source: JP Morgan, official sources, August 2018
High 27.4%
Current 24.4%
-40
-20
0
20
40
60
80
100
120
140
160
2007 2008 2009 2010 2011 2012 2013 2014 2015 2016 2017 2018
Latin America EMEA EM EM Asia (ex China)
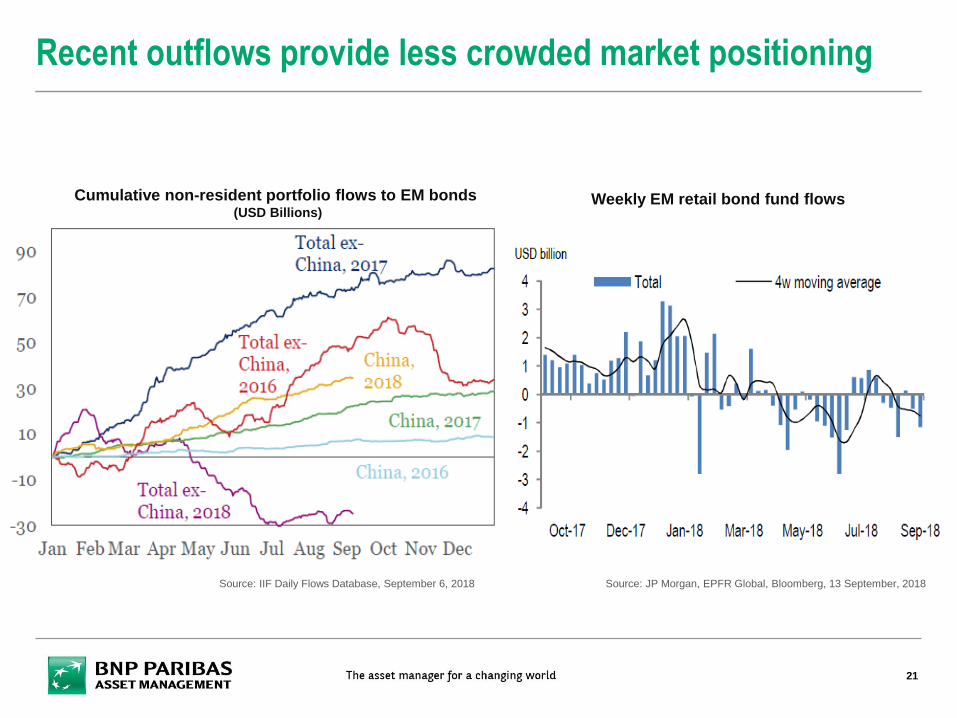
Recent outflows provide less crowded market positioning
21
Weekly EM retail bond fund flows
Source: IIF Daily Flows Database, September 6, 2018 Source: JP Morgan, EPFR Global, Bloomberg, 13 September, 2018
Cumulative non-resident portfolio flows to EM bonds (USD Billions)

EM proportion in global funds well below peak levels
22
Emerging vs. Mature Markets: Fund Portfolio Weights
Source: EPFR, IIF estimates; includes mutual funds and ETFs August 2018
LHS: Left Hand Side; RHS: Right Hand Side
10
11
12
13
14
15
16
17
18
19
20
81
82
83
84
85
86
87
88
89
90
2008 2010 2012 2014 2016 2018
% of global bond/equity allocation
Emerging markets (RHS)
Mature markets (LHS)

INTEGRATING ESG
23

24
SSocial
GInstitutions
• Renewables on
energy ratio• Corruption
perceptions index
• Press freedom
index
• School enrolment
gender parity index
• Internet access
ratio
EEnvironmental
Factors included in proprietary ESG screen for EMFI
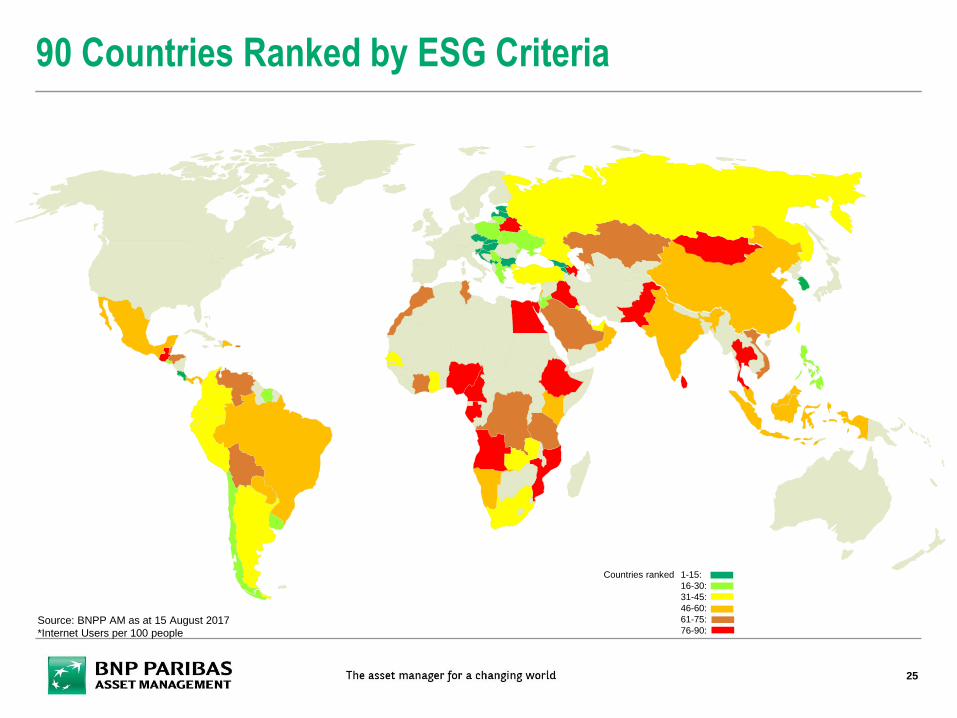
90 Countries Ranked by ESG Criteria
Source: BNPP AM as at 15 August 2017
*Internet Users per 100 people
Countries ranked 1-15:
16-30:
31-45:
46-60:
61-75:
76-90:
25

90 Countries Ranked by ESG Criteria
16
URUGUAY
SSocial
GInstitutions
• Renewables on
energy ratio(%):
18.94
• Corruption
perceptions index
(rank): 21
• Press freedom
index (rank): 20
• School enrolment
gender parity
index: 0.98
• Internet access
ratio*: 64.6
EEnvironmental
Countries ranked 1-15:
16-30:
31-45:
46-60:
61-75:
76-90:Source: BNPP AM as at 15 August 2017
*Internet Users per 100 people
26

90 Countries Ranked by ESG Criteria
90
ANGOLA
Countries ranked 1-15:
16-30:
31-45:
46-60:
61-75:
76-90:
SSocial
GInstitutions
• Renewables on
energy ratio(%):
2.95
• Corruption
perceptions index
(rank): 164
• Press freedom
index (rank): 123
• School enrolment
gender parity
index: 0.64
• Internet access
ratio*: 12.4
EEnvironmental
Source: BNPP AM as at 15 August 2017
*Internet Users per 100 people
27
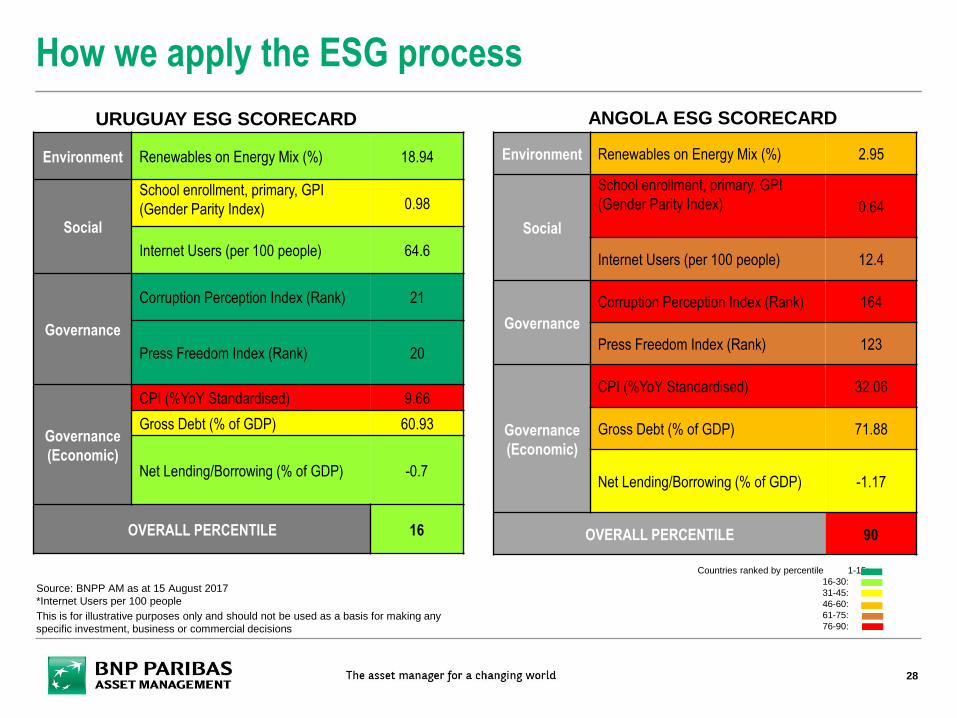
How we apply the ESG process
Environment Renewables on Energy Mix (%) 18.94
Social
School enrollment, primary, GPI
(Gender Parity Index) 0.98
Internet Users (per 100 people) 64.6
Governance
Corruption Perception Index (Rank) 21
Press Freedom Index (Rank) 20
Governance
(Economic)
CPI (%YoY Standardised) 9.66
Gross Debt (% of GDP) 60.93
Net Lending/Borrowing (% of GDP) -0.7
OVERALL PERCENTILE 16
Countries ranked by percentile 1-15:
16-30:
31-45:
46-60:
61-75:
76-90:
Environment Renewables on Energy Mix (%) 2.95
Social
School enrollment, primary, GPI
(Gender Parity Index) 0.64
Internet Users (per 100 people) 12.4
Governance
Corruption Perception Index (Rank) 164
Press Freedom Index (Rank) 123
Governance
(Economic)
CPI (%YoY Standardised) 32.06
Gross Debt (% of GDP) 71.88
Net Lending/Borrowing (% of GDP) -1.17
OVERALL PERCENTILE 90
URUGUAY ESG SCORECARD ANGOLA ESG SCORECARD
This is for illustrative purposes only and should not be used as a basis for making any
specific investment, business or commercial decisions
Source: BNPP AM as at 15 August 2017
*Internet Users per 100 people
28
29
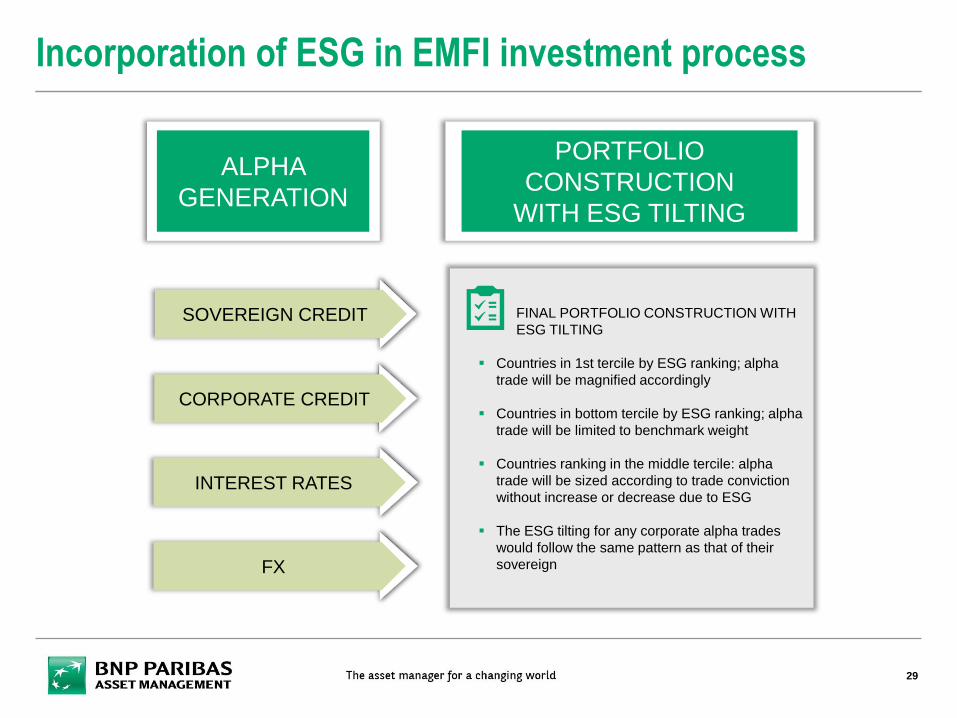
FINAL PORTFOLIO CONSTRUCTION WITH
ESG TILTING
Countries in 1st tercile by ESG ranking; alpha
trade will be magnified accordingly
Countries in bottom tercile by ESG ranking; alpha
trade will be limited to benchmark weight
Countries ranking in the middle tercile: alpha
trade will be sized according to trade conviction
without increase or decrease due to ESG
The ESG tilting for any corporate alpha trades
would follow the same pattern as that of their
sovereign
SOVEREIGN CREDIT
CORPORATE CREDIT
INTEREST RATES
FX
ALPHA
GENERATION
PORTFOLIO
CONSTRUCTION
WITH ESG TILTING
Incorporation of ESG in EMFI investment process

Green Bonds: Assessment Process
30
ESG decile: assessment of the issuer’s ESG credentials.
Customized to client needs (e.g. decile 9 and 10 are OUT).
Taxonomy: the projects to be funded must be in line with our
definition of eligible activities. If the issuer plans to finance
excluded activities, the recommendation is OUT.
BNPP IP’s Green Bond score:
• If the issuer’s final green bond score is lower than the
minimum score for eligibility, the recommendation is OUT.
• If the issuer’s final green bond score is superior or equal to
the minimum score for eligibility, the recommendation is IN
for one year.
Ex post reporting: if the issuer doesn’t provide a reporting
and/or if the proceeds are not fully allocated within a reasonable
time, the recommendation is OUT.
Engagement with the issuer: dialogue on the actual proceeds
allocation, output indicators and impact indicators. If engagement
is satisfactory, the recommendation is IN for another year. If not,
it is OUT.
1st filter
2nd filter
3rd filter
4th filter
5th filter
EX A
NTE
EX P
OST

Biographies
31

Disclaimer
32
BNP PARIBAS ASSET MANAGEMENT UK Limited, “the investment company”, is authorised and regulated by the Financial Conduct Authority. Registered in England No: 02474627,
registered office: 5 Aldermanbury Square, London, England, EC2V 7BP, United Kingdom.
This material is produced for information purposes only and does not constitute:
1. an offer to buy nor a solicitation to sell, nor shall it form the basis of or be relied upon in connection with any contract or commitment whatsoever or
2. investment advice.
This material makes reference to certain financial instruments authorised and regulated in their jurisdiction(s) of incorporation.
No action has been taken which would permit the public offering of the financial instrument(s) in any other jurisdiction, except as indicated in the most recent prospectus and the Key
Investor Information Document (KIID) of the relevant financial instrument(s) where such action would be required, in particular, in the United States, to US persons (as such term is defined
in Regulation S of the United States Securities Act of 1933). Prior to any subscription in a country in which such financial instrument(s) is/are registered, investors should verify any legal
constraints or restrictions there may be in connection with the subscription, purchase, possession or sale of the financial instrument(s).
Investors considering subscribing to the financial instrument(s) should read carefully the most recent prospectus and Key Investor Information Document (KIID) and consult the financial
instrument(s’) most recent financial reports. These documents are available on the website.
Opinions included in this material constitute the judgement of the investment company at the time specified and may be subject to change without notice. The investment company is not
obliged to update or alter the information or opinions contained within this material. Investors should consult their own legal and tax advisors in respect of legal, accounting, domicile and
tax advice prior to investing in the financial instrument(s) in order to make an independent determination of the suitability and consequences of an investment therein, if permitted. Please
note that different types of investments, if contained within this material, involve varying degrees of risk and there can be no assurance that any specific investment may either be suitable,
appropriate or profitable for an investor’s investment portfolio.
Given the economic and market risks, there can be no assurance that the financial instrument(s) will achieve its/their investment objectives. Returns may be affected by, amongst other
things, investment strategies or objectives of the financial instrument(s) and material market and economic conditions, including interest rates, market terms and general market conditions.
The different strategies applied to financial instruments may have a significant effect on the results presented in this material. Past performance is not a guide to future performance and
the value of the investments in financial instrument(s) may go down as well as up. Investors may not get back the amount they originally invested.
Gross of fees performance included in this material do not reflect the deduction of commission, fees and other expenses incurred. Returns will be reduced after the deduction of such fees.
This document is directed only at person(s) who have professional experience in matters relating to investments (“relevant persons”). Any investment or investment activity to which this
document relates is available only to and will be engaged in only with Professional Clients as defined in the rules of the Financial Conduct Authority. Any person who is not a relevant
person should not act or rely on this document or any of its contents.
All information referred to in the present document is available on www.bnpparibas-am.com


![Fixed Income Index Guide - BlackRock · [10] FIXED INCOME INDEX GUIDE Bloomberg Barclays index family ... Broad family of fixed income indices, including: aggregate, government, corporate,](https://img.pdfslide.us/doc/110x75/5b0274907f8b9af1148fb575/fixed-income-index-guide-blackrock-10-fixed-income-index-guide-bloomberg-barclays.jpg)