Embed Size (px)
Citation preview

ORIGINAL ARTICLE
Is lower uric acid level better? A combined cross-sectionaland longitudinal study in the elderly
Chang-Hsun Hsieh • Jiunn-Diann Lin •
Chung-Ze Wu • Chun-Hsien Hsu • Dee Pei •
Yao-Jen Liang • Yen-Lin Chen
Received: 20 November 2013 / Accepted: 31 January 2014
� Springer Science+Business Media New York 2014
Abstract The relationship between metabolic syndrome
(MetS) and uric acid (UA) has been explored in many
studies, but there is paucity of information on hypo-uricemia
and MetS. The current study aimed to elucidate the rela-
tionship between the lower end of UA and MetS in elderly.
Subjects aged C60 years who underwent routine health
checkups were enrolled, and 10,579 were eligible for ana-
lysis. A cross-sectional study was first performed to deter-
mine the correlation between MetS and UA. The subjects
were divided into two groups according to the lowest male
MetS prevalence in each UA level (UA B5 and[5 mg/dl).
A longitudinal study then excluded subjects with MetS at
baseline to validate the UA level of those with the lowest
incidence of MetS. In the prevalence of MetS in different
UA levels, there was a J-shaped curve in males but a linear
relationship in females. In males, waist circumference, sys-
tolic blood pressure, high-density lipoprotein, and triglyc-
eride were correlated with UA in univariate analysis, but
high-density lipoprotein became insignificant in multivariate
analysis in UA [5 mg/dl (UA-high). Only fasting plasma
glucose (FPG) was significantly related to UA B5 mg/dl
(UA-low). The UA level of 4.5–5 mg/dl had the lowest risk
of having MetS in odds ratio, log-rank test, and hazard ratio.
A J-shaped phenomenon exists between UA and MetS in
elderly men but not in elderly women and FPG seem to be
the key factor in this. Lower UA does not provide benefits in
elderly men. The new UA control strategy for the elderly
warrants further investigation.
Keywords Uric acid � Metabolic syndrome � Elderly �J-shape
Introduction
Cardiovascular disease (CVD) is one of the leading causes of
death worldwide. Recently, its incidence has been increasing,
perhaps due to longer life span and aging. For the early
detection of people at high risk of CVD, the concept of meta-
bolic syndrome (MetS) has been elaborated. First described by
C.-H. Hsieh
Division of Endocrinology and Metabolism, Department of
Internal Medicine, Tri-Service General Hospital, National
Defense Medical Center, Taipei, Taiwan
J.-D. Lin � C.-Z. Wu
Division of Endocrinology and Metabolism, Department of
Medicine, Shuang-Ho Hospital, Taipei Medical University,
New Taipei, Taiwan
C.-H. Hsu
Department of Family Medicine, Cardinal Tien Hospital, School
of Medicine, Fu-Jen Catholic University, New Taipei, Taiwan
D. Pei
Department of Internal Medicine, Cardinal Tien Hospital, School
of Medicine, Fu-Jen Catholic University, New Taipei, Taiwan
Y.-J. Liang
Department of Life-Science, Fu-Jen Catholic University,
New Taipei, Taiwan
Y.-L. Chen (&)
Department of Pathology, Cardinal Tien Hospital, School of
Medicine, Fu-Jen Catholic University, No. 362, Chung-Cheng
Road, Xindian, New Taipei 23137, Taiwan
e-mail: [email protected]
123
Endocrine
DOI 10.1007/s12020-014-0201-6
Reaven et al. [1] in 1988, MetS is characterized by the clus-
tering of dyslipidemia, obesity, hypertension, and hypergly-
cemia. Subsequently, MetS has been highly associated with the
development of CVD and type 2 diabetes mellitus (T2D).
Initially, the diagnostic criteria of MetS were not the same in
studies across the globe and more than forty criteria were
proposed [2]. The National Cholesterol Education Program
Adult Treatment Panel III eventually defined the most popular
diagnostic criteria of MetS [3], which contained hyperglyce-
mia, central obesity, hypertension, and dyslipidemia. However,
these components are the so-called ‘‘traditional criteria’’. Other
risk factors such as uric acid (UA) or increased liver enzyme
have been discovered and proven to be related to CVD. These
are regarded as the ‘‘non-traditional’’ risk factors for MetS [4–
7]. The prevalence of MetS in Taiwan is around 20 % among
all age of population. However, the rate is much higher in
elderly with more than half of the elderly has MetS [8].
A by-product of purine metabolism generated during the
breakdown of nucleic acids, UA at higher level is related to
hypertension and insulin resistance [9]. However, findings
on the relationships between UA and T2D are inconsistent
[10–15]. Bo et al. [16] demonstrated that hypo-uricemia and
hyper-uricemia seem to be two different phenotypes in T2D.
Hyper-uricemia was associated with the insulin-resistant
syndrome and early onset or increased progression to overt
nephropathy, while hypo-uricemia was associated with
worse metabolic control, hyper-filtration, and late onset or
decreased progression to overt nephropathy. In another study
by Yuan et al. [17], UA level was initially increased and then
decreased as glucose levels increased from normoglycemia
due to impaired glucose regulation and T2D. Although the
relationship between MetS and UA, especially hyper-urice-
mia, has been the subject of many studies, there is a lack of
information on hypo-uricemia and MetS. The current cohort
study tried to shed light on the relationship between the lower
end of UA and MetS in elderly adults.
Methods
Study population
Individuals aged C60 years (included) who underwent
routine health checkups at the MJ Health Screening Center,
a privately owned chain of clinics throughout Taiwan that
provided regular annual health examinations to their
members, were enrolled. The nationwide distribution of the
MJ Health Screening Centers provided a selection sample
from across the entire country. However, the study par-
ticipants had higher socioeconomic status than the general
population, which would be a bias of selection. All of the
study participants were anonymous and provided informed
consent. Data were provided by the MJ Health Screening
Center for research purposes only and the center’s insti-
tutional review board approved the study protocol.
From the database covering the period 1999 and 2007,
21,637 records were randomly selected. Initially, 2,418
subjects were excluded due to only a single visit to the
center. A more stringent exclusion criteria to make the
results more reliable were used by reducing the con-
founding effects of medications for hypertension, hyper-
lipidemia and/or T2D at baseline, thereby excluding
another 8,423 subjects. After excluding 217 subjects with
missing data of MetS components, a total of 10,579 were
eligible for further analysis (‘‘Appendix 1’’).
Anthropometric measurements and general data
Members of the senior nursing staff used a questionnaire to
obtain the subjects’ medical history, including current medi-
cations. Physicians then performed a thorough history taking
and complete physical examination. Body mass index (BMI)
was calculated as the subject’s body weight (kg) divided by
the square of the subject’s height (m). Waist circumference
(WC) was taken at the midway point between the inferior
margin of the last rib and the crest of the ilium in a horizontal
plane. Both systolic blood pressure (SBP) and diastolic blood
pressure (DBP) were measured by senior nursing staff using
mercury sphygmomanometers with appropriate-sized cuffs
on the right arm of the participants, who had rested for at least
5 min in a sitting position. Two measurements were taken
more than 1 min apart and the average was recorded. Blood
samples were drawn from the antecubital vein after 10-h
fasting for laboratory and biochemical analysis. Plasma was
separated from blood within 1 h, stored at -70 �C and ana-
lyzed for fasting plasma glucose (FPG) and lipid profiles. The
FPG was detected using the glucose oxidase method (YSI 203
glucose analyzer, Scientific Division, Yellow Springs Instru-
ments, Yellow Springs, OH). Total cholesterol and triglycer-
ides (TG) were measured using the dry, multi-layer analytical
slide method in a Fuji Dri-Chem 3000 analyzer (Fuji Photo
Film, Minato-Ku, Tokyo, Japan). Serum high-density lipo-
protein (HDL) and low-density lipoprotein (LDL) cholesterol
concentrations were analyzed using an enzymatic cholesterol
assay following dextran sulfate precipitation. Serum UA was
measured by the uricase-peroxidase method using an Abbott
C8000 analyzer (Abbott Laboratories, Abbott Park, IL, USA).
Definition of metabolic syndrome
The latest harmonized criteria of MetS in 2009 [18] were
used, with some modifications. The WC was C90 and
80 cm for Taiwanese males and females, respectively [19].
Other four criteria were the same: SBP C 130 mmHg or
DBP C 85 mmHg, TG C 150 mg/dl, FPG C 100 mg/dl,
HDL B 40 and 50 mg/dl for males and females,
Endocrine
123

respectively, or intake of related medications. Subjects had
to have at least three criteria to be diagnosed as MetS.
Statistical analysis
The study had two parts. The first part was a cross-sectional
study aimed to determine the association between UA and
MetS. The subjects were divided into two groups according to
the lowest male MetS prevalence in each UA level (UA-high
or UA level [5 mg/dl and UA-low, or UA level B5 mg/dl).
T test was used to compare differences in demographic data
between these two groups. Pearson’s simple correlation was
applied to identify the MetS criterion related to UA. Multiple
regression analysis with adjustment was then performed to
differentiate components that were independently correlated
with UA. Odds ratio (OR) by logistic regression analysis was
also applied for the risk of having MetS.
The second part of the study had a longitudinal design to
demonstrate the cause–effect relationship of UA and MetS.
Kaplan–Meier plot with log-rank test was done to show the
proportion of MetS-free subjects during the follow-up
period. Lastly, Cox regression was used to see the hazard
ratio (HR) of developing MetS.
All statistical analyses were performed using the SPSS
18.0 software (SPSS Inc., Chicago, IL). Data were pre-
sented as mean ± standard deviation. All data were tested
by the Kolmogorov–Smirnov test for normal distribution
and by the Levene’s test for homogeneity of variances.
Statistical significance was set at a two-sided p \ 0.05.
Results
The study enrolled 10,579 elderly in the current study.
Based on the prevalence of MetS in different levels of UA
(each 0.5 mg/dl as a subgroup) (Fig. 1), there was a
J-shaped curve in males and a linear relationship in
females. The lowest prevalence of MetS was in the group
of UA level 4.5–5 mg/dl in males. The study population
was divided into two groups (UA-high and UA-low) based
on the prevalence result. On the demographic data
(Table 1), except for age, SBP in males and FPG in
females, all other MetS components (WC, BP, HDL, and
TG) were higher in the UA-high group.
In males, all MetS components except FPG were cor-
related with UA in the univariate analysis, but DBP andFig. 1 The prevalence of metabolic syndrome according to uric acid
level
Table 1 Demographic data of study subjects with uric acid of 5 mg/
dl as cut-off point
UA-low UA-high p
UA B5
(mg/dl)
UA [5
(mg/dl)
Male
n 630 4,509
Age (years) 65.3 ± 5.5 64.8 ± 5.2 0.054
Body mass index (kg/m2) 22.64 ± 2.90 23.73 ± 2.86 \0.001
Waist circumference (cm) 81.3 ± 8.7 84.2 ± 8.4 \0.001
Systolic blood pressure
(mmHg)
127.5 ± 18.5 128.7 ± 18.4 0.134
Diastolic blood pressure
(mmHg)
74.5 ± 10.8 76.2 ± 11.1 \0.001
Fasting Plasma Glucose
(mg/dl)
108.7 ± 37.7 102.0 ± 16.7 \0.001
Total cholesterol (mg/dl) 196.7 ± 34.7 201.8 ± 35.2 0.001
HDL-C (mg/dl) 52.2 ± 13.9 49.8 ± 13.4 \0.001
LDL-C (mg/dl) 123.4 ± 30.4 127.1 ± 31.8 0.005
Triglyceride (mg/dl) 105.6 ± 55.9 124.5 ± 64.5 \0.001
Log TG 1.98 ± 0.20 2.04 ± 0.21 \0.001
Uric acid (mg/dl) 4.44 ± 0.54 6.94 ± 1.28 \0.001
Female
n 2,173 3,267
Age (years) 63.7 ± 4.4 63.7 ± 4.4 0.915
Body mass index (kg/m2) 22.96 ± 3.02 24.47 ± 3.16 \0.001
Waist circumference (cm) 75.1 ± 7.6 78.4 ± 7.9 \0.001
Systolic blood pressure
(mmHg)
128.7 ± 18.4 131.3 ± 19.1 \0.001
Diastolic blood pressure
(mmHg)
72.6 ± 10.6 74.6 ± 10.8 \0.001
Fasting plasma glucose
(mg/dl)
100.8 ± 22.5 101.0 ± 17.2 0.772
Total cholesterol (mg/dl) 211.4 ± 36.1 216.8 ± 37.5 \0.001
HDL-C (mg/dl) 62.0 ± 15.6 57.4 ± 14.9 \0.001
LDL-C (mg/dl) 127.7 ± 32.6 132.7 ± 34.4 \0.001
Triglyceride (mg/dl) 107.4 ± 51.6 133.7 ± 66.4 \0.001
Log TG 1.99 ± 0.19 2.08 ± 0.20 \0.001
Uric acid (mg/dl) 4.31 ± 0.55 6.31 ± 1.08 \0.001
Data are shown as mean ± SEM
UA uric acid
Endocrine
123

HDL became insignificant in the multivariate analysis in
the UA-high group (‘‘Appendix 2’’). In contrast, only FPG
was significantly correlated with the UA-low group. In
females, only WC and TG remain significantly correlated
with UA in the multivariate analysis regardless of UA level
(both UA-low and UA-high). Using OR, a UA level of
4.5–5 and 3.5–4 mg/dl had the lowest risk of having MetS
in males (p \ 0.01) and females, respectively (Fig. 2).
Compared the lowest UA level (3.5–4 mg/dl) with
4.5–5 mg/dl in men, OR of 1.920 (1.054–3.496) was seen
for having MetS.
In second part of the study, the median follow-up period
was 5.6 years. After excluding 2,861 subjects with MetS at
baseline, a total of 7,718 subjects were eligible for follow-
up analysis not only for the cause–effect relationships
between UA and MetS, but also as validation to confirm the
result in first part of study. The Kaplan–Meier plot showed
similar results that the group with UA level of 4.5–5 mg/dl
would have the lowest risk of developing MetS (‘‘Appen-
dix 3’’). In addition, the Cox regression model (Fig. 3)
further confirmed the results, with a HR of 1.972
(1.091–3.564) when the UA level was 3.5–4 mg/dl (lowest)
compared to that when the UA level was 4.5–5 mg/dl
(p = 0.025). Instead of increase MetS risk in the lowest
UA level (3.5–4 mg/dl) in male, it still has the lowest risk
for having MetS in both Kaplan–Meier plot and HR for
having MetS in female. Thus, both parts of the study
revealed an inverse correlation between hypo-uricemia and
MetS only in elderly males.
Discussion
To date, this study is the first to describe the J-shaped
relationship between UA and MetS in elderly men. In
contrast, elderly women have a linear relationship between
these two factors. In the prevalence of MetS but also in the
OR and HR of having MetS, the UA level of 4.5–5 mg/dl
has the lowest risk of having MetS in elderly men. By
Fig. 2 Odds ratio of having metabolic syndrome in different levels of
uric acid. (Asterisk) Uric acid level of 4.5–5 mg/dl was the reference rangeFig. 3 Hazard ratio of having metabolic syndrome in different levels
of uric acid during the follow-up period. (Asterisk) Uric acid level of
4.5–5 mg/dl was the reference range
Endocrine
123

univariate and multivariate analyses, FPG seems to play the
most critical role. However, this phenomenon is not seen in
elderly women. Although Denzer et al. [20] have found
that testosterone is positively correlated with serum UA in
obese children and adolescents, these results suggest
another example of an undescribed impact of androgens in
the regulation of UA.
The relationship between UA and FPG is a controversial
issue. Some authors have found no association between the
two, others reveal an inverse relationship, and still another
study shows a positive relationship [21–23]. Moreover, a
bell-shaped relationship between UA and glucose levels
has also been reported [24, 25]. Chou et al. [26] found that
hyper-uricemia and HOMA-insulin resistance were posi-
tively associated with hyper-insulinemia among subjects
without T2D in both sexes. The association among UA,
insulin resistance, and plasma glucose levels was stronger
in females than in males. In the study done by Robles-
Cervantes et al. [27], a positive association between UA
and insulin secretion (first, second, and total phases) was
noted in T2D male patients but not in females by the
hyperglycemic clamp technique.
In addition, Meisinger et al. [28] separated the study
group into different categories according to FPG level.
They found that UA was associated with isolated impaired
fasting glucose, impaired fasting glucose, impaired glucose
tolerance, newly diagnosed T2D, and known T2D in
women. However, only isolated impaired fasting glucose
was significantly related to UA in men. A possible mech-
anism may be that UA inhibits glucose-induced insulin
secretion by binding to an essential arginine residue in rat
pancreatic beta-cells [29]. Results of the present study
show that only FPG is significantly negatively correlated
with UA among the factors in males of the UA-low group.
This can explain the J-shape phenomenon in elderly men.
Waist circumference has positively correlated with UA
and discussed extensively. Sui et al. demonstrated that UA
was positively related to WC in 9,689 subjects aged
20–82 years [30]. At the same time, Liu et al. [22] also
showed similar results in another Taiwanese cohort.
Results here further confirmed this relationship in the
elderly regardless of sexes. However, there was an insig-
nificant correlation between WC and UA in the UA-low
group of elderly men. As mentioned previously, Denzer
et al. [20] have that testosterone positively correlated with
serum UA in obese children and adolescents. Although age
might be different in these situations, Marinello et al. [31]
further found that the purine nucleotide metabolism slowed
down after castration and was not completely restored by
androgen administration. These may explain the sex dif-
ference but not the different scenarios of UA-high and
UA-low. The underlying mechanisms warrant further
investigation.
Studies have been conducted in the field of hypertension
and UA. It has been reported that hyper-uricemia carries an
increased risk of hypertension [32]. In healthy subjects,
increased UA level, even within the physiologic range
(within normal limits), is a risk factor for increased carotid
intima-media thickness, reduced brachial artery flow-
mediated dilatation, and increased aortic stiffness inde-
pendent of other cardiovascular risk factors or other factors
related to MetS [33]. However, in the present study, only
SBP is significantly correlated with elderly men in the UA-
high group. The major difference between the present study
and a previous study is the age of the study population.
Sundstrom et al. [34] also failed to find the association
between UA and hypertension in the elderly. Increasing
age is associated with stiffening aorta, activated renin-
angiotensin system, and renal vasoconstriction. These may
blunt the association with hypertension. [35, 36].
Although HDL is negatively correlated with UA as
expected in univariate regression among women in both the
UA-high and UA-low groups and in men in the UA-high
group, this becomes insignificant in multivariate analysis.
In contrast, TG is still significantly related to UA except
among males in the UA-low group. Ishizaka et al. [37] also
found that UA was associated with dyslipidemia in Japa-
nese individuals. This indirectly supports the present find-
ings. However, Ishizaka et al. did not separate UA from
5 mg/dl (UA-high and UA-low) and still showed a positive
linear relationship between TG and UA. It is known that
dyslipidemia and high TG are indicative of pro-inflam-
matory state/oxidative stress [38]. Several studies suggest
that UA also has pro-inflammatory effects [39, 40].
Moreover, pro-inflammatory state/oxidative stresses often
precede or are prominently involved in MetS [41]. There-
fore, UA may contribute to the development of MetS
through a pro-inflammatory pathway.
The strength of this study is its combined cross-sectional
and longitudinal aspects. This further supports and
strengthens the findings of an inverse relationship between
MetS and hypo-uricemia in elderly men. Nonetheless, there
are still some limitations in this study. First, the subjects
were recruited from one private health screening center.
Thus, they had better economic status with more medical
support and may not represent the conditions of the general
population in Taiwan. Second, subjects taking medications
related to MetS components were excluded. Although this
may reduce the confounding factors and provides a clearer
relationship between MetS and UA, this condition is not
often seen in general clinical practice. As such, the strict
exclusion criteria are both an advantage and a disadvantage
in the current study. Although the UA level of the lowest
risk having MetS has been determined in a cross-sectional
study, the longitudinal cohort study may be seen as a
validation. However, no further external validation was
Endocrine
123

done, which may be another weakness of the current study.
Lastly, some of the study population had several risk fac-
tors including hypertension and dyslipidemia. Although we
excluded subjects taking medication would affect meta-
bolic syndrome at baseline to reduce the effect of medi-
cation, it is still impossible for us to make the strong
evidence to eliminate the possible effect of underlying
diseases and other medications.
In conclusion, a J-shape phenomenon exists between
UA and MetS in elderly men but not in elderly women and
FPG seem to be a key factor. Lower UA does not provide
more benefits for elderly men. New treatment plans for UA
control in the elderly are needed and warrant further
investigations.
Acknowledgments The authors sincerely thank the MJ Life Clinic
in Taiwan for providing the anonymous data for the present study.
Conflict of interest All the authors have no conflicts of interest in
the present study.
Appendix 1
See Fig. 4.
Fig. 4 Description of the study
design
Endocrine
123

Appendix 2
See Table 2.
Table 2 The Kaplan–Meier estimates of metabolic syndrome during the follow-up period according to the uric acid level at baseline
Univariant Multivariant
UA-low UA-high UA-low UA-high
UA B5 UA [5 UA B5 UA [5
Male n = 630 n = 4,509 n = 630 n = 4,509
Age r -0.013 -0.009 -0.001 -0.047
p 0.749 0.544 0.980 0.002
Waist circumference r -0.004 0.189 0.113 0.129
p 0.927 \0.001 0.150 \0.001
Systolic blood pressure r -0.079 0.090 -0.072 0.052
p 0.046 \0.001 0.229 0.015
Diastolic blood pressure r -0.058 0.083 0.011 0.003
p 0.148 \0.001 0.851 0.869
Fasting plasma glucose r -0.130 -0.003 -0.127 -0.050
p 0.001 0.834 0.002 \0.001
High-density
lipoprotein
r 0.033 -0.102 0.012 -0.009
p 0.407 \0.001 0.786 0.553
Triglyceride r -0.064 0.174 -0.042 0.112
p 0.111 \0.001 0.350 \0.001
Female n = 2,173 n = 3,267 n = 2,173 n = 3,267
Age r -0.015 0.050 -0.015 0.017
p 0.488 0.005 0.508 0.361
Waist circumference r 0.086 0.165 0.023 0.066
p \0.001 \0.001 0.546 0.023
Systolic blood pressure r -0.005 0.032 -0.048 0.007
p 0.810 0.071 0.127 0.776
Diastolic blood pressure r 0.025 0.020 0.030 -0.029
p 0.250 0.256 0.317 0.245
Fasting plasma glucose r -0.011 0.019 -0.035 -0.014
p 0.594 0.283 0.105 0.414
High-density
lipoprotein
r -0.065 -0.107 -0.014 -0.029
p 0.002 \0.001 0.554 0.128
Triglyceride r 0.098 0.131 0.072 0.093
p \0.001 \0.001 0.003 \0.001
All p value was adjusted for smoking status, alcohol consumption, BUN, creatinin, body mass index, and LDL-cholesterol in multivariate
regression analysis
Unit = mg/dl
UA uric acid
*Log-rank test for p \ 0.05 compared to the reference range of uric acid. #Uric acid level of 4.5–5 mg/dl was the reference range
Endocrine
123
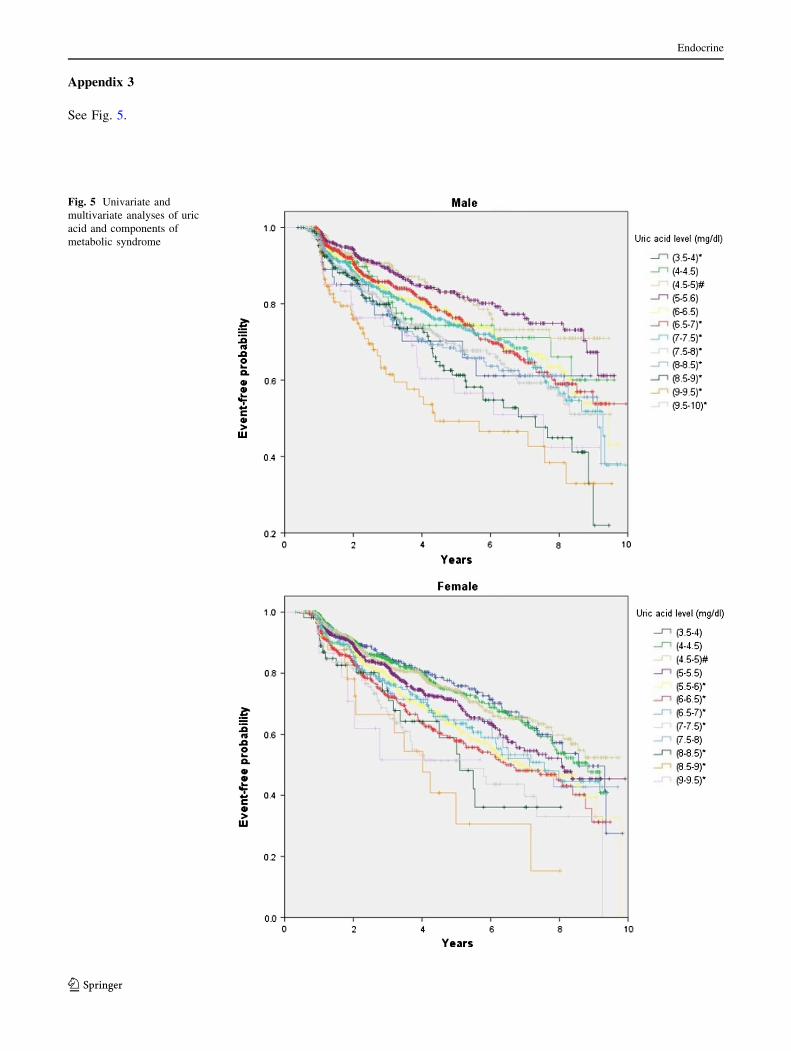
Appendix 3
See Fig. 5.
Fig. 5 Univariate and
multivariate analyses of uric
acid and components of
metabolic syndrome
Endocrine
123

References
1. G.M. Reaven, Banting lecture 1988. Role of insulin resistance in
human disease. Diabetes 37(12), 1595–1607 (1988)
2. N.M. Varda, A. Gregoric, Metabolic syndrome in the pediatric
population: a short overview. Pediatric Rep 1(1), e1 (2009)
3. N.J. Stone, S. Bilek, S. Rosenbaum, Recent National Cholesterol
Education Program Adult Treatment Panel III update: adjust-
ments and options. Am. J. Cardiol. 96(4A), 53E–59E (2005)
4. C.H. Hsu, J.Y. Wang, Y.L. Chen, C.C. Liu, Y.L. Chang, H.S. Chen,
C. Pei, D. Pei, Relationships between alanine aminotransferase
levels, abnormal liver echogenicity, and metabolic syndrome. J. Am.
Board Fam. Med. JABFM 24(4), 407–414 (2011)
5. J.Y. Wang, Y.L. Chen, C.H. Hsu, S.H. Tang, C.Z. Wu, D. Pei,
Predictive value of serum uric acid levels for the diagnosis of met-
abolic syndrome in adolescents. J. Pediatr. 161(4), 753–756 (2012)
6. J.P. Goncalves, A. Oliveira, M. Severo, A.C. Santos, C. Lopes,
Cross-sectional and longitudinal associations between serum uric
acid and metabolic syndrome. Endocrine 41(3), 450–457 (2012).
doi:10.1007/s12020-012-9629-8
7. R.D. Santos, Elevated uric acid, the metabolic syndrome and
cardiovascular disease: cause, consequence, or just a not so
innocent bystander? Endocrine 41(3), 350–352 (2012)
8. National Health Research Institutes. http://nahsit.nhri.org.tw/
node/21. Accessed January 10
9. K. Masuo, H. Kawaguchi, H. Mikami, T. Ogihara, M.L. Tuck,
Serum uric acid and plasma norepinephrine concentrations pre-
dict subsequent weight gain and blood pressure elevation.
Hypertension 42(4), 474–480 (2003)
10. A. Dehghan, M. van Hoek, E.J. Sijbrands, A. Hofman, J.C.
Witteman, High serum uric acid as a novel risk factor for type 2
diabetes. Diabetes Care 31(2), 361–362 (2008)
11. C.K. Kramer, D. von Muhlen, S.K. Jassal, E. Barrett-Connor,
Serum uric acid levels improve prediction of incident type 2
diabetes in individuals with impaired fasting glucose: the Rancho
Bernardo Study. Diabetes Care 32(7), 1272–1273 (2009)
12. S. Kodama, K. Saito, Y. Yachi, M. Asumi, A. Sugawara, K. Totsuka,
A. Saito, H. Sone, Association between serum uric acid and devel-
opment of type 2 diabetes. Diabetes Care 32(9), 1737–1742 (2009)
13. E. Oda, R. Kawai, V. Sukumaran, K. Watanabe, Uric acid is
positively associated with metabolic syndrome but negatively
associated with diabetes in Japanese men. Intern. Med. 48(20),
1785–1791 (2009)
14. H. Nan, Y. Dong, W. Gao, J. Tuomilehto, Q. Qiao, Diabetes
associated with a low serum uric acid level in a general Chinese
population. Diabetes Res. Clin. Pract. 76(1), 68–74 (2007)
15. P. Bandaru, A. Shankar, Association between serum uric acid levels
and diabetes mellitus. Int. J. Endocrinol. 2011, 604715 (2011)
16. S. Bo, P. Cavallo-Perin, L. Gentile, E. Repetti, G. Pagano,
Hypouricemia and hyperuricemia in type 2 diabetes: two differ-
ent phenotypes. Eur. J. Clin. Invest. 31(4), 318–321 (2001)
17. H.J. Yuan, X.G. Yang, X.Y. Shi, R. Tian, Z.G. Zhao, Association
of serum uric acid with different levels of glucose and related
factors. Chin. Med. J. 124(10), 1443–1448 (2011)
18. K.G. Alberti, R.H. Eckel, S.M. Grundy, P.Z. Zimmet, J.I. Cle-
eman, K.A. Donato, J.C. Fruchart, W.P. James, C.M. Loria, S.C.
Smith Jr, Harmonizing the metabolic syndrome: a joint interim
statement of the International Diabetes Federation Task Force on
Epidemiology and Prevention; National Heart, Lung, and Blood
Institute; American Heart Association; World Heart Federation;
International Atherosclerosis Society; and International Associ-
ation for the Study of Obesity. Circulation 120(16), 1640–1645
(2009)
19. Department of Health, Executive Yuan, R.O.C. (Taiwan).
Available at: http://www.doh.gov.tw/CHT2006/DM/DM2_p01.
aspx?class_no=25&now_fod_list_no=5912&level_no=2&doc_
no=22602. Accessed February 10, 2013
20. C. Denzer, R. Muche, H. Mayer, E. Heinze, K.M. Debatin, M.
Wabitsch, Serum uric acid levels in obese children and adoles-
cents: linkage to testosterone levels and pre-metabolic syndrome.
J. Pediatr. Endocrinol. Metab. JPEM 16(9), 1225–1232 (2003)
21. J.D. Lin, W.K. Chiou, H.Y. Chang, F.H. Liu, H.F. Weng, Serum
uric acid and leptin levels in metabolic syndrome: a quandary
over the role of uric acid. Metab. Clin. Exp. 56(6), 751–756
(2007)
22. P.W. Liu, T.Y. Chang, J.D. Chen, Serum uric acid and metabolic
syndrome in Taiwanese adults. Metab. Clin. Exp. 59(6), 802–807
(2010)
23. W.K. Chiou, D.H. Huang, M.H. Wang, Y.J. Lee, J.D. Lin, Sig-
nificance and association of serum uric acid (UA) levels with
components of metabolic syndrome (MS) in the elderly. Arch.
Gerontol. Geriatr. 55(3), 724–728 (2012)
24. D.G. Cook, A.G. Shaper, D.S. Thelle, T.P. Whitehead, Serum
uric acid, serum glucose and diabetes: relationships in a popu-
lation study. Postgrad. Med. J. 62(733), 1001–1006 (1986)
25. T.P. Whitehead, I. Jungner, D. Robinson, W. Kolar, A. Pearl, A.
Hale, Serum urate, serum glucose and diabetes. Ann. Clin. Bio-
chem. 29(Pt 2), 159–161 (1992)
26. P. Chou, K.C. Lin, H.Y. Lin, S.T. Tsai, Gender differences in the
relationships of serum uric acid with fasting serum insulin and
plasma glucose in patients without diabetes. J. Rheumatol. 28(3),
571–576 (2001)
27. J.A. Robles-Cervantes, M.G. Ramos-Zavala, M. Gonzalez-Ortiz,
E. Martinez-Abundis, C. Valencia-Sandoval, A. Torres-Chavez,
C. Espinel-Bermudez, N.J. Santiago-Hernandez, S.O. Hernandez-
Gonzalez, Relationship between serum concentration of uric acid
and insulin secretion among adults with type 2 diabetes mellitus.
Int. J. Endocrinol. 2011, 107904 (2011)
28. C. Meisinger, A. Doring, D. Stockl, B. Thorand, B. Kowall, W.
Rathmann, Uric acid is more strongly associated with impaired
glucose regulation in women than in men from the general
population: the KORA F4-Study. PLoS ONE 7(5), e37180 (2012)
29. B. Rocic, M. Vucic-Lovrencic, N. Poje, M. Poje, F. Bertuzzi,
Uric acid may inhibit glucose-induced insulin secretion via
binding to an essential arginine residue in rat pancreatic beta-
cells. Bioorg. Med. Chem. Lett. 15(4), 1181–1184 (2005)
30. X. Sui, T.S. Church, R.A. Meriwether, F. Lobelo, S.N. Blair, Uric
acid and the development of metabolic syndrome in women and
men. Metab. Clin. Exp. 57(6), 845–852 (2008)
31. E. Marinello, R. Leoncini, L. Terzuoli, D. Vannoni, B. Porcelli,
G. Resconi, Effect of testosterone on purine nucleotide metabo-
lism in rat liver. Hormone Metabol Res = Hormon- und
Stoffwechselforschung = Hormones et metabolisme 36(9), 614–
619 (2004)
32. D.I. Feig, D.H. Kang, R.J. Johnson, Uric acid and cardiovascular
risk. N. Engl. J. Med. 359(17), 1811–1821 (2008)
33. D. Erdogan, H. Gullu, M. Caliskan, E. Yildirim, M. Bilgi, T.
Ulus, N. Sezgin, H. Muderrisoglu, Relationship of serum uric
acid to measures of endothelial function and atherosclerosis in
healthy adults. Int. J. Clin. Pract. 59(11), 1276–1282 (2005)
34. J. Sundstrom, L. Sullivan, R.B. D’Agostino, D. Levy, W.B.
Kannel, R.S. Vasan, Relations of serum uric acid to longitudinal
blood pressure tracking and hypertension incidence. Hyperten-
sion 45(1), 28–33 (2005)
35. T.S. Perlstein, O. Gumieniak, P.N. Hopkins, L.J. Murphey, N.J.
Brown, G.H. Williams, N.K. Hollenberg, N.D. Fisher, Uric acid
and the state of the intrarenal renin-angiotensin system in
humans. Kidney Int. 66(4), 1465–1470 (2004)
36. S. Watanabe, D.H. Kang, L. Feng, T. Nakagawa, J. Kanellis, H.
Lan, M. Mazzali, R.J. Johnson, Uric acid, hominoid evolution,
Endocrine
123

and the pathogenesis of salt-sensitivity. Hypertension 40(3),
355–360 (2002)
37. N. Ishizaka, Y. Ishizaka, E. Toda, R. Nagai, M. Yamakado,
Association between serum uric acid, metabolic syndrome, and
carotid atherosclerosis in Japanese individuals. Arterioscler.
Thromb. Vasc. Biol. 25(5), 1038–1044 (2005)
38. R. Ross, Atherosclerosis—an inflammatory disease. N. Engl.
J. Med. 340(2), 115–126 (1999)
39. J. Kanellis, D.H. Kang, Uric acid as a mediator of endothelial
dysfunction, inflammation, and vascular disease. Semin. Nephrol.
25(1), 39–42 (2005)
40. A.C. Gagliardi, M.H. Miname, R.D. Santos, Uric acid: a marker
of increased cardiovascular risk. Atherosclerosis 202(1), 11–17
(2009)
41. A. Onat, Metabolic syndrome: nature, therapeutic solutions and
options. Expert Opin. Pharmacother. 12(12), 1887–1900 (2011)
Endocrine
123


![URIC ACID CALCULI - eCM Journal · acid calculi is considerably limited [5, 15]. Contemporary knowledge concerning uric acid cal-culi can be summarized as follows. Uric acid occurs](https://img.pdfslide.us/doc/110x75/602967c716c6714c00444545/uric-acid-calculi-ecm-journal-acid-calculi-is-considerably-limited-5-15-contemporary.jpg)