Embed Size (px)
Citation preview

Is it possible to deliver quality education to the poor?
The Pratham-J-PAL Partnership
14.73 Lecture 10
1

Education quality: The problem
• Education quality is low in developing countries: – High teacher absence
– High student absence
– Low achievement: • For example ASER survey in India finds that about 35%
of children age 7-14 could not read a grade 1 paragraph, and 60% cannot read a grade 2 story in 2005
• More troublingly, NO PROGRESS since 2005.
• Similar results in Kenya, Pakistan, Uganda, ….
2

© Pratham USA. All rights reserved. This content is
excluded from our Creative Commons license. For
more information, see http://ocw.mit.edu/fairuse.
3

4
© Pratham USA. All rights reserved. This content isexcluded from our Creative Commons license. Formore information, see http://ocw.mit.edu/fairuse.

Is it an unsolvable problem?
• A first generation of randomized experiments had disappointing results
• Textbooks, flipcharts
– Kremer et al, in Kenya, distributed textbooks to students in some randomly selected schools. Only the best students benefitted. The average student did not benefit
– Flipcharts had the same (lack of) effect
5

An unsolvable problem?
• Class size reduction:
– In Kenya, when class size was divided in two but students stayed with regular teachers, there was no significant effect on test scores (Duflo, Dupas, Kremer)
– In India, in informal schools, the same result was found when class size was cut in two
• What is common with these interventions?
6

Pratham
• Pratham was established in 1994
• It is the largest non governmental organization that provide support to education in India
• Motto: every child in school and learning well!
7

The Pratham-J-Pal Partnership
• The partnership started in 1999, with the evaluation of one of Pratham’s first program, the Balsakhi program
• Balsakhi: the child’s friend • A young women, from the children’s community,
with 10-12 grade education who is working in the classroom with the students who are lagging behind in class (20 students), for about 2 hours per day, and focus on basic skills
• She is only given basic 2 weeks training and on the job support
8

Program’s possible strength and weaknesses
• Strength: – Focus on child at current level of achievement
– Employs someone from the community
– Good incentive: short contract
– Reduce class size
• Potential weakness: – A much less educated teacher
– Little training.
– Are you depriving the children from a good quality education to replace them with less trained teacher?
9

Balsakhi Evaluation Design: Vadodara
GROUP A GROUP B
GRADE 3 TREATMENT CONTROL
GRADE 4 CONTROL TREATMENT
The evaluation started in the city of Vadodara, Gujarat, and we worked with all the schools in the city. In the first year (2001-2002), we used the following design
10
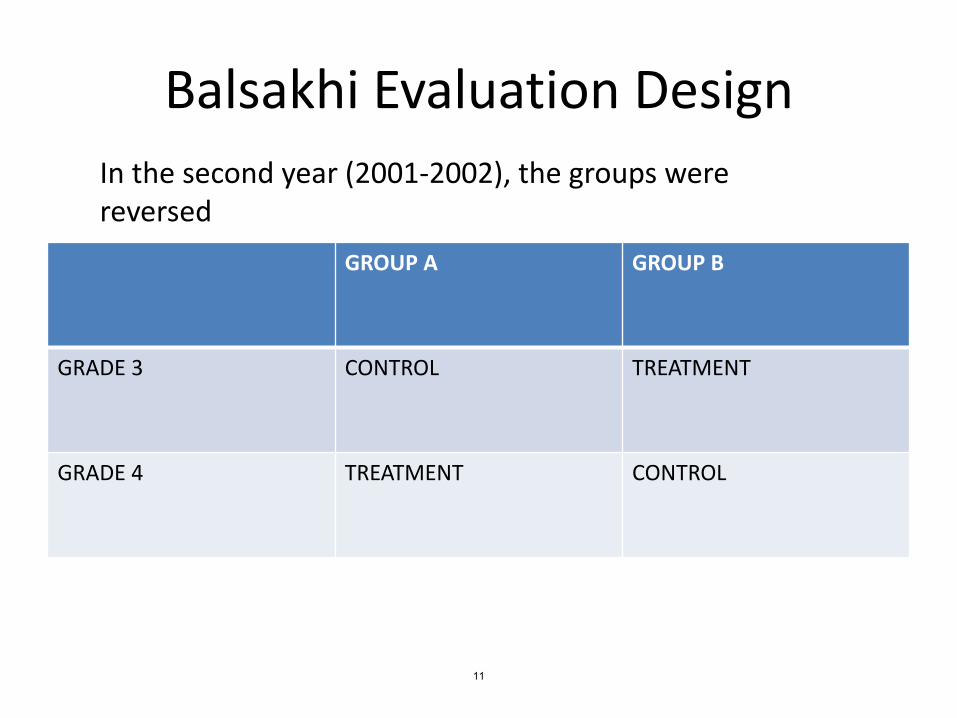
Balsakhi Evaluation Design
GROUP A GROUP B
GRADE 3 CONTROL TREATMENT
GRADE 4 TREATMENT CONTROL
In the second year (2001-2002), the groups were reversed
11

The experimental design
• To look at the effect in year 1, compare:
– Group A students to group B student in class 3
– Group A students to group B students in class 4
• What is the advantage of this design from a practical point of view?
• What could cause a bias in the results?
– It turns out this was not a problem in India
12

Evaluation Design, Bombay
GROUP A GROUP B
Grade 2 TREATMENT CONTROL
Grade 3 CONTROL TREATMENT
GROUP A GROUP B
Grade 3 TREATMENT CONTROL
Grade 4 CONTROL TREATMENT
YEAR 1
YEAR 2
13

Evaluating the impact: Some practical concerns…
• Program was evaluated by administering a test to the children in school: – What do you do with children who are absent? Why
would that be a problem to ignore them? How can that bias our results?
• The solution: find them at home! Less than 10% attrition
– In the pilot year, the testing instrument was at grade level:
• First, teachers cheated! (all the students had the same name in one class).
• Then, when cheating was controlled, we realized that the exam was much too hard. We needed a much easier test
• The solution: develop a much easier test
14

Evaluating the impact: Some practical concerns…
• Program was evaluated by administering a test to the children in school: – What do you do with children who are absent? Why
would that be a problem to ignore them? How can that bias our results?
• The solution: find them at home! Less than 10% attrition
– In the pilot year, the testing instrument was at grade level:
• First, teachers cheated! (all the students had the same name in one class).
• Then, when cheating was controlled, we realized that the exam was much too hard. We needed a much easier test
• The solution: develop a much easier test
15

Evaluating the impact: Some practical concerns…
• Program was evaluated by administering a test to the children in school: – What do you do with children who are absent? Why
would that be a problem to ignore them? How can that bias our results?
• The solution: find them at home! Less than 10% attrition
– In the pilot year, the testing instrument was at grade level:
• First, teachers cheated! (all the students had the same name in one class).
• Then, when cheating was controlled, we realized that the exam was much too hard.
• The solution: develop a much easier test
16

Evaluating the impact: Some practical concerns…
• Program was evaluated by administering a test to the children in school: – What do you do with children who are absent? Why
would that be a problem to ignore them? How can that bias our results?
• The solution: find them at home! Less than 10% attrition
– In the pilot year, the testing instrument was at grade level:
• First, teachers cheated! (all the students had the same name in one class).
• Then, when cheating was controlled, we realized that the exam was much too hard.
• The solution: develop a much easier test
17

Some more practical problems
• In Bombay, about a third of the schools did not get a balsakhi in year 2, for various reasons: – Balsakhi did not pass competency test – Some schools refused the balsakhi because there was
some suspicion that this was a “american” program, after September 2001.
• Can we just drop from the sample the schools that did not get a balsakhi? – The solution:
• Measure an “intention to treat” effect: difference between group A and group B, regardless of whether or not they got the balsakhi.
• To get the treatment effect of the balsakhi per se, divide the intention to treat by the fraction of schools that actually got a balsakhi in the treatment schools.
18

Some more practical problems
• In Bombay, about a third of the schools did not get a balsakhi in year 2, for various reasons: – Balsakhi did not pass competency test – Some schools refused the balsakhi because there was
some suspicion that this was a “american” program, after September 2001.
• Can we just drop from the sample the schools that did not get a balsakhi? – The solution:
• Measure an “intention to treat” effect: difference between group A and group B, regardless of whether or not they got the balsakhi.
• To get the treatment effect of the balsakhi per se, divide the intention to treat by the fraction of schools that actually got a balsakhi in the treatment schools.
19
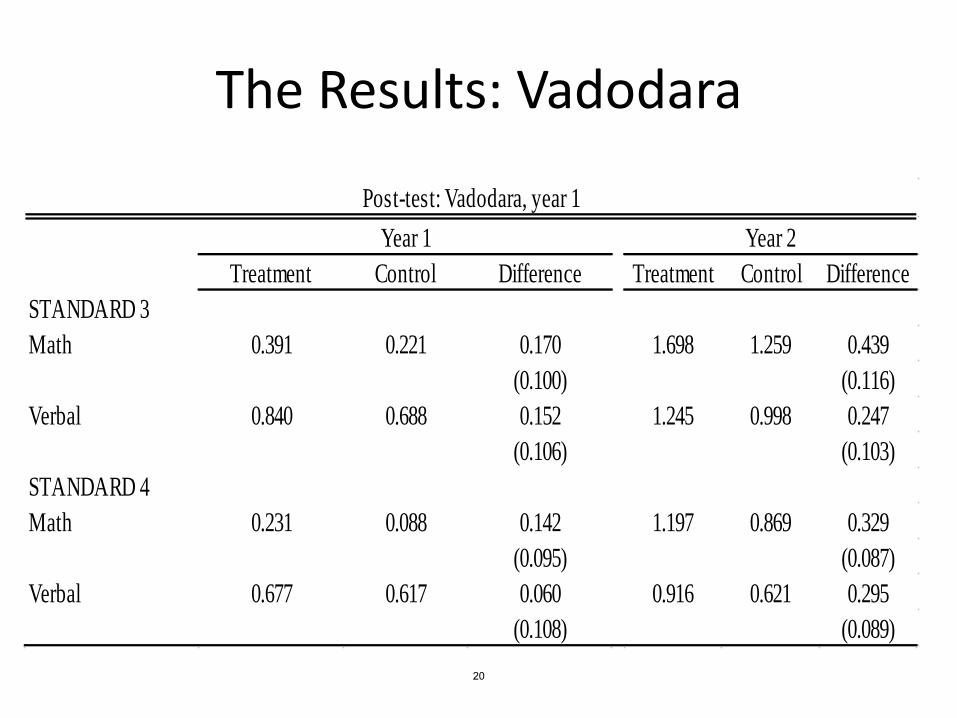
The Results: Vadodara
Treatment Control Difference Treatment Control Difference
STANDARD 3
Math 0.391 0.221 0.170 1.698 1.259 0.439
(0.100) (0.116)
Verbal 0.840 0.688 0.152 1.245 0.998 0.247
(0.106) (0.103)
STANDARD 4
Math 0.231 0.088 0.142 1.197 0.869 0.329
(0.095) (0.087)
Verbal 0.677 0.617 0.060 0.916 0.621 0.295
(0.108) (0.089)
Year 2
Post-test: Vadodara, year 1
Year 1
20

Differences in Differences estimates
• Children’s test score is very stable over time (family influence remains constant, etc)
• Thus, we can reduce the noise in the test score by controlling for pre-test score
• We now ask whether the children in schools that got the Balsalkhi experienced a faster increase in test scores that the school that did not get the balsakhi.
21
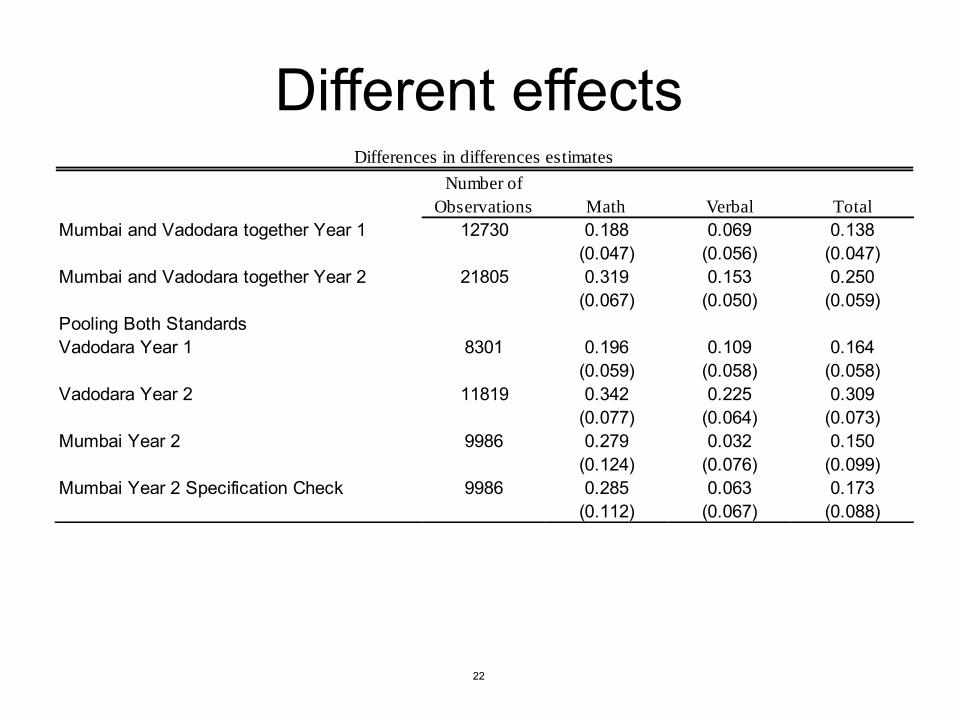
Different effects Number of
Observations Math Verbal Total
Mumbai and Vadodara together Year 1 12730 0.188 0.069 0.138(0.047) (0.056) (0.047)
Mumbai and Vadodara together Year 2 21805 0.319 0.153 0.250(0.067) (0.050) (0.059)
Pooling Both StandardsVadodara Year 1 8301 0.196 0.109 0.164
(0.059) (0.058) (0.058)Vadodara Year 2 11819 0.342 0.225 0.309
(0.077) (0.064) (0.073)Mumbai Year 2 9986 0.279 0.032 0.150
(0.124) (0.076) (0.099)Mumbai Year 2 Specification Check 9986 0.285 0.063 0.173
(0.112) (0.067) (0.088)
Differences in differences estimates
22

Who benefits?
• The program was a remedial, pull out program, targeting mainly children who were initially lagging behind:
• Under what scenario do we expect
– The low achieving children to benefit
– The high achieving children to benefit
– Both children to benefit?
23

Who benefits?
N Math Verbal Total
Fraction of Children
who go to the
Balsakhi N Math Verbal Total
Vadodara and Mumbai together
Bottom Third 4147 0.250 0.146 0.211 0.22 7293 0.507 0.133 0.316
(0.055) (0.061) (0.057) (0.155) (0.093) (0.123)
Middle Third 4271 0.179 0.036 0.115 0.16 7086 0.319 0.034 0.167
(0.057) (0.068) (0.054) (0.136) (0.089) (0.111)
Top Third 4312 0.127 0.016 0.079 0.06 7426 0.039 -0.038 -0.003
(0.062) (0.072) (0.060) (0.151) (0.076) (0.106)
Year 1 Year 2
24

Conclusions from this first study
• Scores entirely concentrated among children who saw the Balaskahi
• It is possible to improve test score rapidly, if you focus on this particular task: – 0.5 standard deviations is a very large effect by
the standard or most education intervention
• However, teachers did not use the free resources to teach better.
• What more would we like to learn?
25

Many questions:
• Is it also possible to make progress at higher levels?
• Can the program produce even larger effects at the basic level by focusing on reading first?
• Would the results generalized to rural areas, and in poorer environments?
• Is is a questions of pedagogy, incentives, or both – Can the regular teachers be trained in the pratham
pedagogy? – Would they actually put it in practice? – Would it produce effects?
26

The next steps
• To answer these questions, and many others, we embarked in a series of other evaluations with the Pratham team, now in a full fledge partnership where we participated in the program design and Pratham participated in the evaluation design.
27

The Read India Program
• Having realized the extent of the gap between what children know and the curriculum, Pratham decided to first re-focus on even more basic skills: They designed the Read India program, a program to teach reading to children.
• We evaluated the Read India program in rural Uttar Pradesh (Jaunpur district).
28

The Jaunpur Evaluation
• Design: – 3 groups of villages:
• General Information only: parents were given information about the resources available to them within the school system
• Specific information: Parents were taught how to test their own children reading skills and a report card was made for the village, and then discussed
• Read India volunteers: A group of volunteers came forward to be trained in the Pratham Read India pedagogy and organize classes for the kids in the village.
29

The Results in one graph
0
0.1
0.2
0.3
0.4
0.5
0.6
Could read letters Could read paragraph
Control
Information only
information+tests
Read India
Endline results of children who could read nothing at baseline
30

Accounting for partial participation
• Only 13% of kids who could not read attended the reading camp.
• If the 8 pp difference in kids who could read at least letter is accounted for by them, then the effect is much larger: 8 % divided by 13 %=60%
31

All children who attended can read letters!
0
0.2
0.4
0.6
0.8
1
1.2
Category 1
Control
Information
Information +test
Read India
32

Interpretation
• So the Read India strategy is effective in teaching basic skills
• Just the knowledge that something is wrong is not sufficient for parents to make a difference
• But if they are given a clear direction, the village can come together and run with it
• But why did so few children attended the camp?
33

Reaching more children
• Pratham was satisfied with these results
• Partly thanks to them, they were able to raise money (notably from Gates and Hewlett Foundations) to expand the Read India campaign
• But they felt that, to reach a maximum number of children, they should try working through the State education systems.
• Is it possible? Can teachers be trained in the method, and can they implement it?
34

The Bihar and Uttarakhand Read India Evaluations
• To find this out, we decide to work together on an evaluation of the Read India campaign in two States, in Bihar, and in Uttarakhand
• In Bihar, 4 models: – A summer camp, taught by government teachers – Train teachers to implement regular pedagogy – Train volunteers to implement roughly the same program
as in Jaunpur – Distribute only materials
• In Uttarakhand, 2 models: – Teacher training – Volunteers, but in school.
35
The Findings
• Replication of Jaunpur result: – Positive and significant impact of the teacher, material
and volunteer intervention. – The read india methodology now covers more
advanced material and we see effects at every level, with a more advanced tests.
• However: – Teachers only do little (only significant effect is small
effect on hindi-written) – When they are in class, volunteers have no effect at
all…..
36

What is going on?
• Is it that teachers are absolutely incorrigible?
• The summer camps in Bihar suggest that it is not the case: – Positive and significant effect of the summer
camps on learning as well---and they were taught by the regular teachers.
• So teachers can use the methodology if they so chose… but it seems that they usually don’t chose to.
37

Where are we?
• Improving the quality of teaching is possible, and not even that difficult
• A cadre of high school graduates with a short training and high motivation can do it!
• The puzzle: why is this objective not taken up more: – By school systems? – By teachers? – By parents? – By private schools?
• We will try to answer this question next time.
38

MIT OpenCourseWarehttp://ocw.mit.edu
14.73 The Challenge of World PovertySpring 2011 For information about citing these materials or our Terms of Use, visit: http://ocw.mit.edu/terms.