Embed Size (px)
Citation preview
Hydrogasification Kinetics of Biturdnous Coal and Coal Char
J. A. Gray, P. 3. Donate l l i , P. M. Yavorsky
U.S. Energy Research and Development Administration P i t t sburgh Energy Research Center
P i t t sburgh , Pennsylvania 15213 4800 Forbes Avenue
103
INTRODUCTION
Of the many processes cu r ren t ly under development which w i l l convert c o a l t o environmentally acceptable s o l i d , l i qu id , and gaseous f u e l s u t i l i z i n p py ro lys i s , synthes is gas, so lvent ex t r ac t ion , or hydrogenation techniques, t he d i r e c t hydro- genation of coa l t o a raw gas t h a t i s e a s i l y upgraded t o p ipe l ine qua l i t y Is a promising approach. Energy Research Center and is known as WDRANE (I., 2).
Such a process i s under development by t h e E.R.D.A., P i t t sburgh
I I Brief ly , t h e HYDRANE flow shee t is a s follows. Pulverized r a w coa l is fed t o
t h e top zone of t h e hydrogas i f ie r , operated at 70 atm and 750°-900" C, where i t f a l l s f r ee ly as a d i l u t e cloud of p a r t i c l e s through a hydrogen-rich gas conta in ing some methane from t h e lower zone. About 2 0 pc t of t h e carbon in t he r a w coa l i s converted t o methane, causing t h e coal p a r t i c l e s t o lose t h e i r v o l a t i l e matter and agglomerating c h a r a c t e r i s t i c s and t o form very porous, reactive char p a r t i c l e s . char f a l l s i n t o the lower zone, operated a t 70 atm and 900°-980" C, where hydrogen feed gas maintains t h e p a r t i c l e s i n a f lu id i zed s t a t e and reacts with an add i t iona l 25 pc t of t h e carbon t o make methane. dilute-phase zone and is cleaned of entrained s o l i d s , t a r s and o i l s , and some unwanted gases. carbon monoxide g ives a p ipe l ine qua l i t y , high-Btu, s u b s t i t u t e n a t u r a l gas. Char from t h e lower zone of t h e hydrogas i f ie r is reac ted wi th steam and oxygen t o make t h e needed hydrogen.
This
The product gas e x i s t s from t h e bottom of t h e
Af te r cleanup, c a t a l y t i c methanation of t h e smal l amount o f r e s idua l
This process has t h e following advantages:
\
1.
2.
3.
4.
5 .
6 .
External hydrogen consumption per un i t of methane produced i s low because the hydrogen already i n the c o a l is e f f i c i e n t l y u t i l i z e d ,
Process cos ts assoc ia ted with coa l pretreatment, inherent i n o the r coa l conversion processes based on caking bituminous c o a l feedstocks, a r e eliminated,
95 percent of the product methane is produced d i r e c t l y i n t h e hydrogas i f ie r thus requi r ing very l i t t l e c a t a l y t i c methanation,
Simple r eac to r design,
Produces law-sulfur char byproduct f o r hydrogen peneration and low- s u l f u r t a r s , and
U t i l i z e s sens ib l e hea t of the r e s idua l char from the hydrogas i f ie r i n t h e hydrogen generation p lan t .
Because of these advantages, coa l and oxygen ( the c o s t l i e s t items i n g a s i f i c a t i o n ) requirements a r e minimized f o r t he process, and thermal e f f i c i ency and carbon u t i l i z a t i o n a r e high a t 78 pc t and 44 p c t , respec t ive ly (2, 4).
104
Much of t h e hydrogas i f ica t ion k i n e t i c da ta on the labora tory s c a l e , f r e e - f a l l ,
I n t h i s paper w e review previous and some recent dilute-phase reac tor has a l ready been published (5, 5) as w e l l as d a t a from a semiflow bench-scale r e a c t o r (1). k i n e t i c da t a w i t h regard t o t h e type of reac tor used t o obta in the da t a , and the e f f e c t of t h e type of r eac to r on the conversion data. mineral elements i n t h e coal during hydrogas i f ica t ion and t h e char y i e l d are shown t o be r e l a t e d t o t h e carbon conversion regard less of t h e r eac to r geometry used, so t h a t t he cons t i t uen t conversions can be ca lcu la ted once the carbon conversion i s known. This s impl i f i e s t h e r e a c t o r design i n t h a t only t h e carbon conversion need be k i n e t i c a l l y defined f o r a p a r t i c u l a r reac tor geometry.
The conversion of the non-
EXPERIMENTAL REACTORS
"Hot-Rod" Reactors (HR)
I n 1955 E l Paso Natura l Gas Company entered i n t o a cooperative agreement wi th t h e then U.S. Bureau of Mines Synthe t ic Fuels Research Branch t o inves t iga t e t h e hydrogenation of a subbituminous New Mexico coa l t o produce high-Btu gas and low- b o i l i n g aromatics. P a r t of t h e agreement ca l led f o r tests i n a r eac to r i n which dry coa l could b e rap id ly brought t o t h e des i red opera t ing temperature and pressure. normal autoclave requi red over an hour t o reach temperature. of t he hea t ing and cooling cyc les on t h e reac t ion could n o t be discerned. Hiteshue conceived the apparatus known as the "hot-rod" r eac to r and completed t h e E l Paso p ro jec t using it. Hiteshue, Anderson, and Schles inger i n 1957 (i) and aga in dur ing 1960-1964 (2 ,g ) .
A Consequently, t h e e f f e c t
In late 1955,
The apparatus along wi th conversion d a t a were f i r s t reported by
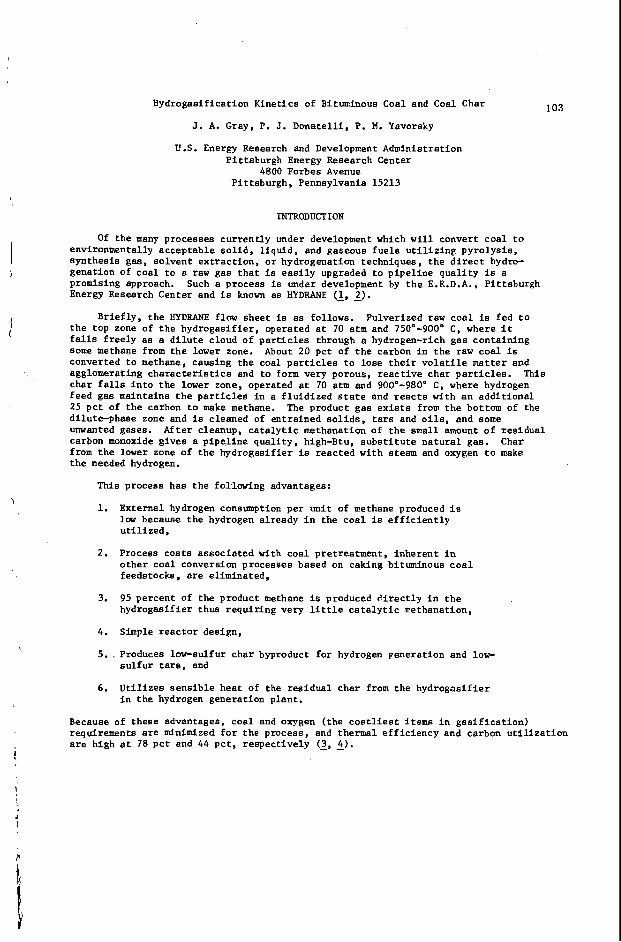
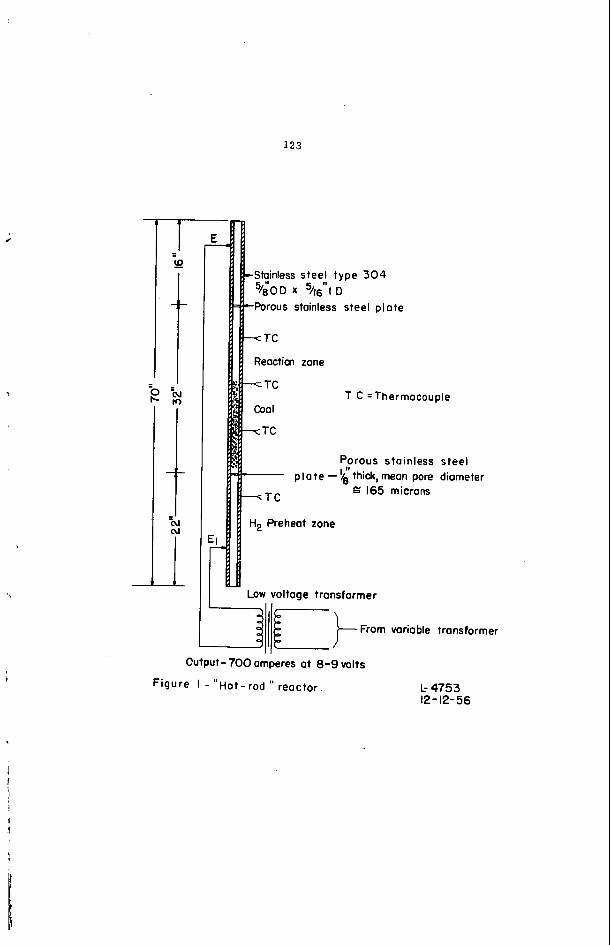
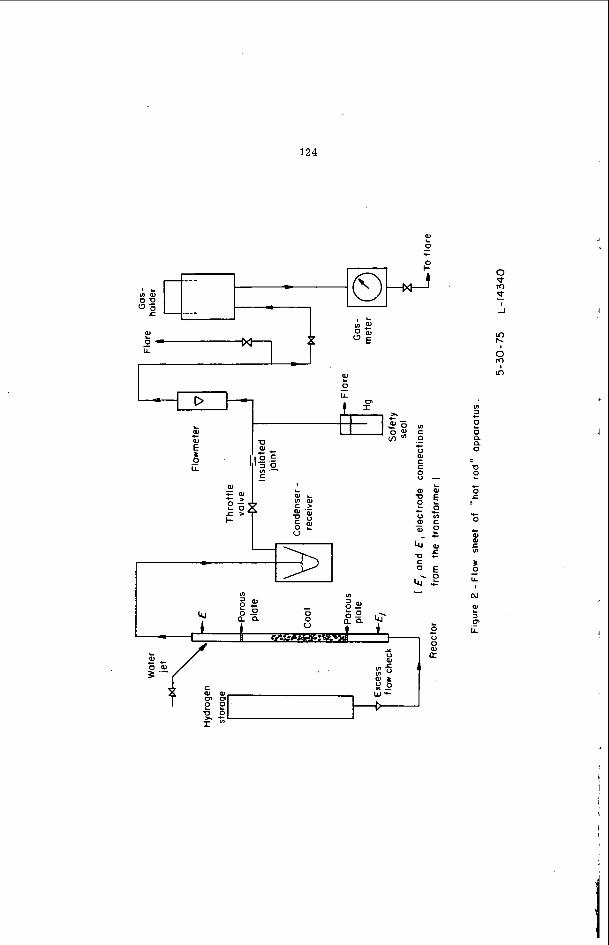
The "hot-rod" r eac to r , shown i n F igure 1, was a 70-inch long s t a i n l e s s steel tube (type 304) having a 5/16-inch i n s i d e diameter and a 5/8-inch outs ide diameter. A coa l o r char sample weighing 8 grams and screened t o 30 x 60 U.S. s i eve s i z e was i n s e r t e d i n t o the tube between two porous s t a i n l e s s s t e e l d i sks such t h a t a 32-inch length w a s ava i l ab le t o f l u i d i z e t h e sample. cur ren t by connecting i t t o a transformer tha t wae capable o f supplying 700 amperes a t 9 vol t s . W i t h t h i s method o f hea t ing , t h e r eac to r , sample, and feed gas w e r e heated from room temperature t o 800' C i n about 2 minutes and t o 1200' C i n about 4 minutes, A t the end of t h e experiments, the r eac to r and sample were cooled t o room temperature in about 10 seconds by spraying with co ld water. The flowsheet of t he e n t i r e apparatus is shown i n Figure 2 and has been discussed i n d e t a i l i n t he previously c i t e d re ferences ,
Free-Fall D i l u t e Phase Reactor (FDP)
The tube w a s heated wi th e l e c t r i c a l
The agglomeration of bituminous coa l s i n hydrogen is a major problem i n designing a r eac to r f o r t h e i r continuous hydrogenation t o produce a high-Btu gas. It has been shown t h a t bituminous coa ls , both caking and noncaking, w i l l agglomerate when r ap id ly heated i n hydrogen a t 500 psig and 500" C o r a t 6,000 ps ig and 500° t o 800° C (lo, 13, 14) . no t agglomerate a t 500 p s i g and 500' C. Chars produced from carbonizing bituminous coa ls , cokes, g raphi te and an th rac i t e , and a h ighly oxidized hvAb coa l did not agglomerate. Feldmenn (i) observed t h a t e t l e a s t 1 0 pc t of t he v o l a t i l e matter i n P i t t sburgh seam hvAb coa l , o r i g i n a l l y containing 36 p c t v o l a t i l e matter, had t o be removed t o obta in a char t h a t would not agglomerate a t 1,000 p s i g and 800° C i n hydrogen i n subsequent "hot-rod" r eac to r t e s t s .
Texas lignite agglomerated a t 6,000 ps ig and 800' C bu t d i d
Lewis and Hiteshue (15) designed an ent ra ined flow reac to r f o r continuously hydrogenating both caking (hvAb) and noncaking (hvCb) coals. t h e suspension of c o a l i n t h e feed gas w a s d i l u t e enough ( d i l u t e phase), pa r t i c l e -
They be l ieved t h a t i f
105
\
p a r t i c l e co l l i s ion and subsequent agglomeration could be avoided. a l /&inch ins ide diameter, 60-foot long h e l i c a l tube, and was operated a t 600 pSig and 800' C. hydrogen ve loc i ty was 2 fps. because of so l id s p lwg ing a t about t he 500 t o 550' C zone i n the h e l i c a l tube. Changing t o a s t r a i g h t , hor izonta l tube r eac to r having an i n t e r n a l d i ane te r of 5/16 inches and a length of 20 f e e t d id not a l l e v i a t e t h e plugging problem.
The r eac to r was
The coa l was en t ra ined at a rate of 60 g r s /h r i n hydrogen where t h e Experiments wi th the h e l i c a l reac tor were unsuccessful
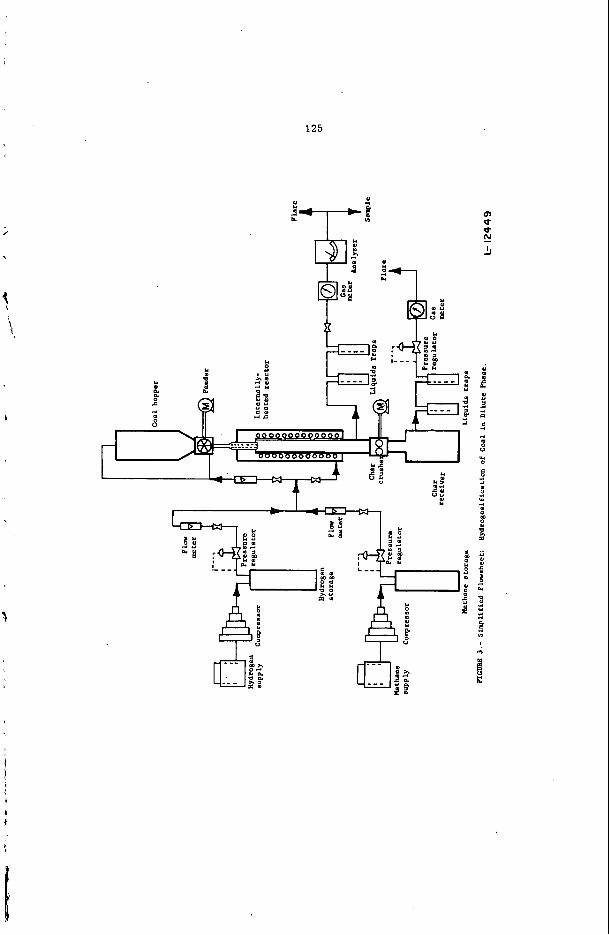
A 4-inch diameter v e r t i c a l r eac to r where t h e coa l p a r t i c l e s would not contac t t h e r eac to r wall during devo la t i l i za t ion w a s found t o opera te very successfu l ly . It was fu r the r shown t h a t reducing the diameter t o l e s s than 3 inches caused plugging, again due t o coa l p a r t i c l e s contacting t h e r eac to r wall . l abora tory dilute-phase r eac to r t h a t evolved fro= these s tud ies .
Figure 3 shows t h e
A l a r g e amun t of k t n e t i c da ta has been reported f o r t h i s r eac to r using Pi t t sburgh seam hvAb and I l l i n o i s 1/6 hvCb coa l s (5, a, l6, lJ). l abora tory reac tor and method of operation are discussed i n the previous references.
De ta i l s of t h e
The present FDP reac to r i s a 3.26-inch in s ide diameter pipe t h a t is heated through the wall and contained i n a 10-inch diameter pressure she l l . i n j ec t ed i n t o the top of t h e r eac to r through a 5/16-inch i n s i d e diameter, water-cooled nozzle using a ro t a ry feeder and p a r t of t he feed gas. a 5-foot long r eac to r concurrently wi th t h e feed gas a t a p a r t i c l e res idence t i m e of less than a second. Agglomeration is avoided because t h e rap id hea t ing d e v o l a t i l i z e s t h e p a r t i c l e s before many p a r t i c l e c o l l i s i o n s with t h e wall o r o the r p a r t i c l e s can occur. The char product is recovered from a cooled hopper a f t e r each experiment and is analyzed. Gas flows and compositions a r e measured over steady state per iods of t h e experiment so t h a t mass balances can be ca lcu la ted .
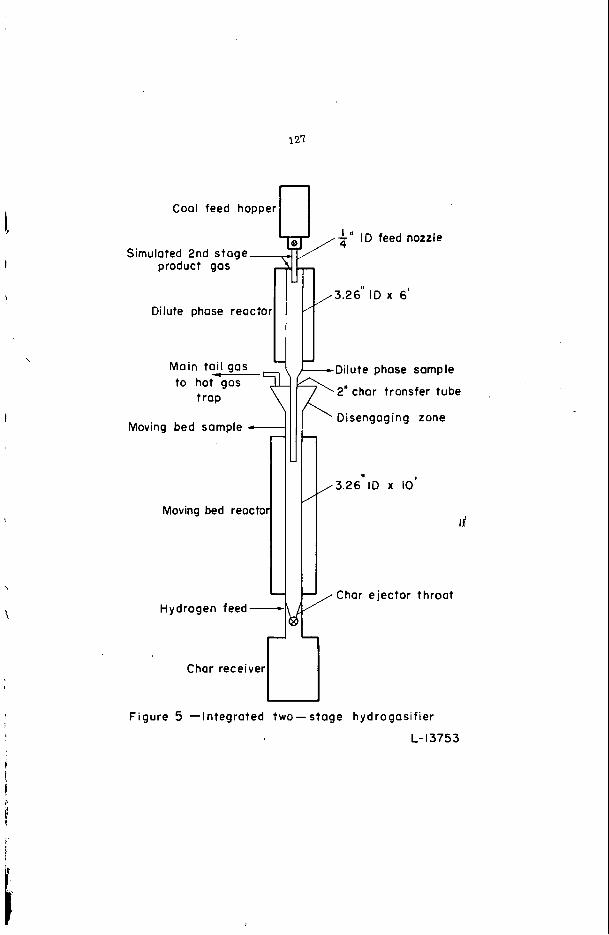
Two-Stage Integrated Reactor
Coal i s
The coa l f r e e - f a l l s through
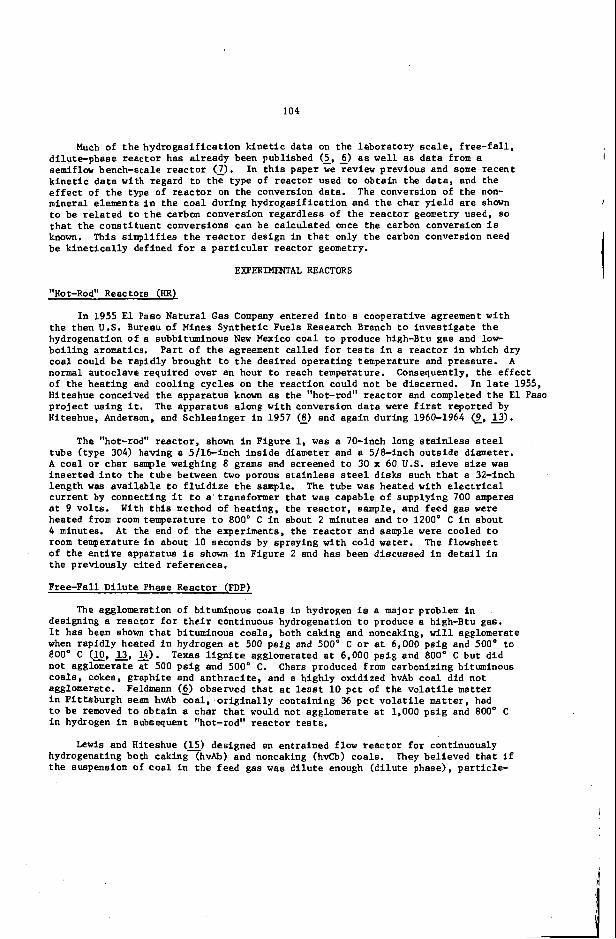
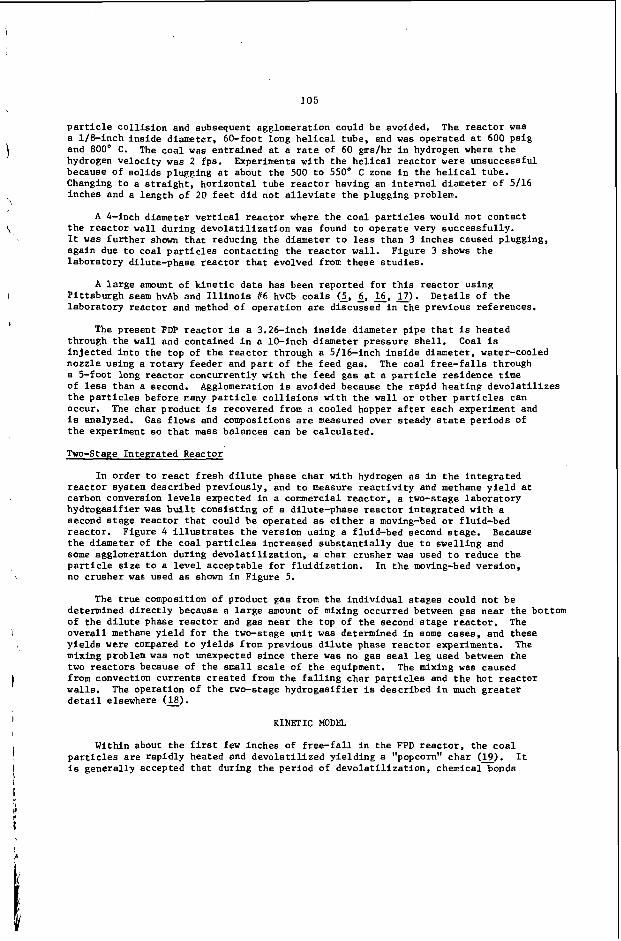
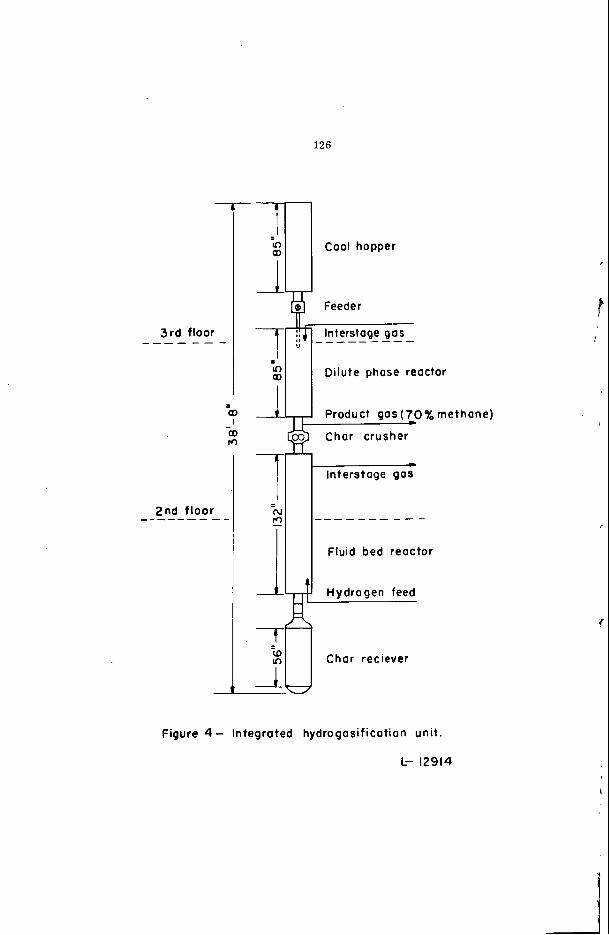
In order t o r e a c t f r e sh d i l u t e phase char with hydrogen a s i n t h e in t eg ra t ed r eac to r system described previously, and t o measure r e a c t i v i t y and methane y i e l d at carbon converaion l e v e l s expected i n a commercial r eac to r , a two-stage labora tory hydrogas i f ie r w a s b u i l t cons i s t ing of a dilute-phase r eac to r i n t eg ra t ed wi th a second s t age reac tor t h a t could be operated a s e i t h e r a moving-bed o r fluid-bed reac tor . t h e diameter of t he coa l p a r t i c l e s increased subs t an t i a l ly due t o swel l ing and some agglomeration during devo la t i l i za t ion , a char crusher was used t o reduce the p a r t i c l e s i z e t o a level acceptable f o r f lu id i za t ion . In t h e moving-bed vers ion , no crusher was used as shown i n Figure 5.
Figure 4 i l l u s t r a t e s t h e vers ion using a fluid-bed second s tage . Because
The t rue composition of product gas from t h e ind iv idua l s tages could no t be determined d i r ec t ly because a l a r g e amount of mixing occurred between gas near t he bottom of the d i l u t e phase r eac to r and gas near t h e top of t he second s t age r eac to r . o v e r a l l methane y i e l d f o r t he two-stage u n i t was determined i n some cases , and these y i e lds were compared t o y i e lds from previous d i l u t e phase r eac to r experiments. mixing problem was not unexpected s ince t h e r e w a s no gas seal l e g used between t h e two r eac to r s because of t he small s c a l e of t h e equipment. from convection cur ren ts c rea ted from t h e f a l l i n g char p a r t i c l e s and t h e ho t r eac to r w a l l s . d e t a i l elsewhere (Is).
The
The
The mixing was caused
The operation of t he twc-stage hydrogas i f ie r is described i n much g rea t e r
KINETIC MODEL
Within about t he f i r s t few inches of f r ee - f a l l i n the FPD reac to r , t he c o a l p a r t i c l e s a r e rap id ly heated and devo la t i l i zed y i e ld ing a "popcorn" char (E). is genera l ly accepted t h a t during the per iod of devo la t i l i za t ion , chemical bonds
It
,
such a s methylene bridges, oxygen bonds, and s i d e cha ins are e a s i l y broken r e s u l t i n g i n evolu t ion o f hydrogen r i c h v o l a t i l e matter and a l a r g e number of f r e e r a d i c a l s t r u c t u r e s (2, 20, 21, 22). These f r e e r ad ica l s can r e a c t wi th hydrogen forming hydrocarbon gases and s o l i d species t h a t are a c t i v e f o r f u r t h e r hydrogenation t o v o l a t i l e ma te r i a l or combine by polymerization t o form a highly aromatic, unreac t ive char s t ruc tu re . During f r e e - f a l l , bu t a f t e r rapid devo la t i l i za t ion has occurred ( a f t e r about 6 inches), t h e s o l i d carbon is very r eac t ive i n behavior as though n o t enough t i m e has elapsed f o r s i g n i f i c a n t polymerization t o proceed (2). when t h e char i s fu r the r reac ted with hydrogen in a second-stage r eac to r such a s a fluidized-bed or moving-bed, t h e hydrogas i f ica t ion rate i s about two orders of magnitude slower (1, g). Thus, the coa l s t r u c t u r e and r e a c t i v i t y change cons tan t ly during reac t ion .
However,
Feldmann (2) has proposed t h a t f o r k i n e t i c modeling purposes t h e carbon i n t h e raw coa l can be divided i n t o th ree types during hydrogasification. Type 1 carbon i s t h e highly r eac t ive spec ies which is f lashed of f almost instantaneously during rap id heat-up and devo la t i l i za t ion , Type 2 i s t h e s o l i d carbon which readi ly hydrogas i f ies during most o f t h e p a r t i c l e f r ee - f a l l , and Type 3 is t h e low-reactivity carbon contained i n t h e remaining, polymerized char s t ruc tu re . Johnson (23) has proposed a very s imi l a r model.
In developing a r eac t ion rate expression f o r the hydrogas i f ica t ion of coa l i n the FDP r e a c t o r (2). t h e Type 1 carbon i s assumed t o d e v o l a t i l i z e instantaneously and t h e remainder of hydrogas i f ica t ion occurs wi th Type 2 carbon. be wr i t t en as
The r eac t ion can
1) Char + AH2 + CH4
f o r t he d a t a a t high hydrogen p a r t i a l p ressures (PH 50-60 atm) (A), and a s , 2
Char + AH2 + CHI, + O i l + Light Hydrocarbons 2)
f o r da ta a t lower hydrogen p a r t i a l p ressures (5). An empir ica l co r re l a t ion of A , t h e s to i ch iomet r i c coe f f i c i en t , has been developed from t h e h igh p res su re d a t a and is
where x i s t
A =
: t o t a l
1.0 f o r x < 0 . 4 5
ax-2.6 f o r 0 . 4 5 x 5 0 .55
1.8 f o r x > 0.55 I 'ac t i o n a l carbon conversion.
3)
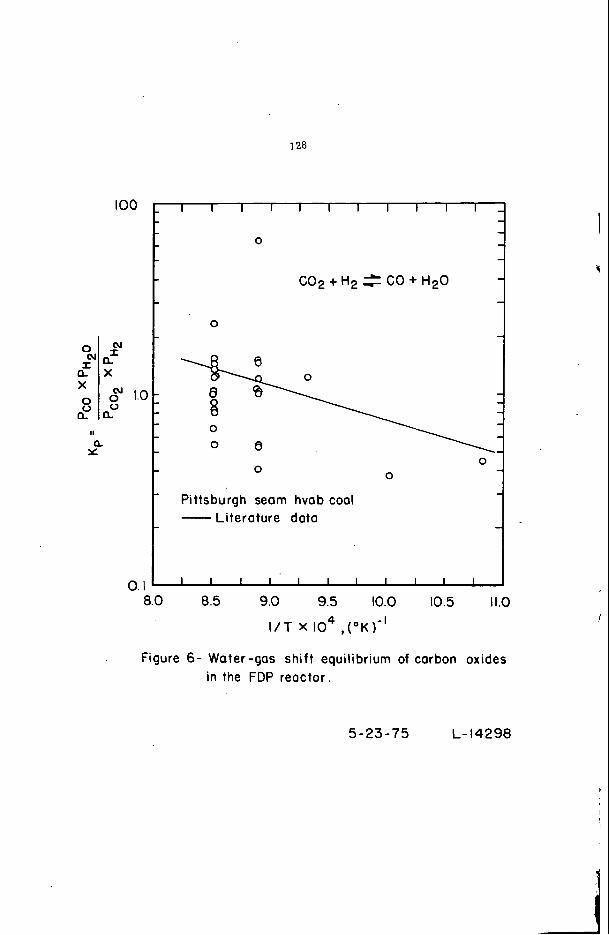
The o i l y i e l d h a s been as h igh a s 5X f o r P i t t sburgh s e a r hvAb coa l and 6% f o r A small amount of carbon oxides a r e produced (usua l ly l e s s I l l i n o i s /I6 hvCb coal.
than 4% of the product pas) and are i n equilibrium according t o the water-gas s h i f t reac t ion a s shown i n F i p r e 6 .
The hydrogas i f ica t ion of Type 2 carbon follows the r a t e equation
e - k P (a-x) 4 ) d t H 2
where x i s the f r a c t i o n a l carbon conversion, P the hydrogen p a r t i a l pressure, a t h e H2
i
i
\
I
107
f r ac t ion of t he carbon which is ava i l ab le f o r reac t ion i n the rep ine being considered and k t h e reac t ion rate constant. devola t i l i zed carbon is not included i n t h e f r a c t i o n a l carbon conversion i s
Another way of wr i t ing Equation 4 where t h e
where 2 = (x-E)/(l-E) and B = (a-E)/(l-F). t h a t was devola t i l i zed . r eac to r a t t a i n te rmina l ve loc i ty and the same temperature a s t he r eac to r wa l l almost i w e d i a t e l y , Equation 4 may be appl ied to the FDP r eac to r a s
E corresponds t o the f r a c t i o n of carbon A s s d n g the coal p a r t i c l e s being fed t o t h e d i l u t e phase
'\
1
where UT i s the p a r t i c l e terminal velocity. length y ie ld ing
Equation 6 is in t eg ra t ed over t he r eac to r
X
dx L 'HZ
E
In the in t eg ra t ion , P B ~ i s assumed constant and i n the product pas because extensive backmixing and t h e downward flow of char. The f r ac t ion of i n the in tegra t ion . Within the cons t r a in t t h a t
7)
equal t o the hydrogen p a r t i a l p ressure occurs due t o t h e h o t r eac to r wal l s Type 1 carbon is accounted f o r a s E 0 < a I 1. the b e s t f i t of carbon
~
conversion da ta from t h e FDP r eac to r is obtained when a = 1 - ( 2 ) . e s sen t i a l ly a l l of t h e carbon i s ava i l ab le f o r hydrogasification.
This means t h a t
The hydrogas i f ica t ion of char i n a "hot-rod", moving-bed, o r fluid-bed reac tor follows the 8am.e rate expression given by Equation 4 , however, t he reac t ion i s much slower because most of the carbon t h a t i s reac t ing i s of t he Type 3 var ie ty . Application of Equation 4 t o fluid-bed and moving-bed r eac to r s has been discussed elsewhere (E).
The rate expression does not take i n t o account t r a n s i t i o n s between the various r eac t ive types of carbon i n t h e coa l nor mass t r a n s f e r r e s i s t ance . hydrogasification of char i s so complex because of the change i n carbon s t r u c t u r e during reac t ion , t h a t t he above simple c l a s s i f i c a t i o n of carbon may no t apply i n a l l casea. char bu t a160 adds another constant i n t o t h e w d e l w h i c h mst b e eva lua ted using experimental data. Generally the more constants there are in a m.odel, t he b e t t e r t he model w i l l f i t regard less of the accuracy of t he proposed r eac t ion mechanism, and the pore experimental da ta is needed t o eva lua te the constants. Fo r t h i s reason, Equation 4 was kept simple so t h a t da ta from various r eac to r s could be e a s i l y cor,pared. With t h i s perspective, t he da ta from each of the reac tor systems will now be discussed.
In f a c t the
Johnson's model (23) takes in to account the continuous deac t iva t ion of t he
EWERIMENMI, RESULTS
FLIP Reactor
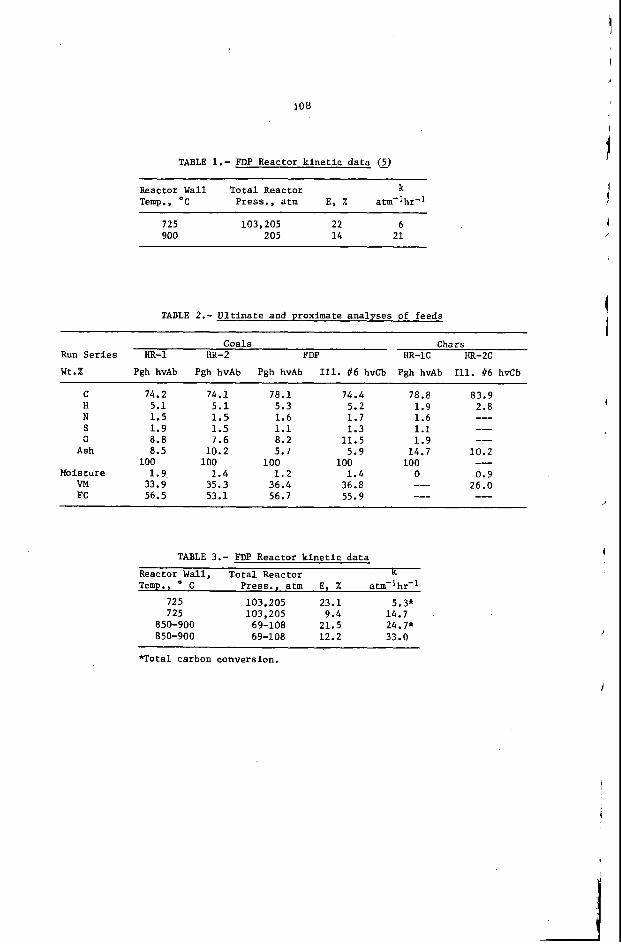
Using Equation 7 and a terminal ve loc i ty of 9 fps , Feldmann (2) determined E and k values f o r carbon conversion data a t 900' C and 725' C. These values are l i s t e d in Table 1. a s a function of hydrogen p a r t i a l p ressure and presented recent 850"-900° C ( t o t a l
I n a later publ ica t ion , Feldmann (2) reanalyzed the 725" C data
k
108
TABLE 1.- FDP Reactor k i n e t i c da t a (2) ~ ~~
Reactor Wall To ta l Reactor k Temp., O C Press., a t m E, % atrn-lhr-l
725 103,205 22 6 900 205 1 4 21
TABLE 2.- U l t i m a t e and proximate analyses of feeds
Coals Chars Run S e r i e s HR-1 IIR-2 FDP HR-1c HR-2C
W t . % Pgh hvAb Pgh hvAb Pgh hvAb Ill. (16 hvCb Pgh hvAb Ill. C6 hvCb ~ ~~~~
C 74.2 74.1 78.1 74.4 78.8 83.9 H 5.1 5.1 5.3 5.2 1 . 9 2.8 N 1.5 1.5 1.6 1 . 7 1.6 S 1.9 1.5 1.1 1.3 1.1 0 8.8 7.6 8.2 11.5 1.9
--- --- ---
Ash 8.5 10.2 5.7 5.9 14.7 10.2 100 100 100 100 100
Moisture 1.9 1.4 1 . 2 1.4 0 0.9 26.0 VM 33.9 35.3 36.4 36.8 ---
FC 56.5 53.1 56.7 55.9
---
--- ---
TABLE 3.- FDP Reactor k i n e t i c da t a
Reactor Wall, To ta l Reactor Lc Temp., C Press., a t m E, % atm-lhr-'
725 103,205 23.1 5.3* 725 103,205 9.4 14.7
850-900 69-108 21.5 24. 7* 850-900 69-108 12.2 33.0 I
*Total carbon conversion.
,
J
t
I
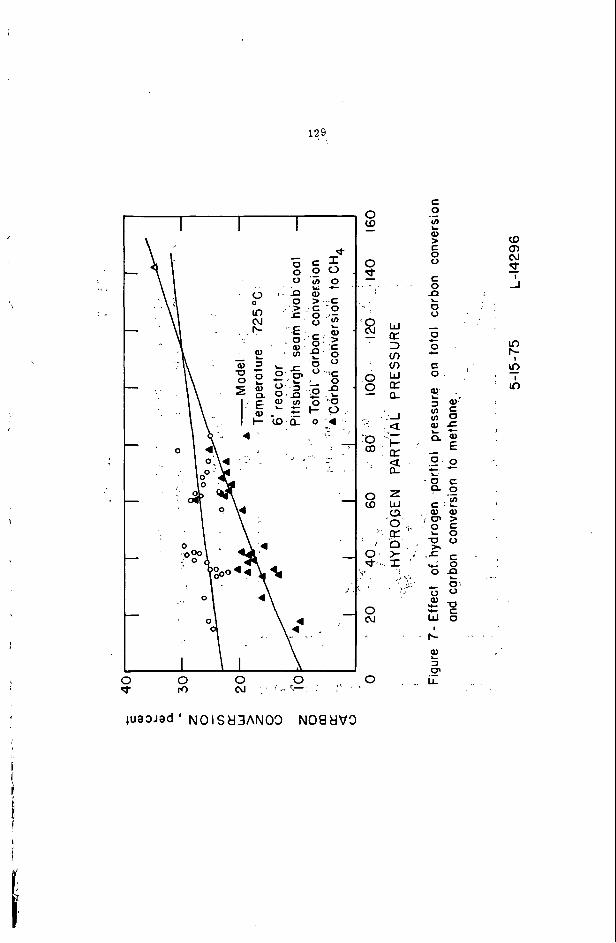
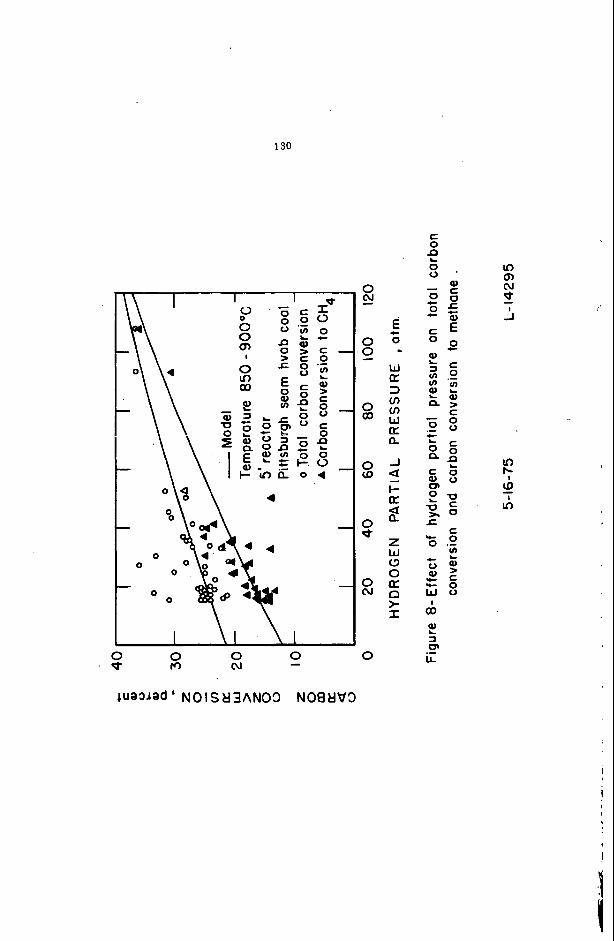
pressure 69-108 atm) da ta (k). a r e shown in Table 2 f o r t he FDP and "hot-rod" reac tors . carbon conversion da ta as t o t a l carbon conversion and a s carbon conversion t o equivalent methane (carbon in methane and ethane).
The ult imate and proximate analyses of t h e feed coa l s Figures 7 and 8 show t h e
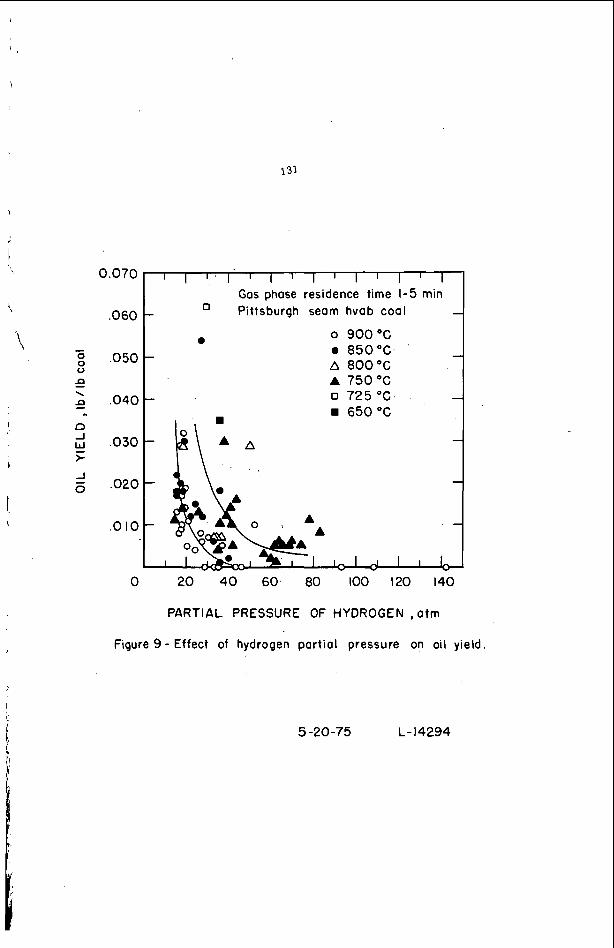
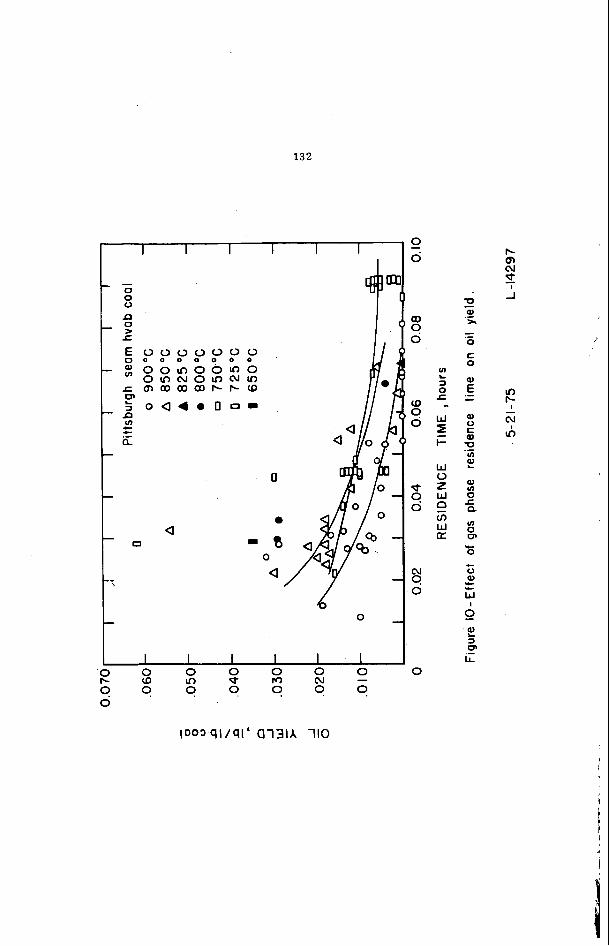
The d i f fe rence between t o t a l carbon conversion and carbon conversion t o methane is due mainly t o t h e production of carbon oxides and o i l . i s a l s o introduced in measuring the flowrate and composition of t h e feed and product gases, and in recovery and ana lys i s of the s o l i d and l i q u i d products. run times were not long enough t o c o l l e c t enough oil so t he y i e l d could be accura te ly measured (2). much lower than 100 pc t . w e l l as reac tor temperature g rea t ly influences the anount of o i l produced, espec ia l ly below a p a r t i a l p ressure of 30 a t m . p a r t i a l pressure agrees wi th the divergence of the two carbon conversion curves i n Figures 7 and 8. hydrocracking of t he o i l products. r eac to r a l s o a f f e c t s t he o i l y i e ld causinp lower amounts of o i l a t increas ing residence time as shown in Figure 10. determined by recovery from the gas sample and main t a i l gas streams. of the o i l w a s l o s t by condensation on t he char r ece ive r wa l l and t o some ex ten t on t h e char in t h e rece iver . where t h e y i e ld in t h e gas sample stream is mult ip l ied by the r a t i o of t he t o t a l product gas flowrate t o t h e sample gas f lowra te i n order t o es t imate t o t a l o i l y i e ld . These values w i l l probably be higher than the repor ted values.
Some experimental e r r o r
@ften the
These e r r o r s becove obvious when the carbon and ash recoveries a r e Figure 9 ind ica tes t h a t t h e hydrogen p a r t i a l p ressure as
The increase in oil y i e l d wi th decreasing hydrogen
Apparently t h e higher hydrogen p a r t i a l p ressures enhance t h e Residence time of the hydrocarbon vapors in the
A s ind ica ted in Figure 5 , t h e o i l y i e l d was However, some
Therefore t h e oil y i e l d d a t a are now beinp reexamined
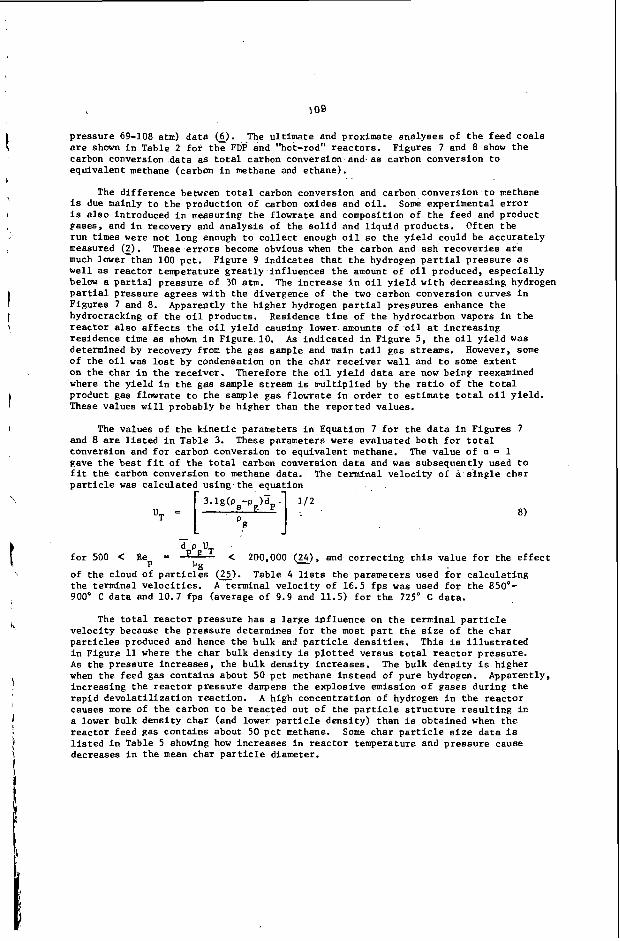
The values of t h e k i n e t i c parameters in Equation 7 f o r the d a t a in Figures 7 and 8 are l i s t e d i n Table 3. conversion and f o r carbon conversion t o equivalent methane. The va lue of a - 1 gave t h e b e s t f i t of t he t o t a l carbon conversion da ta and w a s subsequently used t o f i t t he carbon conversion t o methane data. The terminal ve loc i ty of a s i n g l e char p a r t i c l e was ca lcu la ted using the equation
= [ p g g 3 .
These parameters were evaluated both f o r t o t a l
3.1g(Ps-P )ZP 1 / 2 8)
- d p U
f o r 500 < ReD = peT C 200,000 (z), and- cor rec t ing t h i s va lue f o r the e f f e c t U, ' 5
of the cloud oi p a r t i c l e s (25). the terminal ve loc i t i e s . 900' C data and 10.7 fps (average of 9.9 and 11.5) f o r t he 725" C data .
Table 4 lists the parameters used f o r ca l cu la t ing A terminal ve loc i ty of 16.5 fps w a s used f o r t h e 850'-
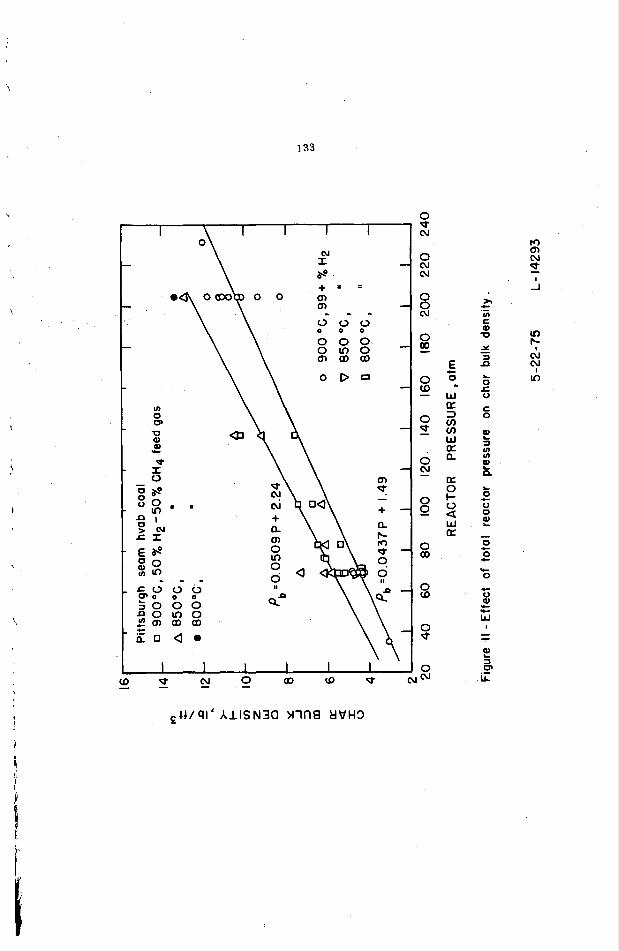
The t o t a l r eac to r pressure has a l a r g e inf luence on t h e terminal p a r t i c l e ve loc i ty because the pressure determines f o r the most p a r t t h e s i z e of t he char p a r t i c l e s produced and hence the bulk and p a r t i c l e dens i t i e s . This is i l l u s t r a t e d in Figure 11 where t h e char bulk dens i ty is p lo t t ed versus t o t a l r eac to r pressure. A s t he pressure increases , the bulk dens i ty increases. The bulk dens i ty is higher when the feed gas contains about 50 pc t methane ins tead of pure hydrogen. increasing the r eac to r pressure dampens the explosive en iss ion o f gases during the rap id devo la t i l i za t ion reac t ion . A high concentration of hydrogen i n t h e r eac to r causes more of the carbon t o be reacted out of t he p a r t i c l e s t r u c t u r e r e s u l t i n g in a lower bulk dens i ty char (and lower p a r t i c l e dens i ty) than is obtained when t h e reac tor feed gas contains about 50 pc t Eethane. Some char p a r t i c l e s i z e da t a is l i s t e d in Table 5 showing how increases i n r eac to r temperature and pressure cause decreases in t he mean char p a r t i c l e diameter.
Apparently,
TABLE 4.- Parameters used t o ca l cu la t e terminal ve loc i ty ~~ ~~
Temperature, Pressure, a t m - W, l b /h r f t 2 dp, i n . Pb, l b / f t 3 ps*, l b / f t 3
~~~ ~
C 725 205 165
0.0521 13.33 36.8
1.408 0.05745
3.3 1264 3.0 9.9
725 103 128
0.0667 8.0
22.1 0.7074
0.05745 4.1
1010 2.8
11.5
~~
900 205 145
12.29 33.9
1.199 0.06409
2.8 542 3.0 8.4
0.0345
900 69
207 0.0660
5.8 16.0
0.4035 0.06409
4.6 573 3.6
16.5
~~ ~ ~~
* Estimated by t h e ratio of bu lk d e n s i t i e s and p a r t i c l e dens i ty of 16.0 l b / f t 3
16 I 36.8. (26) f o r char produced a t 85O0-9OO0 C and 69 atm, e.g.,
**Ratio of te rmina l v e l o c i t y t o s ing le p a r t i c l e terminal ve loc i ty a t a spec i f i c mass feed r a t e per u n i t area (25).
TABLE 5.- Effec t of r eac to r temperature and pressure on average char particle s i z e
Averape Char P a r t i c l e Diameter*. in .
Press. , atm/Temp., C 750 - 800 850 - 900
69 - 0.0735 0.0628 0.0537 83 -- I- 0.0566 0.0501
103 0.0667 -- -- 0.0485 205 0.0521 0.0492 0.0529 0.0345
, Pi t t sburgh seam hvAb coa l , 50 x 100 mesh feed. P
1 1 1
I
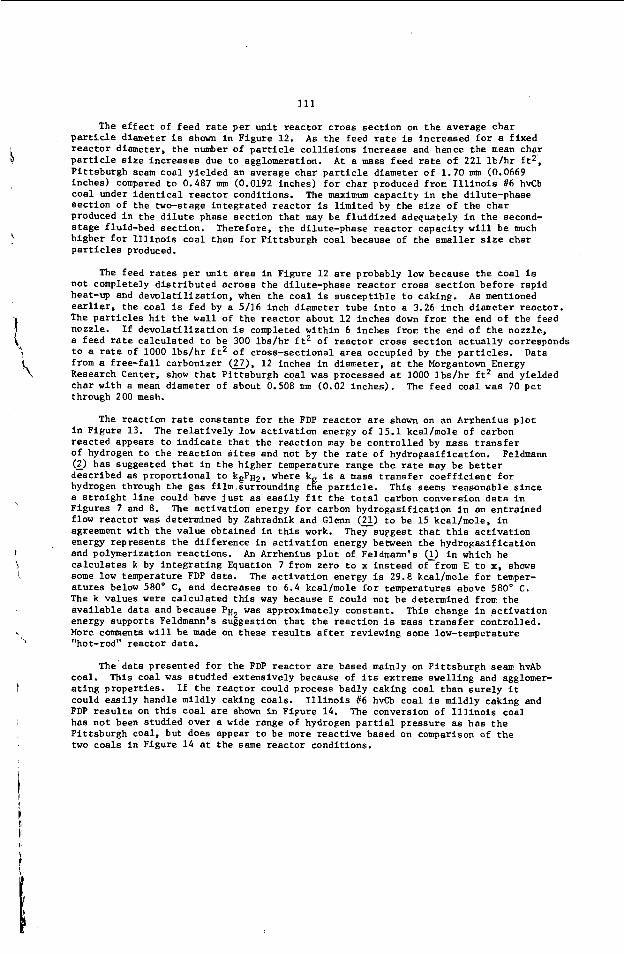
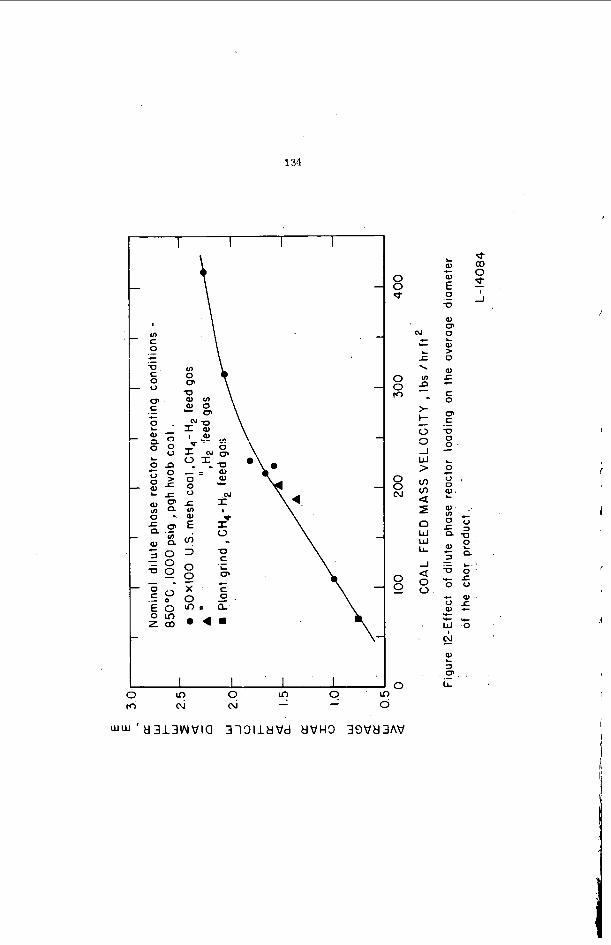
The e f f e c t of feed r a t e pe r u n i t reac tor c ros s sec t ion on t h e average char p a r t i c l e diameter i s s h a m i n F igure 12. r eac to r diameter, t he number of p a r t i c l e c o l l i s i o n s increase and hence the mean char p a r t i c l e s i z e inc reases due t o agglomeration. At a mass feed rate of 221 W h r f t2, Pi t t sburgh seam coal y ie lded an average char p a r t i c l e diameter o f 1.70 mm (0.0669 inches) compared t o 0.487 mm (0.0192 inches) f o r char produced fron: I l l i n o i s #6 hvCb coa l under i d e n t i c a l r eac to r conditions. s ec t ion of t he two-stage in tegra ted r eac to r i s l imi ted by the s i z e o f t he char produced i n t h e d i l u t e phase sec t ion tha t may be f lu id i zed adequately i n t h e second- s t age fluid-bed sec t ion . higher f o r I l l i n o i s coa l than f o r P i t t sburgh coa l because of the smaller s i z e char Particles produced.
A s t he feed r a t e is increased f o r a f ixed
The maximum capac i ty i n t h e dilute-phase
Therefore, the dilute-phase r eac to r capac i ty w i l l be much
The feed rates pe r u n i t a r ea i n Figure 1 2 a r e probably low because the coa l is
A s mentioned not completely d i s t r ibu ted across t h e dilute-phase r eac to r c ross s e c t i o n before rapid heat-up and devo la t i l i za t ion , when the coa l i s suscept ib le t o cakinp. e a r l i e r , t h e coa l is fed by a 5/16 inch diameter tube i n t o a 3.26 inch diameter reac tor . The p a r t i c l e s h i t t h e w a l l of t h e r eac to r about 12 inches down from the end of the feed nozzle. I f devo la t i l i za t ion i s completed wi th in 6 inches from t h e end o f t h e nozzle, a feed r a t e ca lcu la ted t o be 300 lb s /h r f t 2 of r eac to r CKOSS s ec t ion ac tua l ly corresponds t o a r a t e of 1000 lb s /h r f t 2 of cross-sectional a r ea occupied by the p a r t i c l e s . Data from a f r e e - f a l l carbonizer (c), 1 2 inches i n diameter, a t the Morgantown Energy Research Center, show t h a t P i t t sbu rgh coa l w a s processed a t 1000 l b s / h r f t 2 and yielded char wi th a mean diameter of about 0.508 m (0.02 inches) . through 200 mesh.
1
f The feed coa l w a s 70 pc t
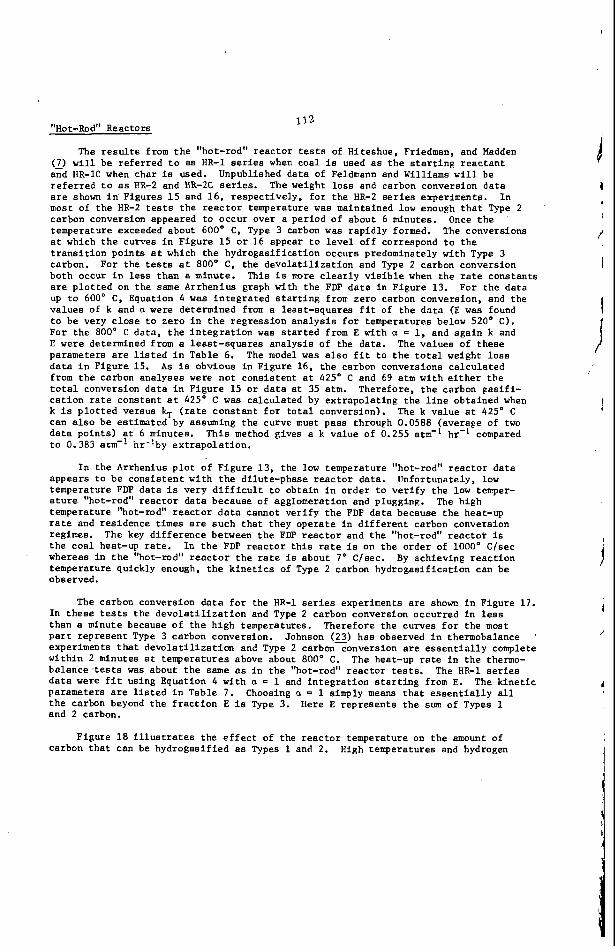
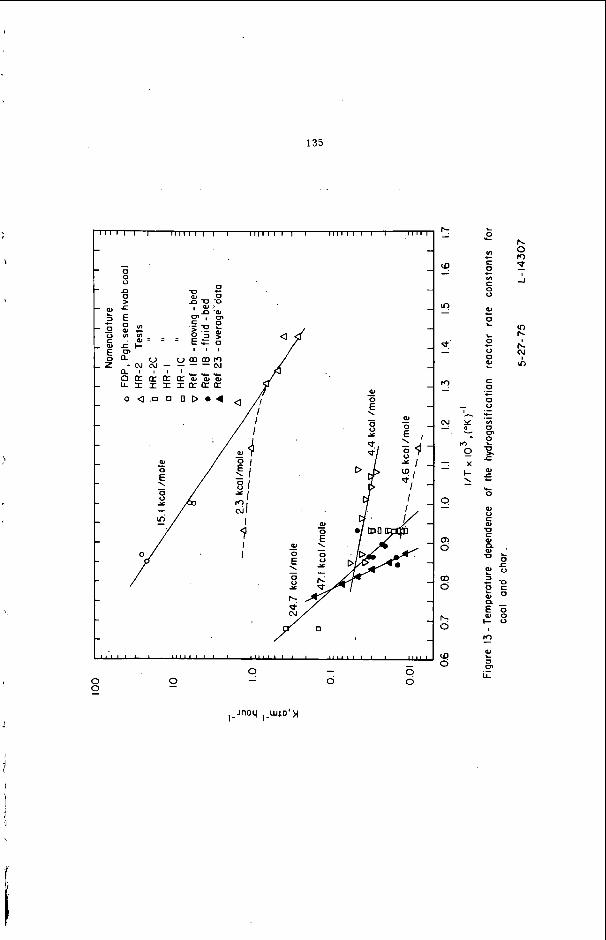
The reac t ion rate cons tan ts f o r the FDP reac to r are shown on a n Arrhenius p l o t i n Figure 13. reac ted appears t o i n d i c a t e t h a t the reac t ion may be cont ro l led by mass t r a n s f e r of hydrogen t o t h e reac t ion sites and not by the r a t e of hydrogas i f ica t ion . (2) has suggested t h a t i n t h e higher temperature range t h e r a t e may be b e t t e r described as propor t iona l t o kgPH2, where k hydrogen through the gas f i lm surrounding t8e p a r t i c l e . a s t r a i g h t l i n e could have j u s t as e a s i l y f i t t he t o t a l carbon conversion d a t a i n Figures 7 and 8. flow reac to r was determined by Zahradnik and Glenn (2) t o be 15 kcal/mole, i n agreement with t h e va lue obtained i n t h i s work. energy represents t he d i f fe rence i n ac t iva t ion energy between the hydrogas i f ica t ion and polymerization reac t ions . ca l cu la t e s k by in t eg ra t ing Equation 7 from zero t o x ins tead of from E t o x , shows some low temperature FDP data. The a c t i v a t i o n energy i s 29.8 kcal/mole f o r temper- a tu re s below 580' C , and decreases t o 6.4 kcal/mole f o r temperatures above 580' C . The k values were ca lcu la ted t h i s way because E could not be determined f rog the ava i l ab le data and because P H ~ w a s approximately constant. energy supports Feldmann's suggestion tha t t he reac t ion is mass t r a n s f e r controlled. More comments w i l l be made on these r e s u l t s a f t e r reviewing some low-temperature "hot-rod" reac tor data.
The r e l a t i v e l y low ac t iva t ion energy of 15.1 kcal/mole of carbon
Feldmann
i s a mass t r a n s f e r c o e f f i c i e n t f o r This seems reasonable s ince
The ac t iva t ion energy f o r carbon hydrogas i f ica t ion i n an en t ra ined
They suggest t h a t t h i s ac t iva t ion
An Arrhenius p l o t of Feldmann's (L) i n which he
This change i n ac t iva t ion
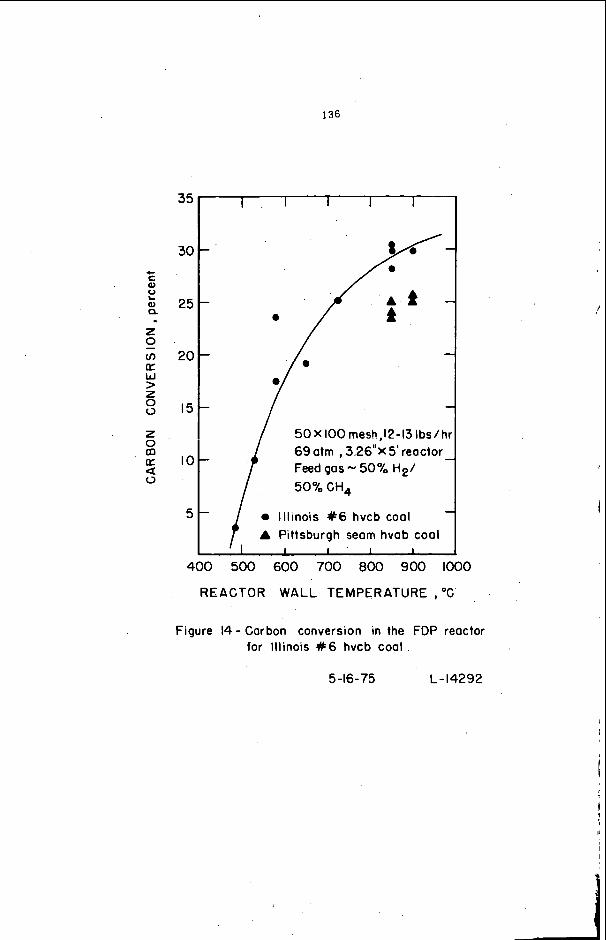
The.data presented f o r t he FDP reac to r a r e based mainly on Pi t t sbu rgh seam hvAb coal. a t i n g proper t ies . could eas i ly handle mildly caking coals. FDP r e s u l t s on t h i s c o a l are shown i n Figure 14. has no t been s tudied over a wide range of hydrogen p a r t i a l p ressure as has t h e P i t t sburgh coal, but does appear t o be more r eac t ive based on comparison of t h e two coals i n Figure 14 a t the same reac tor conditions.
This coa l was s tudied ex tens ive ly because of i ts extreme swel l ing and agglomer- If the r eac to r could process badly caking coal than su re ly i t
I l l i n o i s 16 hvCb coa l is mi ld ly caking and The conversion of I l l i n o i s coa l
i
112 "Ho t-Rod" Reactors
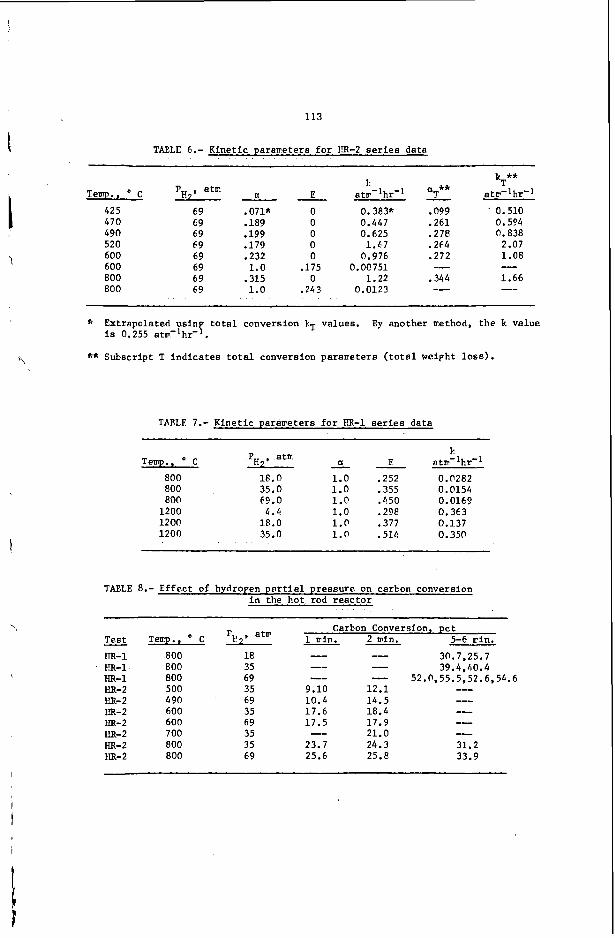
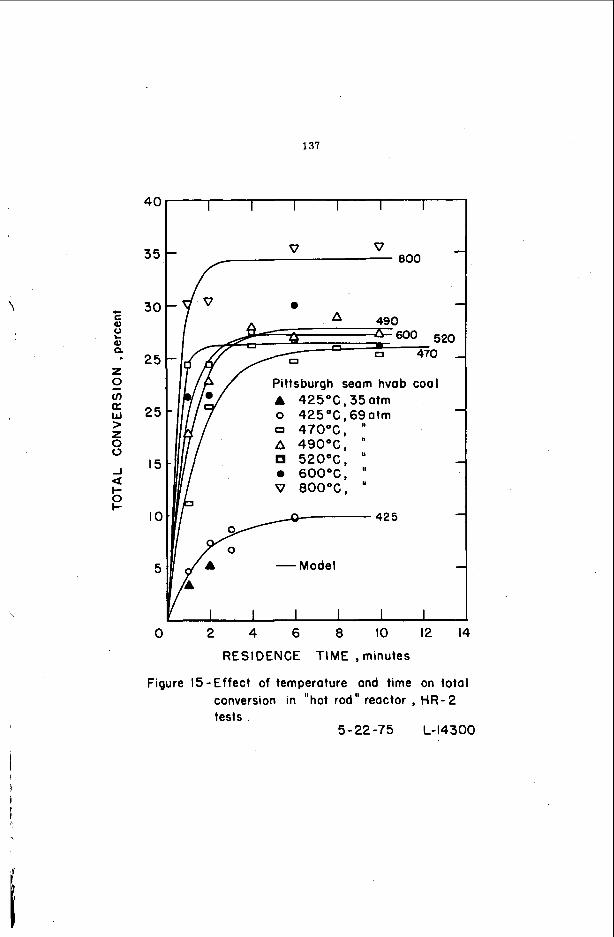
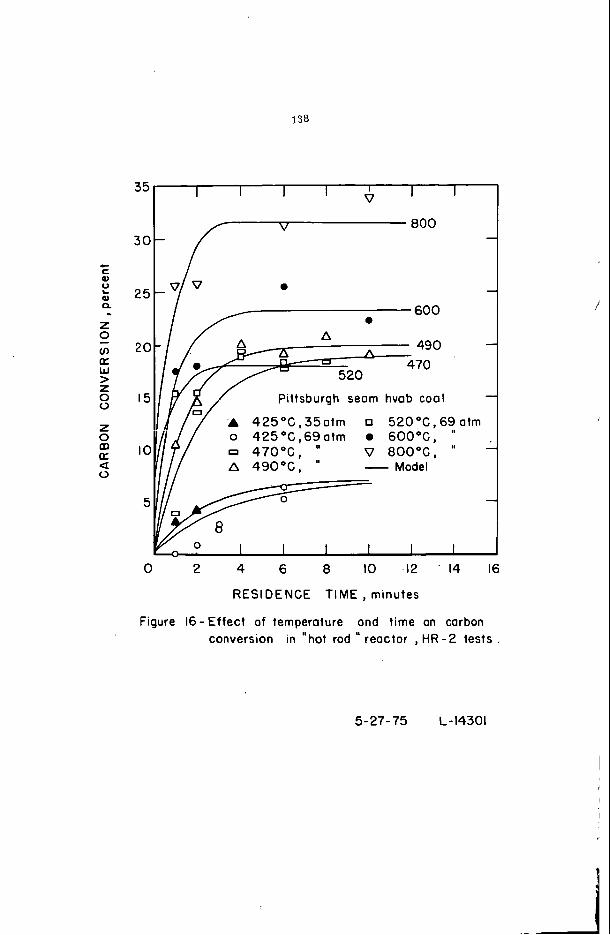
The results from t h e "hot-rod" reac tor tests of Hiteshue, Friedman, and Madden (L) w i l l be re fer red t o a s HR-1 series when coa l is used a s t h e s t a r t i n g r eac t an t and HR-1C when char is used. r e fe r r ed t o as HR-2 and HR-2C series. The weight l o s s and carbon conversion data a r e shown i n Figures 1 5 and 16, respectively. f o r the HR-2 series exper i ren ts . I n most of t he HR-2 tests t h e r e a c t o r temperature was maintained low enough t h a t Type 2 carbon conversion appeared t o occur over a period of about 6 minutes. Once t h e temperature exceeded about 600" C, Type 3 carbon w a s rap id ly formed. a t which t h e curves i n Figure 1 5 o r 16 appear t o l e v e l off correspond t o the t r a n s i t i o n poin ts a t which t h e hydrogasification occurs predominately with Type 3 carbon. For the tests a t 800° C, the devo la t i l i za t ion and Type 2 carbon conversion both occur i n less than a minute. a r e p l o t t e d on the same Arrhenius graph with the FDP d a t a i n Figure 13. For the da ta up t o 600" C , Equation 4 w a s i n t eg ra t ed s t a r t i n g from zero carbon conversion, and the va lues of k and a were determined from a least-squares f i t of t he da ta (E w a s found t o be very c lose t o zero i n t h e regress ion ana lys i s f o r temperatures below 520' C). For the 800" C da ta , t h e i n t e g r a t i o n was s t a r t e d from E with a = 1, and aga in k and E were determined from a least-squares ana lys i s of the data. The va lues of these parameters are l i s t e d i n Table 6. d a t a in Figure 15. As i s obvious in Figure 16, t h e carbon conversions ca lcu la ted from t h e carbon analyses were no t cons is ten t a t 425" C and 69 atm wi th e i t h e r t he t o t a l conversion data i n F igure 15 o r d a t a at 35 a t m . Therefore, t h e carbon gas i f i - ca t ion r a t e constant a t 425' C w a s ca lcu la ted by ex t rapola t ing the l i n e obtained when k i s p lo t t ed versus $ ( r a t e cons tan t f o r t o t a l conversion). can a l s o be estimated by assuming the curve must pass through 0.0588 (average of two da ta poin ts ) a t 6 minutes. This method gives a k value of 0.255 atm-l hr-' compared to 0.365 arm-? 'nr-lby ex t r apo la t ion ,
Unpublished da ta of Feldmann and Williams w i l l be
The conversions
This is mre c l e a r l y v i s i b l e when t h e r a t e constants
The model was a l s o f i t t o t h e t o t a l weight l o s s
The k va lue a t 425' C
In the Arrhenius p l o t of F igure 13, the low temperature "hot-rod" r eac to r da ta appears t o be cons is ten t with t h e dilute-phase r eac to r data. Unfortunately, low temperature FDP da ta is very d i f f i c u l t t o obtain i n order t o ve r i fy the low temper- a t u r e "hot-rod'' r eac to r da ta because of agglomeration and plugging. temperature "hot-rod" r eac to r d a t a cannot ve r i fy t h e FDP da ta because t h e heat-up r a t e and residence t i m e s a r e such t h a t they opera te in d i f f e r e n t carbon conversion regimes. The key d i f f e rence between t h e FDP r e a c t o r and the "hot-rod" r eac to r is t he coa l heat-up r a t e . whereas i n t h e "hot-rod" r e a c t o r t h e rate is about 7' C/sec. temperature quickly enough, t h e k i n e t i c s of Type 2 carbon hydrogas i f ica t ion can be observed .
The high
In t h e FDP reac to r t h i s rate is on the order of 1000° C/sec By achieving reac t ion
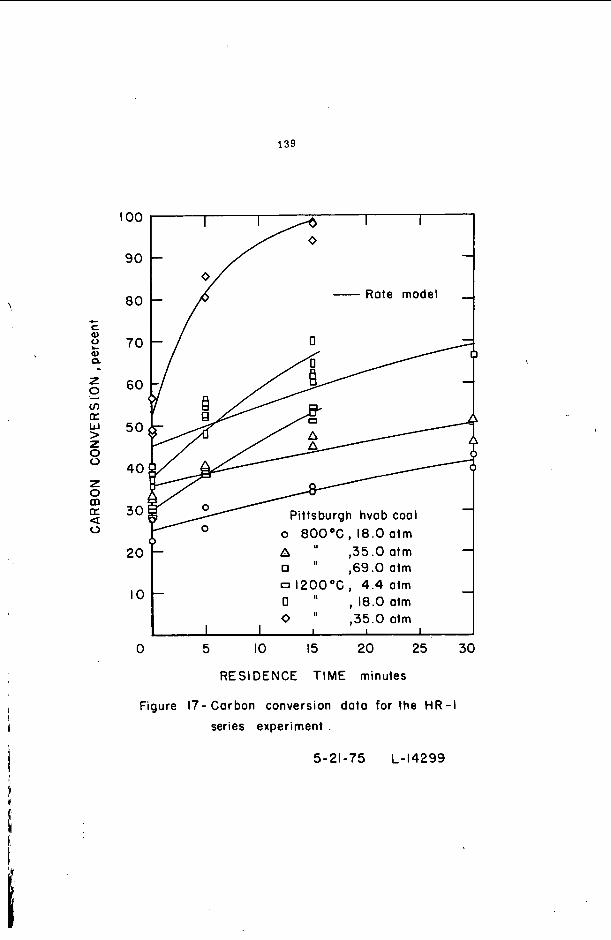
The carbon conversion da ta f o r the HR-1 series e x p e r b e n t s a r e shown i n Figure 17 . In these tests the d e v o l a t i l i z a t i o n and Type 2 carbon conversion occurred i n less than a minute because of t h e high temperatures. p a r t represent Type 3 carbon conversion. Johnson (23) has observed i n thermobalance experiments t h a t devo la t i l i za t ion and Type 2 carbon conversion a r e e s s e n t i a l l y complete wi th in 2 minutes a t temperatures above about 800" C. balance t e s t s was about t h e same as in t h e "hot-rod" r eac to r tests. The HR-1 s e r i e s d a t a were f i t using Equation 4 with a = 1 and in t eg ra t ion s t a r t i n g from E. parameters a r e l i s t e d i n Table 7. t h e carbon beyond the f r a c t i o n E is Type 3. and 2 carbon.
Therefore the curves f o r t he most
The heat-up r a t e i n t h e thermo-
The k ine t i c Choosing a = 1 simply means t h a t e s s e n t i a l l y a l l
Here E represents t he sum of Types 1
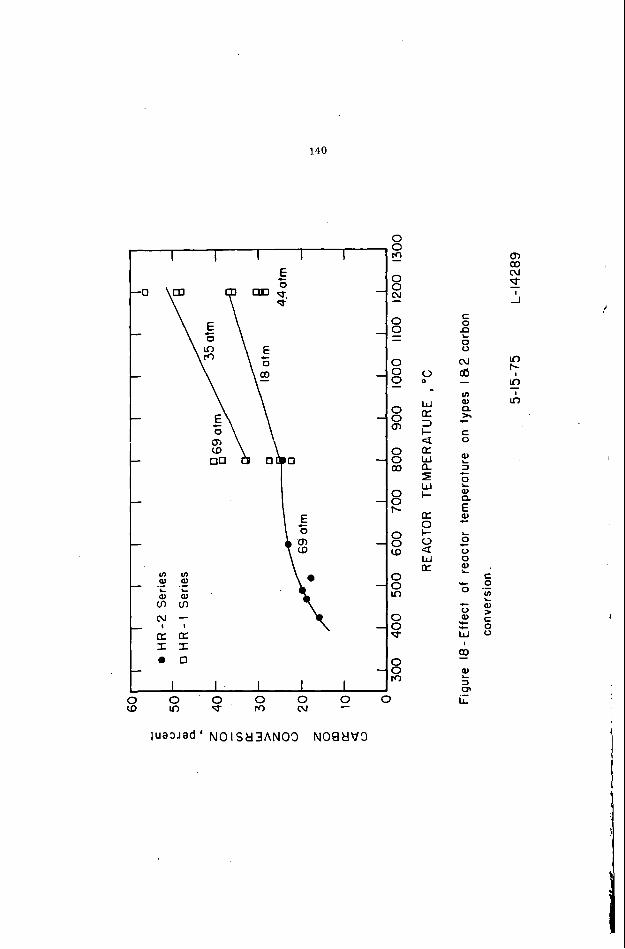
Figure 18 i l l u s t r a t e s the e f f e c t of the r eac to r temperature on the amount of carbon t h a t can be hydrogasified as Types 1 and 2. High temperatures and hydrogen
I
1
I
I
t
113
TAELC 6.- Kinet ic paraae ters f o r UR-2 series data
Temp., * C
425 470 490 520 600 600 800 800
PI! , a t n
69 69 69 69 69 69 69 69
a
.071*
.189
.199
.179
.232 1.0
.315 1.0
E
0 0 0 0 0
.175 0
.243
- 1;
atv-lhr-l
0.383* 0.447 0.625
1.47 0.976
0.00751 1.22
0.0123
UT**
.099
.261
.278
.264
.272
.344
-
--- ---
%** a t r - l hr-‘
’ 0.510 0.504 0.838
2.07 1.08
1.66 -- --
* Extrapolated usinp t o t a l conversion kT values. is 0.255 atn-lhr- . Ey another method, t h e k value
** Subscript T i nd ica t e s t o t a l conversion parape ters ( t o t a l weipht loss).
TABLE 7.- Kinet ic paraue ters f o r ER-1 s e r i e s da ta
1. a E atv-lhr-l PH , a t r - Tenp., a C
800 18.0 1.0 .252 0.0282 800 35.0 1.0 .355 0.0154 800 69.0 1.0 .A50 0.0160
1200 4.1 1.0 .298 0.363 1200 18.0 l.@ .377 0.137 1200 35.0 1.0 .514 0.350
TABLE 8.- Ef fec t of hydropen p a r t i a l p ressure on car ton conversion in the hot rod r eac to r
Test
BR-1 HR-1 HR-1 m-2 m-2 ER-2 IIR-2 HR-2 HR-2 HR-2
- Tenp.. C
800 800 800 500 490 600 600 700 800 800
Fp,, ata
18 35 69 35 69 35 69 35 35 69
Carbon Conversion, pe t 1 p i n . 2 pin. 5-6 c in . --- --- 30.7.25.7 --- --- 39.4,40.4 --- --- 52.0,55.5,52.6,54.6 9.10 12.1 --- 10.4 14.5 --- 17.6 18.4 --- 17.5 17.9 --- --- 21.0 --- 23.7 24.3 31.2 25.6 25.8 33.9
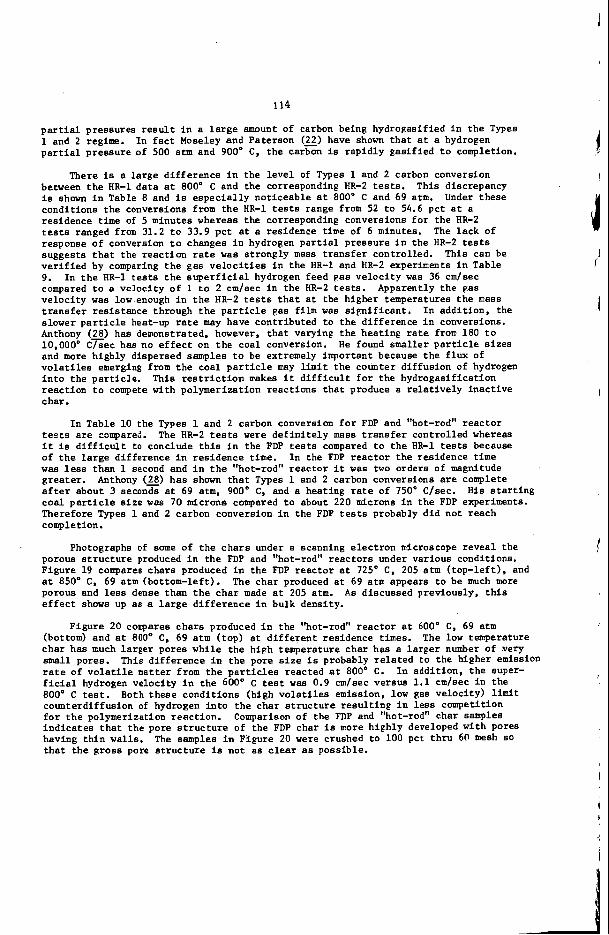
p a r t i a l pressures result i n a l a r g e amount of carbon being hydrogasified i n t h e Types 1 and 2 regime.. p a r t i a l p ressure of 500 a m and 900' C, t he carbon is r ap id ly gas i f i ed t o completion.
There is a l a rge d i f f e rence i n the l e v e l of Types 1 and 2 carbon conversion
In f a c t Moseley and Paterson (22) have shown t h a t a t a hydrogen
between t h e HR-1 da t a a t 800' C and t h e corresponding HR-2 tests. is s h a m i n Table 8 and is espec ia l ly not iceable at 800" C and 69 atm. condi t ions the conversions from t h e HR-1 t e s t s range from 52 t o 54.6 p c t a t a residence t i m e of 5 minutes whereas the corresponding conversions f o r the HR-2 tests ranged from 31.2 t o 33.9 p c t at a residence time of 6 minutes. response o f conversion t o changes i n hydrogen p a r t i a l p ressure i n t h e HR-2 tests suggests t h a t the r eac t ion r a t e was s t rongly mass t r a n s f e r cont ro l led . v e r i f i e d by comparing t h e gas v e l o c i t i e s i n the HR-1 and HR-2 experiments i n Table 9. I n t h e HR-1 t e s t s t h e s u p e r f i c i a l hydrogen feed gas ve loc i ty was 36 cm/sec compared t o a ve loc i ty o f 1 t o 2 cm/sec i n t h e HR-2 tests. Apparently the pas ve loc i ty w a s low enough i n t h e HR-2 tests t h a t a t the higher temperatures t h e mass t r a n s f e r r e s i s t ance through t h e p a r t i c l e gas f i lm was s i g n i f i c a n t . slower p a r t i c l e heat-up r a t e may have cont r ibu ted t o t h e d i f fe rence i n conversions. Anthony (2) has demonstrated, however, t h a t varying the hea t ing r a t e from 180 t o 10,000" C/sec has no e f f e c t on t h e coa l conversion. and more highly dispersed samples t o be extremely important because t h e f l u x of v o l a t i l e s emerging from t h e coa l particle may l i m i t t h e counter d i f fus ion of hydrogen i n t o the p a r t i c l e . r eac t ion t o compete with polymerization reac t ions t h a t produce a r e l a t i v e l y inac t ive char.
This discrepancy Under these
The l ack of
This can be
In addi t ion , the
H e found smaller p a r t i c l e sizes
This r e s t r i c t i o n makes i t d i f f i c u l t f o r t he hydrogas i f ica t ion
I n Table 10 the Types 1 and 2 carbon conversion f o r FDP and "hot-rod" r eac to r t e e t e ere coxqare:. The HR-2 tests were d e f i n i t e l y mass t r a n s f e r cont ro l led whereas i t is d i f f i c u l t t o conclude t h i s i n the FDP tests compared t o t h e HR-1 tests because of t h e l a r g e d i f fe rence i n res idence t i m e . w a s less than 1 second and i n t h e "hot-rod" r eac to r i t was two orders of magnitude g rea t e r . a f t e r about 3 seconds at 69 arm, 900' C, and a heating r a t e of 750' C/sec. coa l p a r t i c l e s i z e was 70 microns compared t o about 220 microns i n t h e FDP experiments. Therefore Types l a n d 2 carbon conversion i n the FDP tests probably d i d not reach completion.
I n the FDP reac to r t he residence t i m e
Anthony (2) has s h a m t h a t Types 1 and 2 carbon conversions are complete His s t a r t i n g
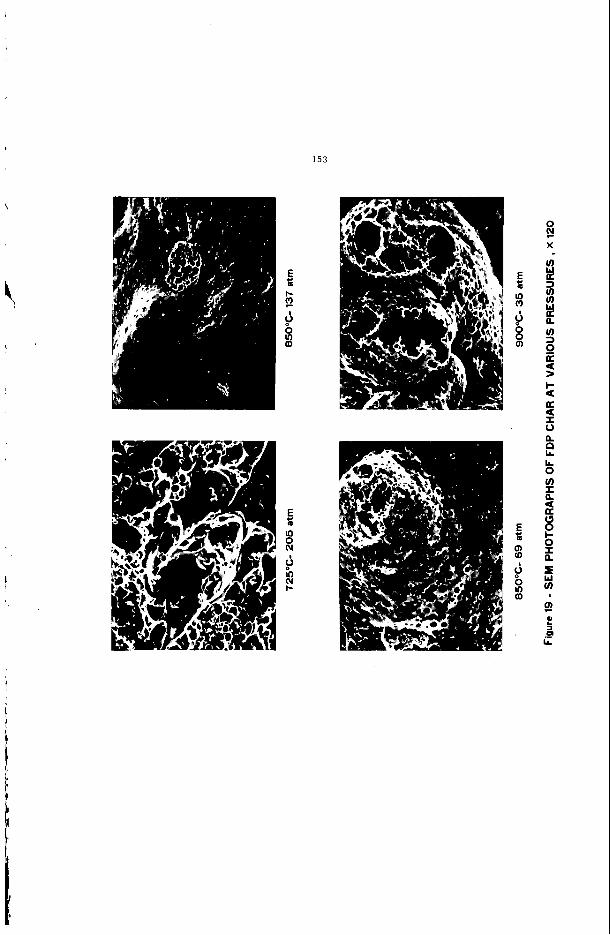
Photographs of some of t h e c h a r s under a scanning e l e c t r o n microscope revea l the porous s t r u c t u r e produced i n the FDP and "hot-rod" r eac to r s under various conditions. F igure 19 compares chars produced i n the FDP reac to r a t 725' C , 205 a t m ( top - l e f t ) , and a t 850° C, 69 a t m (bottom-left). The char produced a t 69 a t m appears t o be much more porous and less dense than t h e char made a t 205 atm. As discussed previously, this e f f e c t shows up as a l a r g e d i f f e r e n c e i n bulk density.
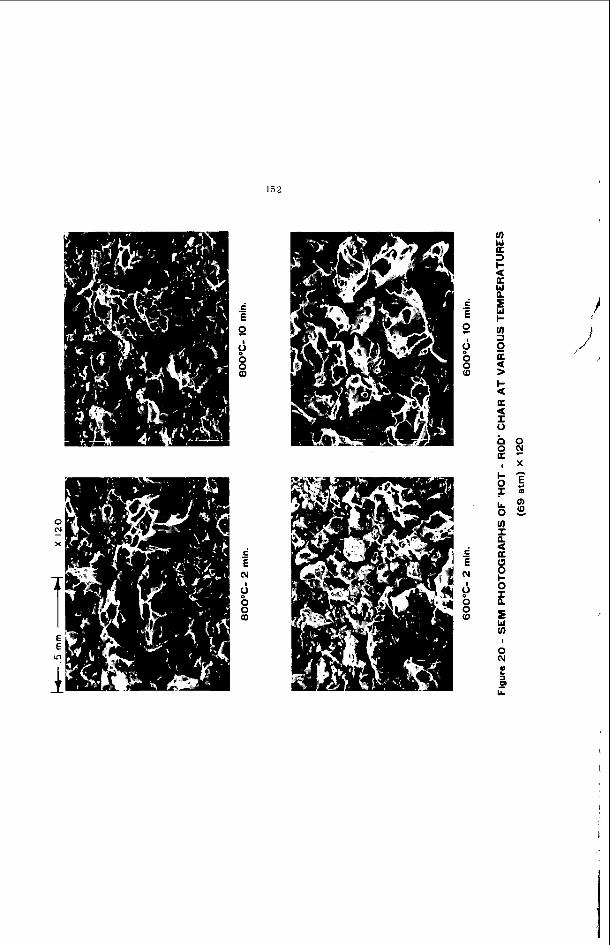
F igure 20 compares chars produced i n the "hot-rod" r eac to r a t 600' C, 69 a t m (bottom) and a t 800° C, 69 a t m ( top) a t d i f f e r e n t residence times. The low temperature char has nuch l a rge r pores whi le t h e high temperature char has a l a r g e r number of very small pores. rate o f v o l a t i l e matter from t h e p a r t i c l e s reac ted a t 800' C. I n addi t ion , t h e super- f i c i a l hydrogen ve loc i ty i n t h e 600° C test was 0.9 cm/sec versus 1.1 cm/sec i n the 800' C t e s t . counterd i f fus ion of hydrogen i n t o t h e char s t r u c t u r e r e s u l t i n g i n l e s s Competition f o r t h e polymerization reac t ion . Comparison o f t he FDP and "hot-rod" char Samples ind ica t e s t h a t the pore s t r u c t u r e of the FDP char is more h ighly developed with pores having t h i n walls. t h a t t h e g ross pore s t r u c t u r e is n o t a s clear as poss ib le .
This d i f f e rence i n t h e pore size is probably r e l a t e d t o the higher emission
Both these condi t ions (high v o l a t i l e s emission, low gas ve loc i ty ) l i m i t
The samples i n Figure 20 were crushed t o 100 pct t h ru 60 mesh 80
,
115
I
,
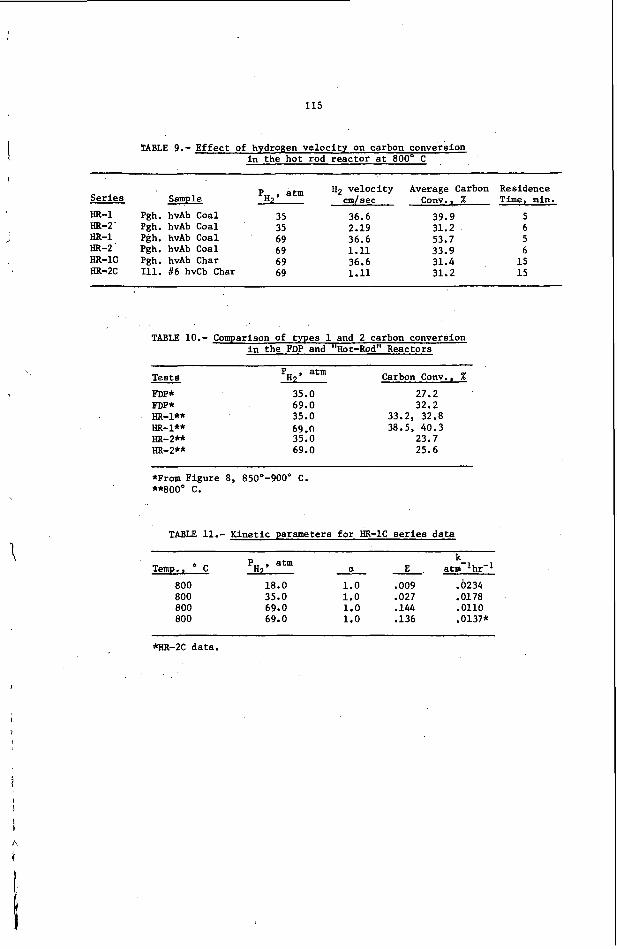
TABLE 9.- Effect of hydrogen velocity on carbon conversion in the hot rod reactor at 800' C
pH , atm 132 velocity Average Carbon Series Sample 2 cmf sec Conv.. %
HR-1 Pgh. hvAb Coal 35 36.6 39.9
HR-1 Pgh. hvAb Coal 69 36.6 53.7 HR-2 Pgh. hvAb Coal 69 1.11 33.9
HR-2- Pgh. hvAb Coal 35 2.19 31.2
HR-lC Pgh. hvAb Char 69 36.6 31.4 HR-2C Ill. 16 hvCb Char 69 1.11 31.2
Residence Time, min.
5 6 5 6 15 15
TABLE 10.- Comparison of types 1 and 2 carbon conversion in the FDP and "Hot-Rod" Reactors
Carbon Conv., % PH , atm Tests FDP* 35.0 27.2 pDP* 69.0 32.2 HR-1** 35.0 33.2, 32.8 HR-1** 69 .n 38.5, 40.3 HR-2** 35.0 23.7 HR-2** 69.0 25.6
-
*From Figure 8, 850'-900" C. **800° C.
TABU 11.- Kinetic parameters for HR-1C series data
k 7 a E atm-lhr''
PH , atm - Temp,, C 800 18.0 1.0 .009 .0234 800 35.0 1.0 .027 .0178 800 69.0 1.0 .144 .0110 800 69.0 1.0 .136 .0137*
*HR-SC data.
116
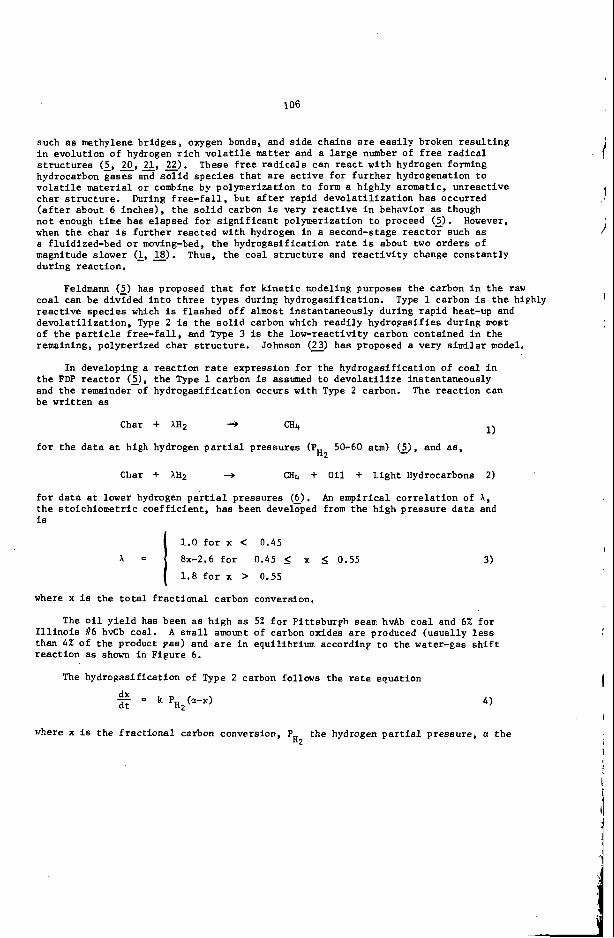
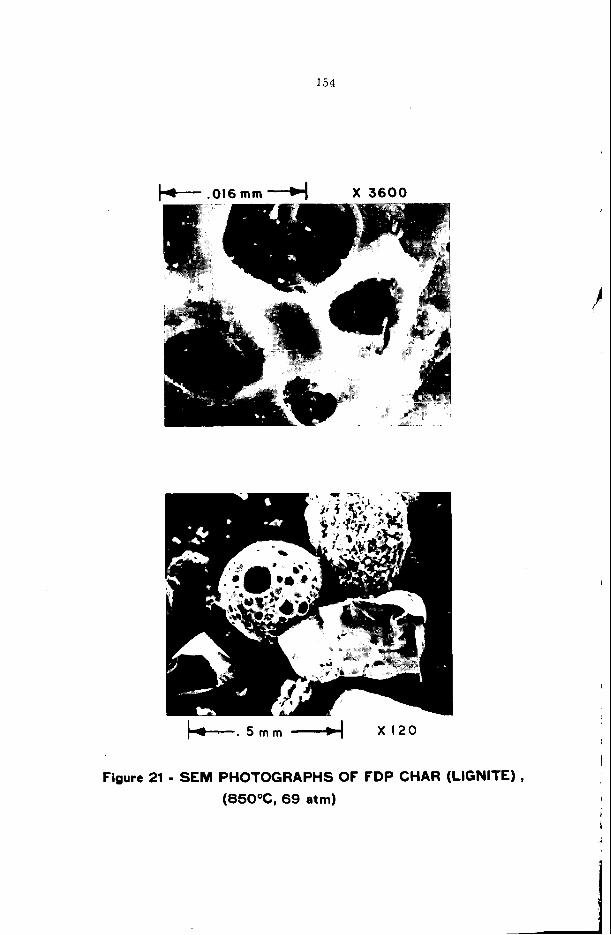
Figure 2 1 shows t h e char samples from FDP tests a t 850° C and 69 a t m using a l ignite coa l f e e d , s t r u c t u r e obtained w i t h bituminous coal. with l i g n i t e (coal p a r t i c l e a l s o i n Figure 21), the pene t ra t ion of hydrogen i n t o the p a r t i c l e is poorer compared t o bituminous coal. have an even s t ronger inf luence on t h e hydrogasif icat ion of lignite than with bituminous coals .
The pore s t r u c t u r e appears very undeveloped compared t o t h e Because of the l a c k of p a r t i c l e swel l ing
Consequently, p a r t i c l e s i z e should
The char data i n Table 9 are very i n t e r e s t i n g because the s u p e r f i c i a l hydrogen v e l o c i t y had no e f f e c t on t h e carbon conversion. char p a r t i c l e s must b e l a r g e compared t o t h e char-hydrogen r e a c t i o n rate. This i s not s u r p r i s i n g since t h e r e a c t i o n r a t e of Type 3 carbon is very slow, probably much slower than t h e d i f fus ion rates of hydrogen and gaseous reac t ion products.
The mass t r a n s f e r rate i n t o t h e
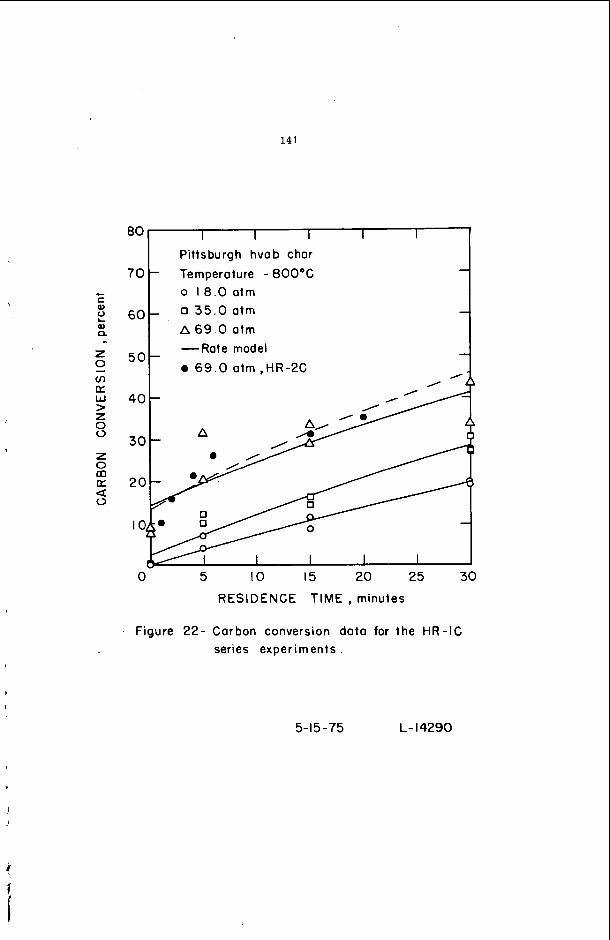
The results o f HR-1C series experiments with char produced from Pi t t sburgh seam hvAb coa l are shavn i n F igure 22. except f o r a small amount of rap id i n i t i a l conversion. The k i n e t i c parareters f o r these da ta are l i s t e d i n Table 11. a l s o shown i n Table 11 and Figure 22, and agree w e l l wi th t h e HR-1C data. The two chars are d i f f e r e n t i n that t h e HR-2C char was produced from I l l i n o i s #6 hvCb coa l i n t h e d i l u t e phase r e a c t o r at 585' C whereas t h e HR-1C char was produced from Pi t tsburgh seam hvAb coal by batch carbonizat ion f o r 2 hours i n helium a t 600° C. The HR-2C char contained about 26 p c t v o l a t i l e matter compared t o the o r i g i n a l 36.5 pc t volatile matter i n the s t a r t i n g coal. near ly equal d e v o l a t i l i z a t i o n temperatures, the r e a c t i v i t i e s of t h e two chars are e s s e n t i a l l y t h e same. could have resu l ted i n t h e chars having d i f f e r i n g r e a c t i v i t i e s (23, 2).
The carbon conversion is of t h e Type 3 spec ies
The results o f the HR-2C series experiments are
Despite these d i f fe rences , except f o r the
A s i g n i f i c a n t d i f fe rence i n t h e d e v o l a t i l i z a t i o n temperatures
The Arrhenius graph i n F igure 13 summarizes the r e s u l t s f o r a l l the coa ls and chars tes ted and Includes some of Johnson's data (23) which was adjusted t o c a l c u l a t e k values according to Equation 4. Assuming tha t i t i s v a l i d t o represent the low temperature "hot-rod" r e a c t o r d a t a by t h e same Arrhenius l ine as the FDP da ta , t h e a c t i v a t i o n energy f o r hydrogas i f ica t ion of Type 2 carbon is 15.1 kcal/mole of carbon gas i f ied . magnitude lower than t h e rate o f hydrogasif icat ion of Type 2 carbon. The a c t i v a t i o n energy f o r t h e HR-1, HR-lC, and HR-2C d a t a is 24.7 kcal/mole of carbon g a s i f i e d (Type 3 carbon) compared to a value of 47.1 kcal/mole obtained by Johnson (23) using a thermo- balance. A t 600Oand 800' C , t h e HR-2 d a t a was complicated by t h e t r a n s i t i o n t o Type 3 carbon conversion and a s i g n i f i c a n t amount of mass t r a n s f e r res i s tance . temperatures t h e apparent a c t i v a t i o n energy f a l l s o f f considerably as shown i n Figure 13.
Two-Stage Integrated Reactor
The hydrogasif icat ion rate of Type 3 carbon is about t h r e e orders of
A t these higher
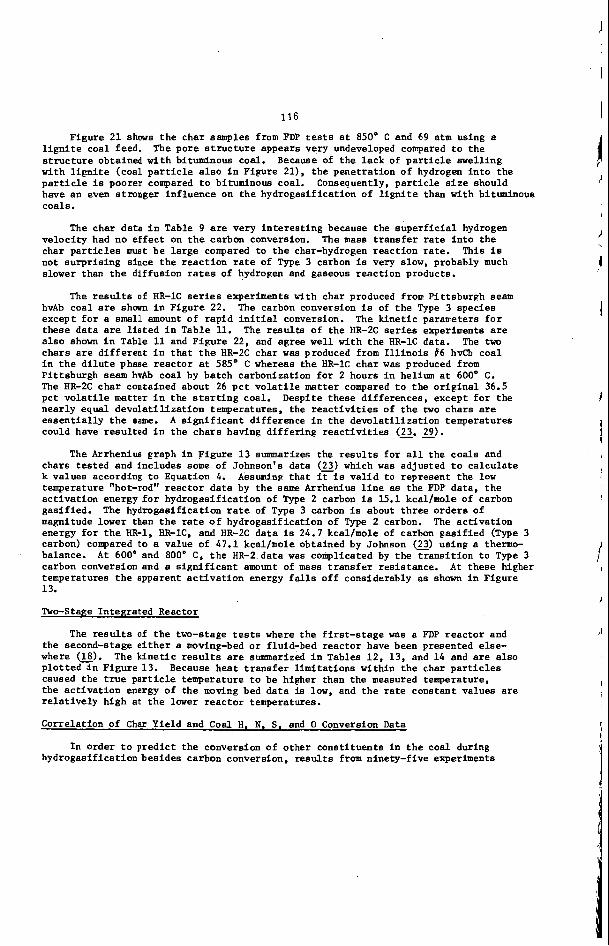
The results of t h e two-stage tests where t h e f i r s t - s t a g e was a FDP r e a c t o r and the second-stage e i t h e r a moving-bed o r fluid-bed reac tor have been presented else- where @). p l o t t e d .in F igure13 . caused the t r u e p a r t i c l e temperature t o be higher than the measured temperature, the a c t i v a t i o n energy of the moving bed d a t a is low, and t h e r a t e constant values are r e l a t i v e l y high at t h e lower r e a c t o r temperatures.
Correlat ion of Char Yield and Coal H. N, S. and 0 Conversion Data
The k i n e t i c r e s u l t s a r e summarized i n Tables 12, 13, and 14 and are a l s o Because h e a t t r a n s f e r l i m i t a t i o n s within t h e char p a r t i c l e s
I n order t o p r e d i c t the conversion of o ther cons t i tuents i n t h e coal during hydrogas i f ica t ion bes ides carbon conversion, results from ninety-f ive experiments
1 I
I
1
1
117
b.
/
TABLE 12.- Kinetic results from two-stage integrated reactor experiments (18) at 69 atm
k Moving Fluid Total C Bed C Bed C Bed
- Run Conv., X Conv., Z* Conv., Z* Temp., O K atm-lhr-l 2 0.552 --- 0.378 1158 0.0145 3 0.536 --- 0.356 1158 0.0284 5 0.558 --- 0.345 1158 0.0316 11 0.608 --- 0.419 1073 0.0450 12 0.551 --- 0.335 1118 0.0202 13 0.556 --- 0.383 1113 0.0218 14 0.537 --- 0.357 1183 0.0139 33 0.620 0.457 --- 1178 0.0573 37 0.392 0.131 --- 1173 0.0360 38 0.485 0.264 --- 1148 0.0396 39 0.417 0.167 --- 918 0.0449 43b 0.430 0.186 --- 1038 0.0395 44b 0.391 0.130 --- 923 0.0260 4 5b 0.406 0.151 --- 933 0.0307 46a 0.399 0.151 --- 957 0.0305 48 0.511 0.301 --- 1073 0.0299 49 0.536 , 0.337 --- 988 0.0358
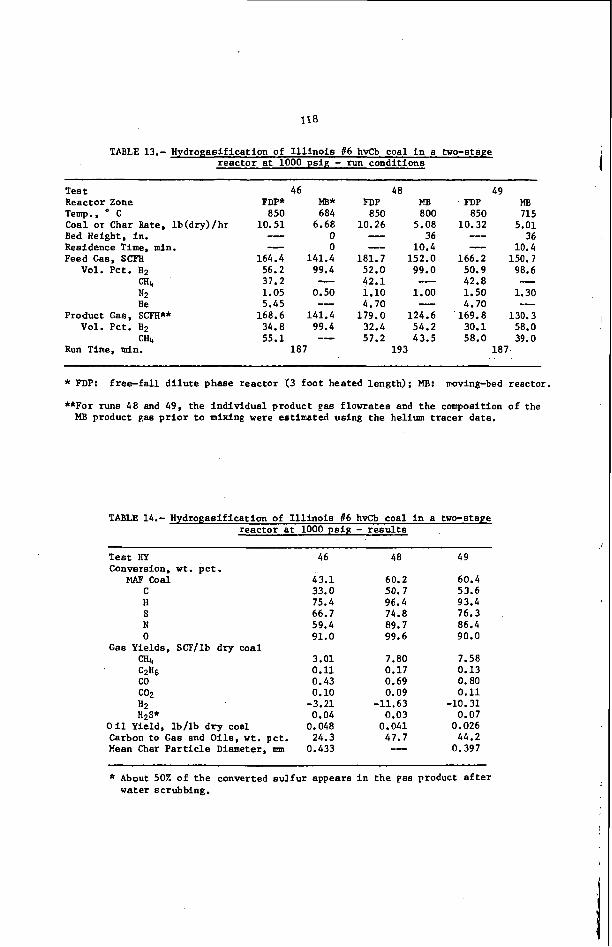
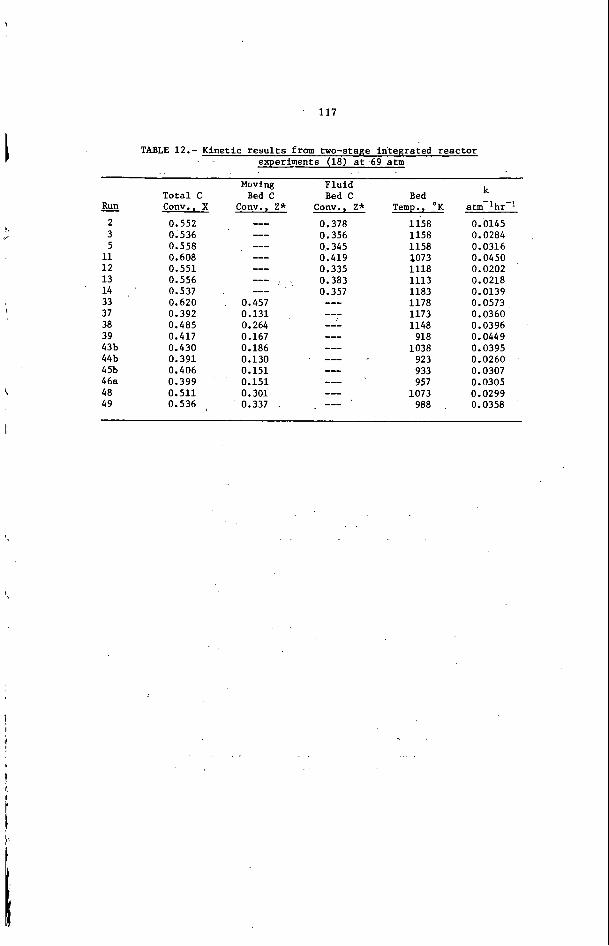
TABLE 13.- Hydrogasification of I l l i n o i s 16 hvCb coal i n a two-stage r eac to r a t 1000 p s i g - run condi t ions
Test 46 48 49 Reactor Zone FDP* MB* FDP MB FDP MB Temp., C 850 684 850 800 850 715 Coal o r Char Rate, l b (d ry ) /h r 10.51 6.68 10.26 5.08 10.32 5.01
36 Bed Height, i n . --- 0 - 36 - Residence Time, min. -- 0 -- 10.4 -- 10.4 Feed Gas, SCFH 164.4 141.4 181.7 152.0 166.2 150.7
Vol. Pct . H2 56.2 99.4 52.0 99.0 50.9 98.6 37.2 -- 42.1 --- 42.8 - m4 1.05 0.50 1.10 1.00 1.50 1.30
He 5.45 -- 4.70 -- 4.70 -- N2
Product Gas, SCFH** 168.6 141.4 179.0 124.6 169.8 130.3 Vol. Pct. H2 34.8 99.4 32.4 54.2 30.1 58.0
CH4 55.1 -- 57.2 43.5 58.0 39.0 Run Time, min. 187 193 187
* FDP:
**For runs 48 and 49, t he ind iv idua l product pas f lowrates and t h e composition of the
free-fal l d i l u t e phase r eac to r (3 foo t heated l eng th ) ; MB: moving-bed reactor.
MB product gas p r i o r t o mixing were estimated using t h e helium t r a c e r data ,
TABLE 14.- Hydrogasification of I l l i n o i s 16 hvCb coal i n a two-stape r eac to r a t 1000 p i p . - r e s u l t s
T e s t HY 46 48 49 Conversion, w t . p c t .
MAF coal 43.1 60.2 60.4 C 33.0 50.7 53.6 H 75.4 96.4 93.4 S 66.7 74.8 76.3 N 59.4 89.7 86.4 0 91.0 99.6 90.0
CH4 3.01 7.80 7.58 C2H6 0.11 0.17 0.13 co 0.43 0.69 0.80
H2 -3.21 -11.63 -10.31 H2S* 0.04 0.03 0.07
Oil Yield, l b / l b d r y coal 0.048 0.041 0.026 Carbon t o Gas and O i l s , w t . pct . 24.3 47.7 44.2
Gas Yields, SCF/lb dry coa l
co2 0.10 0.09 0.11
Mean Char P a r t i c l e Diameter, m 0.433 -- 0.397
* About SOX of t h e converted s u l f u r appears i n t h e gas product a f t e r water scrubbing.
I19
\
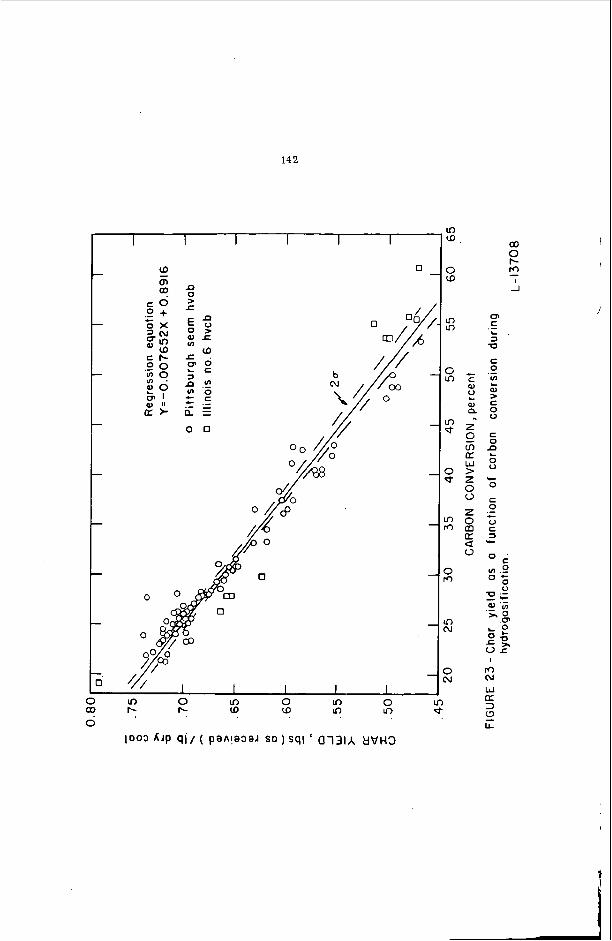
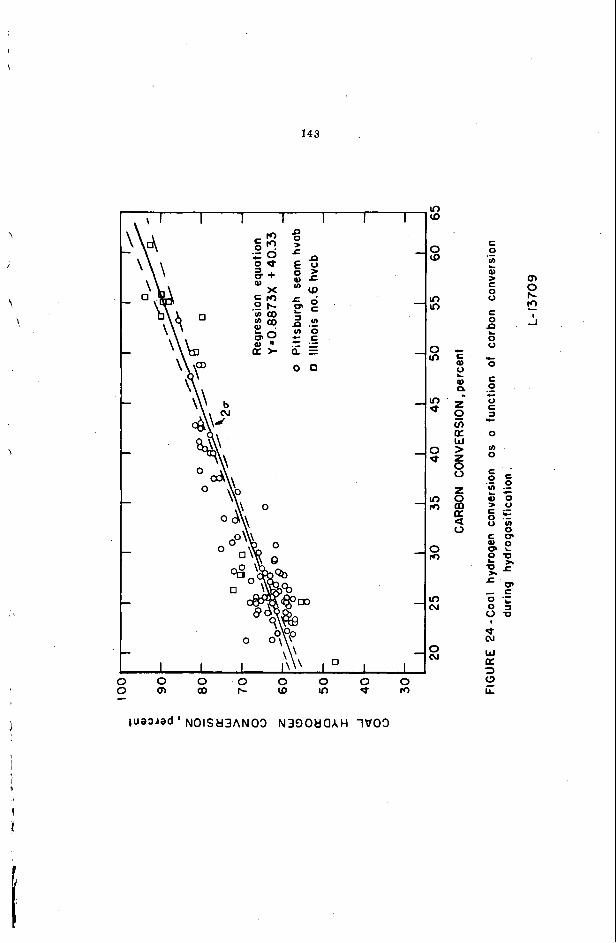
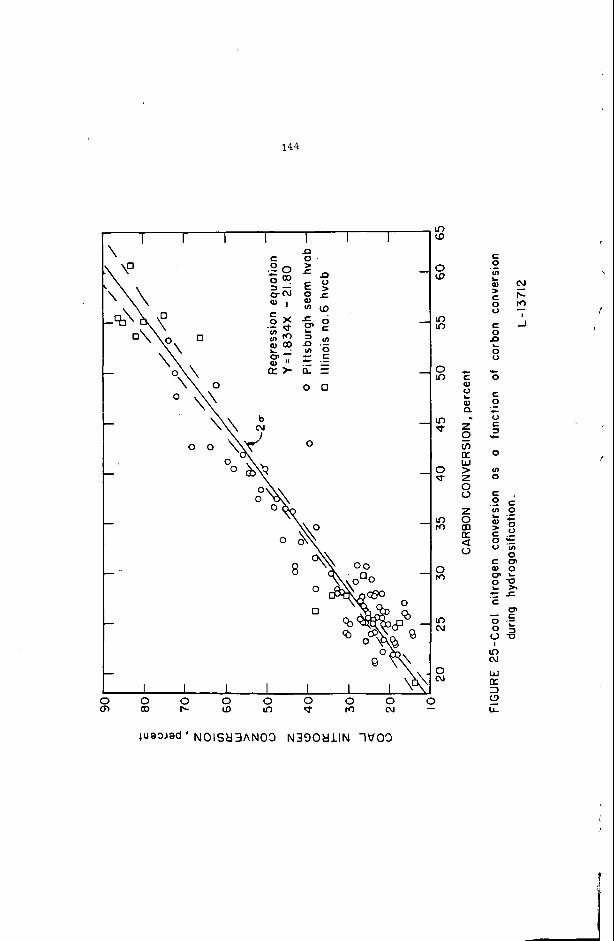
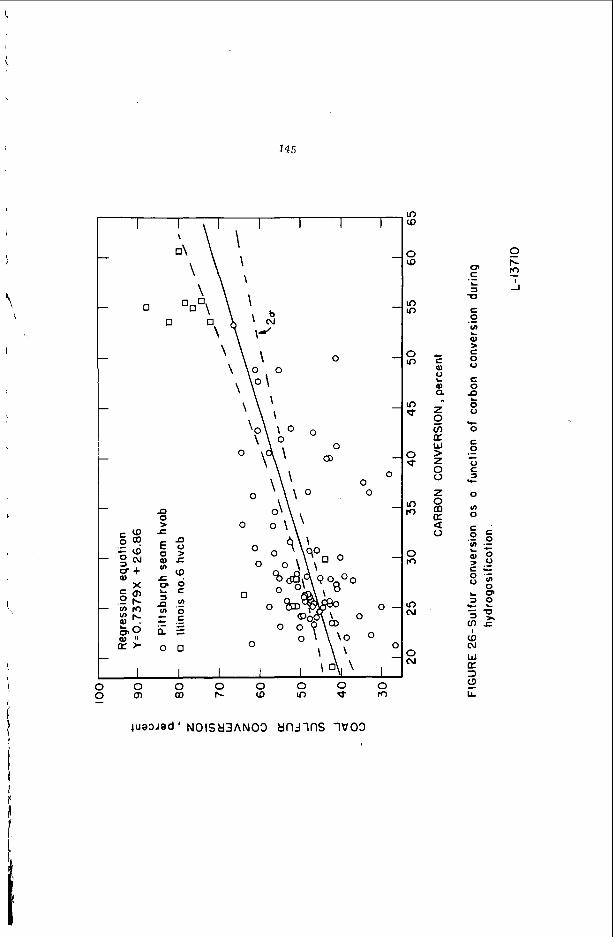
i n t h e FDP reac to r and FDP-Fluid Bed in tegra ted r eac to r s were co r re l a t ed wi th carbon conversion t o y i e ld Figures 23-26. The co r re l a t ions i n Figures 23-25 show t h a t char y i e l d and r e m v a l of coa l hydrogen and n i t rogen can be accura te ly ca l cu la t ed from carbon conversion, independent of r eac to r conditions and poss ib ly geometry. carbon conversions above 20 p c t ( e s sen t i a l ly devo la t i l i za t ion ) t he oxygen removal usua l ly exceeds 90 pc t and can be considered t o be complete. The da ta f o r s u l f u r removal are very sca t t e red , poss ib ly because of t he e r r o r i n determining changes in smal l amounts of s u l f u r i n t h e coa l and char samples. s u l f i d e t h a t is formed may be i n e q u i l i b r i u n w i t h s u l f u r i n the char such t h a t a Simple co r re l a t ion wi th carbon conversion i s not poss ib le .
For
In addi t ion , t h e hydrogen
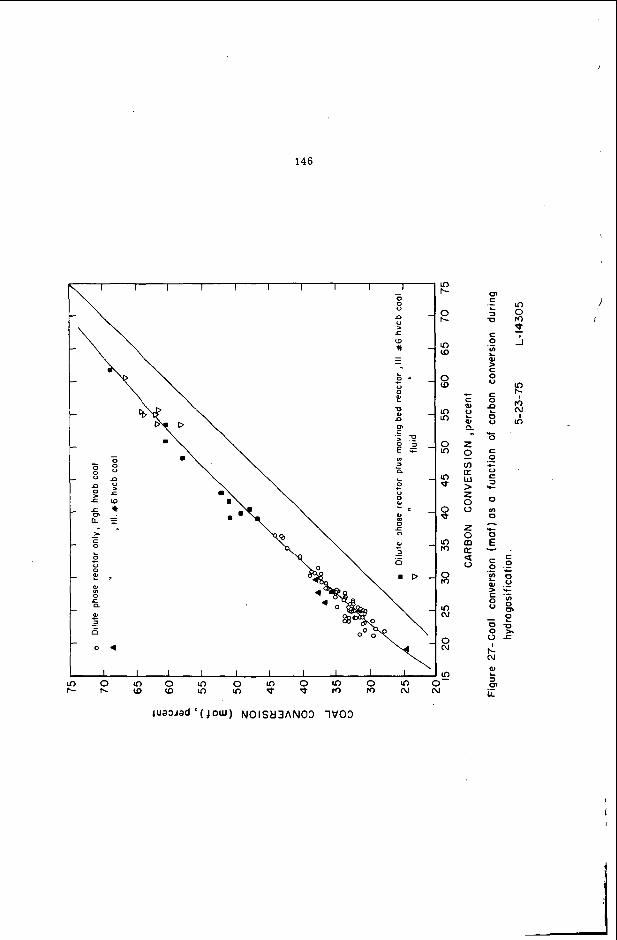
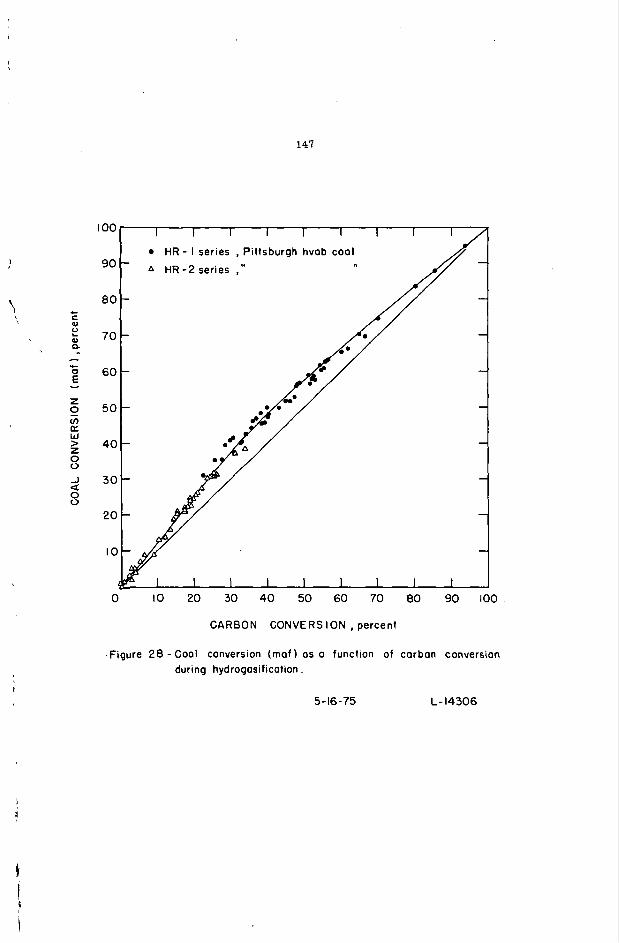
In Figure 27, t h e char y i e l d s have been recomputed in terms of Y F conversion so t h a t t he r e l a t ionsh ip between carbon conversion and MAF conversion can be shown. A curve is drawn through the da ta such t h a t i t bows away from the u n i t s lope l i n e and passes through (0.0) and (100,100). covered t h e carbon conversion range 22-55 pc t a0 t h a t €o r s impl i c i ty a s t r a i g h t l i n e was used t o f i t t he data. As the range is widened, however, i t becomes obvious t h a t a curve gives a b e t t e r c o r r e l a t i o n of the data.
The d a t a i n Figures 23-25 only
The carbon conversion r an re covered by the HR-1 and IIR-2 series experirrents is complete, ranging from 0 t o 95 pc t . In Figure 28, t he MAF conversion is p l o t t e d versus carbon conversion and e s s e n t i a l l y the sme curve as used i n F igure 27 f i t s these results. cons t i t uen t conversions wi th carbon conversion a r e no t only independent o f r eac to r conditions, but a l s o r eac to r geometry. p l o t f o r t h e HR-1C and HR-2C series char tests. does no t include t h e carbon t h a t w a s l o s t during devo la t i l i za t ion o f t h e coa l t o prepare t h e char.
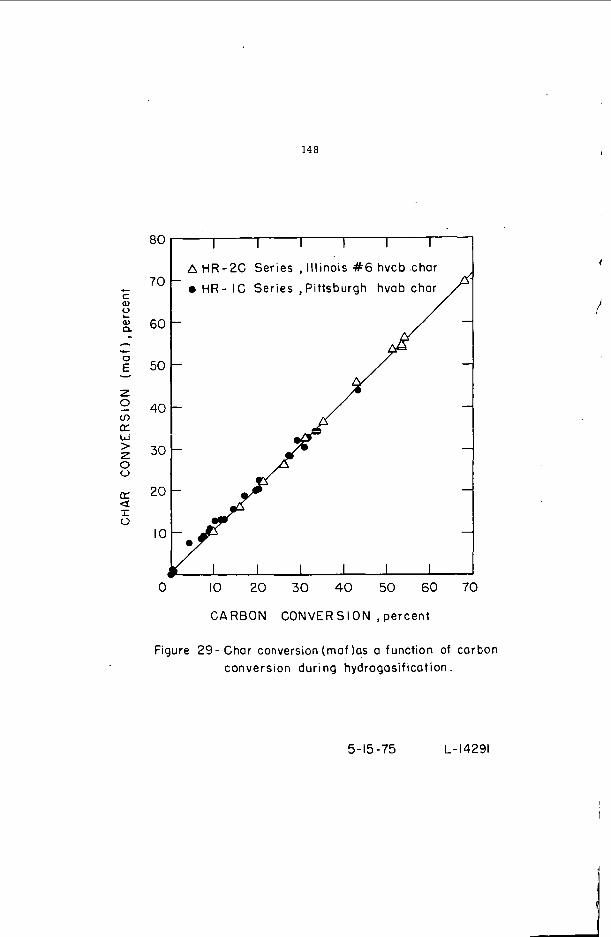
Based on these curves it appears t h a t t he co r re l a t ions of coa l
Figure 29 shows a s imi l a r MAF-carbon conversion The carbon conversion i n F igure 29
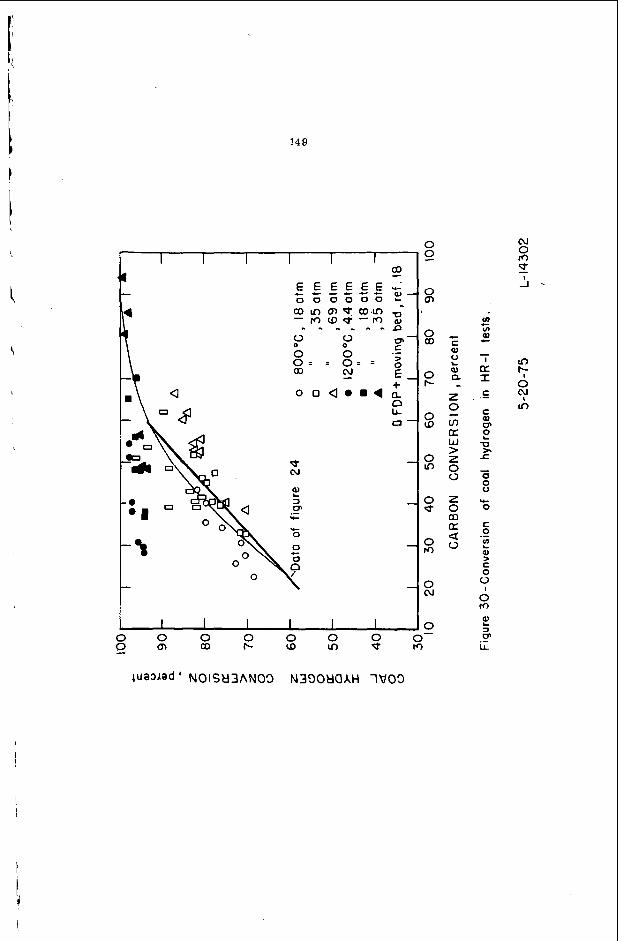
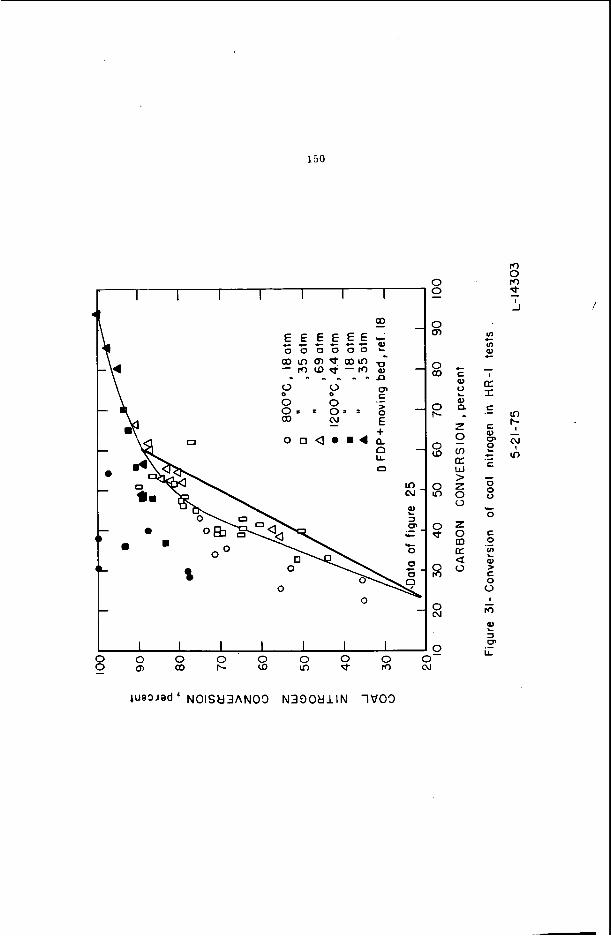
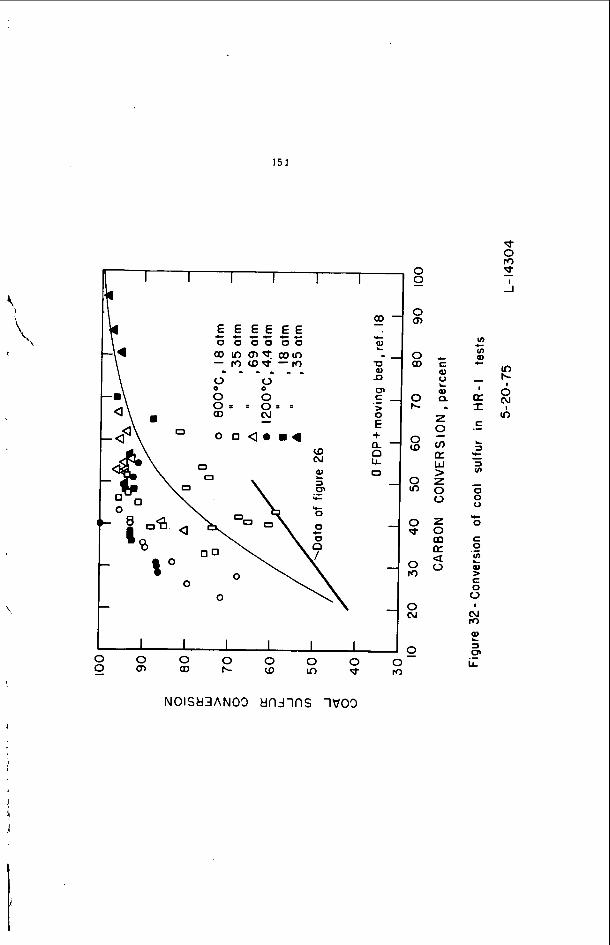
The conversion of coal 11, N, and S in t h e HR-1 and HR-2 series experiments a r e shown i n Figures 30-32. H and N d a t a determined previous ly a r e shown t o be inadequate over a very wide range of carbon conversion. a r e concave downward, s i m i l a r t o the MAF curves. the co r re l a t ion with carbon conversion still appears t o b e va l id . FDP and Two-Stage r eac to r experiments, u l t imate analyses were no t run on t h e coa l feed f o r each test, but only on the e n t i r e ba tch of coal. segregation in t h e feeds could have occurred causing scatter i n t h e ca l cu la t ion of t he H , N, and s u l f u r conversions. These cons t i t uen t s are present in r e l a t i v e l y small amounts and thus t h e i r ca lcu la ted conversions are very s e n s i t i v e t o f luc tua t ions i n t h e feed composition. The s u l f u r da t a i n Figure 32 shows a more d e f i n i t e trend wi th carbon conversion than w a s ev ident i n F igure 26 and shows t h e la t ter co r re l a t ion t o be conservative. Work is planned t o extend the l i n e a r co r re l a t ions i n Figures 23-26 t o a regression curve t h a t w i l l f i t a l l o f t h e data, i.e., FDP, HR-1, HR-2, and the Two-Stage reactors. These r e l a t ionsh ips a r e very valuable i n scale-up design ca lcu la t ions because t h e displacement of t h e v o l a t i l e elements i n the coa l and the char y i e l d can be accura te ly pred ic ted f o r t h e p l a n t flowsheet.
In Figures 30 and 31, t h e s t r a i g h t l i n e f i t s of t he
These sets of da t a a r e both f i t b e s t w i th curves t h a t Despite t h e s c a t t e r i n the da ta ,
Unlike i n the
Consequently, some
E
120
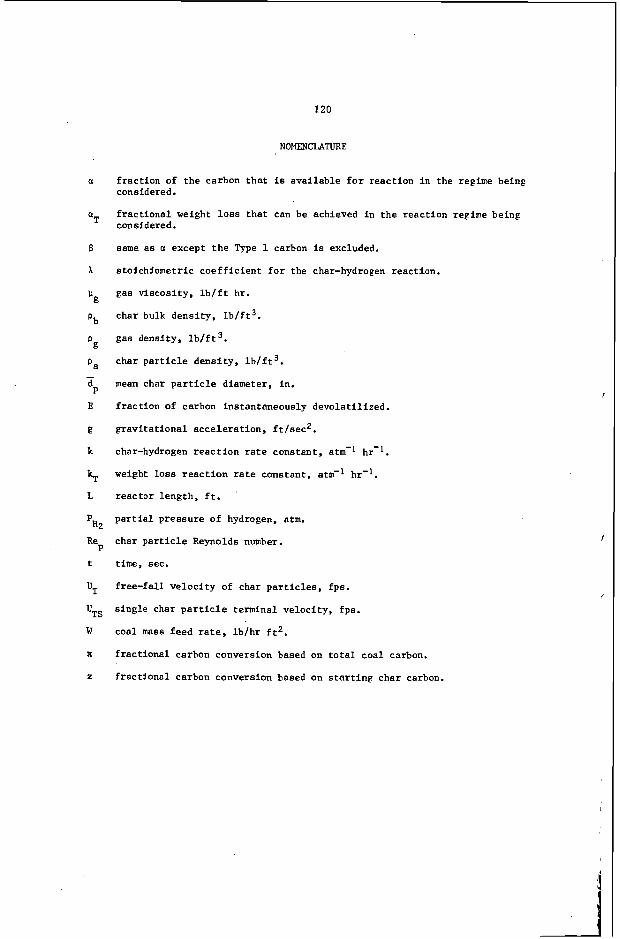
NOMENCLATURE
a
E
x
pH2
Re P
t
'TS w X
z
f r ac t ion of t h e carbon t h a t is ava i l ab le f o r reac t ion in t he regime being considered.
f r ac t iona l weight l o s s t h a t can be achieved in t h e reac t ion regime being considered.
same a s a except t h e Type 1 carbon is excluded.
s to ich iometr ic c o e f f i c i e n t f o r the char-hydrogen reaction.
gas Viscosity, l b / f t hr.
char bulk dens i ty , l b / f t 3 .
gas density, l b / f t 3.
char particle dens i ty , l b / f t 3 .
mean char p a r t i c l e diameter, in.
f r ac t ion of carbon instantaneously devola t i l i zed .
g rav i t a t iona l acce le ra t ion , f t / s ec2 .
char-hydrogen r e a c t i o n r a t e cons tan t , atm-' hr-l.
weight l o s s r e a c t i o n rate constant, atm-' hr-l.
reac tor length , f t . '
p a r t i a l p ressure o f hydrogen, atm.
char particle Reynolds number.
t i m e , sec.
f ree- fa l l ve loc i ty of char p a r t i c l e s , fps.
s ing le char p a r t i c l e terminal ve loc i ty , fps.
coa l mass feed r a t e , l b /h r f t 2 .
f r ac t iona l carbon conversion based on t o t a l coa l carbon.
f r ac t iona l carbon conversion based on s t a r t i n g char carbon.
' L References
7 ,
1. Feldmann, H. F., C. Y. Wen, W. H. Simons, and P. M. Yavorsky. Pipeline Gas From Coal by the HYDRANE Process. Presented at the 71st National AIChE Meeting, Dallas, Texas, Feb. 20-23, 1972.
Supplemental
2. Feldmann, H. F. and P. M. Yavorsky. The HYDRANE Process. Presented at the 5th AGA/OCR Synthetic Pipeline Gas Symposium, Chicago, Illinois, Oct. 29-31, 1973.
3. Wen, C. Y., C. T. Li, S. H. Tscheng, and W. S. O'Brien. Comparison of Alternate Coal Gasification Processes for Pipeline Gas Production. Annual AIChE Meeting, New York, New York, Nov. 26-30, 1972.
Presented at the 65th
I 4. Wen, C. Y., coworkers. Optimization of Coal Gasification Processes, Research and Development Rept. No. 66, Interim Rept. Nos. 1 and 2, O.C.R., U.S . Dept. of the Interior, Wash., D. C.
5. Feldmann, H. F., W. H. Simons, J. A. Mlma, and R. W. Hiteshue. Reaction Model for Bituminous Coal Hydrogasification in a Dilute Phase. Division, ACS, V. 14, No. 4, Part 11, Sept. 1970, pp. 1-13.
Preprints of Fuel
6. Feldmann, H. F., J. A. Mlma, and P. M. Yavorsky. Pressurized Hydrogasification of Raw Coal in a Dilute-Phase Reactor. Series 131, ACS, Washington, D. C., 1974, pp. 108-125.
Fuel Gasification, Advances in Chem.
7. Hiteshue, R. W., S. Friedman, and R. Madden. Hydrogasification of High-Volatile A Bituminous Coal. U.S. Bureau of Mines Report of Investigation 6376, 1964.
8. Hiteshue, R. W., R. B. Anderson, and M. D. Schlesinger. Hydrogenating Coal at 800' C. Ind. & Eng. Chem., 9 (Dec., 1957), pp. 2008-10. I
9. Hiteshue, R. W., P. S. Lewis, and S. Friedman. Gaseous Hydrocarbons from Coal. Paper presented at the A.G.A. Operating Section Conference, 1960 (CEP-60-9).
I
10. Hiteshue, R. W., S. Friedman, and R. Madden. Hydrogenation of Coal to Gaseous Hydrocarbons. U.S. Bureau of Mines Report of Investigation 6027, 1962.
11. Friedman, S., R. W. Hiteshue, and M. D. Schlesinger. Hydrogenation of New Mexico Coal at Short Residence Time and High Temperature. U.S. Bureau of Mines Report of Investigation 6470, 1964.
12. Hiteshue, R. W., R. B. Anderson, and S. Friedman. Gaseous Hydrocarbons by Hydrogenation of Coals and Chars. Ind. 6 Eng. Chem.. 52 (July, 1960), pp. 577-9.
13. Hiteshue, R. W., S. Friedman, and R. Madden. Hydrogasification of Bituminous Coals, Anthracite, and Char. U.S. Bureau of Mines Report of Investigation 6125, 1962.
14. KaQa, W., R. W. Hiteshue, W. A. Budd, S. Friedman, and R. B. Anderson. Agglomeration Studies in the Low-Pressure Hydrogenation of Coal in a Fluidized Bed. U.S . Bureau of Mines Bulletin 579, 1959.
15. Lewis, P. S. and R. W. Hiteshue. Hydrogenating Coal in the Entrained State. Ind. h Eng. Chem., 2 (Nov., 1960). pp. 919-20.
16. Lewis, P. S., S. Friedman, B. W. Hiteshue. High Btu Gas by the Direct Conversion of Coal. Fuel Gasification Advances in Chem. Series 69, ACS, Washington, D. C., 1967, pp. 50-63.
122
Hiteshue, R. W. The Hydrogasification of Raw Coal. Paper presented a t t h e h e r . Gas Assoc. Symposium on Synthetic P ipe l ine Gas, P i t t sburgh , Pa., Nov. 15, 1966.
Wen, C. Y., S. Mori, J. A. Gray, and P. M. Yavorsky. Application of the Bubble- Assemblage Model t o t h e HYDRANE Process Fluid-Bed Hydrogasifier. a t the 67thAnnualAIChE Meeting, Wash., D. C., Dec. 1-5, 1974.
Feldmann, 11. F., W. H. Simons, C. Y. Wen, and P. M. Yavorsky. Simulation of a Reactor System f o r t h e Conversion of Coal t o Methane by the HYDRANE Process. Paper presented a t t h e 4 t h In t e rna t iona l Congress of Chem. Eng., Marianske Lame, Czechoslovakia, Sept. 11-15, 1972.
Given, P. H. Structure. Fuel, 2 (1960), pp. 147-153.
Zahradnik, R. L. and R . A. Glenn. The Direct Yethanation of Coal. F u e l s , No. 1, (1971), pp. 77-90.
Moseley, F. and D. Paterson. The Rapid High-Temperature Hydrogenation of Coal- Chars P a r t 2: Hydrogen Pressures up t o 1,000 Atmospheres. J. I n s t . o f Fuel, - 38 (Sept., 19651, pp. 378-391.
Johnson, J. L. ing Steam and Hydrogen. Fue l Gas i f ica t ion , Advances i n Chem. S e r i e s 131, ACS, Wash., D. C., 1974, pp. 145-178.
Kunii, D. and 0. Levenspiel. F lu id iza t ion Engineering. John Wiley h Sons, Inc., New York, 1969, p. 76.
Paper presented
The Di s t r ibu t ion of Hydrogen in Coals and Its Rela t ion to'Coa1
Kine t ics of Bituminous Coal Char Gas i f ica t ion wi th Gases Contain-
17.
18.
19.
20.
21.
22.
23.
24.
25.
26.
27.
28.
29.
Wen, C. Y. and J. Huebler. Kine t ic Study of Coal Char Hydrogasification, Rapid I n i t i a l Reaction. Ind. & Eng. Chen. Design & Develop., 5 (April , 19651, pp. 142-147.
Feldmann, H. F., K. D. Kiang, and P. M. Yavorsky. Coal Char. P rep r in t s of Fue l Division, ACS, v. 15, No. 3, Sept. 1971, pp. 62-76.
Ouarterly Technical Progress Report, Morgantown Energy Research Center, Morgantown, West Virg in ia , September-December, 1969, p. 2.
Anthony, D. B. Rapid Devo la t i l i za t ion and Hydrogasification of Pulverized Coal. Sc.D. Thesis, Dept. o f Chem. Eng. , M.I.T., Cambridge, Mass. , Jan., 1974.
Blackwood, J. D., B. D. C u l l i s , and D. J. McCarthy. Reac t iv i ty i n t h e System Carbon-Hydrogen-&thane. Aust. J. Chem. 2 (1967), pp. 1561-70.
F lu id i za t ion Proper t ies of
a I
\
StFfinless steel type 304
Porous stainless steel plote
T C =Thermocouple
Porous stainless steel p I o te - thick, meon pore diameter
165 microns
Low voltage transformer
From vorioble transformer 3 E ' r Output- 700 amperes a t 8-9 volts
Figure I - "Hot - rod " reoctor. L- 4753 12-12-56
i
124
v)
+ e 0.
0 a
0 d m P J
125
21 t!
0"
L r I
126
3 r d floor _ _ _ _ _ - -
a c I aD n -
I m
4 7
m
i 7 N
i 7
u)
i
lnterstage gas _ _ _ - _ - - - -
Dilute phase reactor
Char crusher
>
lnterstage gas
1 % methane)
Hydrogen feed
Figure 4 - Integrated hydrogasification unit.
L- 12914
127
n Coal feed hopper
$" ID feed nozzle Simulated 2nd stage-
r product gas
I Dilute phase reactor
Main tail gas to hot gas
trap
Moving bed sample -
Moving bed reacto
Hydrogen feed-
r Char receiver
3.26" ID x 6' 3 -Dilute phase sample
$2" char transfer tube . ' Disengaging zone
3 . 2 6 1 0 x IO'
/ Char ejector throat
Figure 5 -Integrated two- stage hydrogasifier
L-13753
128
100 - I I I I I I I I 1 I I -'
- - - - 0 - - - - GO2 +He GO + H20 - - -
0 - - O N I" a" a x X -
- 0" 1.0 1 s o a n
- - I1
- 0 Q 0
- - - - 8 Y -
0 - 0
0 -
- Pittsburgh seam hvab coal - Literature data
-
- -
0. I I I I I I I I I I I I
Figure 6- Water-gas shift equilibrium of carbon oxides in the FDP reactor.
Y
5-23-75 L- I4298
129
. . . I .
0 0 0 0 .. , 0 a , ’,.<- . , e ro
C 0
c 0
0 0 :
? . .
2 3 0 LL .-
130
O 1
0 0
- 0
I 0 - 0 0 0
' 4 rc, N
E + 0
w [I: 3 cn t.n w M a
a a a
-J
F
a
z w (3 0
0 > I
-
a
In ? co In
1
I
\
'i \
0 0 0
a J
I w > 1
J 6
I ! \
.060
,050
,040
,030
Gas phase residence time I - Pittsburgh seam hvab coo
0 900°C 0 850°C A 800°C A 750 "C o 725°C
- b \ . A
650°C
0 20 40 60. 80 I00 120 140
PARTIAL PRESSURE OF HYDROGEN , a t m
Figure 9- Effect of hydrogen partial pressure on oil yield.
5 -20-75 L-I4294
132
- 0 0 0
0 0 - v) c c
h
Q 0
0
1
0
0
I I
6 0
0 - 0 0 0 m cu 0 0
u) In e 9 9 9 9 9 9
0 0
a 0 9
u)
8
e 8
8 0
0
u) L =I 0 c
W z i-
W 0 z W 0 u) W
..
- a
E 0)
2.
0
C 0
Q)
.- - .-
E .- L
Q) 0 c Q)
In 0 2 Q) In 0 c n v) 0 FE
0
0 Q)
W
c
c
c .c
I
0 2 2 CI,
L .-
I
133
\
I I I
N I 2' O\o
1 -
v) 0 CE U Q) aa t c
I
I
E c 0
W
3 cn cn W
- a
a a
a
a a
0 I- O
W
I J
- 0 0
0
0 Q)
w
c c
r
c
u- u-
I - - L ii =l 0
134
In - c
0
-0 c 0
- v
.- L .-
CE c .- a
0 0 *
0
0 8
0 0
0
N c .c
L s \
II) n
> I- 0 3 J w > v) cn
-
-
a 5 0 w W L L
J
0 0
a
L
c al 0)
0 -0
w 0
0) > 0 0)
E .-
:
f C 0
0 c U 0 0
.-
- L
c 0 V 0
??
?? a C I , . LL .-
135
\
0 9 -
n
136
c E W
W 9.
2
- z 0 v)
w > z 0 0
z 0
- a
m a a 0
35
30
25
20
15
I O
5
I . I I 1 I
5 0 X I00 mesh,12-13 Ibs/ 69 atm ,3.26"X 5' reactoi Feed gas - 50% He/ 50% CHq
0 Illinois #6 hvcb coal A Pittsburgh seam hvab coal
400 500 600 700 800 900 1000
REACTOR WALL TEMPERATURE , "C
Figure 14- Corbon conversion in the FOP reactor for Illinois # 6 hvcb c o a l .
5-16-75 L-14292
I
137
40
35
.- 30
e C 0)
Q) a.
z 0 Y,
> z 0 0
-I U I- O I-
- 25
E 25
15
IC
5
1 1 I I I I
V V 800
A 490
n 1 600 52C a 470
Pittsburgh seam hvab coal A 4 2 5 " C , 35 atm o 4 2 5 " C , 6 9 a t m 0 470"C, "
A 4 9 0 " C , " 5 2 0 ° C , "
0 600°G, I'
V 8 O O 0 C , "
-Model FA 0 2 4 6 8 IO 12 14
RESIDENCE T I M E , minutes
Figure 15-Effect of temperature and time on total conversion in "hot rod" reactor , H R - 2 tests .
5-22-75 L-14300
c C 0)
0) CL
2 - z 0 Y,
w > z 0 0
z 0
- a
m a a 0
35
30
25
2 0
15
IO
5
I I I I I I I V
600 I 0
520 Pittsburgh seam hvab coal
A 4 2 5 " C , 3 5 o t m 0 5 2 O o G , 6 9 a t m o 4 2 5 " G , 6 9 a t m 0 6 0 0 " C , "
0 470"C, " V 8 O O 0 C , "
A 4 9 O o C , " - Model
0 2 4 6 8 IO . I2 . 14 16
RESIDENCE TIME, minutes
Figure 16- Effect of temperature and time on carbon conversion in "hot rod " reactor , H R - 2 tests .
5-27-75 L-14301
139
I
I O 0
90
80
70
60
50
40
30
20
I O
0
I
- Rate model
- / 0
1 Pittsburgh hvab coo I o 8 O O 0 C , 18.0 atm A " ,35.0 atm 0 ,69.0 atm n 1 2 O O 0 C , 4.4 otm 0 I' , 18.0 atm 0 " ,35.0 atm
I I I I
5 IO 15 20 25 30
RESIDENCE TIME minutes
Figure 17- Carbon conversion data for the HR- I
series experiment .
5-21-75 L-14299
140
0
I I I I I m
I J
I 0 0 0
I I - I I I - -g I
0 0 - 0 0 O I n (0 O n d cu 0
141
80 I I I I I
Pittsburgh hvab char 7 0 - Temperature - 8 0 0 ° C
o 18.0 atrn
60- o 35.0 otrn A 69.0 atm -Rate model 0 6 9 . 0 otm ,HR-2C
50 - I
40 -
30 -
20 -
0 5 I O 15 20 25 30 RESIDENCE T I M E , minutes
Figure 22- Carbon conversion data for the HR-IC series experiments.
5-15 -75 L- I4290
142
r------ 0
0
I I I 0
1 1 0 In 0 0 0 m 0 OD Fc Fc W UY m In e 0
In W
0 u)
In In
0 In
0 d
0 d
n .c)
2
n N
3 N
OD
? 9 i
143
\
/
\
J
0 0
2 m o m m a a
0
8
m cu
0 N
c o
0 0
0 0 rr) N
O O ? 0 0 0 cn 00 co In d
lua3Jad ' NOISt13hN03 N 3 9 0 t l l l N lWO3
c 0 In L W > c 0 0
c 0
0 V
0
c 0
0 C 3
.-
e c
.- c
.c
0
In 0
I I
I
\
I z I
0
\ \to \ o
0 \
0
0 0 a
0 O o \ Y o O \
I
0 0
0 0
I I I 1 I 0 0 0 0 lo ro * rc)
0 0 0 a, d) rc
In lo
0 (0
ro ro
8
In w
0 *
5) rc)
%
5) (u
0 (u
c C 0)
0) a
z cn w > z
2
0 a
8 s z a a 0
c 0 v)
0 > C 0 0
c 0
0 0
0
C 0
V C 3
0
u) 0
.- L
e - .- L -
146
I
147
I
A
I I I I I I I I
HR - I series , Pittsburgh hvob cool
HR - 2 series ,"
0 IO 20 30 40 50 60 70 80 90 100
CARBON CONVERSION , percent
.Figure 28 - Cool conversion (mof) os o function of carbon conversion during hydrogosificotion .
I
i 3
I
5-16-75 L- 14306
148
80
7 0
60
50
40
30
20
I I I I I I
A H R - 2 C Series , I l l inois #6 hvcb .char
0 HR- I C Series ,Pittsburgh hvab char /
0 IO 20 30 40 50 60 70
CARBON CONVER S l O N ,percent
Figure 29- Char conversion (maf )as a function of carbon conversion during hydrogasification.
5-15-75 L-14291
149
\
0
1 I I I I I lo z- 0 0 0 0 0
a0 pc (0 In d 0 0 o m
N 0 rs) s L ‘
s In
I
150
t 0
-
ar, E E E E E E L c c c c c c 0 0 0 0 0 0 ~
m c > 0
0 0
0 0
CU OD
._ 0 . E 0 : E
+
I I I I I 1 I
8 0 0 0 e a In d ' 0 0 l o O D
c c W
W Q.
z 0 v)
w > z 0 0
z 0
2 - - a
m a a 0
ln ln W
c
c
- I
a I C
c W 0
.-
2 c .- C
0 0 0
0
c 0 ln
W > c 0 0
n
-
Lc
.- L
I - ?! 1 cp
LL .-
151
t h (D cu
0 toe\\ $ 0 a
'0 0 0
t o
(D cu 0 a
00
0 0 - '\
0 0 0 0 0 0 0 0 0
a0 rc (0 m d- rs) 0 Q,
N O I S U ~ A N O ~ tlndins iwo3
I J
152
i 7i N I x 0 a
i E - s! I
0 (D
c E N
- I x 0 W
K
I 0
a
h a 0
0 B
5 w u)
E c
I
0 N
153
E c I- T!
t E
ID 0
C
I E 0 0,
E
0, (D
C
I
ID a
154
b . O l 6 mm X 3600
Figure 21 - SEM PHOTOGRAPHS OF FDP CHAR (LIGNITE) , (85OoC, 69 atm) I