Embed Size (px)
Citation preview
AIChE Annual Meeting, Austin, TX, November 7-12, 2004 Session 01D02: Transport and Reaction in Heterogeneous and Porous Materials
Is Gravity Drainage an Effective Alternative to WAG?
Madhav M. Kulkarni1 and Dandina N. Rao The Craft and Hawkins Department of Petroleum Engineering, Louisiana State
University and A & M College, 3516 CEBA Bldg., Baton Rouge, LA.
Abstract Recovery from the 377 billion barrels of the residual oil (in the U.S.) in reservoirs after primary production and secondary waterfloods is becoming increasingly important to cater to the energy needs of the country. Gas injection, the fastest growing enhanced oil recovery (EOR) process, holds the promise of significant recoveries from these reservoirs. Continuous gas injection (CGI) in the conventional horizontal flooding patterns leads to severe gravity segregation and poor reservoir contact (sweep) volumes. To improve the sweep efficiency, the Water-Alternating-Gas (WAG) process has been widely practiced in the industry. The potential of improved reservoir sweep and reduced gas requirements has been the reason for WAG’s wide application. However, the WAG process has not measured up to expectations as evidenced by the low (5 – 10%) recoveries observed in about 60 field cases. These poor WAG recoveries appear to be largely due to increased mobile water saturation, which results in water shielding, decreased oil relative permeability and poor gas injectivity. Newer variants of the WAG process, foams, and gas thickeners, aimed at mitigating gravity effects, are still in the experimental stage and not yet part of the commercial technology.
The key question this work attempts to address is: Do we continue to ‘fix the problems’ of gravity segregation in the horizontal gas floods or find an effective alternative? At LSU, we are attempting to develop the ‘Gas-Assisted Gravity Drainage (GAGD)’ process as an effective alternative to WAG. Instead of combating the gravity forces as done in WAG and other processes, the GAGD process makes use of natural segregation of injected gas and reservoir hydrocarbon liquids. The GAGD process employs horizontal wells to produce the oil draining down from gas zones created by vertical gas injectors. This presentation will highlight the GAGD concept, its potential advantages and experimental demonstration against CGI and WAG in 6-ft long Berea corefloods.
1 Corresponding Author: Fax: 1-225-578-6039; Phone: 225-578-5225; e-mail: [email protected].
Need for Enhanced Oil Recovery In 1978, the U.S. Congress commissioned the Office of Technology Assessment1 (OTA) to evaluate the state of the art in U.S. oil production. The OTA concluded1 that the 300 billion barrels of known U.S. oil remained economically unproducible by conventional methods. The OTA report1 also evaluated a range of Enhanced Oil Recovery (EOR) techniques and their potential for recovering a sizeable fraction of this known resource base. These major political and administrative amendments triggered increased interest in EOR in late 70’s and early 80’s, most notably in California and the Permian Basin (West Texas).
Now, 25 years later, there is again a strong national interest in energy security2, and the total ‘unproducible oil’ referred to in the OTA report1, has increased to a whopping 377 billion barrels3. The need for oil in the U.S. has been constantly on the rise, except for the temporary drop during 1979 - 1983 (Figure 1)4. The U.S. Geological Survey4 notes that the proven U.S. reserves3,5 (~ 22 billion barrels, as of July 07, 2004) would be depleted quickly at the current production rates5 of 5.6 million barrels per day, and the probability of finding newer reserves is diminishing4,5. Most important conclusion of this report, from oil self-reliance point of view, is that the EOR techniques have not been tried for most of these reservoirs. Therefore, the potential for EOR applications in the U.S. are very large with a target of 377 billion barrels.
U.S. EOR Scene The EOR processes today contribute a significant portion (~ 12%) to the U.S. domestic production, and its importance continues to rise in light of the recent record high crude oil prices of about $46 per barrel. The U.S. EOR scene is dominated by thermal methods used in heavy oil production, followed by CO2 gas injection (mostly miscible) and finally hydrocarbon gas injection. These three processes contribute almost 98% of the U.S. EOR production. The changes in the U.S. EOR application and distribution scenario from 1984 to 2004 are shown in Figure 27.
Figure 2 shows that except for the CO2 and hydrocarbon processes, all the other EOR processes, namely thermal, and Nitrogen, have significantly decreased and the and chemical methods are nearly extinct. The share of CO2 and hydrocarbon gas processes has increased from 18% (1984) to 48% (2004) in just two decades.
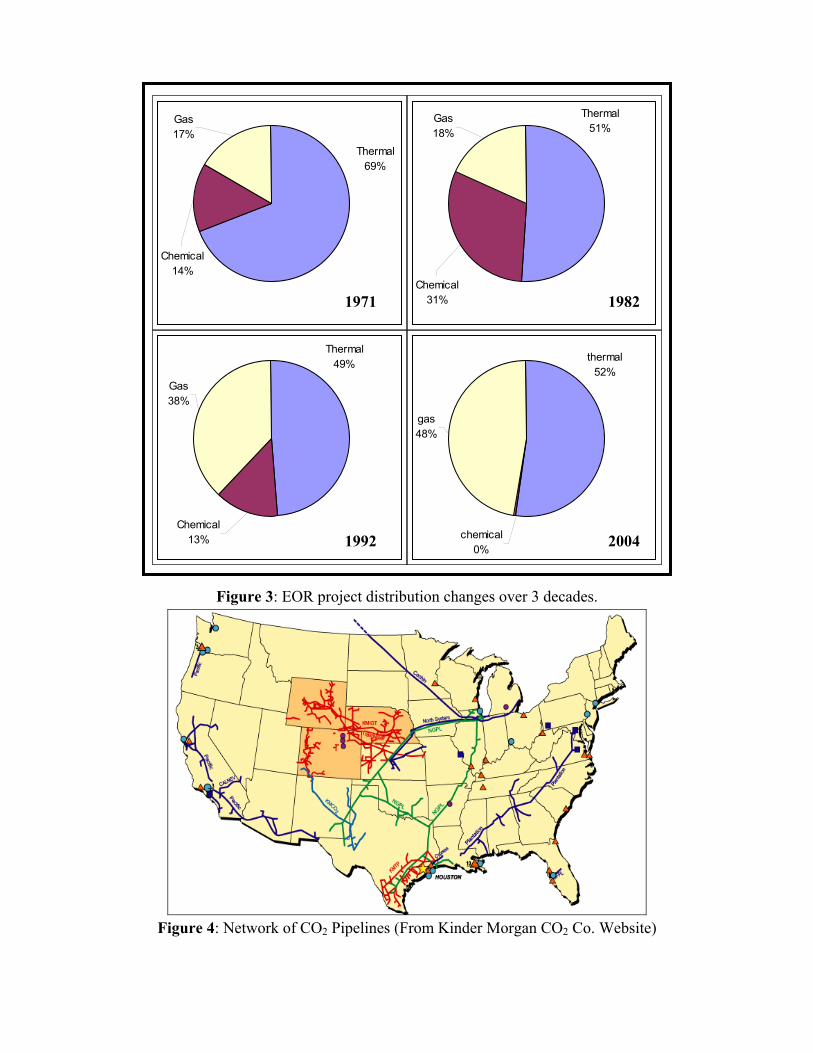
EOR Status The U.S. EOR share patterns (Figure 3) demonstrate a clear shift in the oil industry towards more efficient EOR processes, and the steep rise and equally quick downfall of the chemical based EOR in the past 3 decades. The thermal methods are indispensable due to the presence of extensive heavy oil reserves. The gas injection process applications have steadily grown to become the main process for light oil EOR applications (using
CO2 or hydrocarbon gas). EOR survey6 shows that the gas injection processes are applicable to almost all medium-to-light oil reservoirs, with various fluid and reservoir characteristics. Thus, the gas injection processes hold the promise of significantly enhancing the recovery of the oil left behind by primary and secondary recovery operations.
Gas Injection EOR Status As demonstrated earlier, the gas injection EOR processes would be instrumental in tapping the 377 billion barrels of oil left behind in the U.S. reservoirs after primary and secondary processes. Moreover, as most of the U.S. oil reserves can be classified as medium to light, with average API gravities of over 28o, except for the ‘Thums’ and ‘Kern River’ oils8; gas injection process has become indispensable in the U.S. EOR scenario.
Further scrutiny of the gas injection EOR performance shows that within the last twenty years the miscible CO2 projects have increased6 from 28 in 1984 to 70 in 2004 and their production during the same time period has grown by 6 folds6 from 31,300 BPD to 205,775 BPD. The production from miscible hydrocarbon gas injection projects in the U.S. has also steadily increased from 14,439 BPD in 1984 to 124,500 BPD in 2000 in spite of their decreasing numbers. However, this trend was reversed in 2002 and 2004 when the production from hydrocarbon gas floods fell to 97,300 BPD, perhaps due to the increasing price of natural gas9. Studies of the gas injection EOR status show that only two injectants, CO2 (miscible) and hydrocarbon (miscible and immiscible) gas, have continued to grow, while all the other injectants namely, CO2 (immiscible), N2 and flue gas have declined or become extinct. The overall effect is that the share of production from gas injection EOR in the U.S. has more than doubled from 18% in 1984 to 47.9% in 2004. This clearly demonstrates the growing commercial interest that the U.S. oil industry has in gas injection EOR projects – especially CO2.
Importance of CO2 as Injectant CO2 injection remains an important EOR method in the U.S. in-spite of oil price swings and ownership realignments. The CO2 process leads the gas injection processes spectrum, complimented with nitrogen and hydrocarbon (HC) processes. This is especially true in the Permian Basin of West Texas and New Mexico. Over 95% of the CO2 flooding activity, is in the United States, and mainly in the mature Permian Basin of the southwestern U.S. and dominated by injection under miscible conditions10,11.
CO2 floods demonstrate lower injectivity problems due to its higher viscosity, compared to other common injectants. Furthermore, the lower formation volume factor (FVF) of CO2 and lower mobility ratio make the volumetric efficiency higher for CO2
than other solvents and solvent mixtures. The CO2 density is much closer to typical light
oil density (under miscible conditions) than most of the other solvent injectants, making CO2 less prone to gravity segregation compared to N2 and CH4 under similar pressures. Another beneficial effect of CO2 is the likelihood of higher gravity segregation in the high water saturation zones of the reservoir than in the higher oil saturation zones. This effect is also useful to target pockets and bypassed areas of oil and drain them effectively12. The increasing price of natural gas, higher incremental oil recoveries by CO2 (compared to hydrocarbon gases13) and the additional benefit of carbon sequestration tip the scales in favor of CO2 for future gas injection projects.
The lower costs for implementing CO2 floods are due to large gas processing facilities as well as huge reserves of almost pure CO2 (Mississippi, West Texas, New Mexico, Oklahoma, North Dakota, Colorado and Wyoming), supported with extensive CO2 pipeline infrastructure (Figure 4). Projected oil recoveries from these projects are in the order of 7-15% OOIP10,13. Improved simulation capabilities and reduced development costs have made the CO2-based processes even more attractive for commercial applications in recent years.
Commercial Implementation of Gas Injection EOR The idea of injecting gases to improve oil recovery is not new14 – research papers on this topic have been published as early as 1920’s. The gas injection processes are aimed at improving recoveries by lowering the interfacial tension between the injected gases and the crude oil to minimize the trapping of oil in the rock pores by capillary forces.
The Water-Alternating-Gas (WAG) Process Miscible gas injection projects demonstrate high microscopic displacement efficiency, attributable to high capillary numbers achieved under miscible conditions. However, the viscosity of gases injected, whether CO2 or hydrocarbons, is generally less than one-tenth of that of the oil at reservoir conditions resulting in adverse mobility ratios and poor volumetric sweep efficiency in horizontal gas floods. When gas is injected into a horizontal reservoir, its lower density causes it to rise to the top of the reservoir, thereby leaving a large unswept reservoir section.
The mobility ratio, which controls the volumetric sweep, is typically highly unfavorable in gas floods due to the relatively low viscosity of the injected gas. This makes flood profile control the biggest concern for horizontal gas floods.
The Water-Alternating-Gas (WAG) process, proposed in 1958 by Caudle and Dyes15, has remained the most widely practiced profile control method in the oil field today. The WAG process was aimed at improving gas flood conformance by simultaneous employment of the natural counteracting tendencies of gas to rise and water to descend. The combinations of higher microscopic displacement efficiency of gas with the better
macroscopic (volumetric) sweep efficiency of water help increase the incremental oil recovery over gas injection alone.
WAG Process Applications Two WAG surveys have been reported in the literature that studied the WAG applications and distribution scenarios in the world. The initial survey by Hadlow12 in 1992 reported an ultimate incremental tertiary recovery of about 8–14% OOIP, based on simulation and pilot tests; however, the more recent survey by Christensen et al.10, encompassing 59 field applications of WAG process showed that the actual incremental recovery was between 5 and 10% OOIP with severe operational and production problems.
Further scrutiny of the WAG surveys10,12 showed that the U.S. had the largest share of WAG applications (63%), followed by Canada at 15%. The process was seen mostly applied to onshore reservoirs (88%), and applicable to a wide range of reservoir types, from chalk to fine sandstone. The popularity of the miscible flood was evident from the fact that 79% of the WAG projects employed are miscible. The CO2 floods lead the WAG applications with a share of 47% of total projects, closely followed by hydrocarbon gas at 42%. These distributions are graphically depicted as Figure 5.
WAG Process: Success or Failure? Inspite of its conceptual soundness and popularity, the WAG process has not lived up to its expectations, with limited incremental tertiary recoveries in the range of about 5–10% OOIP10. If the injected gas and water slugs flowed as separate slugs, significantly higher oil recoveries would be obtained due to excellent volumetric sweep efficiencies. It is suggested that the lower oil recoveries, as observed from WAG field experiences10,12, are attributable to the severe gravity segregation due to the natural tendency of the injected gas to override and of the water to under-ride9.
Although, significant research efforts for increasing tertiary recoveries from WAG floods have provided with better understanding of the injectivity limitation(s) and WAG ratio optimization(s)10, they have had limited success in terms of incremental tertiary recoveries. Other research efforts such as gas thickeners16, with gas-soluble chemicals17, and injectant slug modifications11 targeted at specific formation types have been proposed. Although these methods appear promising on a laboratory and simulator scales, important issues such as feasibility, cost, general applicability, safety and environmental impact still need to be addressed11. Furthermore, most of these process modifications are still at inception or experimental stage and are not accepted as part of the current commercial technology.
All these methods are still aimed at overcoming the natural phenomenon of gravity segregation and constitute an ‘attempt’ to improve the flood profile11. Additionally,
WAG injection results in increased mobile water saturation in the reservoir leading to lower oil relative permeabilities, greater water shielding effects and lower gas injectivity in the reservoir. Hence, the reason that the WAG process has remained the default gas injection process appears to be due to the absence of a viable alternative. Consequently the full utilization of EOR potential in the U.S. requires the development of new and more efficient gas injection processes that overcome the limitations of the WAG process.
Is there a Viable Alternative to WAG? Literature reviews7 on various modes of gas injection suggests that there are six major modes of gas injection: (i) Continuous Gas Injection (CGI), (ii) Water Alternating Gas (WAG) process, (iii) Hybrid WAG, (iv) Variants of WAG process such as Simultaneous WAG (SWAG), and Foam Assisted WAG (FAWAG), (v) Crestal Gas Injection and (vi) Gravity stable (gravity drainage) gas injection projects in dipping reservoirs and pinnacle reefs. Of the various modes of gas injection, only the last two are designed to work in tandem with nature. Because of this, incremental oil recoveries in the range of 15 - 40% OOIP have been reported in the gravity-stable vertical gas floods conducted in pinnacle reefs of Alberta9.Hence further scrutiny of this promising mode of gas injection is justified.
Gravity Stable Gas Injection Unlike the WAG process, up-dip gas injection into dipping or a reef type reservoir is one of the most efficient oil recovery methods in both secondary as well as tertiary modes. Corefloods and field investigations confirm that a large amount of incremental oil can be recovered using gravity assisted tertiary gas injection. Recoveries as high as 85 – 95% OOIP have been reported in field tests and nearly 100% recovery efficiencies have been observed in laboratory floods. The field reviews indicate the benefits of working with nature by use of buoyancy rise of injected gas to displace oil downwards9. These results show that gravity stable gas injection could very well be an effective alternative to the current WAG process used in horizontal gas injection projects.
However, these gravity stable (gravity drainage) injections have been applied to highly dipping and reef type reservoirs only. The recently proposed9,18 Gas Assisted Gravity Drainage (GAGD) process technology is an attempt to widen the applicability of the gravity stable gas injection concept to various types of reservoirs.
Gravity Drainage Field Reviews Extensive literature review with a focus on the displacement characteristics (such as instabilities and critical rates), laboratory studies and field applications for gravity drainage has been completed19 and summarized here.
Summary of Laboratory and Theoretical Studies Displacement instabilities in gravity drainage are a function of rock-fluid properties, fluid saturation distributions, the viscous forces relative to gravity forces, and rock-fluid interaction parameters such as wettability, spreading and adhesion. Fluid cross flow and mixing of the miscible slug and chase gas results in displacement instabilities consequently reducing the displacement efficiency. Also the oil relative permeability effects and film flow are critical for stable displacements and higher recoveries.
Another important parameter determining the stability of the growing interface and preventing coning and cresting is the critical gas injection rate. Injection rates above the critical results in ‘short-circuiting’ of the injected gas to the production well drastically reducing sweep and recovery. Modeling studies have shown that shorter well spacing aids the displacement front stability. Both the displacement instabilities and critical injection rates are important for flood profile control and need to be experimentally evaluated using 3D physical models.
Miscibility between the injected gas and crude oil helps the reduction of viscous displacement instabilities by reducing the fingering. Furthermore miscibility development lengths are shorter in gravity-assisted floods than horizontal floods helping better gas-oil contacts in the reservoir.
Significantly high oil recoveries in gravity drainage reservoirs are possible when oil spreads on water (under positive spreading coefficient conditions). Micromodel studies show that positive spreading coefficients are obtainable under strongly water-wet conditions, where continuous oil films over water occur in gas swept zones.
Vertical coreflood displacement studies suggest the use of CO2 over hydrocarbon gases due to the higher recovery efficiency, and injectivity characteristics of CO2. Field Applications Summary The field applications reviewed are summarizes as Table 1. The field reviews show that gravity drainage concept is applicable to all reservoir types and reservoir characteristics using common injectant gases in both secondary as well as tertiary recovery modes. Gravity drainage is seen ‘best applicable’ to low connate water, thick, highly dipping or reef type, light oil reservoirs with moderate to high vertical permeability and low re-pressurization requirements. Field applications show ultimate oil recoveries as high as 85 – 95% OOIP with calculated average incremental recoveries for the fields studied in this review being 18.03% OOIP for tertiary floods and 82.33% OOIP for secondary floods.
Comparison of Gravity Drainage with WAG Process The main concerns of gravity drainage processes appear to be the possible low oil production rates and susceptibility of the process to reservoir heterogeneity, especially vertical fractures. To further investigate these concerns, eight commercial WAG projects
and nine gravity drainage projects with widely varying reservoir and fluid characteristics were evaluated. A comparison parameter ‘Enhanced Production’ defined as enhanced volume of oil production per day per unit project area was used to aid the evaluation. The ranges of this parameter are included as Table 2. The results clearly demonstrate that the gravity drainage project performances are similar to, and sometimes even excel that of the WAG process.
The literature review shows that gravity drainage process has been successfully applied inhomogeneous sandstones as well as highly fractured carbonate and dolomite reservoirs. Hence, although the critical evaluation of the effects of heterogeneity on gravity drainage effects is yet to be conducted, although preliminary studies suggest that the adverse heterogeneity effects appear to be somewhat lower in gravity drainage processes than in the horizontal WAG floods.
The Gas Assisted Gravity Drainage (GAGD) Process The concept of GAGD is schematically shown in Figure 6. It consists of placing a horizontal producer at the bottom of the pay zone and injecting gas through existing vertical wells to provide gravity stable displacements and uniform reservoir sweep.
CO2 injected in the vertical wells, accumulates at the top of the pay-zone due to gravity segregation and displaces oil, which drains to the horizontal producer straddling several injection wells. As injection continues, the CO2 chamber grows downward and sideways resulting in larger and larger portions of the reservoir being swept by it without any increase in water saturation in the reservoir. This maximizes the volumetric sweep efficiency. The gravity segregation of CO2 also helps in delaying, or even eliminating, CO2 breakthrough to the producer as well as preventing the gas phase from competing for flow with the oil. Within the CO2 filled chamber, the oil displacement efficiency could be maximized by keeping the pressure above the minimum miscibility pressure (MMP). This helps in achieving low interfacial tension between the oil and the injected CO2, which in turn results in large capillary numbers and low residual oil saturations in the CO2 filled region.
If the formation is water-wet, water is likely to be held back in the rock pores by surface forces while oil will be preferentially displaced by CO2. If the formation is oil-wet, the continuous films of oil will help create drainage paths for the oil to drain to the horizontal producer. Thus the proposed GAGD process appears capable of not only eliminating the two main problems (poor sweep and water-shielding) of the conventional WAG processes, but also offers additional advantages of increased oil saturation and consequently improved oil relative permeability near the producing well-bore, and the lack of competing gas flow.
The process makes use of the existing vertical wells in the field for CO2 injection and calls for drilling a long horizontal well for producing the draining oil. The drilling costs
of horizontal wells have been significantly reduced in recent years due to advancements in drilling technology. In summary, the proposed GAGD process offers significant potential for increasing not only ultimate oil recovery but also the rates of recovery compared to that achievable by the conventional WAG process.
Experimental Verification of Tertiary Gas Injection EOR Modes Since WAG process is currently the dominant gas injection method, its experimental evaluation and performance assessment against the new GAGD process, is critical. Coreflood experiments at reservoir conditions have been conducted in tertiary recovery mode by employing three modes of injection, namely continuous gas injection (CGI), water alternating gas (WAG) and gas assisted gravity drainage (GAGD).
Coreflood experiments have been conducted with the objective of evaluating the effects of (i) mode of gas injection, and (ii) miscibility development on gas-oil displacements in Berea sandstone cores, n-Decane and 5% NaCl brine as synthetic fluids as well as reservoir fluids from the Yates reservoir in West Texas.
Miscible floods were conducted at 2500 psi and the immiscible floods at 500 psi, using Berea cores, n-Decane and two different brines, namely the commonly used 5% NaCl solution and the multi-component reservoir brine from the Yates reservoir. Each of the corefloods consisted of a series of steps including brine saturation, absolute permeability determination, flooding with oil to initial oil saturation, end-point oil permeability determination, flooding with brine to residual oil saturation, end-point water permeability determination, and finally, tertiary gas injection to recover the waterflood residual oil. Details of the experimental protocol and apparatus are provided elsewhere20.
A common comparison parameter was required for the fair and consistent performance evaluation of the various tertiary gas injection mode corefloods. Hence, a parameter, ‘Tertiary Recovery Factor’ (TRF), defined as the oil recovery per unit volume of gas injection (Equation 1) was used along with conventional recovery plots.
InjectedPVofCOCumccsidualOilWFccoducedOilTRF
2.)](Re/[)](Pr[= ………………………...………...…(1)
Effect of Gas Injection (Tertiary) Mode Seven coreflood experiments, three immiscible and four miscible, were conducted in four different modes of gas injection, namely CGI, WAG, hybrid-WAG (combination of CGI and WAG), and GAGD using Berea cores, n-Decane, CO2 and two different brines.
Our previous research21 has demonstrated that in order to optimize the gas injection process performance, a combination of CGI and WAG processes, called ‘Hybrid-WAG’ needs to be employed. Hence, the performance evaluation of Hybrid-WAG mode of gas injection with GAGD was also critical along with the conventional CGI and WAG
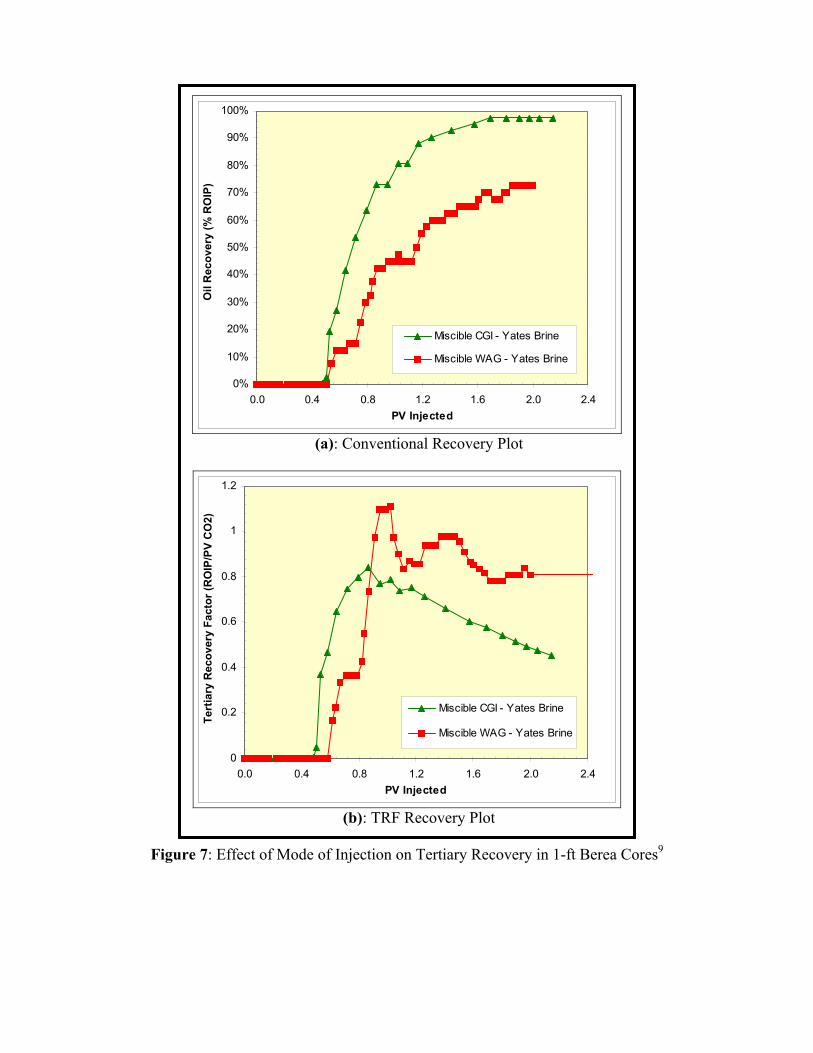
processes. CGI and WAG experiments on 1-ft Berea core did not yield appreciable differences in performance under immiscible mode of injection, hence miscible CGI, WAG, Hybrid-WAG and GAGD corefloods were conducted on 1-ft Berea core using n-Decane, Yates reservoir brine and CO2. CGI Versus WAG9 Figure 7 shows the comparison of miscible CGI and WAG performance for n-Decane and Yates reservoir brine. Figure 7 (a) is the conventional oil recovery plot (as % ROIP), which suggests that the CGI flood is better in performance than the WAG flood. These conclusions are somewhat misleading since the amount of CO2 injected in WAG floods is only half of that in CGI. Figure 7 (b) plots the same data on the TRF basis, which shows that the TRF value for the CGI flood decreases significantly in later stages of the flood, while the WAG employment arrests this decline. However, WAG floods lagged behind CGI floods in terms of production rate.
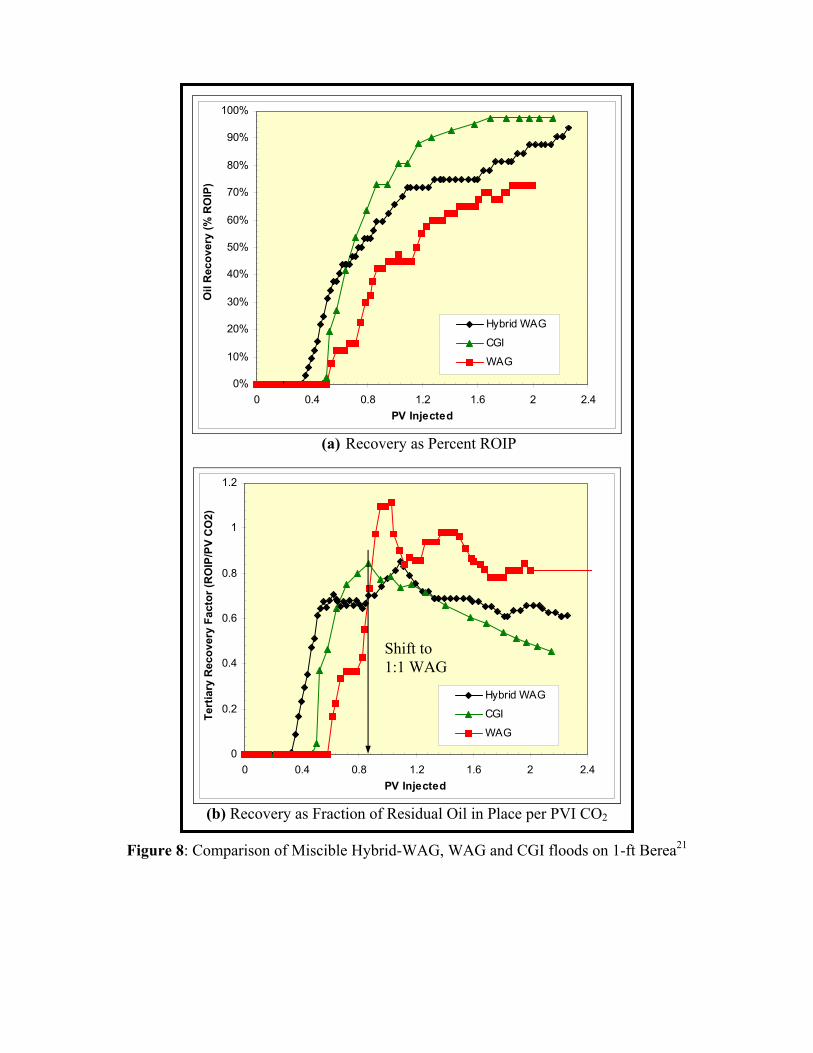
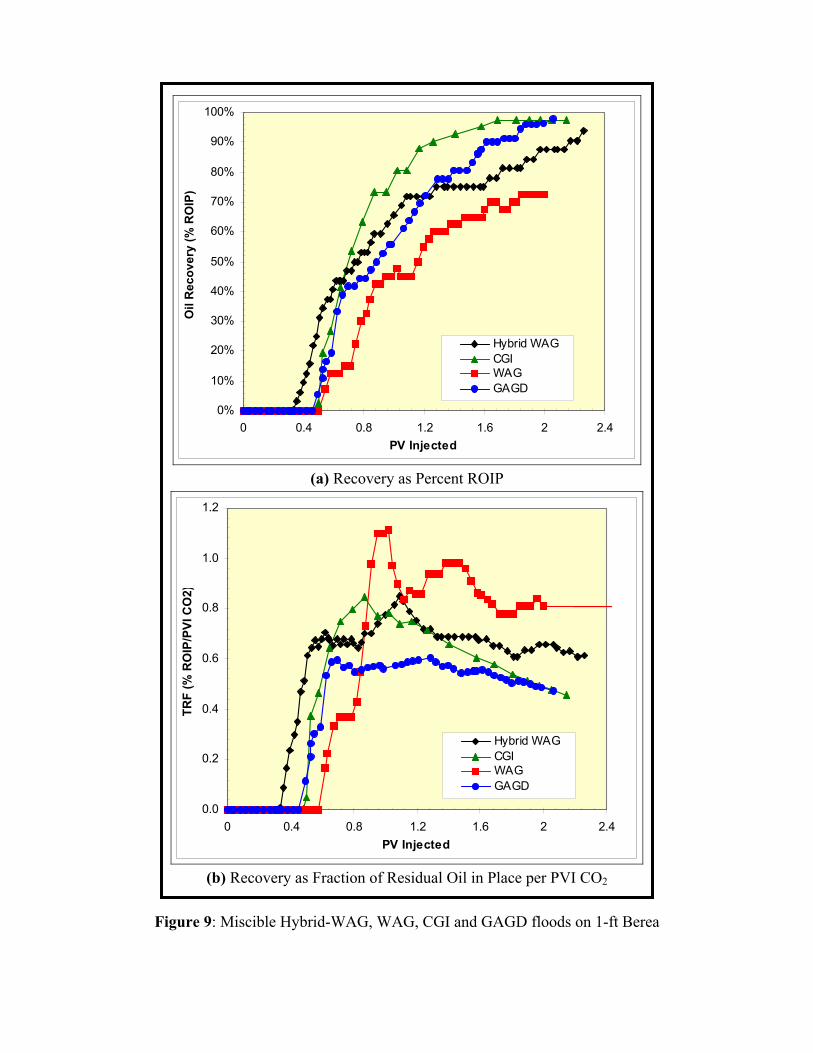
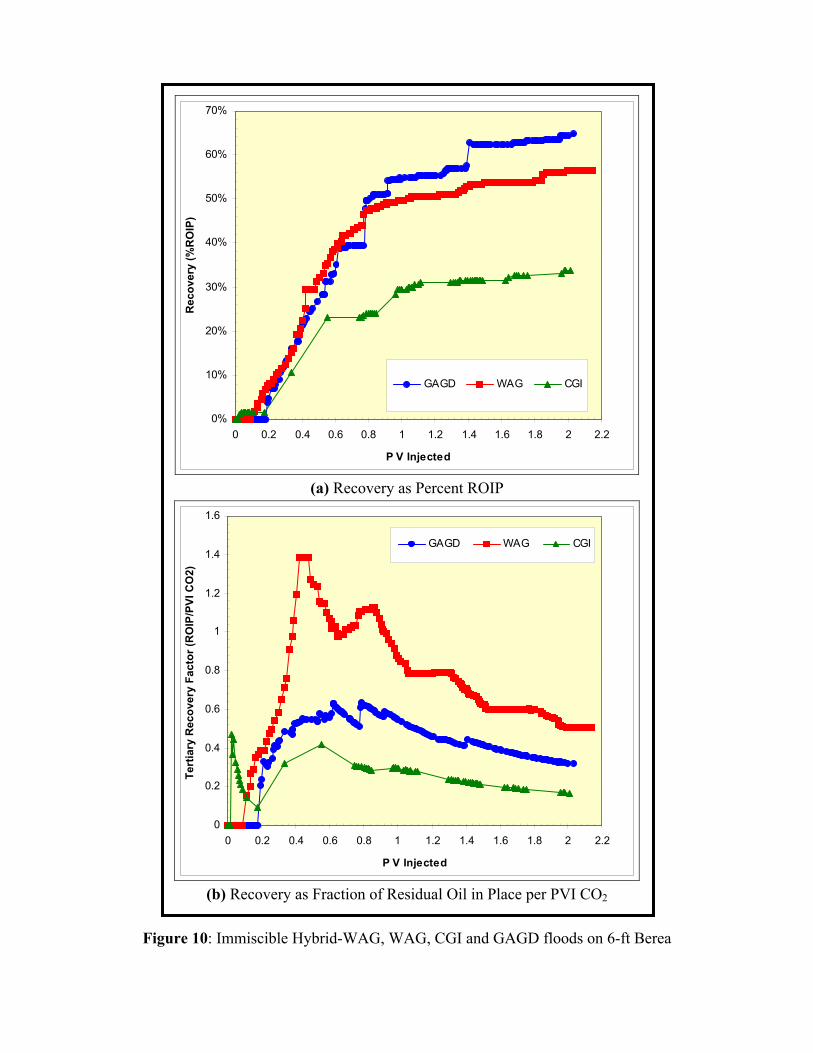
It is interesting to note in Figure 7 (b), that the WAG floods demonstrated periodic increases corresponding to gas injection cycles in the TRF throughout the life of the flood, while, for CGI miscible flood, TRF crested at ~ 0.7 PV injection and later declined with increasing gas injection. These plots clearly demonstrate that the WAG process, due to better mobility control, had better CO2 utilization efficiency compared to CGI. Similar TRF trends were also observed when 5% NaCl brine was used. These results indicated that optimum performance could be obtained by a combination of CGI and WAG modes of gas injection, called ‘Hybrid-WAG’ discussed below. Hybrid-WAG21 The miscible ‘Hybrid-WAG’ experiment was conducted using Yates reservoir brine, n-Decane and CO2. Figure 8(a) shows the conventional oil recovery (as % ROIP) plot for miscible CGI, WAG and Hybrid-WAG floods. As expected, the Hybrid-WAG injection clearly out performed both the CGI and WAG floods from an oil recovery point of view. These data indicate that the optimum mode of injection is a ‘combination’ of CGI and WAG floods. However, from a TRF point of view, from Figure 8(b), the WAG process appears to be still the optimum mode of injection for maximum CO2 utilization. Further discussion on this issue is included in the following sub-section on performance comparisons of tertiary modes of gas injection. Performance Comparisons of Tertiary CGI, WAG, Hybrid WAG and GAGD Four miscible coreflood experiments (Figure 9), namely CGI, WAG, hybrid-WAG, and GAGD were conducted using 1-ft Berea cores, n-Decane, CO2 and Yates reservoir brine. On the other hand, three immiscible coreflood experiments (Figure 10), namely CGI,
WAG, and GAGD were conducted using 6-ft Berea cores, n-Decane, CO2 and 5% NaCl brine to evaluate the effect of miscibility development on various modes of gas injection.
Figures 9 and 10 demonstrate that the GAGD mode of injection outperforms all other modes of gas injection in both miscible as well as immiscible floods. Figure 9 shows that the GAGD process has the maximum recovery efficiency (97. 8%) followed by CGI (97.6%), Hybrid-WAG (93.8%) and finally WAG (72.5%). Figure 10 shows that the GAGD process has the highest recovery efficiency compared to WAG and CGI. The GAGD process produces nearly 8.6% higher tertiary oil than WAG and 31.3% over CGI even in the immiscible mode.
It is important to note here that all the steps, namely primary oil injection, secondary waterflood and the tertiary gas injection, in the GAGD flood were gravity stable. Inspite of the higher oil recoveries from gravity stable secondary waterflood, the GAGD flood was able to recover the maximum tertiary oil. Coreflood experiments to mimic the real reservoir GAGD application, wherein the secondary waterflood is not gravity stable are being planned for the future.
However, from a TRF point of view, from Figures 9(b) and 10(b), the WAG process appears to be still the ‘best’ mode of injection for maximum CO2 utilization. The incremental benefits of using CGI or Hybrid-WAG or GAGD, such as no free water injection, increased water relative permeability, decreased water shielding effects and decreased gas injectivity are not apparent from the TRF plot. Hence for improved evaluations of the various gas injection modes, concurrent studies on the operative mechanistic and fluid dynamic parameters, which are best expressed in terms of dimensionless numbers, along with the TRF plots become important.
Effect of Miscibility Development Comparison of Figures 9 and 10 shows that the GAGD process has good recovery efficiency even under immiscible mode of injection. The immiscible GAGD flood recovered 64.7% of the tertiary oil, while the miscible GAGD had a near perfect recovery. It is important to note that the injection pressures for miscible flood are five-times those for immiscible floods. However, the 33% increment in oil recovery justifies the cost of compression, safety and high-pressure equipment requirements for miscible flood. Literature review19 on immiscible field gravity drainage applications namely, Louisiana’s West Hackberry field, Weeks Island S RB Pilot, Bay St. Elaine field, Hawkins Dexter Sand, Texas, and Handil Main Zone, Indonesia, demonstrate that immiscible gas gravity drainage is successful and the average incremental oil produced from these fields is about 78% (Table 1) which is only slightly lower than the incremental oil produced from miscible field applications (about 80.5% - Table 1). Therefore, the preliminary results indicate that, miscibility development may not be as important in gas assisted gravity drainage applications as in WAG projects.
Conclusions 1) The performance of the widely accepted WAG process appears to have fallen
short of its expectations and it has remained a default process mainly because of the absence of a viable alternative.
2) The gas assisted gravity drainage (GAGD) process recovered 82.33% in secondary mode and 18.33% of oil in tertiary mode.
3) GAGD appears to be an effective alternative to the WAG process. 4) GAGD performing well in the miscible and immiscible modes, makes it
applicable to even depleted and shallow pools.
Acknowledgements This paper was prepared with the support of the U.S. Department of Energy under Award No. DE-FC26-02NT-15323. Any opinions, findings, conclusions or recommendations expressed herein are those of authors and do not necessarily reflect the views of the DOE. The financial support of this project by the U.S Department of Energy is gratefully acknowledged. The authors also thank Dr. Jerry Casteel of NPTO/DOE for his constant support and encouragement. The authors would like to thank Mr. Amit Sharma as well as Mr. Ayodeji Abe of Louisiana State University for manuscript help.
References [01] Office of Technology Assessment, “Enhanced Oil Recovery Potential in the United States” Congress
of the United States, NTIS Order # PB-276594, 1978, 12 Volumes.
[02] Nummedal, D., Towler, B., Mason, C., and Allen, M., “Enhanced Oil Recovery in Wyoming:
Prospects and Challenges”, Prepared for Governor Dave Freudenthal, University of Wyoming,
June 15, 2003.
[03] Statement of Mark Maddox, Acting Assistant Secretary for Fossil Energy to the Subcommittee on
Energy Policy, Natural Resources and Regulatory Affairs, Committee of Government Reform,
U.S. House of Representatives, July 7, 2004.
[04] U.S. Geological Survey, United States Department of the Interior, USGS Fact Sheet FS – 115 – 00,
October 2000.
[05] “Crude Oil Supply and Disposition, 1988 - present”, Table S2, Petroleum Supply Monthly, U.S.
Energy Information Administration, U.S. Department of Energy, Washington D.C., July 2004.
[06] Moritis, G., “ Special Report: EOR Survey”, Oil and Gas Journal, Volume 102.14, Apr 12, 2004.
[07] Kulkarni, M. M., “Multiphase Mechanisms and Fluid Dynamics in Gas Injection Enhanced Oil
Recovery Processes”, PhD General Examination Progress Report, The Craft & Hawkins
Department of Petroleum Engineering, Louisiana State University, Baton Rouge, LA.
[08] Platt’s Oil Guide to Specifications, “Crude Oil Specifications – United States”, Energy Market
Information Resource, Standard & Poor’s Platt’s, Official Website.
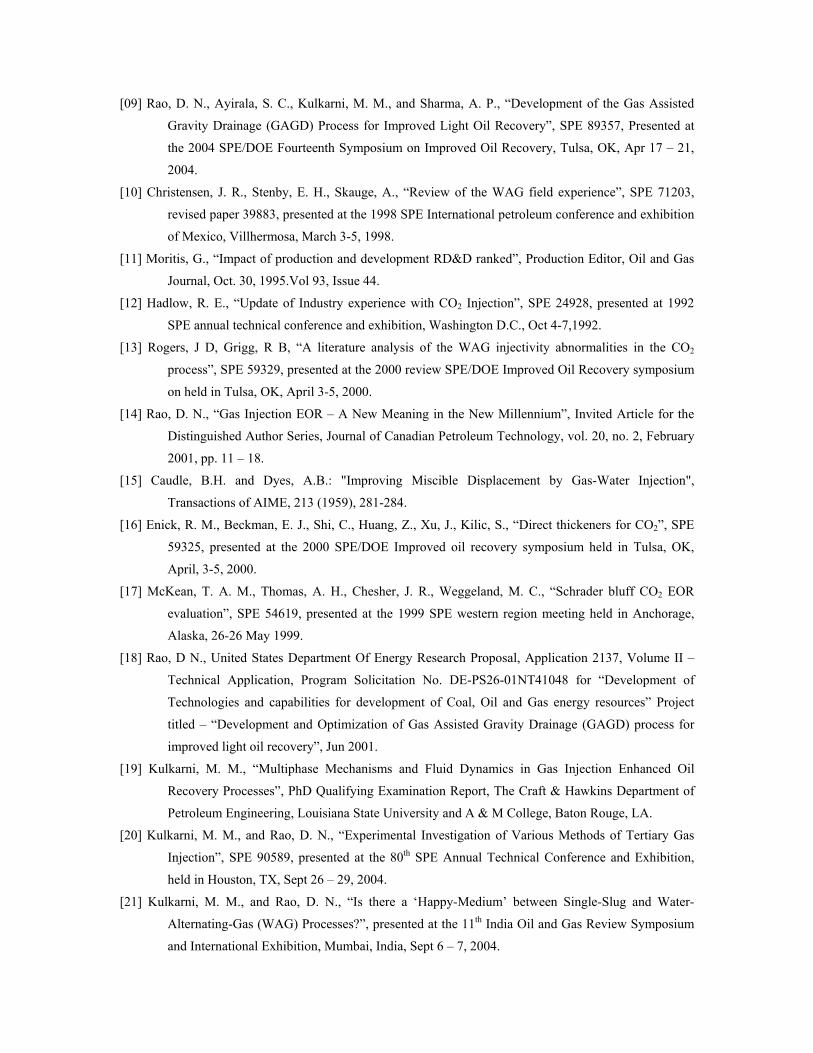
[09] Rao, D. N., Ayirala, S. C., Kulkarni, M. M., and Sharma, A. P., “Development of the Gas Assisted
Gravity Drainage (GAGD) Process for Improved Light Oil Recovery”, SPE 89357, Presented at
the 2004 SPE/DOE Fourteenth Symposium on Improved Oil Recovery, Tulsa, OK, Apr 17 – 21,
2004.
[10] Christensen, J. R., Stenby, E. H., Skauge, A., “Review of the WAG field experience”, SPE 71203,
revised paper 39883, presented at the 1998 SPE International petroleum conference and exhibition
of Mexico, Villhermosa, March 3-5, 1998.
[11] Moritis, G., “Impact of production and development RD&D ranked”, Production Editor, Oil and Gas
Journal, Oct. 30, 1995.Vol 93, Issue 44.
[12] Hadlow, R. E., “Update of Industry experience with CO2 Injection”, SPE 24928, presented at 1992
SPE annual technical conference and exhibition, Washington D.C., Oct 4-7,1992.
[13] Rogers, J D, Grigg, R B, “A literature analysis of the WAG injectivity abnormalities in the CO2
process”, SPE 59329, presented at the 2000 review SPE/DOE Improved Oil Recovery symposium
on held in Tulsa, OK, April 3-5, 2000.
[14] Rao, D. N., “Gas Injection EOR – A New Meaning in the New Millennium”, Invited Article for the
Distinguished Author Series, Journal of Canadian Petroleum Technology, vol. 20, no. 2, February
2001, pp. 11 – 18.
[15] Caudle, B.H. and Dyes, A.B.: "Improving Miscible Displacement by Gas-Water Injection",
Transactions of AIME, 213 (1959), 281-284.
[16] Enick, R. M., Beckman, E. J., Shi, C., Huang, Z., Xu, J., Kilic, S., “Direct thickeners for CO2”, SPE
59325, presented at the 2000 SPE/DOE Improved oil recovery symposium held in Tulsa, OK,
April, 3-5, 2000.
[17] McKean, T. A. M., Thomas, A. H., Chesher, J. R., Weggeland, M. C., “Schrader bluff CO2 EOR
evaluation”, SPE 54619, presented at the 1999 SPE western region meeting held in Anchorage,
Alaska, 26-26 May 1999.
[18] Rao, D N., United States Department Of Energy Research Proposal, Application 2137, Volume II –
Technical Application, Program Solicitation No. DE-PS26-01NT41048 for “Development of
Technologies and capabilities for development of Coal, Oil and Gas energy resources” Project
titled – “Development and Optimization of Gas Assisted Gravity Drainage (GAGD) process for
improved light oil recovery”, Jun 2001.
[19] Kulkarni, M. M., “Multiphase Mechanisms and Fluid Dynamics in Gas Injection Enhanced Oil
Recovery Processes”, PhD Qualifying Examination Report, The Craft & Hawkins Department of
Petroleum Engineering, Louisiana State University and A & M College, Baton Rouge, LA.
[20] Kulkarni, M. M., and Rao, D. N., “Experimental Investigation of Various Methods of Tertiary Gas
Injection”, SPE 90589, presented at the 80th SPE Annual Technical Conference and Exhibition,
held in Houston, TX, Sept 26 – 29, 2004.
[21] Kulkarni, M. M., and Rao, D. N., “Is there a ‘Happy-Medium’ between Single-Slug and Water-
Alternating-Gas (WAG) Processes?”, presented at the 11th India Oil and Gas Review Symposium
and International Exhibition, Mumbai, India, Sept 6 – 7, 2004.
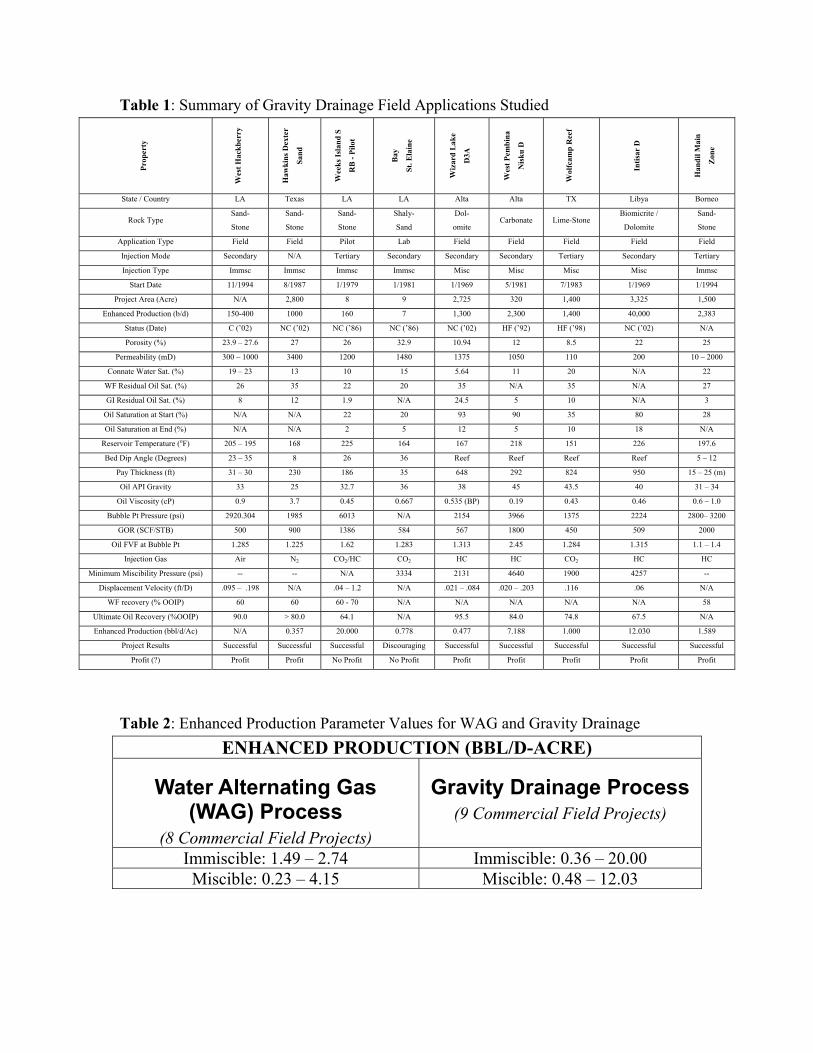
Table 1: Summary of Gravity Drainage Field Applications Studied
Prop
erty
Wes
t Hac
kber
ry
Haw
kins
Dex
ter
Sand
Wee
ks Is
land
S
RB
- Pi
lot
Bay
St. E
lain
e
Wiz
ard
Lak
e
D3A
Wes
t Pem
bina
Nis
ku D
Wol
fcam
p R
eef
Intis
ar D
Han
dil M
ain
Zon
e
State / Country LA Texas LA LA Alta Alta TX Libya Borneo
Rock Type Sand-
Stone
Sand-
Stone
Sand-
Stone
Shaly-
Sand
Dol-
omite Carbonate Lime-Stone
Biomicrite /
Dolomite
Sand-
Stone
Application Type Field Field Pilot Lab Field Field Field Field Field
Injection Mode Secondary N/A Tertiary Secondary Secondary Secondary Tertiary Secondary Tertiary
Injection Type Immsc Immsc Immsc Immsc Misc Misc Misc Misc Immsc
Start Date 11/1994 8/1987 1/1979 1/1981 1/1969 5/1981 7/1983 1/1969 1/1994
Project Area (Acre) N/A 2,800 8 9 2,725 320 1,400 3,325 1,500
Enhanced Production (b/d) 150-400 1000 160 7 1,300 2,300 1,400 40,000 2,383
Status (Date) C (’02) NC (’02) NC (’86) NC (’86) NC (’02) HF (’92) HF (’98) NC (’02) N/A
Porosity (%) 23.9 – 27.6 27 26 32.9 10.94 12 8.5 22 25
Permeability (mD) 300 – 1000 3400 1200 1480 1375 1050 110 200 10 – 2000
Connate Water Sat. (%) 19 – 23 13 10 15 5.64 11 20 N/A 22
WF Residual Oil Sat. (%) 26 35 22 20 35 N/A 35 N/A 27
GI Residual Oil Sat. (%) 8 12 1.9 N/A 24.5 5 10 N/A 3
Oil Saturation at Start (%) N/A N/A 22 20 93 90 35 80 28
Oil Saturation at End (%) N/A N/A 2 5 12 5 10 18 N/A
Reservoir Temperature (oF) 205 – 195 168 225 164 167 218 151 226 197.6
Bed Dip Angle (Degrees) 23 – 35 8 26 36 Reef Reef Reef Reef 5 – 12
Pay Thickness (ft) 31 – 30 230 186 35 648 292 824 950 15 – 25 (m)
Oil API Gravity 33 25 32.7 36 38 45 43.5 40 31 – 34
Oil Viscosity (cP) 0.9 3.7 0.45 0.667 0.535 (BP) 0.19 0.43 0.46 0.6 – 1.0
Bubble Pt Pressure (psi) 2920.304 1985 6013 N/A 2154 3966 1375 2224 2800– 3200
GOR (SCF/STB) 500 900 1386 584 567 1800 450 509 2000
Oil FVF at Bubble Pt 1.285 1.225 1.62 1.283 1.313 2.45 1.284 1.315 1.1 – 1.4
Injection Gas Air N2 CO2/HC CO2 HC HC CO2 HC HC
Minimum Miscibility Pressure (psi) -- -- N/A 3334 2131 4640 1900 4257 --
Displacement Velocity (ft/D) .095 – .198 N/A .04 – 1.2 N/A .021 – .084 .020 – .203 .116 .06 N/A
WF recovery (% OOIP) 60 60 60 - 70 N/A N/A N/A N/A N/A 58
Ultimate Oil Recovery (%OOIP) 90.0 > 80.0 64.1 N/A 95.5 84.0 74.8 67.5 N/A
Enhanced Production (bbl/d/Ac) N/A 0.357 20.000 0.778 0.477 7.188 1.000 12.030 1.589
Project Results Successful Successful Successful Discouraging Successful Successful Successful Successful Successful
Profit (?) Profit Profit No Profit No Profit Profit Profit Profit Profit Profit
Table 2: Enhanced Production Parameter Values for WAG and Gravity Drainage
ENHANCED PRODUCTION (BBL/D-ACRE)
Water Alternating Gas (WAG) Process
(8 Commercial Field Projects)
Gravity Drainage Process(9 Commercial Field Projects)
Immiscible: 1.49 – 2.74 Immiscible: 0.36 – 20.00 Miscible: 0.23 – 4.15 Miscible: 0.48 – 12.03
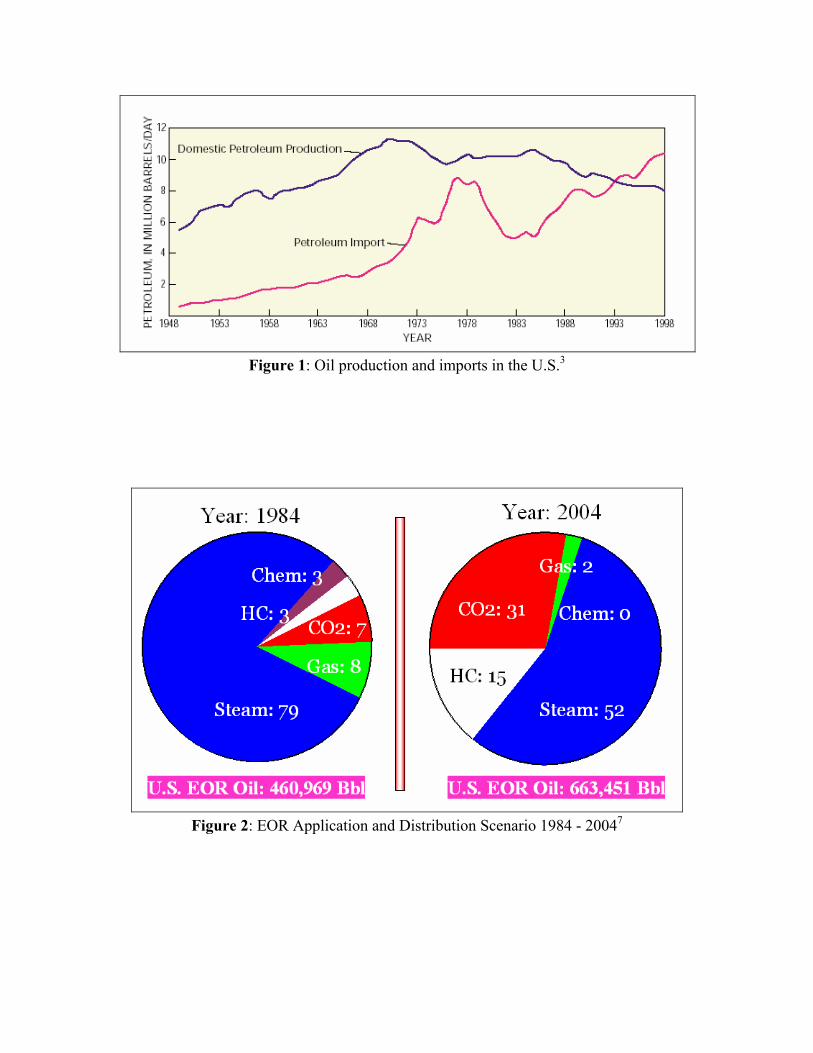
Figure 1: Oil production and imports in the U.S.3
Figure 2: EOR Application and Distribution Scenario 1984 - 20047
Gas 17%
Thermal69%
Chemical14%
Chemical31%
Thermal51%
Gas 18%
Chemical13%
Thermal49%
Gas 38%
chemical0%
thermal52%
gas48%
Figure 3: EOR project distribution changes over 3 decades.
Figure 4: Network of CO2 Pipelines (From Kinder Morgan CO2 Co. Website)
1971
2004 1992
1982
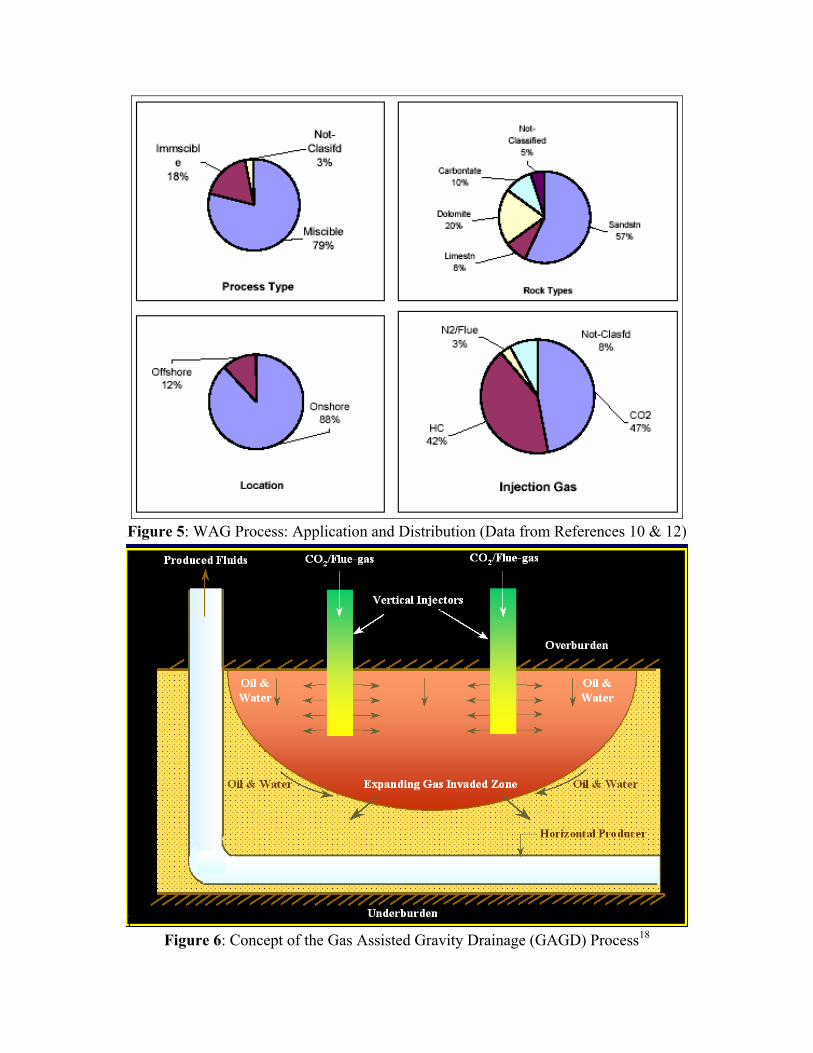
Figure 5: WAG Process: Application and Distribution (Data from References 10 & 12)
Figure 6: Concept of the Gas Assisted Gravity Drainage (GAGD) Process18
0%
10%
20%
30%
40%
50%
60%
70%
80%
90%
100%
0.0 0.4 0.8 1.2 1.6 2.0 2.4PV Injected
Oil
Rec
over
y (%
RO
IP)
Miscible CGI - Yates Brine
Miscible WAG - Yates Brine
(a): Conventional Recovery Plot
0
0.2
0.4
0.6
0.8
1
1.2
0.0 0.4 0.8 1.2 1.6 2.0 2.4PV Injected
Tert
iary
Rec
over
y Fa
ctor
(RO
IP/P
V C
O2)
Miscible CGI - Yates Brine
Miscible WAG - Yates Brine
(b): TRF Recovery Plot
Figure 7: Effect of Mode of Injection on Tertiary Recovery in 1-ft Berea Cores9
0%
10%
20%
30%
40%
50%
60%
70%
80%
90%
100%
0 0.4 0.8 1.2 1.6 2 2.4PV Injected
Oil
Rec
over
y (%
RO
IP)
Hybrid WAG
CGI
WAG
(a) Recovery as Percent ROIP
0
0.2
0.4
0.6
0.8
1
1.2
0 0.4 0.8 1.2 1.6 2 2.4PV Injected
Tert
iary
Rec
over
y Fa
ctor
(RO
IP/P
V C
O2)
Hybrid WAG
CGI
WAG
(b) Recovery as Fraction of Residual Oil in Place per PVI CO2
Figure 8: Comparison of Miscible Hybrid-WAG, WAG and CGI floods on 1-ft Berea21
Shift to 1:1 WAG
0%
10%
20%
30%
40%
50%
60%
70%
80%
90%
100%
0 0.4 0.8 1.2 1.6 2 2.4PV Injected
Oil
Rec
over
y (%
RO
IP)
Hybrid WAGCGIWAGGAGD
(a) Recovery as Percent ROIP
0.0
0.2
0.4
0.6
0.8
1.0
1.2
0 0.4 0.8 1.2 1.6 2 2.4PV Injected
TRF
(% R
OIP
/PVI
CO
2)
Hybrid WAGCGIWAGGAGD
(b) Recovery as Fraction of Residual Oil in Place per PVI CO2
Figure 9: Miscible Hybrid-WAG, WAG, CGI and GAGD floods on 1-ft Berea
0%
10%
20%
30%
40%
50%
60%
70%
0 0.2 0.4 0.6 0.8 1 1.2 1.4 1.6 1.8 2 2.2
P V Injected
Rec
over
y (%
RO
IP)
GAGD WAG CGI
(a) Recovery as Percent ROIP
0
0.2
0.4
0.6
0.8
1
1.2
1.4
1.6
0 0.2 0.4 0.6 0.8 1 1.2 1.4 1.6 1.8 2 2.2
P V Injected
Tert
iary
Rec
over
y Fa
ctor
(RO
IP/P
VI C
O2)
GAGD WAG CGI
(b) Recovery as Fraction of Residual Oil in Place per PVI CO2
Figure 10: Immiscible Hybrid-WAG, WAG, CGI and GAGD floods on 6-ft Berea