Embed Size (px)
Citation preview

Is food innovation profitable?A case study for yogurt and milk in Spain
Johanna Elena Trieb
August 2013 Summer School
Budapest, Hungary

FDI and Food Innovation In 2006, global food and drink industry (FDI) retail sales
> 2 trillion US$, representing one of largest industries in the world(Winger and Wall, 2006)
10-14% of total hh expenditure (high income) and 40-50% of total hh expenditure (low income) spent on food(Winger and Wall,
2006)
Growing world population, increase in urbanization, increasing environmental concerns, changes in lifestyle will require the FDI to keep up
Innovation is generally an important driver of economic growth, and in the FDI will continue to be important to ensure the sustainability of manufacturers and satisfaction of consumers

New product development
Currently, only 1% of the products found on shelves will be there in 5 years…(Winger and Wall, 2006)
Many types of new food products: new to the market, new to the company, new packaging, reformulating of existing products
In general: incremental (re-development of existing) vs radically novel

Functional food
Inte
stina
l Fun
ction
Cardio
vasc
ular
Imm
une
syst
em
Bone
Health
Nervo
us S
yste
m
Beaut
y
Oth
er05
101520253035404550
Percentage of Functional Claims in World Market
Source: adapted from Jago. 2009
“if together with the basic nutritional impact it has beneficial effects on one or more functions of the human organism thus either improving the general and physical conditions and/or decreasing the risk of the evolution of diseases” (EC)

46%
21%
6%
5%
5%
4%
4%3%
2%2% 2%
Food Classes with Functional Claims in World Market
Dairy Products
Alcohol-free beverages
Childrens Food
Others
Baked food
Snacks
Breakfast Cereals
Chewing Gum
Desserts and Ice Cream
Sauces and Dressings
Processed Fish, Meat, Eggs
Source: adapted from Giannetti et al. 2009
35%
32%
25%
8%
Share of Global Functional Foods Market (2003)
United States
Europe
Japan
Rest of World
Source: adapted from Kotilainen et al., 2006
The FF market
46% of FF are dairy products (Jago, 2009), brought 1.35 billion US$ in Europe in 1999 (Benkouider, 2005), mainly pro (lactobacillus/bifidus) and prebiotics
Probiotics = 5 mill to 419 mill US$ from 1995 to 2000 (5 years) in Germany alone (yogurt and milk) (Menrad, 2003)
Global FF market estimated revenue 33-48 billion US$ in 2003 (depending on definition) (Menrad, 2003)
European market was estimated between 8 and 15 billion US$ in 2003 and 2006, respectively (Menrad, 2003; Kotilainen et al. 2006)
Germany, France, UK, Netherlands

The cost of innovation Steps in NPD
develop strategy design and production commercialization & launch
BUT: high costs associated with NPD (technologies, investment in
R&D; scientific and market research), especially in case of FF Cost of development of new food 1-2 mill US$, Unilever invested over 50 milll
US$ to develop functional margarine Becel(Menrad, 2003)
high risks (Relatively high market failure rate, 25% of innovative food products fail)(Hoban, 1998)
Most important to prevent failure of the product = consumer acceptance

Objective of this study Analyze consumer demand of various
categories of innovative food products (ie conventional vs reduced fat vs functional) in Spain to study possible differences in purchasing behavior and ultimately determine potential profitability of food innovation

Procedure 1) Choose product(s) and categories 2) Find appropriate demand model to
calculate expenditure and price elasticities 3) Analyze influence of demographic variables
DiscussionResultsModelData
Source: own graphical depiction

Data Set Daily retail scanner data from a major
discount supermarket chain in Spain 4-month period (July 1, 2011 – October 31,
2011) Focus on Madrid and Barcelona, 17 stores
Customers according to Residence
% C
ust
om
ers
Data
Source:adapted from Cataño, 2013

Product Choice
25%
17%
31%
6%
5%
5% 6%
2%1% 2%
Milk Consumption
Unflavored Normal Whole Milk
Unflavored Normal Non-fat Milk
Unflavored Normal Low-fat (semi) Milk
Whole Milk Enriched (Calcium, Fiber, Energy, Bifidus, Omega3)
Non-fat Milk Enriched
Low-fat Milk Enriched
Whole Milk without Lactose
Non-fat Milk wo Lactose
Low-fat Milk wo Lactose
Flavored Milk&Drinks
Unflavored Normal Soja Milk
Unflavored Normal Low-fat (semi) Soja
Flavored Soja Milk
Soja Milk Enriched with Calcium
19%
5%
20%
4%7%
37%
7%
Butter/Margarine Consumption
Unsalted Butter
Salted Butter
Normal Margarine
Salted Margarine
Margarine Light
Enriched Margarine (Omega3, Vitamins, Proactive, Gourmet)
Olivespread-Margarine
37%
7%24%
14%
10%7%
Joghurt (&Drinks) Consumption
Normal Joghurt (Whole&Non-fat)
Joghurt Drinks
Bifidus Joghurt + Drinks (Whole&Non-fat)
Lactobacillus Joghurt + Drinks (Whole&Non-fat)
Greek Joghurt
Other (Mouse, Creams, Dessert Joghurt, Soja, Babies)
64%
2%
29%
2% 3%
Mayonnaise Consumption
Normal Mayonnaise
Mayonnaise with Olive Oil
Light Mayonnaise
Low-Sugar Mayonnaise
Other (with Mustard)
13%
44%
41%
2% 0,003%
Egg Consumption
Eggs XL
Eggs L
Eggs M
Freerange Eggs M
Eggs Enriched w Omega-3
51%
28%
21%
Breakfast Cereal Consumption
Sweetened Kids Breakfast Cereal (Sugar, Honey, Chocolate)
Unsweetened Breakfast Ce-reals
Fruit, Fiber, All-bran Break-fast Cereals
14%
46%
27%
1%
1%2%
10%
Canned Tuna Consumption
Canned Tuna in Water/Natural
Canned Tuna in Vegetable Oil
Canned Tuna in Olive Oil
Canned Tuna in Sauce
Canned Tuna in Water Low Salt
Canned Tuna in Olive Oil Low Salt
Other (Tuna Belly, Tuna-meatballs, pickled Tuna)
82%
5%
8%5%
Sugar/Sweetener Consumption
White SugarBrown SugarSweetener SolidSweetener Liquid
182404* 20493* 243724* 21975*
71021* 35940* 29022* 55588*
Source: own calculations*purchases
Data

Yogurt consumption
38%
26%
22%
14%
Total Yogurt Ex-penditure
Drinkable
Enriched
Whole-fat
Low-fat 1088(82%)
241(18%)
Gender Distri-bution
FemaleMale
2%
20%
44%
34%
Consumer Age Range
18-2526-4041-6061-95
Drinkable Enriched Low-fat Whole-fat
0
10
20
30
40
50
60
70
80
61.00
43.51
21.4133.59
13.42
7.74
4.92
8.33
Total Expenditure by Category (in 1000€)
Male
Female
Data
Source: own calculations

Fluid milk consumption
236(77%)
71(23%)
Gender Distribution
Female
Male
3%
21%
45%
31%
Consumer Age Range
18-25
26-40
41-60
61-92
Enriched Semi-skim Skim Whole
0
500
1000
1500
2000
2500
3000
3500
4000
27072346 2117
2887
939
878
683
729
Total Expenditure by Category
Male
Female
27%
24%21%
27%
Total Milk Expenditure
EnrichedSemi-skimSkimWhole
Data
Source: own calculations

Research Questions and Hypotheses RQ1: Are there differences in the price/expenditure
elasticities of demand between the various categories? H1: Low-fat more inelastic in demand than whole-fat; functional
food demand more inelastic than conventional; enriched and drinkable more expenditure elastic than conventional
RQ2: Are there potential differences between products? H2: Expect comparable changes in demand with changes in
price/expenditure for milk and yogurt.
RQ3: Do age and gender influence demand of innovative food products? H3: Age and gender play a role in demand of FF (since majority of
studies show for example that females and consumers over 60 years have increased demand in FF) (Urala and Lähteenmäki, 2007)
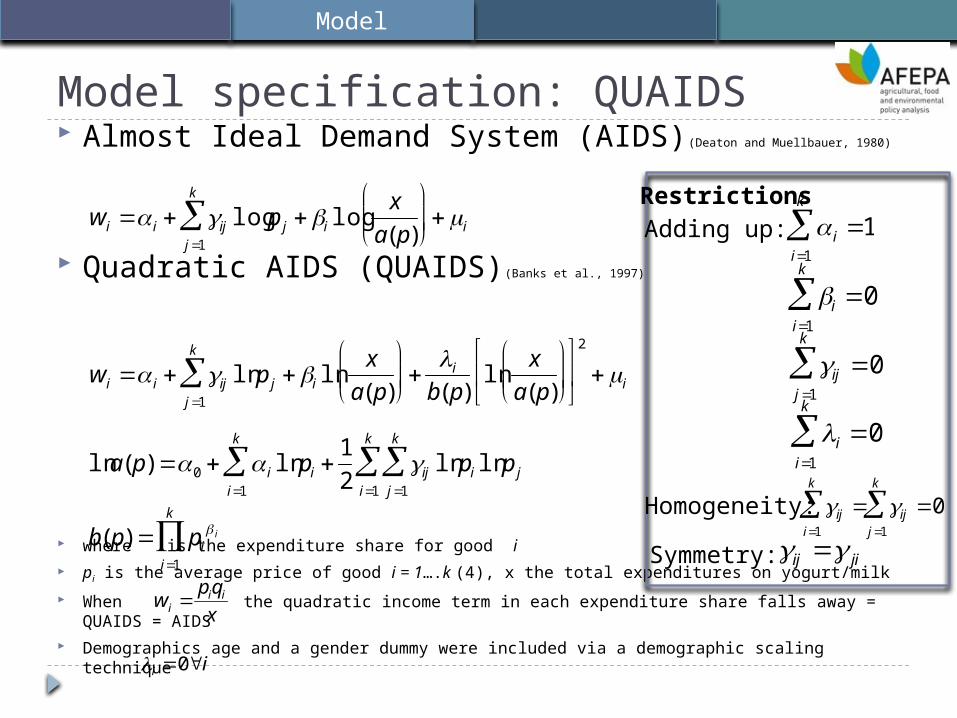
Model specification: QUAIDS Almost Ideal Demand System (AIDS)(Deaton and Muellbauer, 1980)
Quadratic AIDS (QUAIDS)(Banks et al., 1997)
where is the expenditure share for good i
pi is the average price of good i = 1….k (4), x the total expenditures on yogurt/milk
When the quadratic income term in each expenditure share falls away = QUAIDS = AIDS
Demographics age and a gender dummy were included via a demographic scaling technique
wi i ij log p j i logx
a( p)
j1
k
i
wi i ij ln p j i lnx
a( p)
j1
k
i
b( p)ln
x
a(p)
2
i
ln a(p) 0 i ln pi 1
2ij ln pi
j1
k
i1
k
i1
k
ln p j
b(p) pi i
i1
k
wi piqi
x
i 0i
RestrictionsAdding up:
Homogeneity:
Symmetry:
i 1i1
k
i 0i1
k
ij 0j1
k
i 0i1
k
ij i1
k
ij 0j 1
k
ij ji
Model

Expenditure and Price elasticities Expenditure Elasticities
Uncompensated (Marshallian) Price Elasticities
Compensated (Hicksian) Price Elasticities
Model
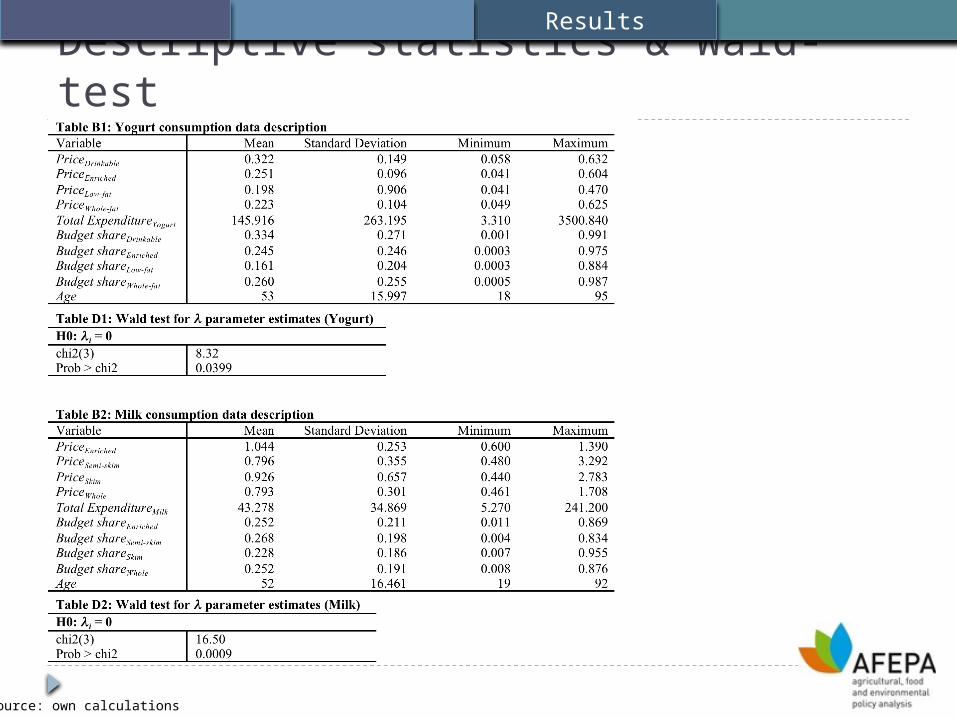
Descriptive statistics & Wald-test
Results
Source: own calculations

Expenditure Elasticities
Results
Increase in consumer expenditure results in greater increase in expenditure on drinkable and enriched yogurt (above unity; luxury) than low- or whole-fat (necessity)
Low-fat greater expenditure elasticity (near unity) than whole-fat yogurt (Davis et al 2010, normal nondrinkable yogurt 0.998 vs 1.000 drinkable)
Again, increase in consumer expenditure results in greater increase in expenditure on enriched/functional milk (above unity; luxury) compared to skim- or whole-fat milk (necessity)
Again, skim-fat greater expenditure elasticity (near unity) than whole-fat yogurt (Glaser and Thompson, 2000; Dhar and Foltz, 2004; Li et al 2012)
Note: conditional (wrt total yogurt/milk expenditures)Source: own estimation results

Uncompensated Price Elasticities
Yogurt: all relatively inelastic. Enriched functional yogurt most sensitive to price changes (Bonnano, 2009: functional drinkable yogurt more sensitive than conventional). Low-fat yogurt demand most inelastic. Whole-fat yogurt more sensitive than low-fat (Bonnano, 2009). Drinkable less sensitive than enriched, whole-fat (Davis et al., 2010: drinkable -1.103, refrigerated – 1.012)
Milk: Enriched and semi-skim demand more inelastic than skim and whole. Whole-fat more elastic than low-fat. Contradicts with yogurt where enriched was most sensitive to price changes. But Di Giacomo 2008 showed than functional drinkable yogurt more inelastic than conventional drinkable.
Results
Source: own estimation results

Compensated Price Elasticities
Yogurt: All compensated smaller in value than uncompensated (consumer shld have same utility before and after price increase; consumer gets “compensated” for price increase with rise in income); thus effect will be less severe. Since different suggests that the income effect on demand is significant. CPE positive = substitutable products. Drinkable and enriched demand more inelastic than low and whole-fat yogurt (Davis et al., 2010: -0.159 drinkable, -0.605 conventiional). Again, whole-fat more elastic than low-fat (Milk studies: Boehm, 1975; Gould, 1996 (-0.803 whole, -0.593 1%/skim))
Milk: Again, low-fat less sensitive to price changes than whole-fat. Enriched though insignificant, appears most inelastic.
Results
Source: own estimation results

Demographic variables Yogurt:
Increase in age increases demand for drinkable yogurt, decreases demand for low-fat yogurt
Gender (female) influences demand of whole-fat yogurt negatively
Milk: Gender positive and significant impact on semi-
skim milk demand (Females increased demand)

Discussion
Based on this study, would be “un-academic” to assume that investing in development of functional products is profitable
But; suggest that functional yogurt and milk products in Madrid and Barcelona in general are relatively inelastic in demand.
Also low-fat varieties in both cases appear less sensitive to price changes than whole-fat varieties
Further and continuous consumer demand/market research crucial…
Discussion

Limitations and Future considerations Larger data set, ie including retail scanner data from other
supermarket to get full overview Longer time period, to decrease probability of zero-consumption and
analyze possible seasonal effects Further disaggregation of the products (by functionality and fat-level,
flavored or plain) Look at more products Conditional (wrt to yogurt/milk expenditure) vs Unconditional (wrt to
total food expenditure) to take direct and indirect effects of price changes on yogurt/milk demand into account; conditional will likely be larger in absolute value than unconditional…
Analyze influence of further demographic characteristics on demand presence, number and age of children; education, labeling advertising household income
Discussion

References Annunziata, A. & Vecchio, R. (2010). Italian Consumer Attitudes Toward Products for Well-being: The Functional Foods Market.
International Food and Agribusiness Management Review, 13(2), 19-50.
Banks, J., Blundell, R., & Lewbel, A. (1997). Quadratic Engel Curves and Consumer Demand. The Review of Economics and Statistics, 79(4), 527-539.
Bech-Larsen, T. & Grunert, K.G. (2003). The perceived healthiness of functional foods—A conjoint study of Danish, Finnish and American consumers’ perception of functional foods. Appetite, 40, 9–14.
Bech-Larsen, T. & Scholderer, J. (2007). Functional foods in Europe: Consumer research, market experiences and regulatory aspects. Trends in Food Science & Technology, 18, 231–234.
Bellisle, F. (1998). Functional Food Science in Europe – Theme Papers. British Journal of Nutrition, 80(1), 1-193.
Benkouider, C. (2005). The world’s emerging markets. Functional Foods and Nutraceuticals. http://www.ffnmag.com/NH/ASP/strArticleID/770/strSite/FFNSite/articleDisplay.asp.
Boehm, T.W. (1975). The Household Demand for Major Dairy Products in the Southern Region. Southern Journal of Agricultural Economics, 7(2), 187-196.
Bonanno, A. (2009). Some like it healthy: demand for functional products in the Italian yogurt market. Paper prepared for the 113th EAAE Seminar “A resilient European food industry and food chain in a challenging world” Chania, Crete, Greece, September 3-6, 2009.
Cataño Olmos, E. (2013). Analisis del Comportamiento de Compra de los Consumidores Españoles en el Sector de la Gran Distrubución. Centro de Investigacion en Economía y Dessarolla Agroalimentario, Barcelona.
Davis, C., Blayner, D., Muhammd, A., Yen, S.T., & Cooper, J. (2010). A Cross-Sectional Analysis of U.S Yogurt Demand. Journal of Food Distribution Research, 41(2), 36-45
Deaton, A. & Muellbauer, J. (1980a). An Almost Ideal Demand System. The American Economic Review, 70(3), 312-326.
Deaton, A. & Muellbauer, J. (1980b). Economics and Consumer Behavior. Cambridge University Press, USA.
Dhar, T. & Foltz, J.D. (2004). Is Soy Milk? The Economics of the Soy Milk Market. Selected Paper of American Agricultural Economics Association, Denver, CO, August 1-4, 2004.
Di Giacomo, M. (2008). GMM estimation of a structural demand model for yogurt and the effects of the introduction of new brands. Empirical Economics, 34, 537–565.
Diplock, A.T. (1999). Scientific Concepts of Functional Foods in Europe – Consensus Document. British Journal of Nutrition, 81(1), 1-27.
Glaser, L.K. & Thompson, G.D, (2000). Demand for Organic and Conventional Beverage Milk. Selected Paper of the Western Agricultural Economics Association, Vancouver, British Columbia, June 29-July 1, 2000.
Giannetti, V., Testani E., & Recchia, L. (2009). Food Consumption and Innovation: Functional Foods. J. Commodity Sci. Technol. Quality, 48(3), 213-225.

Gould, B.W. (1996). Factors Affecting U.S. Demand for Reduced-Fat Fluid Milk. Journal of Agricultural and Resource Economics, 21(1), 68–81.
Hoban, T. J. (1998). Improving the success of new product development. Food Technology, 52(1), 46-49.
Jago, D. (2009). Functional foods, market trends. Functional foods symposium, Amsterdam, 2009.
Kotilainen, L., Rajalahti, R., Ragasa, C., & Pehu, E. (2006). Health enhancing foods: Opportunities for strengthening the sector in developing countries. Agriculture and Rural Development Discussion Paper 30. World Bank.
Martinez, M.G., & Briz, J. (2000). Innovation in the Spanish Food & Drink Industry. International Food and Agribusiness Management Review, 3, 155-176
Menrad, K. (2003). Market and marketing of functional food in Europe. Journal of Food Engineering, 56, 181–188.
Monár, J. (2007). The Spanish functional food market: Present and future perspectives. European Functional Food Net (FFNet) network meeting, IATA-CSIC.
Siró, I., Kápolna, E., Kápolna, B., & Lugasi, A. (2008). Functional food, Product development, marketing and consumer acceptance – A review. Appetite, 51, 456–467.
Stewart-Knox, B. J., Vaz De Almeida, M. D., Parr, H., Pinhao, S., Bunting, B., & Gibney, M. (2007). Consumer uptake of functional foods in Europe. International developments in science & health claims, ILSI international symposium on functional foods in Europe.
Urala, N. & Lähteenmäki, L. (2007). Consumers’ changing attitudes towards functional foods. Food Quality and Preference, 18, 1–12.
Winger, R. & Wall, G. (2006). Food product innovation: A background paper. FAO Food and Agriculture Organization of the United Nations: Agricultural and Food Engineering document 2.
References continued..

Thank you for your attention!