Embed Size (px)
Citation preview

HEDG Working Paper 10/30
Is fiscal decentralization good for your health? Evidence from a panel of OECD
countries
Dolores Jiménez-Rubio
November 2010
york.ac.uk/res/herc/hedgwp

1
Is fiscal decentralization good for your health?Evidence from a panel of OECD countries
Dolores Jiménez-Rubio
Department of Applied Economics, University of Granada, Campus Universitario deCartuja, 18071 Granada, Phone: +34958246258 Fax: +34958244046,
e-mail: [email protected]
Abstract
In this study I use improved data of fiscal decentralization to re-examine the
hypothesis that shifts towards more fiscal decentralization would be
accompanied by improvements in population health on a panel of 19 OECD
countries. The advantage of the new measure of decentralization is that it
reflects better than previous measures the existence of autonomy in the
decision making authority of lower tiers of government, a crucial issue in the
decentralization process. The results based on panel data estimation
techniques robust to heteroskedasticity and autocorrelation show that fiscal
decentralization has a substantial and positive effect on health outcomes over
the period studied. However, I find that conventional measures of
decentralization tend to over-estimate the magnitude of the effect.
JEL Classification: I12, H77.
Key words: Fiscal decentralization, health outcomes, OECD countries, paneldata
*I would like to thank Dan Stegarescu for providing the dataset used in thispaper, and David Cantarero, Marta Pascual (both at the University ofCantabria) and David Epstein (CHE, University of York) for helpfulcomments.

2
1. Introduction
Despite the large number of countries worldwide that are increasingly
devolving responsibilities for their health care systems to local levels of
government, there is insufficient evidence about the potential impact of such
reforms. To date much of the literature on this topic has concentrated on
theoretical discussions about the potential advantages and disadvantages of
transferring decision making and economic resources from central to local
levels of government.
However, in absence of quantitative measures of the magnitude of the effect
of decentralization1, there is little that can be said in terms of its benefits and
its costs to the health system. The most appropriate level of decentralization
of health services is therefore a central policy issue that to date remains
largely unresolved.
Many of the proponents of decentralization claim that decentralization could
strengthen accountability of policy makers to local electors and transparency,
thus allowing a better tailoring between the provision of goods and services
and local needs (Oates, 1999). With respect to the health services in
particular, decentralization is expected to improve access to health care
services, and ultimately, population health (Robalino, Picazo & Voetberg,
2001; Uchimura & Jütting, 2009; Khaleghian, 2004).
However, in spite of the identified advantages of devolution of policy making
in health care services, there is limited empirical evidence about the impact of
this intervention on population health. One of the main reasons for this is that
much of the existing literature focuses on case studies or on middle and low
income countries. In addition, current studies on decentralization and health
outcomes have generally relied on fiscal data from the Government Financial
1 In this study decentralization is synonymous with devolution, a political reform designed topromote autonomy at the local level. See Hunter, Vienonen and Cezary (1998, p.311-3) for adetailed classification of the different types of decentralization, namely deconcentration,delegation, and devolution.

3
Statistics (GFS) of the International Monetary Fund (IMF). While providing a
consistent dataset across countries and over time, decentralization measures
based on data from the GFS fail to properly reflect the level of autonomy in
policy making of sub national tiers of government (Ebel &Yilmaz, 2004,
Rodden 2003).
The main objective of this paper is to use empirical analysis to inform the
debate about the most appropriate degree of decentralization of the health
system. This study contributes to the research literature by using an improved
fiscal decentralization indicator on a panel of 19 OECD countries to test the
extended hypothesis in the research literature that more decentralization leads
to better health outcomes. The next section discusses the theoretical
considerations to understand how decentralization could influence population
health. Section three presents an overview of the current evidence on the
impact of decentralization on health outcomes. Section four describes the new
data on fiscal decentralization, while section five presents the empirical
specification used to model the relationship between decentralization and
health status and the data and variables employed in this study. In section six
the results are shown and section seven concludes.
2. Theoretical framework: the impact of decentralization on health
outcomes
Decentralization is argued to assign more financial responsibility for health
service provision to lower tiers of government bringing about efficient service
provision (Khaleghian, 2004, Uchimura, and Jutting (2010), Robalino
(2001)). The beneficial impact of decentralization on health services is based
on the assumptions that decentralization can improve the information of local
decision makers about local circumstances, stimulating prompt and effective
responses to local needs, and is an effective channel for people to express
their preferences. Local decision makers also have more opportunities to
reduce costs than central managers. They can tailor staff and procedures to
the local context, and have more freedom for experimenting with alternative
ways of doing things and implementing them rather than relying on centrally
determined procedures. Therefore, decentralization, if properly designed and

4
implemented, is expected to improve equity, efficiency, quality, and access to
health care services and ultimately health outcomes.
Implicit in the above arguments is the assumption that policy makers are
responsive for the provision of health services and are able to manage
financial resources efficiently. While intergovernmental fiscal transfers may
be required on equity grounds to compensate for different revenue capacities
at the local level, there is a risk that too much reliance on grants places little
pressure on local governments to manage spending efficiently (Oates,1993).
In fact, a common finding in the research literature is that local spending is
much more responsive to increases in intergovernmental transfers than to
equal increases in private income (see e.g. Fiva, 2005), a phenomenon which
has become known as the flypaper effect.
Potential gains to be realised from decentralization are also conditional on the
existence of decentralization of political decision-making authority, and in
particular, effective channels for the individuals to express their preferences,
and incentives for the policymakers to respond to those preferences. For this
reason many authors are sceptical about the successful implementation of
decentralisation in less developing countries, given their weaker
administrative capacity and their lower initial levels of democracy as
compared to developed countries (Khaleghian, 2004).
In spite of the compelling theoretical arguments put forward for devolution of
policy making in health services, decentralization is not without its
limitations (Gravelle, 2003; Khaleghian, 2004). Regarding economies of
scale, decentralization might generate inefficient location of facilities such as
hospitals by local decision makers accountable to local electors. Central
intervention in health care is also expected to result in more efficient pricing
of inputs by a single purchaser of health care. Decentralization of health
services with important externalities, such as immunization services, is
expected to encourage local jurisdictions to “free-ride” on the immunization
status of their neighbours. The result could be a sub optimal disease
protection level provided in the country as a whole. Finally, unless the central

5
government coordinates an adequate transfer mechanism from richer to
poorer regions, decentralization may result in increased inequalities in health
care if local authorities, under pressures to raise their own revenues rely on
user fees to finance their services or reduce the coverage of the universal
health package.
3. Empirical evidence on the impact of fiscal decentralization on
health outcomes
In recent years a growing number of studies have investigated the impact of
decentralization on various measures of population’s health such as infant
mortality, life expectancy or immunisation coverage rates. Table 1
summarizes the main results of these studies. Overall, most of the literature
finds a beneficial impact of decentralization on indicators of population’s
health.
Mahal et al. (2000) use data from rural villages in India for 1994 to test the
hypothesis that decentralisation has a positive influence on child mortality
once the effect of socio economic factors, civil society organisations, and so
on, are controlled for. They have used dummy variables for states that have
significantly moved towards decentralisation during the period 1970-94, and
the frequency of local body elections during the same period as proxies for
decentralization. While the estimated coefficients for decentralized states
have the expected positive effect, the election frequency variable is
statistically insignificant. The study by Asfaw et al. (2004) corroborates the
previous results for rural India using an index of fiscal decentralization
obtained by factor analysis2 on the basis of three variables3 for the period
2 Factor analysis is a statistical technique that can be used to summarise a set of correlatedvariables into a single measure.
3 These are: the share of local (rural) expenditure to the total state (intermediate governmenttier) expenditure, the total local expenditure per rural population, and the share of local ownrevenue from the total local expenditure.
6
1990-1997. Their results also show that the effectiveness of fiscal
decentralization increases with the level of political decentralization4.
The study by Habibi el al. (2003) shows that the percent of revenue raised
locally and the proportion of controlled revenue over the total have a negative
and significant association with infant mortality rates for a panel of
Argentinean provinces over the period 1970-1994. In addition, the authors
find that during the period of decentralization reforms studied, regional
inequalities were considerably reduced.
In the study by Robalino et al., (2001) using a panel data of low and high
income countries fiscal decentralization (measured as the proportion of sub
national government expenditure over the total) is found to be inversely
related to infant mortality rates during the period 1970-1995. Interestingly,
according to the results the marginal benefit from decentralization is greater
at low income levels. Also, in Yee (2001) the results of the fixed effects and
random effects estimations for a panel data of Chinese provinces over the
period 1980-1993 suggest that fiscal decentralization —proxied as the ratio of
local government expenditure to central government expenditure, and the
ratio of local government expenditure to total government expenditure- has
been beneficial to the health sector in terms of reducing mortality rates and
increasing local expenditure on health care.
In the recent study by Uchimura and Jütting (2009) two measures of fiscal
decentralization of Chinese counties based on the counties’ expenditures and
revenues were found to be significantly associated with lower infant mortality
between 1995 and 2001. Finally, the recent papers by Cantarero and Pascual
(2008) and Jiménez-Rubio (2010) also find an inverse relationship between
fiscal decentralization, measured as the ratio of sub national health spending
over the total, and health outcomes in the Spanish regions and the Canadian
provinces, respectively.
4 Political decentralization is measured by an index constructed on the basis of factorialanalysis from total voter’s turnout, women’s participation in polls and the number of pollingstations per elector in each state.
7
A few other studies such as Ebel and Yilmaz (2002) and Khaleghian (2004)
concentrate on the relationship between decentralization and immunization
coverage rates. The intervention analysis by Ebel and Yilmaz shows a
positive association between decentralization and the coverage of children
under 12 months of age immunised for measles in six developing countries
over the period 1970-1999.
Khaleghian (2004) examines the association between decentralization and
immunisation coverage rates for the third vaccine against diphtheria, pertussis
and tetanus (DPT3) and measles of children at one year of age in 140 low and
middle income countries during the period 1980-1997. The main indicator of
fiscal decentralization used in this study is a binary variable defined as the
presence of taxing, spending, or regulatory authority on the part of sub
national authorities. Two other decentralization indicators were used to
double check the results: the share of sub national expenditures on total
government expenditures, and the share of health spending on total sub
national expenditures. The model also included several control variables
(GDP per capita, illiteracy rate, democracy score, ethnic tension, etc). The
findings suggest that decentralization improves coverage rates only in low-
income countries5.
Ebel and Yilmaz (2001) employ an intervention analysis6 to evaluate the
outcomes of decentralization in terms of immunisation rates for DPT and
measles of children under 12 months in six developing countries (Argentina,
Brazil, Colombia, Philippines, South Africa and Venezuela) during the period
1970-1999. The results of the estimated fixed effects model suggest that
5 Contrary to the expectations (see p.4), in both Ebel and Yilmaz’s and Khalegian’s studies, apositive association between decentralization and immunization coverage rates is found ontheir sample of developing countries. Khaleghian (2004, p.176) has pointed out that thisfinding “may reflect a salutary balance between the proximity of local authorities to thecommunity, and the preservation of central influence and bureaucratic autonomy, both ofwhich are essential to the effective functioning of an immunisation program”.
6An intervention analysis involves a test of the change in the mean of a variable as a result
of a policy reform.

8
intervention by sub national governments has associated with an increase in
the coverage of children immunised for measles.
Current evidence on the impact of decentralization in health care is however
limited by the following reasons. Firstly, only a few of studies focus on
developed countries. Secondly, by relying on IMF GFS fiscal data much of
the literature fails to properly capture the actual level of decentralization in
public policy making. The existing evidence is therefore insufficient to draw
firm conclusions about whether countries with more decentralised health care
systems have better health outcome.
4. Measuring fiscal decentralization: new indicator of sub-nationaltax autonomy
As shown in the previous section, most of the existing empirical studies on
the relationship between decentralization and health outcomes have used
indicators of decentralization derived from fiscal data. The level of
decentralization in policy making is however a complex phenomenon
embracing a number political, fiscal and administrative dimensions, many of
which are not easy to measure empirically (Banting and Corbett, 2002).
Therefore, an accurate measure of fiscal decentralization should be able to
capture considerations other than purely fiscal ones such as political
autonomy (e.g. range of services to be covered, access conditions), or the
legal and regulatory structure (e.g. service standards, training regulations).
However, in the absence of more appropriate measures of decentralization,
fiscal decentralization indicators have been widely used in the research
literature following Oates’ seminal work in 1972. The most commonly used
dataset to generate these measures has been the International Monetary
Fund’s (IMF) Government Finance Statistics (GFS).
While providing a consistent dataset across countries and over time,
decentralization measures based on data from the GFS are likely to provide a
misleading picture of the real level of autonomy in policy making of sub
national tiers of government (Ebel &Yilmaz, 2002, Rodden 2003).
9
This is because GFS‘s local spending statistics include not only expenditures
in functions controlled exclusively by the local jurisdictions, but also
expenditures in functions controlled by higher levels of government (through
directives, conditional grants, etc.). On the revenue side, the GFS classifies
shared taxes, piggybacked taxes, and taxes in which the tax rate and/or base
are decided by the central government as sub national own-source revenue.
In 1999, a report by the OECD improved the fiscal information available for a
19 countries by grouping taxes according to the level of discretion entitled to
local governments. This classification ranges from a.) where the central
government can set both the rate of taxation and the tax base, to e.) where sub
national governments set both the tax base and the tax rate. Tax sharing
agreements are further arranged into four categories from d.1.) where the sub
national governments can determine the revenue split to d.4.) where the
national government can unilaterally determine the revenue split.
Drawing on this classification, Stegarescu (2005) extended the OECD dataset
to cover 23 countries from 1965 to 2001, and provided information on the
level of autonomy over taxes by local governments relative to the general
government. Stegarescu’s indicator of decentralization therefore measures the
share of local government taxes over the general government but only
considers those taxes where the local government controls the tax rate, the tax
base, or both. This data represents a major improvement for measuring
decentralization in policy making compared to conventional indicators of
fiscal decentralization based on IMF GFS data. Moreover, in contrast to
dichotomous indicators of decentralization or federalism, fiscal data reflect
the degree of the decentralization process7. Table 2 presents a summary of the
advantages and disadvantages of the main fiscal decentralization indicators.
Our study contributes to the existing literature by empirically re-examining
the hypothesis that more decentralization leads to an improvement in
7An example of this type of decentralization measures is the binary variable used by Khaleghian
(2004) that represents the presence of taxing, spending or regulatory authority on the part of subnational governments.

10
population health using the improved measure of tax revenue decentralization
(AutTaxRevDec). Also, contrary to much of the existing literature, we provide
evidence on the impact of decentralization on health outcomes based on a set
of developed countries.
Finally, we compare the results with those using the most common indicator
of fiscal decentralization in the research literature: the share of sub national
spending over the spending by the general government (ExpDec).
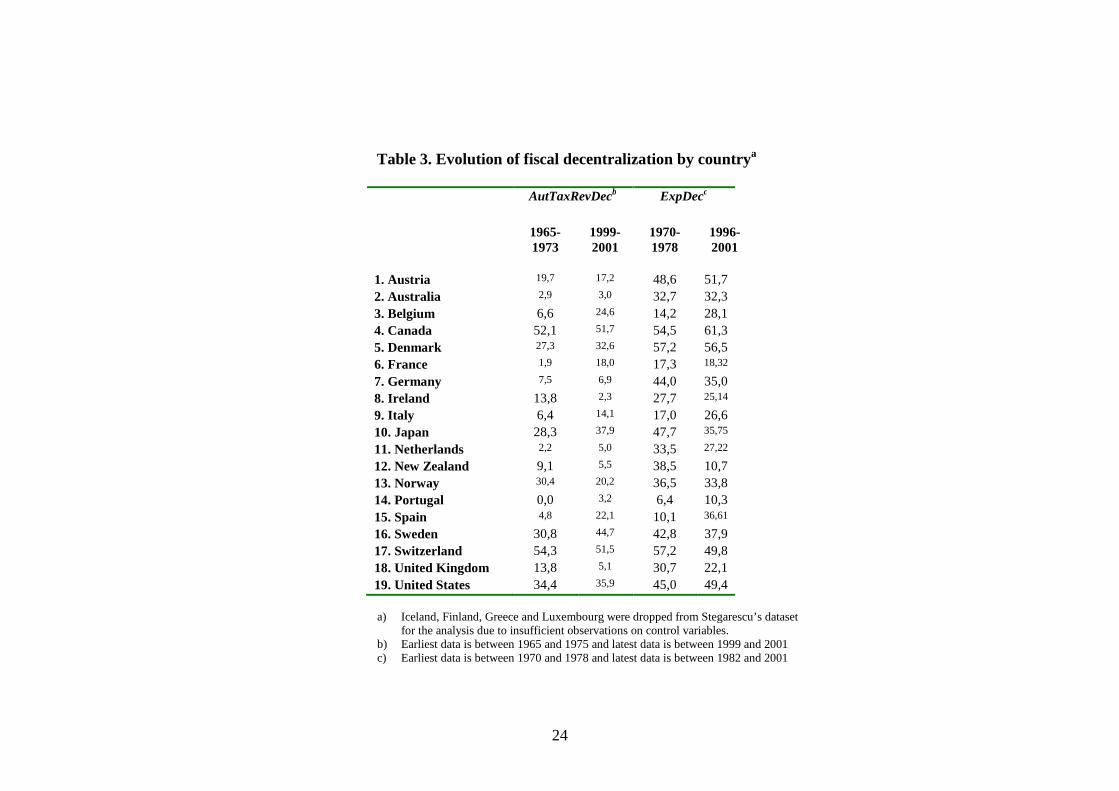
According to Table 3 countries are generally more decentralized in the
expenditure than in the revenue side. Although the evolution of (autonomous)
tax and expenditure decentralization show a similar trend over the period
studied, there are a few exceptions. For instance, in this period both Austria
and Canada show a reduction in the degree of autonomous tax
decentralization and an increase in the degree of expenditure decentralization,
while Japan, the Netherlands and Sweden show the opposite trend, that is, an
increase in expenditure decentralization and a decrease in autonomous tax
decentralization.
With respect to AutTaxRevDec, the preferred measure of fiscal
decentralization, a trend towards increasing fiscal powers of sub national
governments can be observed in Spain, Italy, Belgium, Denmark, Sweden,
and Japan (see Figure 1). Switzerland, New Zealand, Ireland, United
Kingdom, and Norway have experienced a reduction in the level of sub
national fiscal autonomy, while the remaining countries, many of which are
traditional federal countries, have shown a fairly stable degree of fiscal
decentralization over the period of study (see Figures 2 and 3). According to
Stegarescu (2005), AutTaxRevDec is a reliable indicator that reflects well the
institutional changes that have taken place in these countries over the 30 years
of study.

11
5. Estimation techniques
5.1 Basic model
In order to model the relationship between decentralization and health
outcomes we use a panel data of 19 OECD countries from 1965 to 2001. The
estimations are based on the following health production function based on
previous studies (e.g. Uchimura and Jutting (2009), Or (2005)):
Hij =i + Xij + Zij + ij (1)
where i denotes time, j denotes country, H denotes health status, X denotes
the fiscal decentralization indicator used, and Z denotes a vector of control
variables employed in the estimations. We have used infant mortality rates
from the OECD Statistics as the measure of health status. Infant mortality has
been considered as the single most exhaustive indicator of health in a society.
It reflects child’s health and pregnant women’s health, in addition to the state
of health development within the society. Moreover, infant mortality is
assumed to be more sensitive to policy changes such as decentralization than
other health indicators such as life expectancy. In addition to the level of
fiscal decentralization, control variables include the level of medical care
inputs and other non-medical characteristics (Or, 2001; Or, Wang & Jamison,
2005). To measure the level of medical care inputs across OECD countries
we use the number of doctors per 1000 population.
Non-medical determinants of health include the income level as measured by
the GDP per capita, the educational level, and the consumption of alcohol and
tobacco as life style indicators. Alcohol and tobacco are well known risk
factors for health and are expected to have a negative impact on health
outcomes. However, the level of education and income are expected to have a
positive impact on health. This is because wealthier and better educated
people are expected to select, for example, healthier diets or better jobs than
less wealthier and less educated individuals.

12
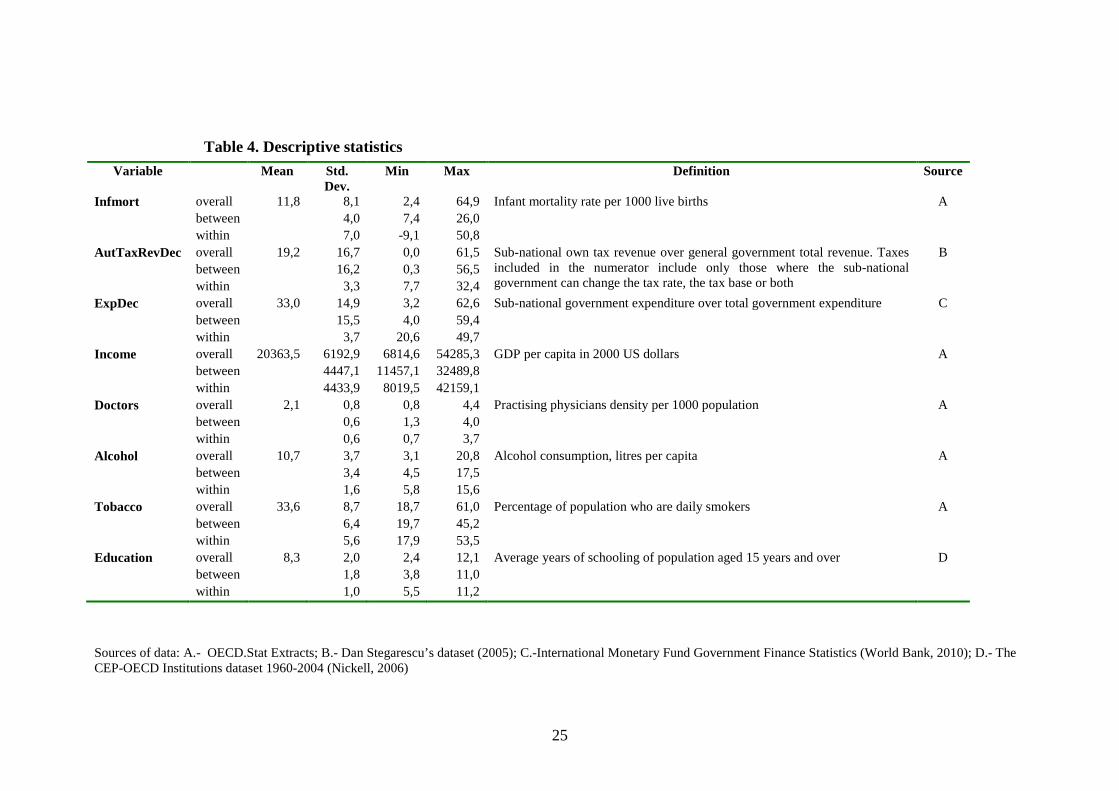
5.2 Data and econometric methods
Data were taken from various sources. The main fiscal decentralization
measure, the share of autonomous tax revenue of local government over the
general government tax revenue, is obtained from Dan Stegarescu’s dataset
(2005). The alternative fiscal decentralization indicator employed, the share
of local government spending over the total spending for all levels of
government, is obtained from the International Monetary Fund’s Government
Finance Statistics. Data on infant mortality, the dependent variable, GDP per
capita, alcohol and tobacco consumption were taken from the OECD.Stat
Extracts. Finally, the level of education was obtained from the Centre for
Economic Performance-OECD Political Institutions dataset 1960-2004
(Nickell, 2006). Table 4 in the Appendix presents descriptive statistics and
definitions of the variables used in the estimations.
The empirical specification to explore the impact of decentralization in health
outcomes is based on OLS Panel Corrected Standard Errors (PCSE) (Prais &
Winsten, 1954). PCSE deal with several common problems of panel data:
autocorrelation (the errors within a unit are serially correlated), cross
sectional correlation (the errors of various units are correlated), and
heteroscedasticity (the variance of the errors is not constant). Time and
country specific dummy variables are included in the analysis to control for
time invariant characteristics of the population and the possibility of period
specific shocks (i.e. variations in tax shares) respectively. Finally, we explore
the robustness of the results to alternative specifications such as Feasible
Generalized Least Squared (FGLS) and Newey-West OLS estimation
techniques robust to heteroskedasticity and autocorrelation.
6. Results
Table 5 displays the results. Two different versions of the health outcomes
equation presented in section four were estimated, one for each fiscal
decentralization indicator considered in this study. The model that uses
Stegarescu’s improved measure of fiscal decentralization provides us with the
benchmark results (first column of Table 5). However, we also fit an
alternative specification using a more conventional measure of fiscal

13
decentralization based on expenditure data for comparative purposes (second
column of Table 5).
Both the time and year dummies turn out to be statistically significant and are
included throughout the analysis (p values for both F tests of zero coefficient
parameters show a rejection of the null hypothesis at any conventional
significance level). The Wooldridge test and the modified Wald test for panel
data show evidence of autocorrelation and heteroskedasticity (p-values =
0,00), while according to the Breusch Pagan test the null hypothesis of cross
sectional independence cannot be rejected at any conventional significance
level (p value = 0,44). The standard errors of the model shown in Table 5 are
therefore robust to heteroskedasticity and autocorrelation. The two alternative
econometric specifications fitted (FGLS and OLS with Newey standard
errors) also control for autocorrelation and heteroscedasticity. The results of
these models, shown in Tables 6 and 7, are very similar in magnitude and
sign to those using PCSE. As an additional robustness check, we excluded
from the analysis countries with a stable trend. Again, the results of the
estimated models were very similar to those pooling all the countries
together.
According to the findings there is a negative and significant relationship
between AutTaxRevDec, the key independent variable, and infant mortality
on the 19 OECD countries analysed over the period of study. On average, it is
estimated that a 1% increase in the proportion of autonomous tax revenue
controlled by local governments leads to a 0,05 per cent reduction in infant
mortality8. The same result is observed in the second specification, where the
decentralization variable is the share of total expenditure controlled by sub
national government (ExpDec). However, the magnitude of the effect in this
case is almost four times larger: a 1 per cent increase in expenditure
decentralization is associated with approximately a 0,2 per cent reduction in
infant mortality.
8 As indicated in Tables 5, 6 and 7 variables are defined in logs. The coefficients of thevariables can be easily interpreted as elasticity by a log transformation (see e.g. Filmer andPritchett, 1999).

14
Variables other than decentralization seem to have had a greater impact on
infant mortality in our sample of OECD countries over the three decades of
study. The effect of education is particularly important: the two specifications
of the model shown in Table 5 predict that, on average, a 1 per cent increase
in education stimulates roughly a 0,2 per cent reduction in infant mortality.
The estimations also show an inverse relationship between the number of
doctors and infant mortality. Both of these results corroborate the findings of
previous research based on a similar cross-sectional sample of OECD
countries (Or, Wang and Jamison, 2005) and contribute to the ongoing debate
on the effects of the medical care system on population health (Filmer and
Pitchett, 1999; Or, 2000).
7. Conclusions
The theoretical literature of fiscal federalism applied to health economics
predicts potential efficiency gains (improvement of the population’s health)
from placing responsibilities of local public goods at the local level.
However, in spite of the identified advantages of devolution of policy making
in health care services, there is limited empirical evidence about the impact of
decentralization on population health. This is due to the fact that much of the
existing literature focuses on case studies or on middle and low income
countries. In addition, many of the existing studies on decentralization and
health outcomes have used fiscal measures derived from the GFS of the IMF
that does not reflect the real level of autonomy of local decision making (Ebel
&Yilmaz, 2004, Rodden 2003).
This paper contributes to the research literature by using an improved fiscal
decentralization indicator constructed by Stegarescu in 2005 on a panel of 19
OECD countries to test the common hypothesis in the research literature that
more decentralization leads to improved health outcomes. Stegarescu’s
indicator of decentralization measures the share of local government taxes
over the general government but only considers those taxes where the local
government controls the tax rate, the tax base, or both. This data represents a
major improvement for measuring decentralization in policy making

15
compared to more conventional indicators of fiscal decentralization based on
IMF GFS data. We have also compared the results using our improved
measure of fiscal decentralization with those using an alternative measure of
fiscal decentralization widely used in the research literature: the share of sub
national spending over the spending by the general government (based on
data from the GFS of the IMF).
The results of the econometric estimations for these 19 OECD countries
suggest that decentralization has had a positive and substantial influence on
the effectiveness of public policy in improving population’s health (in terms
of a reduction in infant mortality rates). Our findings also suggest that
conventional measures of decentralization may overestimate the magnitude of
the effect. Measures that adequately reflect the level of autonomy in local
decision making are therefore necessary to capture the true impact of
decentralization in future research.
Some caution is required in interpreting the results of this study. First of all,
because this paper only analyses one of the multiple dimensions of
decentralization: the fiscal one. While decentralization is a complex
phenomenon, to date there is no single measure that captures all the multiple
dimensions of the decentralization process. Secondly, although the measure
of health outcomes employed (infant mortality) is superior to alternative
indicators such as life expectancy, it does not fully reflect the underlying
level of health in a society. In spite of these limitations, this research adds
new empirical evidence in the evaluation of the economic gains arising from
decentralization in health care in a selected group of OECD countries.

16
References
Asfaw, A., Frohberg, K., James, K. S., and Jütting, J. (2007). Fiscal
decentralization and health outcomes: empirical evidence from rural
India. Journal of Developing Areas, Fall 2007.
Banting K, Corbett S (2002): Multi-level Governance and Health Care: Health
Policy in Five Federations, paper presented to the Meetings of the American
Political Science Association, Ontario.
Cantarero, D., and Pascual, M. (2008): Analysing the impact of fiscal
decentralization on health outcomes: empirical evidence from Spain.
Applied Economic Letters, (15) 109-111.
Ebel RD, Yilmaz S (2001): Fiscal Decentralization: is it happening? How do
we know?, paper prepared for the Conference on Public Finance in
Developing Countries, Georgia State University.
Ebel, R. D., and Yilmaz, S. (2002). On the measurement and impact of fiscal
decentralization. (World Bank Policy Research Working Paper No.
2809). Washington DC: World Bank.
Filmer, D., Pritchett, L. (1999). The Impact of Public Spending on Health:
Does Money Matter? Social Science and Medicine, Vol. 49., pp. 1309-
1323.
Fiva, J.H. (2005): New evidence on fiscal decentralization and the size of
government. CESifo Working Paper No. 1615.
Gravelle, H. (2003). A comment on Weale's paper from an economic
perspective. Paper presented at the Meeting of the health equity network,
London, 59-65 from
http://www.nuffieldtrust.org.uk/ecomm/files/041203equityinhealth.pdf
Habibi, N., Huang, C., Miranda, D., Murillo, V., Ranis, G., Sarkar, M. et al.
(2003). Decentralization and Human Development in Argentina. Journal
of Human Development 4 (1).

17
Hunter DJ, Vienonen M, Cezary WW (1998): Optimal Balance of Centralized
and Decentralized Management, in: Saltman RB, Figueras J and
Sakellarides C (Eds), Critical challenges for health care reform in
Europe, Open University Press, Philadelphia.
Jiménez-Rubio, D. (2010). The impact of decentralization of health services
on health outcomes: evidence from Canada. Forthcoming in Applied
Economics.
Khaleghian, P. (2004). Decentralization and public services: The case of
immunization. Social Science and Medicine, 59(1), 163-183.
Mahal A, Srivastava V, Sanan D (2000): Decentralization and its impact on
public service provision on health and education sectors: the case of
India, in: Dethier J (Ed.), Governance, Decentralization and Reform in
China, India and Russia, Kluwer Academic Publishers and ZEF,
London.
Nickell, W. (2006). The CEP-OECD Institutions Data Set (1960-2004). CEP-
Discussion Paper 759, London: London School of Economics.
Oates WE (1993): Fiscal decentralization and economic development,
National Tax Journal, 46 (2), p. 237-243.
Oates, W. E. (1999). An essay on fiscal federalism. Journal of Economic
Literature, 37, 1120-1149.
Or, Z. (2000). Determinants of health outcomes in industrialised countries: A
pooled, cross-country, time-series analysis (OECD Economic Studies
No. 30). Paris: OECD.
Or, Z. (2001). Exploring the effects of health care on mortality across OECD
countries. OECD Labour Market and Social Policy Occasional Papers Nº
46, Paris: OECD.

18
Or, Z., Wang, Jamison (2005). International differences on the impact of
doctors on health: a multilevel analysis of OECD countries. Journal of
Health Economics, 24, 531-560.
Prais S, Winsten C. (1954) Trend estimating and serial correlation. Chicago:
Cowles Comission Discussion Paper, no 383.
Robalino, D. A., Picazo, O. F., and Voetberg, A. (2001). Does fiscal
decentralization improve health outcomes? Evidence from a cross-
country analysis (Policy Research Working Paper No. 2565).
Washington DC: World Bank.
Rodden, J. (2003). Reviving Leviathan: Fiscal Federalism and the Growth of
Government, International Organization 57, p. 695-729.
Stegarescu, D. (2005). Public Sector Decentralization: Measurement
Concepts and Recent International Trends, Fiscal Studies, 301-333.
Uchimura, H., Jütting, J. (2009). Fiscal decentralization, Chinese style: good
for health outcomes? World Development, 37 (12), 1924-1936.
World Bank (2010). International Monetary Fund Government Finance
Indicators. Accessed from:
http://www1.worldbank.org/publicsector/decentralization/fiscalindicators.htm

19
Figures
Figure 1: Evolution of Autonomous Tax Revenue Decentralization:countries with an upwards trend
0
5
10
15
20
25
30
35
40
45
50
1965
1967
1969
1971
1973
1975
1977
1979
1981
1983
1985
1987
1989
1991
1993
1995
1997
1999
2001
Year
Au
tTax
Re
vD
ec Belgium
Denmark
Italy
Portugal
Spain
Sweden
Figure 2: Evolution of Autonomous Tax Revenue Decentralization:countries with a downwards trend
0
10
20
30
40
50
60
1965
1967
1969
1971
1973
1975
1977
1979
1981
1983
1985
1987
1989
1991
1993
1995
1997
1999
2001
Year
Au
tTax
Re
vD
ec
Ireland
Japan
New Zealand
Norway
United Kingdom

20
Figure 3: Evolution of Autonomous Tax Revenue Decentralization:countries with a stable trend
0
10
20
30
40
50
60
70
1965
1967
1969
1971
1973
1975
1977
1979
1981
1983
1985
1987
1989
1991
1993
1995
1997
1999
2001
Year
Au
tTaxR
evD
ec
Australia
Austria
Canada
France
Germany
Netherlands
Switzerland
United States

21
TablesTable 1. Summary of previous studies on the impact of decentralization on health outcomes
Reference Area of study Period ofstudy
Model description Main results
Asfaw et al(2007)
Rural villages inIndia
1990-1997
Panel data specification where decentralization is proxied byan index of fiscal decentralization obtained by factoranalysis on the basis of three variables (the share of local(rural) expenditure on total state (intermediate governmenttier) expenditure, the total local expenditure per ruralpopulation, and the share of local own revenue from the totallocal expenditure). Other relevant determinants of infantmortality included in the analysis are: women literacy, percapita income and an index of political decentralizationconstructed from a number of variables using factor analysis(total voters’ turnout, women’s participation in polls, and thenumber of polling stations per electors in each state).
This study suggests that fiscal decentralization can help toreduce infant mortality rates and political decentralizationis a potential factor that can affect its effectiveness.
Cantarero andPascual (2008)
15 Spanish regions 1992-2003
Panel data specification (fixed effects and random effectsmodel) with infant mortality and life expectancy asdependent variables. The key indicator of decentralization isthe ratio of sub-national health care expenditure to the totalhealth expenditure for all the levels of government. Othercontrol variables included in the model are: per capitaincome, per capita acute care beds (density per 1,000population), and general practitioners (density per 1,000population).
Fiscal decentralization in Spain is found to be negativelyrelated to infant mortality over the period of study.
Ebel andYilmaz (2001)
Six developingcountries(Argentina, Brazil,Colombia,Philippines, SouthAfrica andVenezuela)
1970-1999
GLS with fixed effects intervention analysis that evaluatesthe outcomes of decentralization in terms of immunizationrates for DPT and measles of children under 12 months.
The results of the estimated model suggest thatintervention by sub national governments has beenassociated with an increase in the coverage of childrenimmunised for measles.
Habibi et al(2003)
A panel of 23Argentinean
1970-1994
Fixed effect specification with infant mortality as thevariable to be explained and two key decentralization
Decentralization has a negative and significant associationwith infant mortality rates. In addition, the study shows

22
provinces indicators: % of revenue raised locally and % of controlledrevenue over the total. Other independent variables of thestudy are: provincial per capita GDP, total per capitaexpenditure of the province, and number of publicemployees per 1,000 provincial population.
that during the period of decentralization reforms studied,regional inequalities were considerably reduced.
Jiménez-Rubio(2010)
Ten provinces ofCanada
1979-1995
Fixed effects model exploring the impact of a measure ofdecentralization of health spending (ratio of provincialhealth care expenditure over the total) on infant mortality.Other key determinants of infant mortality are: healthspending by the federal government in absolute terms andthe level of education.
The results of the empirical analysis suggest thatdecentralization in Canada appear to have had a positiveand substantial influence on the effectiveness of publicpolicy in improving population's health.
Khaleghian(2004)
140 low andmiddle incomecountries
1980-1997
Panel data examining the association betweendecentralization and immunisation coverage rates for DPT3and measles of children at one year of age. Two indicators offiscal decentralization were used: a.) binary variable definedas the presence of taxing, spending, or regulatory authorityon the part of sub national authorities; b.) A combination oftwo variables: the share of sub national expenditures on totalgovernment expenditures, and the share of health spendingon total sub national expenditures. The model used is astandard OLS multiple regression with Huber correctedstandard errors. The control variables included are: GDP percapita, illiteracy rate, democracy score, ethnic tension, etc.
Decentralization improves immunization coverage ratesonly in low-income countries
Robalino et al(2001)
A panel data oflow and highincome countries1970-1995
1970-1995
Fixed effects estimation techniques to test how a measure offiscal decentralization -the proportion of sub nationalgovernment spending over central government spending-affects infant mortality rates after controlling by a set ofstructural variables (GDP per capita, corruption, ethno-linguistic fractionalisation, etc.).
Decentralization is associated with lower infant mortalityrates. Interestingly, the marginal benefit fromdecentralization is found to be greater at low-incomelevels.
Uchimura andJütting (2009)
26 Chineseprovinces
1995-2001
Fixed effects regression with nationwide county-level fiscaldata as a proxy for decentralization: a measure of verticalbalance, and the ratio of counties’ aggregate expenditure tototal provincial expenditure. Other explicative variablesinclude: the provincial per capita GDP, the rural/urban ratioin the province, the provincial fertility rate, and the illiteracyrate.
The study finds that more decentralized provinces havelower infant mortality rates than more centralized ones.The authors conclude that in order for decentralization toachieve the desired effect it is important that countiesreceive intergovernmental transfers but it is also importantthat they have their own fiscal autonomy.

23
Source: Authors’ own elaboration.
Table 2: Advantages and disadvantages of main fiscal decentralization indicators
Variable Source Advantages Disadvantages
Proportion of sub national spending overthe total
IMF Long time series and cross sectional information Overestimation of real level of local autonomyif local expenditures are tightly controlled bythe centre
Proportion of sub national own revenuesover the total
IMF Long time series and cross sectional information Overestimation of real level of local autonomyif tax revenues controlled by the centre areclassified as sub national own-source revenue
Proportion of sub national own revenuesover the total
OECD (1999) Tax revenues can be classified according to the taxautonomy attributed to local governments,reflecting the true level of autonomy of localpolicy making
Small coverage: cross sectional information(1995) for 19 countries
Proportion of local government taxeswhere the local government controls thetax rate, the tax base, or both over thegeneral government
Stegarescu (2005) -Tax revenues can be classified according to thetaxautonomy attributed to local governments,reflecting the true level of autonomy of localpolicy making
-Large cross-sectional dataset: data for 23countries over the period 1965-2001
Non-periodical data, highly costly to update
Source: Authors’ own elaboration.
24
Table 3. Evolution of fiscal decentralization by countrya
AutTaxRevDecb ExpDecc
1965-1973
1999-2001
1970-1978
1996-2001
1. Austria 19,7 17,2 48,6 51,7
2. Australia 2,9 3,0 32,7 32,3
3. Belgium 6,6 24,6 14,2 28,1
4. Canada 52,1 51,7 54,5 61,3
5. Denmark 27,3 32,6 57,2 56,5
6. France 1,9 18,0 17,3 18,32
7. Germany 7,5 6,9 44,0 35,0
8. Ireland 13,8 2,3 27,7 25,14
9. Italy 6,4 14,1 17,0 26,6
10. Japan 28,3 37,9 47,7 35,75
11. Netherlands 2,2 5,0 33,5 27,22
12. New Zealand 9,1 5,5 38,5 10,7
13. Norway 30,4 20,2 36,5 33,8
14. Portugal 0,0 3,2 6,4 10,3
15. Spain 4,8 22,1 10,1 36,61
16. Sweden 30,8 44,7 42,8 37,9
17. Switzerland 54,3 51,5 57,2 49,8
18. United Kingdom 13,8 5,1 30,7 22,1
19. United States 34,4 35,9 45,0 49,4
a) Iceland, Finland, Greece and Luxembourg were dropped from Stegarescu’s datasetfor the analysis due to insufficient observations on control variables.
b) Earliest data is between 1965 and 1975 and latest data is between 1999 and 2001c) Earliest data is between 1970 and 1978 and latest data is between 1982 and 2001
25
Table 4. Descriptive statistics
Sources of data: A.- OECD.Stat Extracts; B.- Dan Stegarescu’s dataset (2005); C.-International Monetary Fund Government Finance Statistics (World Bank, 2010); D.- TheCEP-OECD Institutions dataset 1960-2004 (Nickell, 2006)
Variable Mean Std.Dev.
Min Max Definition Source
Infmort overall 11,8 8,1 2,4 64,9 Infant mortality rate per 1000 live births A
between 4,0 7,4 26,0
within 7,0 -9,1 50,8
AutTaxRevDec overall 19,2 16,7 0,0 61,5 Sub-national own tax revenue over general government total revenue. Taxesincluded in the numerator include only those where the sub-nationalgovernment can change the tax rate, the tax base or both
B
between 16,2 0,3 56,5
within 3,3 7,7 32,4
ExpDec overall 33,0 14,9 3,2 62,6 Sub-national government expenditure over total government expenditure C
between 15,5 4,0 59,4
within 3,7 20,6 49,7
Income overall 20363,5 6192,9 6814,6 54285,3 GDP per capita in 2000 US dollars A
between 4447,1 11457,1 32489,8
within 4433,9 8019,5 42159,1
Doctors overall 2,1 0,8 0,8 4,4 Practising physicians density per 1000 population A
between 0,6 1,3 4,0
within 0,6 0,7 3,7
Alcohol overall 10,7 3,7 3,1 20,8 Alcohol consumption, litres per capita A
between 3,4 4,5 17,5
within 1,6 5,8 15,6
Tobacco overall 33,6 8,7 18,7 61,0 Percentage of population who are daily smokers A
between 6,4 19,7 45,2
within 5,6 17,9 53,5
Education overall 8,3 2,0 2,4 12,1 Average years of schooling of population aged 15 years and over D
between 1,8 3,8 11,0
within 1,0 5,5 11,2

26
Table 5. Estimation results: Panel Corrected Standard Errorsa,b
Infant mortality (ln)
Regressors (ln) Coef. z Regressors (ln) Coef. z
AutTaxRevDec -0,05*** -3,1 ExpDec -0,18*** -3,3
Income -0,22* -1,7 Income -0,16 -1,2
Doctors -0,17* -1,8 Doctors -0,18** -2,1
Alcohol 0,08 1,1 Alcohol 0,04 0,6
Tobacco -0,04 -0,9 Tobacco -0,04 -1,1
Education -0,21** -2,0 Education -0,27** -2,5
*** - significant at 1%; ** - significant at 5%; * - significant at 10%a- The estimations include country and year dummiesb- t statistics computed with panel corrected standard errors robust to heteroskedasticity and autocorrelation
Table 6. Estimation results: OLS with Newey-West standard errors
Infant mortality (ln)
Regressors (ln) Coef. z Regressors (ln) Coef. z
AutTaxRevDec -0,05** -2,2 ExpDec -0,29*** -4,7
Income -0,40** -2,4 Income -0,25 -1,4
Doctors -0,20* -1,7 Doctors -0,17 -1,6
Alcohol 0,11 1,2 Alcohol 0,01 0,1
Tobacco -0,07 -0,9 Tobacco 0,01 0,1
Education -0,29** -2,0 Education -0,33** -2,5
*** - significant at 1%; ** - significant at 5%; * - significant at 10%a- The estimations include country and year dummiesb- t statistics computed with Newey-West standard errors robust to heteroskedasticity and autocorrelation

27
Table 7. Estimation results: Feasible Generalized Least Squaresa,b
Infant mortality (ln)
Regressors (ln) Coef. z Regressors (ln) Coef. z
AutTaxRevDec -0,02* -1,7 ExpDec -0,13*** -2,7Income -0,20* -1,7 Income -0,15 -1,3
Doctors -0,09 -1,1 Doctors -0,07 -1,0
Alcohol 0,07 1,2 Alcohol 0,05 0,7
Tobacco -0,01 -0,2 Tobacco -0,01 -0,3
Education -0,22** -2,2 Education -0,25*** -2,7
*** - significant at 1%; ** - significant at 5%; * - significant at 10%a- The estimations include country and year dummiesb- t statistics computed with standard errors robust to heteroskedasticity and autocorrelation