Embed Size (px)
Citation preview

March 2010 © European Council for an Energy Efficient Economy
Is efficient sufficient?The case for shifting our emphasis in energy specifications to progressive efficiency and sufficiency
Prepared for the European Council for an Energy Efficient Economy (eceee) with funding from the European Climate Foundation and the U.S. Environmental Protection Agency’s ENERGY STAR Program.
Chris Calwell22 March 2010
© J
an D
jenn
er/S
CA
NP
IX
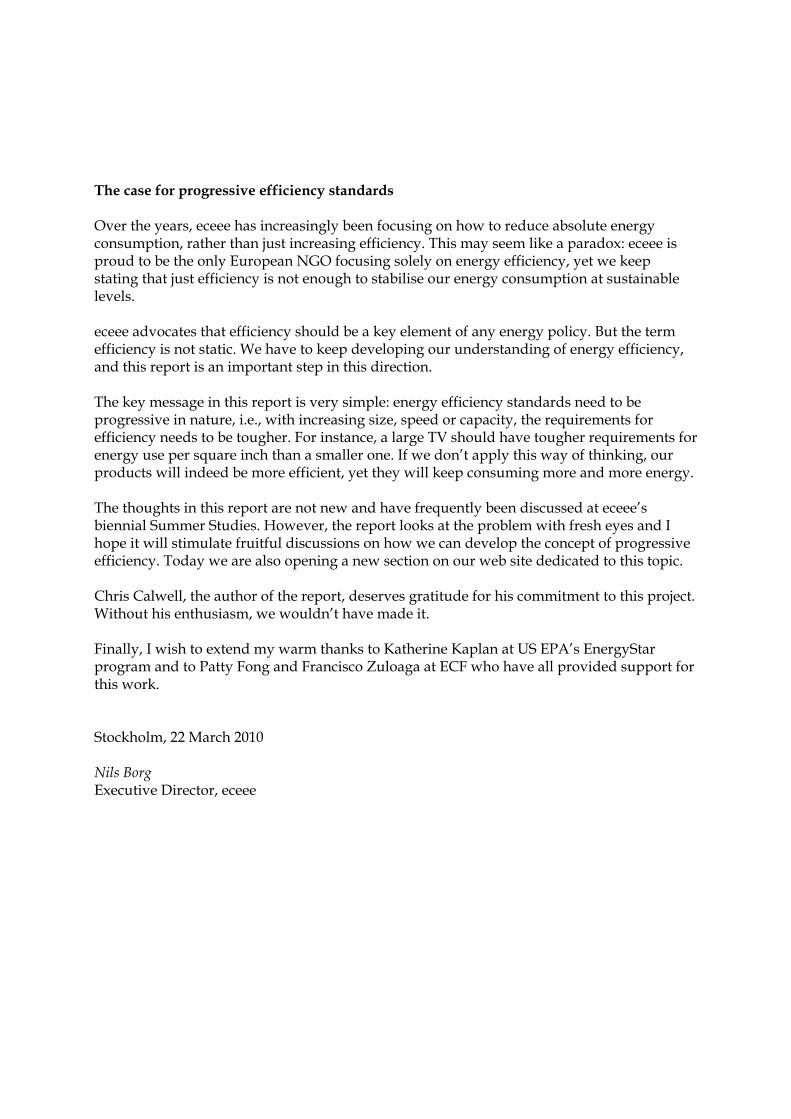
The case for progressive efficiency standards Over the years, eceee has increasingly been focusing on how to reduce absolute energy consumption, rather than just increasing efficiency. This may seem like a paradox: eceee is proud to be the only European NGO focusing solely on energy efficiency, yet we keep stating that just efficiency is not enough to stabilise our energy consumption at sustainable levels. eceee advocates that efficiency should be a key element of any energy policy. But the term efficiency is not static. We have to keep developing our understanding of energy efficiency, and this report is an important step in this direction. The key message in this report is very simple: energy efficiency standards need to be progressive in nature, i.e., with increasing size, speed or capacity, the requirements for efficiency needs to be tougher. For instance, a large TV should have tougher requirements for energy use per square inch than a smaller one. If we don’t apply this way of thinking, our products will indeed be more efficient, yet they will keep consuming more and more energy. The thoughts in this report are not new and have frequently been discussed at eceee’s biennial Summer Studies. However, the report looks at the problem with fresh eyes and I hope it will stimulate fruitful discussions on how we can develop the concept of progressive efficiency. Today we are also opening a new section on our web site dedicated to this topic. Chris Calwell, the author of the report, deserves gratitude for his commitment to this project. Without his enthusiasm, we wouldn’t have made it. Finally, I wish to extend my warm thanks to Katherine Kaplan at US EPA’s EnergyStar program and to Patty Fong and Francisco Zuloaga at ECF who have all provided support for this work. Stockholm, 22 March 2010 Nils Borg Executive Director, eceee

Table of Contents
Executive Summary .......................................................................................... 1 Introduction ........................................................................................................ 2
Background .......................................................................................................................... 3 Typical Approaches to Energy Efficiency Specifications ......................... 5
Linear Specifications ......................................................................................................... 5 Discontinuous Specifications .......................................................................................... 7
The Consumption Consequences of Our Current Efficiency Approach ............................................................................................................................... 9
Vehicles .............................................................................................................................. 11 Homes ................................................................................................................................. 14 Refrigerators ...................................................................................................................... 18
The Progressive Efficiency Approach – Applications to Televisions .. 20 The Broader Case for Progressive Efficiency ............................................ 25 Towards a More Holistic Approach ............................................................ 27 What Then Shall We Do? .............................................................................. 32
Specific Solutions ............................................................................................................. 34 Climate Implications ....................................................................................................... 36
Acknowledgments .......................................................................................... 38
i

ii
List of Figures Figure 1 (a and b): Linear efficiency specifications can indicate how much performance is required for each unit of power consumed or specify maximum allowable power use for each unit of performance ................................................................................................................... 6 Figure 2: ENERGY STAR computer specifications and product data (Ecos) ........................... 8 Figure 3: EISA Efficiency Standards for General Service Lighting (Ecos) ............................... 8 Figure 4: Vehicles in Europe and the US have increased engine power to a greater degree than they have reduced fuel consumption per kilometer traveled (UC Berkeley Transportation Center). .................................................................................................................... 12 Figure 5: Engine power began increasing steadily in the early 1980s (UC Berkeley Transportation Center). .................................................................................................................... 12 Figure 6: U.S. passenger vehicle evolution, 1975 – 2005 (Oak Ridge National Laboratory and US EPA) ....................................................................................................................................... 13 Figure 7 (a and b): Trends in U.S. passenger vehicles demonstrate a shift toward light duty trucks and a corresponding missed energy savings opportunity (Oak Ridge National Laboratory and US EPA). ................................................................................................................. 13 Figure 8: Primary energy use has risen by a factor of 3 in U.S. residential buildings and a factor of 4 in U.S. commercial buildings since 1950 (EIA 2008 Annual Energy Outlook). . 15 Figure 9: EU housing efficiency trends, 1990 – 2004 (Ecos analysis of EU data) ................... 16 Figure 10: Factors affecting increases in U.S. household energy use, 1975 – 2005 (Ecos analysis of US Census data). ........................................................................................................... 17 Figure 11: Attributes of new refrigerators in the EU (Bertoldi and Atanasiu) ...................... 18 Figure 12: Steady growth in the U.S. TV stock will be dominated by a shift to larger models (Ecos analysis for Northwest Power and Conservation Council). ............................. 21 Figure 13: Comparing California, European, and Australia TV efficiency requirements ( NRDC) ................................................................................................................................................. 22 Figure 14: Advertisement for ENERGY STAR television from Toshiba (left, Durango Herald) ................................................................................................................................................ 23 Figure 15: Advertisement for ENERGY STAR television from Mitsubishi (right, Durango Herald) ................................................................................................................................................ 23 Figure 16: U.S. voluntary and mandatory specifications for television efficiency (Ecos) ... 24 Figure 17: The IPAT formula .......................................................................................................... 27 Figure 18: Updating IPAT to include other meaningful factors yields IPALUCEMD . ..... 28 Figure 19: ACEEE projections of how an 80% greenhouse gas reduction might be achieved in the US. ............................................................................................................................................ 37

Is Efficient Sufficient? 1 22 March 2010
Executive Summary Physical limits in the atmosphere’s ability to absorb additional greenhouse gas emissions without causing fundamental changes in the earth’s climate lend a new urgency to efforts to reduce energy consumption. Central to those efforts is the art of defining, testing, and specifying the energy efficiency of particular products such as appliances, televisions, homes and vehicles that account for the majority of consumer energy use. Thus far, most governments have defined energy efficiency in a way that allows power consumption or annual energy use to rise steadily (and typically linearly) with product performance, size, amenity, or functionality. This helps consumers locate the least consumptive among a range of similar products, but does little to prevent absolute energy consumption from rising over time as products naturally migrate toward higher performance, larger size, and greater amenity and functionality. We have slowed the rate of growth compared to a business-as-usual scenario, but have not consistently turned absolute energy consumption or greenhouse gas emissions downward. Yet the capacity to do so clearly exists; we can do better. Given the steady growth in population and affluence, technology has been ineffective, by itself, in stemming that tide. I provide examples from past efforts in Europe and the United States to improve the efficiency of refrigerators, vehicles, and homes to illustrate why present approaches to defining, encouraging, and regulating particular levels of efficiency are no longer achieving the energy savings we need. What is needed instead is a more comprehensive view of the range of factors at work, so that more product attributes can be specified than merely efficiency, and so that the efficiency specifications themselves can be tailored to be more effective. I argue for the replacement of the traditional IPAT formula (Impact = Population x Affluence x Technology) with a new one (IPALUCEMD) that captures the simultaneous effects of population, acquisitiveness, luxury, utilization, carbon intensity, efficiency, manufacturing impacts, and durability on overall greenhouse gas impacts from products. In turn, this prompts consideration of overall sufficiency limits on total annual energy use or greenhouse gas emissions from a particular product type, regardless of its size or performance. I propose that progressive efficiency specifications be crafted where the allowable power consumption approaches those sufficiency limits and ceases to increase, no matter how much more performance or amenity is provided. ENERGY STAR has recently proposed exactly that in its version 5.0 television specification, which will help to reduce energy use and greenhouse gas emissions even as televisions continue to grow in size. Such specifications, when employed by programs that also recover and recycle the energy-using products consumers are replacing, reduce the greenhouse gas intensity of fuels, increase product durability, and minimize hours of use, have the potential to finally bring overall energy use and greenhouse gas emissions downward. Finally, I argue for a range of changes in the way voluntary and mandatory efficiency policies and programs are implemented to systematically implement sufficiency and progressive efficiency concepts, keep specifications up to date, and discourage excessive consumption through price and information signals. Long term, such profound changes are our only hope for reversing the extraordinary global risks of climate change.

Is Efficient Sufficient? 2 22 March 2010
Introduction Historically, the most important drivers of national and international energy policy have been issues like resource scarcity, energy security, air pollution, and cost effectiveness. Nations adopted formal policies to encourage shifts away from fossil fuel dependency to mitigate economic and national security risk. Likewise, they pursued strategies to reduce total energy consumption out of a desire to save money, improve trade deficits, reduce exposure to supply disruptions, and achieve environmental benefits within their own borders. Climate constraints have brought a new urgency and creativity to those pursuits, largely because they represent the first absolute upper bound on fossil fuel energy consumption. Given the fixed volume of the earth’s atmosphere, rising energy consumption and continued reliance on fossil fuels (absent a massive and low cost breakthrough on carbon capture and sequestration) will together drive the concentration of greenhouse gases in the atmosphere unrelentingly upward. That in turn will have profound impacts on the global climate, unless deliberate steps are taken to reduce energy use and the resulting emissions. The scientific community is increasingly convinced that we need a series of policies and programs that can move the world from the current 385 parts per million (ppm) atmospheric concentration of carbon dioxide down to 350 ppm by 2050 or earlier, recognizing that the concentration will get higher in the intervening decades before it begins to drop.1 Researchers first made the detailed case for such carbon budgets 20 years ago, 2 yet the majority of energy policies adopted since continue to be framed as if there were no absolute constraint on global greenhouse gas emissions. They are “directionally correct,” meaning that they aim to slow the rate of growth of the problem, but they are neither as stringent nor as all-encompassing as they need to be to stabilize the climate by 2050 or sooner. The EU-27 countries have collectively achieved an absolute reduction in greenhouse gas emissions of about 7.7% between 1990 and 2006, while U.S. emissions rose by 16% during the same period. Neither of these track records can be considered “success,” given the magnitude of reductions needed. Even in 2008, when unprecedented rises in energy prices were followed by a very rapid and severe economic recession, U.S. energy-related carbon dioxide emissions fell by only 2.8% and total energy demand by 2.2%. If the U.S. miraculously managed to sustain that pace of reductions in emissions and energy use each of the next 42 years, while somehow managing to grow its economy steadily, we would still fail to achieve the needed 80% reduction in greenhouse gas emissions by 2050. The scale of the problem demands more comprehensive and imaginative solutions for reducing energy consumption than we have managed to date. This paper examines how the United States and Europe could change their approaches to specifying, labeling, and mandating the energy use of consumer products in response to those increasingly urgent climate constraints. It begins by looking at past and present policy approaches to energy efficiency, examines alternative strategies, and then frames a new
1 See www.350.org/about/science. 2 Florentin Krause, Wilfred Bach, and Jon Koomey. 1989. From Warming Fate to Warming Limit: Benchmarks to a Global Climate Convention. El Cerrito, CA: International Project for Sustainable Energy Paths.

Is Efficient Sufficient? 3 22 March 2010
series of metrics, thought processes, and policy approaches that may help to achieve greater and more rapid reductions in greenhouse gas emissions.
Background Over the past 35 years, government agencies in the United States and Europe have enacted a variety of measures to reduce the energy consumed by consumer products like appliances, light bulbs, consumer electronics, and vehicles. These programs are generally considered to be some of the most successful elements of national and state energy policy in both regions. They are arguably politically less controversial than the construction of new power plants. They generally reduce expenditures (because the incremental cost of the energy-saving equipment is lower than the lifetime value of the resulting energy savings). They reduce air pollution and greenhouse gas emissions, while also helping to trim dependence on imported sources of energy. Some of these measures have been exhortations to reduce usage, generally referred to as “consumer education” or even “conservation programs.” They are primarily behavioral in nature, often urging consumers to temporarily endure less comfort or convenience (turning down thermostats in the winter) in return for saving money and helping their country through difficult times. These conservation programs are most commonly seen and aggressively practiced during short term periods of crisis such as oil embargoes, electricity shortages, or fuel price spikes. As such, they can be effective in achieving near-term reductions in total consumption, but are rarely credited with securing permanently lower consumption levels, especially once real prices return to historical levels and the moral urgency of the crisis passes.3 Another energy saving approach is taxation. European governments have shown a greater willingness than the U.S. federal or state governments to significantly tax the fuel itself as a means of reducing its consumption.4 This in turn can lead to a variety of consumer behaviors, including (in the case of vehicles) more vehicle sharing, reduced discretionary use (fewer kilometers or miles driven), increased preference for high fuel efficiency vehicles, and an increased inclination by car buyers or renters to choose very small vehicles for the majority of trips involving only one or two vehicle occupants. Still another approach is to use financial tools, marketing schemes, or regulations to encourage the sale of some products and discourage the sale of others. This can take a variety of forms:
• Tax credits or sales tax exemptions from government agencies for vehicles and appliances
• Preferred financing terms for homes or energy efficient/green mortgages • “Gas guzzler” taxes on the sale of vehicles
3 See, for example, Alan Meier’s work on the topic at the International Energy Agency and LBNL: http://www.oecdobserver.org/news/fullstory.php/aid/1666/Saving_energy_in_a_hurry.html and http://piee.stanford.edu/cgi-bin/docs/behavior/becc/2008/presentations/19-6A-04-How_Juneau_Alaska_Cut_Its_Electricity_Use_Over_30_Percent_in_Only_a_Few_Weeks.pdf. 4 Gasoline taxes were 4 to 7 times higher in various European countries than in the U.S. in 2006. See Daniel Sperling and Deborah Gordon, Two Billion Cars: Driving Toward Sustainability, Oxford University Press, 2009, p. 162.

Is Efficient Sufficient? 4 22 March 2010
• Rebates from electric and natural gas utilities to the manufacturer, retailer, or ultimate purchaser of equipment
• Combinations of the third and fourth options into sliding-scale, revenue-neutral fees and rebates assessed on energy-using products, commonly referred to as “feebates” or bonus malus programs
• Codes of conduct or “voluntary agreements” that serve as voluntary energy performance standards
• Voluntary product labeling programs • Mandatory product labeling programs • Mandatory energy performance standards (MEPS), which are an important element
of any program portfolio, given their ability to prevent the sale of certain products entirely.
In each case, the qualifying thresholds for such policies must be determined with considerable input from stakeholders and quantitative rigor. The stakes for manufacturers are high. Some will face greater obstacles to selling particularly inefficient products, while others will be allowed to label particular products as “energy efficient” and earn rebates for their sale. What, in fact, does it mean for a product to be efficient? The scientific notion of “efficiency” did not acquire its present meaning until the discipline of physics first yielded quantitative metrics for energy and power. In the early 1800s, inventors began to develop mechanical devices like the steam engine to harness energy sources other than muscle power to deliver useful work. Only then did it become important to have a quantifiable means of comparing the relative effectiveness of one device vs. another in making use of scarce and costly fuels to accomplish a needed task. University of Michigan professor Thomas Princen found labor- and time-related uses of the term “efficiency” in economics and management literature thereafter, and even in the way governments and homemakers approached their work, but most seemed to stem from the term’s early application to mechanical systems. 5 Today, he notes, those terms have somewhat blurred to the point where “efficiency” is both pervasive and broadly applauded as some general measure of effectiveness, yet few people have a precise sense of its meanings or its origins:
It is hard to appreciate, for instance, how prevalent efficiency is in everyday decision making and policymaking generally. No one talks about it. It’s just there: of course it’s better if it’s more efficient. For me, one of the big surprises in this study was the absence of a history of the idea of efficiency. There are histories aplenty on the ideas of expansion and progress and conservation, not to mention industrialization and democracy. But the history of an idea so central to the two most dominant disciplines in modern life – engineering and economics – is missing. How can this be? I am still perplexed. I can only surmise that the absence of such a history owes to the very status of the concept: it is indeed the water in which we swim, a given that no fish among us need question.6
5 Thomas Princen, The Logic of Sufficiency, MIT Press, Cambridge, Massachusetts, 2005, pp. 51-52. 6 Thomas Princen, The Logic of Sufficiency, pp. 342-343.

Is Efficient Sufficient? 5 22 March 2010
Typical Approaches to Energy Efficiency Specifications To be useful to policymakers and markets, energy efficiency levels must be defined, measured, quantified, and analyzed. They typically represent the ratio of useful output to total input. Normally this ratio is calculated by first establishing product-specific energy use and performance metrics, then creating standardized test procedures to measure them both under precise, repeatable laboratory conditions, and then dividing one by the other. To all of us that work in this field, that quantifiability has been a big part of the appeal. It is gratifying to take two products nominally designed to accomplish the same task, measure them both, conclude that one requires half as much energy to do its job as the other, and then embark on a variety of governmental and market mechanisms for encouraging greater sales of the former than the latter. For similar reasons, the quest for greater energy efficiency has attracted broad support among diverse stakeholders, given its appeal to minimizing waste, saving money, and decoupling environmental benefit from any sense of sacrifice or inconvenience. Conversely, there are few political constituencies that explicitly favor wasting more energy, though some will oppose particular efficiency measures for financial reasons or due to a general opposition to government “intrusion” in markets. Except for the protests from particular manufacturers and their trade associations that higher energy efficiency can increase the upfront cost of a given product, few individuals or organizations normally rise in protest over efforts to encourage greater product efficiency.7 Indeed, the very notion of efficiency is that a given level of product service, functionality, performance, amenity, or size can be provided for a smaller amount of power or energy consumed, thus increasing the energy efficiency of the device in question. In practice, a higher level of product service, functionality, performance, amenity or size is often provided for the same amount of power or energy consumed, increasing energy efficiency but not reducing absolute consumption. I will return to this issue later in the paper.
Linear Specifications Common efficiency ratios include lumens/watt (lighting), liters/100 km or miles per gallon (vehicles), CFM (cubic feet per minute)/watt (fans), and watts/square foot or kWh/square meter (buildings). Likewise, there are various unit-less efficiency percentages for devices like transformers and power supplies that simply divide useful output power in watts by total input power in watts. Such metrics lead naturally to linear specifications in which the numerator is allowed to increase by a certain amount for each corresponding increase in the denominator, or vice versa.8 An EPA ENERGY STAR ceiling fan specification of 75 CFM/watt, for example
7 There are exceptions, as evident in the hoarding of conventional incandescents that occurred when incandescent lamp phaseouts were announced in parts of Europe. See www.eceee.org/news/news_2009/2009-09-01. 8 Note that there is no consistency among efficiency metrics regarding whether the service provided is divided by the energy or power needed to provide it, or vice versa. Thus, with some efficiency metrics, higher numbers are considered more advantageous (CFM/watt, lumens/watt). The opposite is true for other metrics (liters/100 km). I adopt the convention below of dividing the service provided by the power

literally states that for each additional 75 cubic feet per minute of airflow provided, another watt of power consumption is allowed. This equation follows the form y=mx and requires that only the slope or efficiency level (m) be specified. A graph of CFM vs. watts in this case would pass through the origin and rise sharply (Figure 1a). When the specification needs to be made more stringent, ENERGY STAR can simply increase the slope.
Power Use (watts)
Perfo
rman
ce o
r Siz
e
Y=MX (linear specification)
Y=MX (more stringent linear specification)
Power Use (watts)
Perfo
rman
ce o
r Siz
e
Y=MX (linear specification)
Y=MX (more stringent linear specification)
Performance or Size
Pow
er U
se (w
atts
)
Y=MX+B (more stringent linear specification)
Y=MX+B (linear specification)
Performance or Size
Pow
er U
se (w
atts
)
Y=MX+B (more stringent linear specification)
Y=MX+B (linear specification)
Figure 1 (a and b): Linear efficiency specifications can indicate how much performance is required for each unit of power consumed or specify maximum allowable power use for each unit of performance
A second approach is to specify both a slope (m) and a y-intercept (b): y=mx+b. Figure 1b above illustrates an example with the axes reversed from the previous example. Here, the formula acknowledges that some power consumption (b) will occur regardless of the service provided. Television efficiency specifications proposed in Europe, Australia and the U.S. so far have largely followed this format. The y-intercept accounts for standby consumption in the power supply and remote control circuitry, as well as fixed losses in the tuning circuitry, regardless of which channel is being displayed, how bright the picture is, or how large the screen area is. Allowable power (y) = a particular efficiency in watts/square inch (m) multiplied by the screen area (x) + the fixed power consumption (b). Policymakers can increase stringency over time by reducing the slope or the y-intercept or both as the various component technologies improve.9 Both of these approaches are linear and continuous, meaning that there are no inflection points in the specification where manufacturers can make a small change to product size or amenity in order to gain a significant advantage complying with the specification. Such specifications provide equal pressure on the marketplace to improve, provided that the physics governing that particular product’s energy efficiency potential actually follow a linear relationship. Many technologies do not follow such a linear relationship, but policymakers’ and program administrators’ natural preference for simplicity and the ready ability of spreadsheets to fit lines to data sets frequently cause them to favor a linear approach regardless.
consumed, and then treating the time over which that power consumption occurs separately, to account for user behavior separately from product performance.
Is Efficient Sufficient? 6 22 March 2010
9 Merely changing the y-intercept and leaving the slope the same is usually the least impactful on overall consumption, because it allows power use to continue rising steadily with the natural increases in product performance, size or capability that are already occurring in the marketplace each year.

Is Efficient Sufficient? 7 22 March 2010
Within the eco-design and labeling Directive frameworks regulating minimum energy performance standards, the European Union commonly establishes a linear energy efficiency index (EEI) or formula describing the physical relationship between an average product’s power use and its functionality. It then proposes minimum energy performance standards (MEPS) in a regulation setting “eco-design requirements.” When applicable, the EU also establishes mandatory labeling levels as simple percentage multiples of that EEI as a way to increase the mathematical simplicity and transparency of its policy proposals and telegraph future regulatory intent to manufacturers over a long term planning horizon. Much of the stakeholder debate is thus focused on whether the original EEI relationship is correct and the percentage by which products need to improve to earn various levels of recognition, rather than on the subjective reasons for choosing a particular slope and y-intercept level. Princen notes that linear efficiency metrics bring with them a set of key limitations. Because they generally reflect the ratio of only one measure of useful work or output to one measure of total power or energy input, they tend to oversimplify the virtues and drawbacks of any particular product. A lumens/watt metric, for example, correctly shows a light bulb purchaser that a compact fluorescent lamp is about 3 to 4 times as energy efficient as a conventional incandescent lamp. However, that metric reveals nothing about CFLs’ additional advantages of far longer lamp life or lower solid waste burden, nor their disadvantages with regarding to dimming capability and directionality of light. Other minimum requirements, definitions, or product categories must accompany a lumens/watt specification in order to ensure the purchaser gets a desirable product.10
Discontinuous Specifications It is increasingly common for policymakers to depart from continuous specifications in various ways. They can propose discontinuities in product specifications where sudden jumps in allowable power use occur at particular product sizes to accommodate the technologies prevalent in those size classes. ENERGY STAR’s version 3.0 television specification follows this approach, along with a relatively steeply sloped line (allowing large increases in power use with increasing screen size). As a result, more than the intended 25% of available models complied with it when the specification first took effect in November 2008, and the vast majority of available U.S. models comply with it today.11 A second discontinuous policy approach divides a continuous set of products into discrete performance categories, each of which is held to a different efficiency requirement or maximum power limit. The ENERGY STAR Version 5.0 computer specification, for example, employs Categories A, B, C, and D to characterize different levels of computer capability (number of processors and cores, memory size, multimedia performance, etc.), making different annual energy consumption allowances for each. The distribution of annual energy consumption values remains quite wide and similar in shape in all four power categories. There are some differences at the lower end of each range, but models exist in all four performance categories that can achieve Category A’s requirements (see Figure 2). The Category A allowance is more stringent than the one that preceded it (in Version 4.0) for the least powerful computers, but the Category D requirement allows slightly greater energy use than the highest performance category in the previous specification, while the new Category C requirement is now higher than the previous
10 Thomas Princen, The Logic of Sufficiency, pp. 90-94. 11 See Noah Horowitz, NRDC Comments on EPA’s April 2009 Draft Requirements for TVs – Version 3.1, Natural Resources Defense Council, May 19, 2009.

Category A requirement. Given the continuous migration of consumer preferences toward higher product performance, the risk remains that overall computer energy consumption continues to rise over time, even as efficiency specifications attempt to keep pace by recognizing the least consumptive among the high performance products.
0
100
200
300
400
500
600
700
0 100 200 300 400 500 600 700 800
Number of Desktops
Typi
cal E
nerg
y C
onsu
mpt
ion
(kW
h)
ENERGY STAR 4.0
ENERGY STAR 5.0
Category A
Category B
Category C
Category D
Figure 2: ENERGY STAR computer specifications and product data (Ecos)
Similarly, the U.S. requirements for general service lighting adopted in the Energy Independence and Security Act (EISA) of 2007 divide light bulbs into a set of very broad lumen bins and stipulate a wattage cap for each. This sounds appealing, but plotting the standards on an efficiency vs. lumens basis instead makes the drawbacks clear (Figure 3).
Is Efficient Sufficient? 8 22 March 2010
igure 3: EISA Efficiency Standards for General Service Lighting (Ecos)
F
Lumen bin 1 Lumen bin 2 Lumen bin 3 Lumen bin 4

Is Efficient Sufficient? 9 22 March 2010
ven though incandescent lamps become steadily more energy efficient as they get brighter,
g
s manufacturers
size”
his
odified spectrum light bulbs to the
y is specifically and intentionally not about conservation. Its proponents
ss
Ethe standard’s stringency does not follow the laws of physics. Instead, it includes a set of deep valleys that allow manufacturers to sell dimmer-than-average lamps in order to comply cheaply, and at lower efficiencies. The first new products do precisely that, offerincustomers less light than they would get from standard soft white bulbs in each lumen bin. The average efficiency level of the standard appears to be quite high, but the efficiency levels where real products will actually be built and sold are much lower.
hese types of specifications exhibit profound boundary effects over time aTgain experience with how to manipulate them. At the margins, differences in product capability between one category and another will be modest, yet manufacturers will have a strong incentive to move from one category to another in their next design cycle if the allowable power difference is significant. In the case of the U.S. lighting standards, customers who want the same or more light from the new bulbs will be tempted to “upto the next lumen bin, reducing or eliminating the resulting energy savings.
olicymakers can also develop functional adders that increase allowable power use for each Pof a variety of additional product features or capabilities. ENERGY STAR’s version 4.0 computer specification and the EU’s EcoDesign directive for general service lighting products both follow this approach, as has the EU’s Code of Conduct for set top boxes. Tapproach is more granular than wholly separate product categories, but also can have the effect of allowing overall energy use to migrate ever-higher over time as new product features and capabilities are introduced. Long before manufacturers solved the problem ofhigh standby power consumption in conventional set top boxes, government agencies were granting them additional functional adders for high definition capability, and digital video recording capability, and an even higher adder for incorporating both features. Yes, the qualifying products will be more efficient than non-qualifying ones, but overall consumption marches ever higher. Where does it end?
ISA follows a functional subtractor approach, holding mEsame power limits as conventional incandescent bulbs, but allowing them to be significantly dimmer. Nothing prevents manufacturers from shifting the majority of their marketing emphasis and manufacturing capability toward the less efficient (lower lumens per watt) products over time. This would significantly undercut the anticipated energy savings fromthe standards just as the market shift from cars to SUVs and light trucks reduced the savingsfrom fuel economy standards. Time, money and talent get committed to meeting the letter of the law rather than its spirit, and all the while, greenhouse gases continue to accumulate in the atmosphere.
The Consumption Consequences of Our Current Efficiency Approach
nergy efficiencEhave gone out of their way to make clear that efficiency improvements allow reductions inenergy use without the corresponding inconvenience or loss of amenity that is the hallmarkof conservation. Instead, efficiency might best be thought of as a measure of relative consumption. Bigger, more powerful, more functional products get to use proportionally more energy or power and still be labeled as efficient or earn rebates, as long as they use leenergy than other equally big, powerful, functional products. Such thinking has been at the

Is Efficient Sufficient? 10 22 March 2010
his has, as a rule, been a reasonable way to approach the efficiency question as long as on
e should not be surprised when efficiency gains for a given product from typical policy e
This paradox is sometimes referred to as ‘Jevons’s paradox’ after economist
s f
ll thus
mic
he effect has been particularly profound with lighting. Research by Nordhaus indicates
han ever
Daniel Khazzoom, Harry Saunders, Horace Herring, Mithra Moezzi, and J.S. Norgard,
terms
heart of the ENERGY STAR labeling program since its inception, and is a concept held dear by the many manufacturers that participate in the program. Tthere were no absolute limits on how much energy we could consume or how much carbwe could emit. Efficiency policies have allowed us in many cases to slow the rate of growth in absolute energy consumption, but not yet level it out or reduce it except in rare instances. Much of the absolute savings we hoped to achieve have been traded off against greater amenity and functionality. Wapproaches turn out to be larger than the resulting consumption savings. Not only are somof the efficiency gains traded off against greater amenity, but they can lead to greater usage as well. As Jack Manno documents, this effect was first observed more than a century ago inEngland:
Stanley Jevons, who pointed out in 1864 that efforts to conserve English coal by increase the coal-use efficiency of British steam engines ended up making steam power cheaper compared to human and animal power, in the end stimulating increased coal consumption. Likewise, production efficiencieunaccompanied by brakes on consumption tend to bring the consumption oenergy and materials to levels greater than what existed before the production efficiencies were introduced. Energy-efficiency gains wionly be successful in uncoupling improved quality of life from increased energy use if they are accompanied by comprehensive political and econostrategies to reduce consumption.12
Tthat the real cost of a lumen of light from an artificial light source has fallen by nearly 4 orders of magnitude over the last 200 years.13 As a result of various technological improvements in the efficiency and durability of light sources, it is less expensive tto purchase lumens. What has tempered that effect has been the steady rise in energy costs, to the point where operating costs may be rising, even if purchase costs are falling. J.among others, brought renewed attention to this issue in the 1980s and 1990s in the academic literature and in various presentations at energy conferences.14 They usedlike “takeback,” “the rebound effect,” or “bounceback” to describe what happens when more energy efficient technologies lower the cost of using a particular device, allowing
12 Jack Manno, “Commoditization: Consumption Efficiency and an Economy of Care and Connection,” in Confronting Consumption, p. 68. 13 William D. Nordhaus, “Do real-output and real-wage measures capture reality? The history of light suggests not,” The Economics of New Goods, 1997, pp. 29-70. 14 See, for example: J. Daniel Khazzoom, “Energy Savings Resulting from the Adoption of More Efficient Appliances,” Energy Journal, Vol.8, No.4, 1987, pp. 85-89; Harry Saunders, “The Khazzoom-Brookes Postulate and Neoclassical Growth,” Energy Journal, Vol. 12, No. 4, 1992, pp. 131-148; Horace Herring, “Does Energy Efficiency Save Energy? The Debate and Its Consequences,” Applied Energy, 63/3, July 1999, pp. 209-226; Mithra Moezzi, The Predicament of Efficiency, 1998 ACEEE Summer Study on Energy Efficiency in Buildings, 1998; J.S. Norgard, Efficient Technology in an Inefficient Economy, 1995 ECEEE Summer Study, 1995.

Is Efficient Sufficient? 11 22 March 2010
ng
they
ome of what has been written about takeback feels like an overreaction – an attempt to ot
or e
turn next to three sets of examples – vehicles, homes, and refrigerators – to examine how
Vehicles
ost of the international policy focus on vehicle energy use has centered around efforts to f
• vehicles are able to drive much further on a liter of fuel today than they once did
tant over time but engines have become far
to drive a little further on a liter of fuel today than they once did,
people to use it more extensively to gain additional comfort or amenity without increasifinancial outlay. Some who hold this belief have reached the conclusion that energy efficiency efforts may make microeconomic sense for the particular end use to which are applied, but that their macroeconomic effect is to increase overall energy consumption,making the problem they originally intended to solve even worse. Others believe the effect is real but modest in the face of other factors that are contributing to rising economic wealth generally. They conclude that well-designed efficiency programs still generate net savings in spite of the resulting takeback effects, which can sometimes amount to 5 to 30% of the anticipated total savings. As Sussex University’s Steve Sorrell described the described theissue in a 2007 report, “It doesn’t mean energy efficiency is a waste of time… [However,] standards on efficiency will not be sufficient by themselves.”15 Sexpand a legitimate concern about particular aspects of efficiency programs into reasons nto pursue them at all. Yes, consumers can take back some of the anticipated energy savings from an energy efficient program by purchasing more amenity or increasing their usage of the device, but solutions to both are at hand. The alternative – giving no regard to the efficiency with which devices consume energy and doing nothing to label, incentivize, reward it – is tantamount to surrender in the face of a truly compelling need to stabilize thclimate. I efforts to improve efficiency have impacted overall consumption in the U.S. and Europe.
Mimprove fuel efficiency. Figure 4 looks not just at fuel efficiency over time, but at the ratio ofuel intensity (liters/km) to engine power (measured in kW), and how that has changed over time.16 These curves consistently decline by about 40 to 70% over 20 to 30 years, suggesting one of three possible explanations:
while holding engine power constant • fuel efficiency has remained fairly cons
more powerful • vehicles are able
and engines have become more powerful.
15 See Traci Watson, “Consumers can sabotage energy-saving efforts,” USA Today, March 23, 2009. 16 Lee Schipper, Fuel Economy, VMT, and Transport Policy: They All Matter to Restraining GHG Emissions, 2008 Presentation, UC Berkeley Transportation Center.

Figure 4: Vehicles in Europe and the US have increased engine power to a greater degree than they have reduced fuel consumption per kilometer traveled (UC Berkeley Transportation Center).
In fact, the steady rise in engine power since 1983 has been decisive, particularly in US light trucks, which now have twice the average power that U.S. cars did in 1970:
Figure 5: Engine power began increasing steadily in the early 1980s (UC Berkeley Transportation Center).
Is Efficient Sufficient? 12 22 March 2010

This effect can be seen more clearly in a detailed look at U.S. passenger car data from Oak Ridge National Laboratory and US EPA (Figure 6). Note that automakers have kept interior volume virtually unchanged in U.S. passenger cars for more than 30 years, while increasing top speed, acceleration capability, and engine power by 22 to 43%. Virtually all of the gain in fuel economy since 1975 came from temporary reductions in engine power between 1975 and 1983, with subsequent technology advances devoted to improving amenity while holding miles-per-gallon roughly constant.
Figure 6: U.S. passenger vehicle evolution, 1975 – 2005 (Oak Ridge National Laboratory and US EPA)
This tells the story of what has happened per vehicle, but obscures the steady shift from cars to light trucks and the far greater usage and prevalence of vehicles over time.
Figure 7 (a and b): Trends in U.S. passenger vehicles demonstrate a shift toward light duty trucks and a corresponding missed energy savings opportunity (Oak Ridge National Laboratory and US EPA).
Is Efficient Sufficient? 13 22 March 2010

Is Efficient Sufficient? 14 22 March 2010
Americans have continually increased cars per person or miles traveled per car or both with each passing year, at least until the 2008 fuel price increases and ongoing global recession temporarily interrupted the trend. Because of the steady migration of buyers toward light trucks and sport utility vehicles, the increase in total number of vehicles on the road, and the increase in their average distance driven, overall fuel use in the U.S. rose from 93 billion to 136 billion gallons (352 to 515 billion liters) per year between 1975 and 2006. Without fuel efficiency requirements, that total would have risen to approximately 165 billion gallons (625 billion liters) per year (Figures 7a and 7b). Proponents would say those requirements reduced fuel use by 18%. Critics would say that the overall amount of fuel burned and carbon dioxide emitted to the atmosphere rose by 46% in spite of national fuel economy requirements, suggesting that fuel economy requirements were necessary, but by no means sufficient to address the problem at hand. If we widen our view beyond the U.S. and Europe, vehicles in particular look like a situation where the sheer rise in units sold and miles driven is swamping any gains that have been achieved with efficiency. We are rapidly headed toward a world in which 2 billion cars are on the road, and firms like Tata are aiming to increase that even further by getting the price of a new car down to roughly $2,000. Still the proponents of such vehicles focus on their high efficiency and low emissions per mile, rather than on the collective environmental impacts of that much driving:
Environmentalists, however, fear the Nano will accelerate congestion on India's already crowded, pot-holed roads and add to choking pollution. "Every car that goes on the road is going to use road space. We're only adding to congestion," said Rajendra Pachauri, head of the UN's climate panel, which won the 2007 Nobel Prize. Tata countered by saying that the Nano was the least polluting car in India, emitting 101 grams of carbon dioxide per kilometre.17
Social critic Lewis Mumford saw the inherent drawbacks of focusing mostly on efficiency metrics nearly 40 years ago when he looked at governments’ early efforts to restrain the environmental impacts of automobility and wrote, “There is only one efficient speed: faster; only one attractive destination: farther away; only one desirable size: bigger; only one rational quantitative goal: more.”18 I return to these concerns in the Holistic Approach section below, as I examine the other factors beyond efficiency that need to be addressed to stabilize and reduce overall consumption.
Homes At the most fundamental level, if buildings and the equipment we put in them are becoming radically more energy efficient over time, it should be possible to achieve net reductions in the total energy used by those buildings, even if the total square footage per building and number of buildings continue to rise. But that has not been the case. The rate of growth has certainly been slower since 1970 in the United States than it was between 1950 and 1970, but
17 See http://www.google.com/hostednews/afp/article/ALeqM5g9a_9kUx_AAqyg0-IvFZpUW6gsdg, accessed March 23, 2009. 18 Lewis Mumford, The Myth of the Machine: The Pentagon of Power, Harcourt Brace Jovanovich, 1970, p. 173.
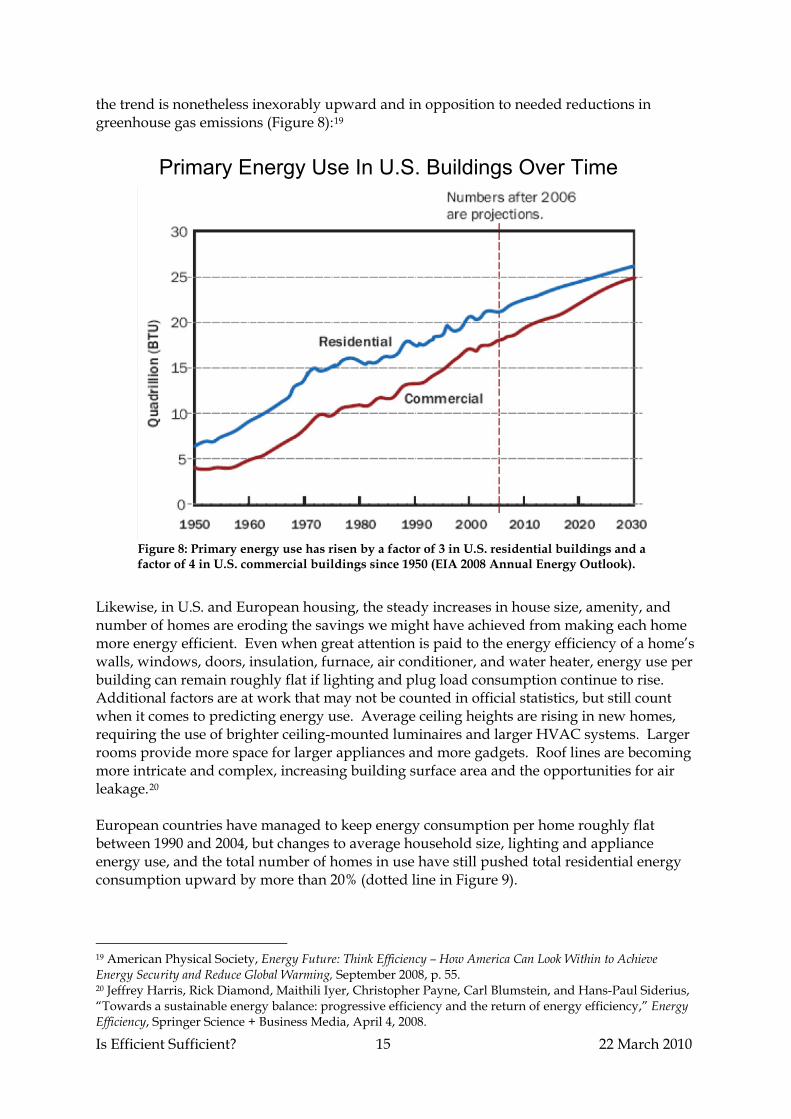
the trend is nonetheless inexorably upward and in opposition to needed reductions in greenhouse gas emissions (Figure 8):19 Primary Energy Use In U.S. Buildings Over Time
Figure 8: Primary energy use has risen by a factor of 3 in U.S. residential buildings and a factor of 4 in U.S. commercial buildings since 1950 (EIA 2008 Annual Energy Outlook).
Likewise, in U.S. and European housing, the steady increases in house size, amenity, and number of homes are eroding the savings we might have achieved from making each home more energy efficient. Even when great attention is paid to the energy efficiency of a home’s walls, windows, doors, insulation, furnace, air conditioner, and water heater, energy use per building can remain roughly flat if lighting and plug load consumption continue to rise. Additional factors are at work that may not be counted in official statistics, but still count when it comes to predicting energy use. Average ceiling heights are rising in new homes, requiring the use of brighter ceiling-mounted luminaires and larger HVAC systems. Larger rooms provide more space for larger appliances and more gadgets. Roof lines are becoming more intricate and complex, increasing building surface area and the opportunities for air leakage.20 European countries have managed to keep energy consumption per home roughly flat between 1990 and 2004, but changes to average household size, lighting and appliance energy use, and the total number of homes in use have still pushed total residential energy consumption upward by more than 20% (dotted line in Figure 9).
19 American Physical Society, Energy Future: Think Efficiency – How America Can Look Within to Achieve Energy Security and Reduce Global Warming, September 2008, p. 55. 20 Jeffrey Harris, Rick Diamond, Maithili Iyer, Christopher Payne, Carl Blumstein, and Hans-Paul Siderius, “Towards a sustainable energy balance: progressive efficiency and the return of energy efficiency,” Energy Efficiency, Springer Science + Business Media, April 4, 2008.
Is Efficient Sufficient? 15 22 March 2010

Trends in EU Housing Efficiency, 1990 - 2004
-10%
-5%
0%
5%
10%
15%
20%
25%
30%
1990 1992 1994 1996 1998 2000 2002 2004
Perc
enta
ge C
hang
e
Stock of DwellingsEnergy Consumption per Dwelling Lighting and Electrical Appliances Consumption per DwellingNumber of Dwellings per 1000 People
Total Residential Energy ConsumptionSpace Heating Consumption per Dwelling
Figure 9: EU housing efficiency trends, 1990 – 2004 (Ecos analysis of EU data)
A similar pattern is evident in the U.S. Smaller family sizes and delayed incidence of marriage have caused average household size to drop by about 12% over the last 30 years, even as average square footage of a new home rose 57%. As a result, the average purchaser of a new home now has 80% more available living space per person than he or she did just 30 years ago (Figure 10). Moreover, the dramatic reductions in total residential energy consumption that were achieved between the mid-1970s and mid-1980s have now largely been erased. Even with radical improvements to insulation and air sealing measures, windows, furnaces, air conditioners, duct systems, water heaters, appliances, and lighting technology, American homes now use more energy in total than they did in 1978 (primarily because there are so many more homes and each, on average, is significantly larger).21 The impact of luxury alone can often swamp the gains from efficiency:
In 1998, Environmental Building News published an article comparing energy and materials use in large and small houses. Using data compiled by the NAHB and Energy Balance, the article showed that a 1,500-square-foot home with low energy performance standards will use less energy for heating and cooling than a 3,000-square-foot house with high energy performance standards. Because big houses tend to have more design features, the NAHB
Is Efficient Sufficient? 16 22 March 2010
21 Jeffrey Harris et. al., April 4, 2008, p. 6.

also estimated that large homes consume proportionately more materials. Thus a 5,000-square-foot house will consume three times as many resources as a 2,085 square-foot house, even though its square footage is only 2.4 times greater.22
Figure 10: Factors affecting increases in U.S. household energy use, 1975 – 2005 (Ecos analysis of US Census data).
At least four major studies have now been conducted since 2002 in Wisconsin, New York, Arizona, and Nevada comparing the annual energy use of ENERGY STAR-labeled homes to non-labeled homes in the same locations. Most of the studies found that ENERGY STAR homes tend to use a similar amount of energy or more than non-ENERGY STAR homes, mostly because the labeled homes are, on average, larger. They are more efficient per square foot, but contain more square feet of living space. The Arizona study in particular indicated that electricity use averaged 12% higher in ENERGY STAR homes in their region.23 The “green” aspects of ENERGY STAR homes are, on average, more attractive to affluent buyers and the builders that cater to them, which explains much of the increase in house size.
ENERGY STAR has proposed a revised specification approach for 2011 that would begin to address that issue by requiring a lower HERS score (higher efficiency) for homes larger than a given “typical” size for the number of bedrooms they have. This approach is intended not to penalize homes for including a larger number of bedrooms than average, but to size-normalize to some extent for a given number of bedrooms. Such an approach should bring an element of progressivity to home efficiency labeling in the U.S., though it may also 22 Linda Baker, “Great big green monster mansions,” salon.com, www.salon.com/tech/feature/2004/07/07/green_big_houses/print.html, July 7, 2004.
Is Efficient Sufficient? 17 22 March 2010
23 See Martin Holladay, “Rasing the Bar for Energy Star Homes,” posted at: http://www.greenbuildingadvisor.com/blogs/dept/musings/raising-bar-energy-star-homes, April 29, 2009.

encourage builders to characterize as bedrooms many of the additional multi-purpose rooms they include in their large houses.
Refrigerators Refrigerators are one of the few cases where the improvements in product efficiency may have been dramatic enough to overcome the growth in product size, amenity, and number of units in use within a given country for particular periods of time. The EU and the U.S. have seen absolute drops in residential refrigerator energy use during particular time periods. However, the magnitude is difficult to quantify, in part because rapid improvements in the efficiency of new models take a long time to permeate through the existing stock, and in part because different stock models yield widely different estimates. Some European data suggest that total refrigerator energy use declined by more than 25% since 1975, even as the total number of refrigerators in use has risen by 50% and their average size grew by 30%.24 Likewise, some U.S. studies indicate that total refrigerator energy use is dropping by 2.2% per year, while others show annual increases of 1.2% per year or more.25
Figure 11: Attributes of new refrigerators in the EU (Bertoldi and Atanasiu)
24 Paolo Bertoldi and Bogdan Atanasiu, Electricity Consumption and Efficiency Trends in the Enlarged European Union – Status report 2006, Institute for Environment and Sustainability, EUR 22753 EN, 2007; and Ademe and PW Consulting, Cold II: The Revision of Energy Labelling and Minimum Energy Efficiency Standards for Domestic Refrigeration Appliances, December 2000. 25 Mithra Moezzi and Rick Diamond, Is Efficiency Enough? Towards a New Framework for Carbon Savings in the California Residential Sector, prepared by Lawrence Berkeley National Laboratory for the California Energy Commission’s Public Interest Energy Research (PIER) program, CEC-500-2005-162, October 2005, pp. 40-41.
Is Efficient Sufficient? 18 22 March 2010

Is Efficient Sufficient? 19 22 March 2010
Good data exist on the attributes of new refrigerators sold, however. If we look only at the attributes of new models (Figure 11), it is evident that annual sales have risen by more than 60% in the EU since 1975, the average new refrigerator’s interior volume has risen by more than 25%, but efficiency has improved even faster. The average new model sold today consumes about 75% less electricity per liter of interior volume than its 1975 predecessor. As a result, the annual energy use of all the EU refrigerators sold in 2009 was actually about 33% lower than it was in 1975, even with the growth in sales and average size, but the total stock consists, of course, of refrigerators sold in many prior years as well.26 The U.S. story is fairly similar, with efficiency improving radically since the early 1970s. Average energy use per new refrigerator sold has fallen from more than 1600 kWh/year to less than 500 kWh/year, even as average interior volume has grown by 17%. Annual sales have grown steadily: between 1992 and 2006, they increased from 10.1 to more than 14 million units per year27 and are projected to continue rising indefinitely by about 650,000 units per year. However, given the long lifetimes of refrigerators and the continued popularity of second units in the garage or basement, the overall consumption estimates are less encouraging than the efficiency or annual usage per unit estimates. DOE data confirm that more American households (22%) now have a second refrigerator in operation than at any time since they began conducting surveys in 1980, and more than half of those units are at least 10 years old.28 About 156 million refrigerators of all sizes are currently in use in US homes, consuming about 151 billion kWh/year, or about 968 kWh/year apiece.29 Moreover, the most popular U.S. refrigerator type, side-by-side, is the least energy efficient for a given amount of interior volume provided. Even a highly efficient side-by-side model can use more energy per year than a fairly typical top-bottom design of similar size. It seems likely that global energy use and greenhouse gas emissions associated with residential refrigerators have continued to rise steadily (albeit at a slower pace than they would have without efficiency standards) in spite of efficiency gains and the benefits of phasing out CFCs.30 In the U.S. alone, annual refrigerator sales grew from 75,000 units in 1925 to 850,000 units in 1930 to more than 14 million units in 2006. Global sales are now more than 82 million units per year, growing by 4% per year, and will continue to rise as more and more people in the developing world gain access to the income and electrical infrastructure that enable them to purchase and use one. Partly due to this effect, residential electricity usage tripled in China during the 1990s and rose by 13% per year in Indonesia,
26 Lot 13: Domestic Refrigerators and Freezers: Final Report, Preparatory Study for Eco-Design Requirements of EuPs, 2007, available at www.ecocold-domestic.org/index.php?option=com_docman&task=cat_view&gid=16&Itemid=49 and Energy Consumption of Domestic Appliances in European Households, available at www.ceced.org/IFEDE//easnet.dll/GetDoc?APPL=1&DAT_IM=20429B&DWNLD=Stock_Model_ 27 Ecos Consulting estimates and Appliance Magazine, September 2007, p. 63 and May 2002, p. 51. 28 US Department of Energy, Energy Information Administration, 2005 Residential Energy Consumption Survey: Preliminary Housing Characteristics Tables, Table HC15.10, accessed at www.eia.doe.gov/emeu/ recs/recs2005/hc2005_tables/hc10homeappliaceindicators/pdf/tablehc15.10.pdf. 29 See http://www.eia.doe.gov/emeu/recs/recs2005/c&e/appliances&lighting/pdf/tableap2.pdf and US Department of Energy, Technical Report: Analysis of Amended Energy Conservation Standards for Residential Refrigerator-Freezers, October 2005, p. 2-1, 5-6. 30 The long term greenhouse gas and ozone depletion benefits of phasing out CFCs are undeniable, but in the near term, great care is still needed to recover those chemicals from the coolant and insulating foam of the millions of refrigerators being retired from service.
Is Efficient Sufficient? 20 22 March 2010
25% per year in Thailand, and 28% per year in the Philippines during that period.31 These rates of growth are utterly in conflict with efforts to stabilize the climate. If refrigerators, one of the most wildly successful of all efficiency success stories, are actually using more total energy worldwide today than they were before energy efficiency standards were first adopted for them, what hope do we have of meaningfully reducing total consumption of other products through efficiency? The answer lies in taking a different approach to the way we write efficiency specifications, and coupling those policies with a related series of public policies that address other important contributors to consumption.
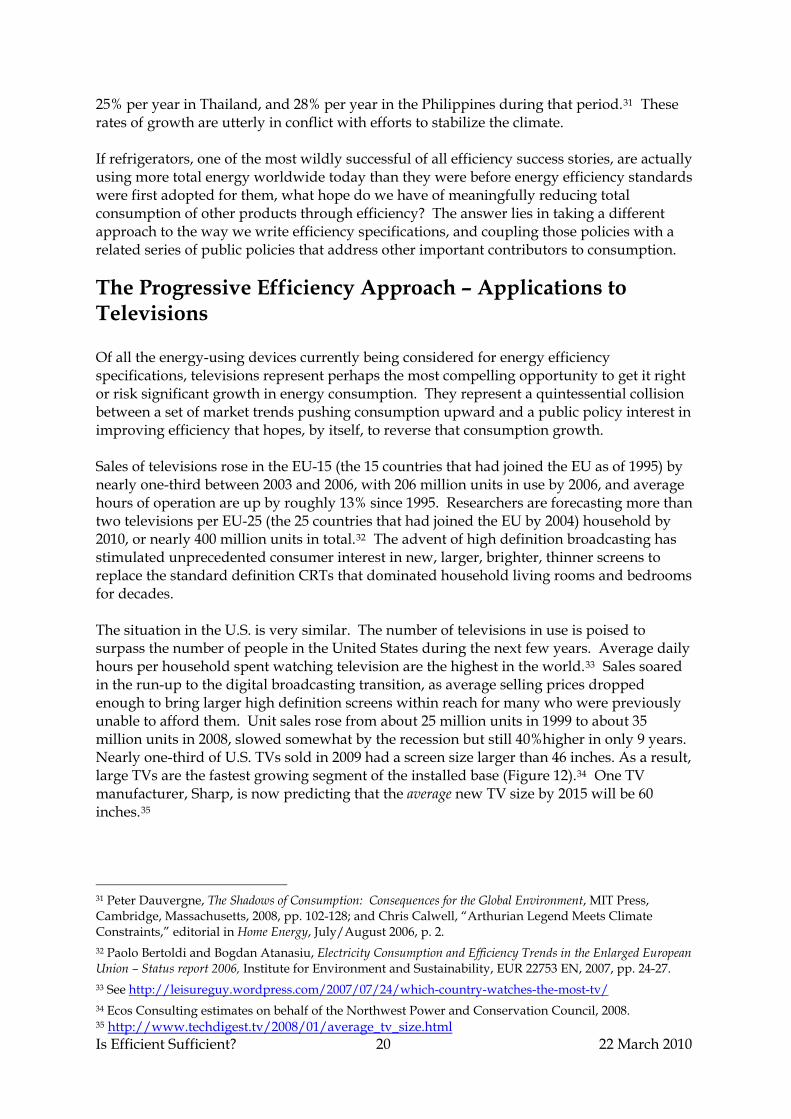
The Progressive Efficiency Approach – Applications to Televisions Of all the energy-using devices currently being considered for energy efficiency specifications, televisions represent perhaps the most compelling opportunity to get it right or risk significant growth in energy consumption. They represent a quintessential collision between a set of market trends pushing consumption upward and a public policy interest in improving efficiency that hopes, by itself, to reverse that consumption growth. Sales of televisions rose in the EU-15 (the 15 countries that had joined the EU as of 1995) by nearly one-third between 2003 and 2006, with 206 million units in use by 2006, and average hours of operation are up by roughly 13% since 1995. Researchers are forecasting more than two televisions per EU-25 (the 25 countries that had joined the EU by 2004) household by 2010, or nearly 400 million units in total.32 The advent of high definition broadcasting has stimulated unprecedented consumer interest in new, larger, brighter, thinner screens to replace the standard definition CRTs that dominated household living rooms and bedrooms for decades. The situation in the U.S. is very similar. The number of televisions in use is poised to surpass the number of people in the United States during the next few years. Average daily hours per household spent watching television are the highest in the world.33 Sales soared in the run-up to the digital broadcasting transition, as average selling prices dropped enough to bring larger high definition screens within reach for many who were previously unable to afford them. Unit sales rose from about 25 million units in 1999 to about 35 million units in 2008, slowed somewhat by the recession but still 40%higher in only 9 years. Nearly one-third of U.S. TVs sold in 2009 had a screen size larger than 46 inches. As a result, large TVs are the fastest growing segment of the installed base (Figure 12).34 One TV manufacturer, Sharp, is now predicting that the average new TV size by 2015 will be 60 inches.35
31 Peter Dauvergne, The Shadows of Consumption: Consequences for the Global Environment, MIT Press, Cambridge, Massachusetts, 2008, pp. 102-128; and Chris Calwell, “Arthurian Legend Meets Climate Constraints,” editorial in Home Energy, July/August 2006, p. 2. 32 Paolo Bertoldi and Bogdan Atanasiu, Electricity Consumption and Efficiency Trends in the Enlarged European Union – Status report 2006, Institute for Environment and Sustainability, EUR 22753 EN, 2007, pp. 24-27. 33 See http://leisureguy.wordpress.com/2007/07/24/which-country-watches-the-most-tv/ 34 Ecos Consulting estimates on behalf of the Northwest Power and Conservation Council, 2008. 35 http://www.techdigest.tv/2008/01/average_tv_size.html

Are size and amenity increases swamping the effect of efficiency gains? It is difficult to find reliable data back to the early years of TV sales in the U.S., but data from Consumer Reports, the Auman Television Museum, and more recent measurements provide some hints about the overall trend. Ecos estimates that average active mode power consumption of a typical new television fell in the US from the 1940s to the 1960s, as black and white CRT technology was refined. This trend was interrupted briefly by the introduction of color CRT technology, but then resumed as manufacturers found ways to hone those designs as well. As the technology needed to produce the picture and sound was miniaturized, more of the surface area of the front of the TV cabinet could be devoted to the display itself, allowing screens to get bigger and still fit through the doorways of homes. Still, the sheer weight of the lead shielding in CRTs limited practical direct view screen sizes to about 36 to 40 inches.
U.S. TV Stock by Screen Size Bin, 2009‐2014
0
50
100
150
200
250
300
350
400
2009 2010 2011 2012 2013 2014
Total Stock (m
illions)
> 46"
32" ‐ 46"
< 32"
Figure 12: Steady growth in the U.S. TV stock will be dominated by a shift to larger models (Ecos analysis for Northwest Power and Conservation Council).
But the advent of LCD and plasma flat panel technologies eliminated that constraint, allowing TVs to become much larger and still be able to be delivered and installed in the home by only one or two people. By the 1990s, television screen size, resolution, and brightness began increasing in earnest, all having the effect of increasing power use. Sometime in the last two years, average active mode power use per new TV likely equaled or even exceeded where it had been in the 1940s era of CRTs and vacuum tubes. Voluntary and mandatory energy efficiency specifications for TVs will help turn that trend downward, but with each passing month, it becomes less and less expensive to buy ever-larger screens. Major U.S. retailers now sell many 42” TV models for $550 to $600 and many 50” models for $650 to $800.36 Can government policies, utility programs, and technology advances reduce
Is Efficient Sufficient? 21 22 March 2010
36 See Best Buy newspaper advertising circular, January 31-February 6, 2010 and www.shopper.com (accessed January 30, 2010).

power consumption per square inch of screen area fast enough to keep pace with buyers’ ever expanding appetite for larger screens? Mandatory efficiency standards around the world (Figure 13) have all taken a linear approach. California’s standards appear to be the most stringent, but exempt the largest and most energy consumptive models from coverage and provide a more generous credit for automatic brightness control. The slopes of the initial standards are quite steep; in Australia’s Tier 1 standard, doubling screen area from 500 to 1000 square inches allows a TV to consume nearly double the power. By the time California’s Tier 2 standard takes effect in 2013, the slope is somewhat flatter, but doubling screen area from 500 to 1000 square inches will still allow a California TV to consume about 70% more power.
Figure 13: Comparing California, European, and Australia TV efficiency requirements ( NRDC) Of course, consumers purchase on the basis of screen size rather than screen area. It is surprising to see how small of a change in screen size is needed to greatly increase allowable power use. Doubling screen size from 21 to 42 inches or from 32 to 64 inches allows a TV under Australia and Europe’s Tier 1 standards to use about three times as much power. Similarly, moving from a 42 to 50 inch screen increases allowable power use by about 100 watts. Linear specifications are an improvement over ENERGY STAR’s original approach in version 3.0, which is characterized by a relatively steep slope and a pair of discontinuous power jumps in the middle. This specification allowed almost every major television model sold in the US in 2009 to qualify for the label. In total, there are more than 1600 television models on the current ENERGY STAR product list – such a large percentage of the total models available that the label is not helping consumers effectively locate the most energy efficient TVs.
Is Efficient Sufficient? 22 22 March 2010

In general, specification approaches with slopes this steep do little to discourage, and ultimately are likely to support, the market trend toward ever-larger screen sizes. Consumers reasonably believe that buying a new ENERGY STAR model, regardless of its size, will cause their electric bills to go down. Advertisements help to reinforce this thinking by reporting average or typical savings, regardless of screen size. The sample advertisement in Figure 14 suggests that buying an ENERGY STAR model like the one shown (a 52” LCD) will reduce energy use about 30%. But the model shown uses 424 kWh/year – more than nearly any television the consumer is likely to be replacing. The reality is that many TVs being purchased today are so large and fully featured that they are bound to consume more electricity than the units they replace, no matter how energy efficient they are.
Figure 14: Advertisement for ENERGY STAR television from Toshiba (left, Durango Herald)
out the same as n energy efficient refrigerator. Other TVs on the current ENERGY STAR list use even more
void
e ion
Figure 15: Advertisement for ENERGY STARtelevision from Mitsubishi (right, Durango
Herald) For example, Mitsubishi is now marketing 82 inch rear projection TV models as ENERGY STAR (Figure 15).37 These models use a little more than 400 kWh/year – abaelectricity (695 to 817 kWh/year), and range in size from 60 to 70 diagonal inches. Buying any of these models is unlikely to make a purchaser’s energy bill go down from its current levels. Efficiency requirements and labeling criteria currently under consideration in Europe athe discontinuous jumps but are fairly similar in slope – steeper in the near term and a littleless steep by 2012. Such specifications suggest that total television energy use will continuto rise in both regions in the near term, in part because customers’ natural progress
Is Efficient Sufficient? 23 22 March 2010
37 Axxis Audio advertisement, Durango Herald, October 25, 2009.

Is Efficient Sufficient? 24 22 March 2010
d to linear specifications, they must ventually confront an unavoidable fact: no one slope or efficiency level is automatically
e
pproach in version 5.0 (Figure 16). It moved beyond the nduring allegiance to linear specifications and instead adopted an intentionally progressive
specification that becomes more stringent and challenging to meet as televisions become larger. This can be achieved with a continuous curve or, in ENERGY STAR’s case, a set of connected, ever-flatter lines.
toward larger screen sizes threatens to push energy use upward faster than efficiency specifications can reduce it. If governments are weddeeoptimal across the full range of available products. Thus, governments can either compromise with a linear specification that is too lenient in one part of the product rangand too stringent in another, or try a new approach. ENERGY STAR took the lessons of its previous TV specifications to heart and proposed such a groundbreaking new ae
Figure 16: U.S. voluntary and mandatory specifications for television efficiency (Ecos) Progressive specifications have a few consistent characteristics that are easiest to see by looking more closely at ENERGY STAR’s example. Its slope is steepest at small screereflecting the fact that power use differences can be large between two small TVs whose screen areas differ significantly from each other on a percentage basis (for example, 100 vs. 200 square inches). A
n sizes,
s screen areas get larger, expanding by another 100 square inches epresents a much smaller percentage growth in screen size. In turn, the additional
s er-
rincrement of power needed to illuminate that incremental area becomes smaller as well, athe “fixed costs” of tuners, power supplies, and processing circuitry get spread across evlarger screen areas.

Is Efficient Sufficient? 25 22 March 2010
energy mp that yields a particular, fixed amount of light. The
ser can choose to concentrate that onto a smaller screen for a brighter and more tightly r
locally dimmed ED backlights. The typical buyers of such large televisions can better afford those
with
iciency its linear counterparts, but because its
stringency difference is greatest among the products whose absolute consumption is ed of its own volition. If
arger
t two different chnological approaches can achieve them, so the limits do not require all manufacturers to
r refrigerators more efficient than class A at the time. The qualification specification for n
e
ns progressively more challenging as homes become larger. In some cases, positive points are awarded for homes below a certain size. In other cases, negative points are awarded for additional square footage beyond a certain
At the largest screen sizes, direct view televisions are extremely costly and impractical tomanufacture, ship, or carry into a home. For such screen sizes, television buyers have a variety of front projection and rear projection display choices that are generally moreefficient. Each model includes a laudefined image, or onto a larger screen for a picture that is bigger, but not quite as bright odetailed. Either way, the lamp wattage and its associated lumen output represent a sufficiency limit or upper bound. Larger screens are also associated with more costly televisions that can better absorb the incremental costs of advanced display technologies like laser projection orLincremental costs as well, illustrating the similarities between progressive efficiency specifications and other progressive social policies that limit financial impacts on those the lowest incomes, but tolerate higher impacts on the wealthiest buyers. The resulting energy savings can be quite large, not only because the progressive effspecification is, on average, more stringent than
highest, and that represent the direction the market is already headrger TVs are becoming more popular every year, we should focus intently in our la
specifications on the energy use of larger TVs.
The Broader Case for Progressive Efficiency Perhaps the most salient feature of progressive efficiency specifications is that they approach a sufficiency limit on power consumption and cease to increase, no matter how much lor more functional the energy-using devices become. The sufficiency limits are chosen froma careful review of available technologies and verification that at leastepurchase from a single vendor. This does not prevent the largest or most functional products from being sold; it holds them to progressively tighter efficiency requirements if they want to be labeled as energy efficient or receive a utility rebate. There are a number of existing precedents for this approach. Europe implemented a refrigerator procurement approach called Energy+ between 2000 and 2004, to build demand fothe program not only required that products be more efficient than the class A specificatioon an energy use per unit of interior volume basis, but they were also allowed to consumno more than 280 kWh/year, regardless of size, amenities, or features.38 Similarly, the LEED certification process, the ENERGY STAR label, and various state and local green certification processes for homes in the U.S. have all begun to move toward various means of making efficiency specificatio
38 L. Wijshoff and Sophie Attali, Energy+ cold appliances beyond the A label, thanks to pan-European procurement, ECEEE 2003 Summer Study, p, 762.

Is Efficient Sufficient? 26 22 March 2010
ize, or additional efficiency measures need to be incorporated into homes as they get larger
the rise in absolute consumption. If governments
on’t work to reconcile absolute limits on greenhouse gas emissions with ever-higher
homas Princen described the underlying principle of sufficiency that informs progressive efficien
ood
an
rs and political handlers, all of whom tell us that e good life comes from purchasing goods, and that because goods are good
I go ause I enjoy the movement and the fresh
air, but if my physical exertion begins to override my pleasure, I’ve had
es
nds. In n
pact jeopardizes life-support systems. Squeezing out yet another
bal ng how
the short term and for
sif they wish to qualify for efficiency labeling.39 In the end, sufficiency limits and progressive efficiency specifications represent one of most reasonable ways of halting the steadydconsumer demand for luxury, who will? T
cy specifications as follows:
[C]oncerned citizens… are fed up with ever-increasing throughput, with the open-access, free-for-all assault on the planet’s natural resources, with the 24/7 work-and-spend mentality, with the commercial promises of the glife – the efficiencies and conveniences and the stuff, more and more stuff. This is the need for a language consonant with “enoughness” and “too muchness,” not just words, but concepts and organizing principles. Inecologically constrained world, people need the rhetorical and political means for turning a silencing hand to the barkers and boosters, to the marketers, to the spinmeistethmore goods must be better. Sufficiency as an idea is straightforward, indeed simple and intuitive, arguably “rational.” It is the sense that, as one does more and more of an activity, there can be enough and there can be too much. I eat because I am hungry but at some point I’m satiated. If I keep eating I become bloated.for a walk because it feels good, bec
enough… I can sense the excess…
The risks are different now, profoundly serious from the individual to the societal to the global level. Not only are there few true frontiers left but the biophysical underpinnings of human life are in jeopardy. The litany of issu– global warming, species extinctions, bioaccumulative toxics, water shortage– is long, well known, and well documented. More of the same, however fine-tuned to be efficient, even “eco-efficient,” will not reverse the trefact, in an ecologically “full world” every incremental increase in humaimproduction efficiency is of little benefit if throughput still increases… Sufficiency principles… have the virtue of being highly congruent with gloecological constraint, a congruence not shared by efficiency. By askimuch is enough and how much is too much, one necessarily asks what is excessive, what the risks are, not just risks in
39
y Efficiency in Buildings, 2006.
Additional examples are provided as part of the “variable efficiency” specification discussion in: Jeffrey Harris, Rick Diamond, Maithili Iyer, and Christopher Payne (Lawrence Berkeley National Laboratory) and Carl Blumstein (University of California Energy Institute), Don’t Supersize Me! Toward a Policy of Consumption-Based Energy Efficiency, ACEEE Summer Study on Energ

Is Efficient Sufficient? 27 22 March 2010
uller t
ciency is the realm of experience for
policymakers and program designers. G.K. Chesterton succinctly summarized its essence nough: one is to continue to .”42
d to that onsumption, and devise appropriate public policy and market responses to each. Lastly,
ts to acknowledge sufficiency limits nd push product efficiencies in a more stringent and progressive direction.
Wilhite
A new policy paradigm is needed for Europe and the other rich countries
ious ctors at work in driving the energy consumption and resulting carbon dioxide emissions
of consumer products ever-higher. The original IPAT formula (Figure 17) developed and modified by Barry Commoner, John Holdren and Paul Ehrlich44 is a place to start:
immediate beneficiaries, but risks to those unlikely to realize the benefits, both for the immediate and the long term.40
Princen speaks about sufficiency more broadly than just in the context of the shape of an energy efficiency specification, of course. He is arguing for reasonable upper bounds not just on the size of products, but also on the number we purchase, how extensively we use them, and how many power plants of what type we build to power them all. Adrian Mgoes even further, challenging us to think of sufficiency as the amount and type of energy iis ethical to consume before we imperil our fellow human beings.41 At its core, suffian incredibly simple but powerful concept largely outside
more than a century ago: “There are two ways to get eccumulate more and more. The other is to desire lessa
Towards a More Holistic Approach I believe the key to success in our future energy efficiency work is to first acknowledge thatabsolute consumption is the root cause of the problem and the place where public policy efforts should be focused. Next, we can unbundle the various factors that leacand specifically, we can recast current efficiency effora
and Norgard framed the solution as follows:
of the world, one that aims at combining efficiency of technology, etc. with sufficiency in energy services, leading to significant reduction in energy use.43
More specifically, I believe the solution begins with an honest accounting of the varfa
Figure 17: The IPAT formula
40 Thomas Princen, The Logic of Sufficiency, MIT Press, 2005, pp. 5-6, 8-9. 41 Adrian Muller, University of Zurich, Sufficiency - does energy consumption become a moral issue? See www.iop.org/EJ/abstract/1755-1315/6/26/262003. 42 G.K. Chesterton, All things considered, Methuen, London, 1908. 43 Harold Wilhite and Jorgen Norgard, “Equating Efficiency with Reduction: A Self-Deception in Energy Policy,” Energy & Environment, Vol. 15, No. 6, 2004, p. 1003. 44 See http://www.population-growth-migration.info/essays/IPAT.html for the history of IPAT’s development.

Is Efficient Sufficient? 28 22 March 2010
r are the units and the mathematics straightforward. e understand, for example, that increases in population lead to greater environmental
device
• Allowing them to let such devices operate for long periods of time or even deterrent
se of various pollutants from a factory or power plant? According to the math of the formula, an increase in the technology term increases environmental impact per unit of
uch
AT formula to more meaningfully and pecifically reflect the environmental impact of greatest consequence and the contributing
factors at work in consumer products: IPALUCEMD. What it lacks in pithiness it may make up for in descriptive power (Figure 18):
Unfortunately, this formula, for all of its simplicity and broad applicability, is not specific enough to be actionable in this case. NoWimpacts. We can also see how affluence can have a similar effect, but must acknowledge that it could do so by many pathways:
• Giving people the means to buy more than one of a particular energy-using• Encouraging them to buy particularly large, high-performance, or luxurious models
of an energy-using device
continuously, because the resulting energy bills are not high enough to be ato a person of sufficient financial means
Finally, the technology term is confounding. Does increasing technology increase environmental impact because of the various chemicals and processes employed, or does it reduce environmental impact by increasing efficiency and improving the ability to prevent the relea
economic output, but our intuitive sense is that increasing technology should reduce simpact.
I propose instead a wholesale rewrite of the IPs
Figure 18: Updating IPAT to include other meaningful factors yields IPALUCEMD .
In this new formulation, environmental impact is specifically characterized as emissions ocarbon dioxide (or CO2-equivalent greenhouse gases) per year. Given the need to achiev
f e
bsolute reductions in greenhouse gas emissions of 80% by 2050, and the world’s inability so
s (all of the terms that follow in the equation) if they hope to achieve verall net reductions in total impact over time. Conversely a successful effort to reduce
ingly
afar to flatten or reduce emissions from one year to the next, the task before us is dauntingindeed. We need to be as explicit as possible about the impacts we are trying to reduce. The population term remains the same, but is there to remind us that governments that refuse to take steps to actively manage population growth must achieve major reductions in per-person impactopopulation growth would make all of the remaining terms of the equation correspondeasier to achieve.

Is Efficient Sufficient? 29 22 March 2010
e
inely chase
eplaces the energy that would have been used by that product’s predecessor. In reality,
ever, that impact is divided into two phases: the use
hase and the manufacturing phase. Within the use phase are four key terms: luxury,
a
l.
to upsize ay to obtain an absolute reduction in
onsumption, rather than merely slowing its growth. Yet government agencies, utilities,
s, Ken Conca and a number f other contributors argue thoughtfully for a less automatic acceptance of current patterns
of cons retical in some c
utes the needs of today’s people remains blurred, out of cus, even usefully ambiguous: everyone has become adept at talking about
s supply
that is, to the processes of supplying consumers with what they desire… If a problem arises in this
A new term, acquisitiveness, is added to specifically address the number of devices purchased per person. Only a handful of energy policies and programs today specifically address this issue (refrigerator take-back programs, for example). And yet, if retailers and utility efficiency programs routinely rewarded purchasers for returning and recycling thstill-operating products they are replacing, this acquisitiveness term would become muchmore manageable. Instead, utility rebate programs and hybrid vehicle tax credits rout(and heroically) assume that the energy use associated with any new product purrmany new purchases simply add to existing electrical load. The prior device is either retained in another room of the house or sold to someone who keeps on using it. From this point forward in the equation, all the remaining terms collectively yield a measureof total annual impact per device. Howpusage, carbon intensity, and efficiency. Within the manufacturing phase are two key terms: manufacturing impact and durability. The luxury term is there to specifically capture the extent to which the purchaser is seeking high degree of amenity, performance, or product size. This can have its most profound effect on the use phase of environmental impact, but of course has secondary implications (beyond the scope of this equation) for manufacturing and transportation impacts as welThis is also the place where right-sizing enters the picture. Urging purchasers to buy the size or performance level of the product they need instead of forever urging thema product and add features is perhaps the surest wcand efficiency advocates have been all too willing to accommodate retailers’ and manufacturers’ natural predisposition to up-sell. This point is fundamental enough to merit some additional consideration. In their 2002 book Confronting Consumption, Thomas Princen, Michael Maniateo
umer demand. They acknowledge that this point of view is considered heircles but is nonetheless vital to understand and address:
Just what constitfosustainability without having to wade into the treacherous waters of consumption… According to prevailing economistic thought, consumption is nothing lesthan the purpose of the economy. Economic activity is separated into and demand, and demand – that is, consumer purchasing behavior – is relegated to the black box of consumer sovereignty… Thus analytic and policy attention is directed to production –
production-based, consumer-oriented economy, corrections are naturally aimed at production, not consumption…
No one in public life dares – or needs – to ask why people consume, let aloneto question whether people or societies are better off with their accustomedconsumption patterns. People consume to meet needs; only individuals can

Is Efficient Sufficient? 30 22 March 2010
pate
,
re good oods are better. Wastes may be bad – but when they are, more
productive efficiencies, including ecoefficiencies and recycling, are the
or
.46 In this situation, there is nothing economically rational or efficient” about expanding production sufficiently to meet the sum of that individual
ing
cts a certain number of hours per day.47 Consumer ducation can be effective at reminding people to limit their use of products to the period of
m ver great distances doing so
nd cause their vehicles to operate for long periods of time each day. In a city with high
nto a heaters
itoring circuitry in mart plug strips can power down unused equipment automatically. The impacts are
know their needs and thus only the individual can judge how to particiin the economy. Consumption becomes sacrosanct. If water supplies are tight, one must produce more water, not consume less. If toxics accumulateone must produce with fewer by-products – or, even better, produce a cleanup technology – rather than forgo the production itself. Goods aand more g
answer. Production reigns supreme because consumption is beyond scrutiny.45
Later in the book, Princen reminds us that consumption not only means “to degradedestroy,” but that it can also mean “to use up energy or material to enhance one’s personalstanding.” In that sense, we arrive at conspicuous consumption – the notion that individuals can “overconsume” or “misconsume” in the interest of gaining luxury, increasing their social status, pursuing an addiction, or maximizing short term gain at the expense of long term happiness“demand – society would actually be better off with less total demand (and correspondproduction), rather than more. The next term, usage, reflects the fact that consumers make choices, with or without realizing it, to use particular produetime in a day that is truly useful or necessary. A simple example is remembering to switchoff lights when we leave a room. A more subtle example is designing cities and their transportation networks to maximize access rather than mobility. In a city with high mobility, people have many ways to get frohome to work or to shops rapidly and “efficiently,” but often coaaccess, housing, employment, and shopping are all proximate enough to allow walking, which can reduce hours of vehicle operation to virtually zero. Technology can also be incorporated into most products to actively manage their power use during periods of inactivity, effectively reducing usage automatically. Computers, monitors, copiers, set top boxes, and game consoles can be smart enough to drop ireduced power consumption “sleep” mode during long periods of inactivity. Watercan learn the patterns of hot water consumption in homes and adjust their heating cycles accordingly to minimize standby losses. Vehicles that are idling at stoplights can automatically shut off and restart their engines. Outdoor light fixtures can shut off automatically during daylight hours. Motion sensors and power mons
45 Thomas Princen, Michael Maniates, and Ken Conca, “Confronting Consumption” in Confronting Consumption, MIT Press, 2002, pp. 1, 4-5. 46 Thomas Princen, 2002, pp. 30, 33-34. 47 We must also acknowledge that some products like refrigerators, uninterruptible power supplies, and security systems don’t really have an independent usage term; they are designed to operate continuously. In this case, the usage and efficiency terms are mathematically combined to yield amenity/unit of annual energy use instead of amenity/unit of power.

Is Efficient Sufficient? 31 22 March 2010
ion that can occur in various low ower modes when a product is technically “not in use.” Good design means that products
ce for
esearch that a moderately efficient natural gas clothes dryer yields a similar level of
er ative
s
inimizing carbon intensity would face less pressure to reduce menity or usage in order to keep overall impacts low, for example. Likewise, a utility or
makes
d
eaningfully shift the overall impacts if many of the other terms in the equation are increasing. an
.
g f the
of
or not it has ceased to function. he environmental impact of an individual cellular phone is small, but the impacts of the
tangible: a 20% reduction in hours of operation can save about as much energy as a 20%improvement in efficiency, but often at even lower cost to the user. Of course, we should not ignore the energy consumptpminimize their power use during periods of inactivity and, more generally, dynamically scale their power use to the service being provided.48 The next term, carbon intensity, acknowledges that purchasers often have a fuel choiproducts such as clothes dryers or water heaters, which can yield different amounts of carbon dioxide emissions per unit of energy delivered to the end use. Ecos found in recent rgreenhouse gas emissions per load as a highly efficient heat pump electrical dryer. If our goal is reducing greenhouse gas emissions, fuel choice can be just as important as efficiency. Similarly, people now frequently have the choice whether to purchase conventional powfrom their utility, volunteer to pay more to receive certified green power from an alternprovider, or elect to self-generate on site with renewables to achieve even greater reductionin net greenhouse gas impacts per unit of electricity consumed. A person who elects to spend more money on manation that meets ambitious goals for renewable energy production would face a lower needto reduce consumption. In the denominator lies the efficiency term, intentionally expressed in a manner thathigher efficiency levels synonymous with larger numeric values. Thus when the equation divides by high efficiencies, it correctly predicts that environmental impacts decrease, anvice versa. This formulation makes clear that increasing efficiency by itself will not mThis might also be the place to acknowledge feedbacks – that increases in efficiency clower operating costs, leading some purchasers to increase acquisitiveness, luxury, or usage The next two terms originate from lifecycle analysis. They recognize that, for many products, a meaningful share of the overall impacts occurs in the process of manufacturinand delivering the product to the consumer rather than from the consumers’ usage oproduct.49 Thus we need a term both for manufacturing impacts and the product’s durability (average lifetime). This makes it possible to annualize manufacturing impact,and recognizes that durability truly matters in all product efficiency specifications. Durability is not just a solid waste issue; it is an energy and climate issue. Each extra year lifetime forestalls for another year the need to expend the energy to make and transport another product. Durability could be specified quantitatively as the period of time duringwhich the manufacturer is prepared to provide the purchaser a full refund in the event of product failure. It could also be defined as the average period of time a person will use a particular product before deciding to replace it, whether T
48 See Chris Calwell, An Energy Efficiency Philosophy for Electrical Products, Ecos, June 19, 2007. 49 The opposite situation is also true for many products. A number of manufacturers’ sustainability reports have extolled their success at reducing the environmental impact of manufacturing products that, alas, continue to consume ever-more energy in operation, where the majority of impacts occur. The point is not that manufacturing impacts are the largest part of the equation, but that they are large enough to be included in a measure of overall impacts.

Is Efficient Sufficient? 32 22 March 2010
focus
e ignals impact almost every term in the equation, leading not only to a preference for
technologies that have lower impact, but to a series of corresponding behavior changes that r the ultimate level of consumption and emissions.
o to o decades later. Yet the percentage of
eople who believe we can individually consume our way to a stable climate seems to grow ever hi wonde
ith: hen
environmentally sound” products (and then ecycle them), rather than as citizens who might come together and develop
it
er
ly
over town in their gasoline-guzzling SUVs in search f organic lettuce or shade-grown coffee; and diligent recyclers expend far
can than
is f
category as a whole are significant, in part because average product lifetime is so short and new replacement products are purchased so frequently. Considered in totality, the elements of this equation help to illustrate why a singular on product efficiency has had such little success in reversing growth in absolute consumption. It has absolutely slowed the pace of such growth, but it cannot be expected to reverse that growth by itself, without corresponding attention to the behavioral and technical factors at work. The elements of this equation also illustrate the appeal of using public policies to raise the price of energy or the cost of emitting carbon dioxide. Such prics
can have equal or greater influence ove
What Then Shall We Do? As someone closely involved with the original book that recast global environmental problems as individual opportunities for empowerment – 50 Simple Things You Can DSave the Earth – I am acutely aware of its limitations twp
gher. Allegheny College professor Michael Maniates can scarcely contain hisrment at the persistence of this point of view:
In our struggle to bridge the gap between our morals and our practices, we stay busy – but busy doing what we are most familiar and comfortable wconsuming our way (we hope) to a better America and a better world. Wconfronted by environmental ills – ills many confess to caring deeply about –Americans seem capable of understanding themselves almost solely as consumers who must buy “rpolitical clout sufficient to alter institutional arrangements that drive a pervasive consumerism… Although public support for things environmental has never been greater,is so because the public increasingly understands environmentalism as anindividual, rational, cleanly apolitical process that can deliver a future that works without raising voices or mobilizing constituencies. As individual consumers and recyclers we are supplied with ample and easy means of ‘doing our bit’ – green consumerism and militant recycling becomes the ordof the day. The result, though, is often dissonant and sometimes bizarre: consumers wearing “save the earth” T-shirts, for example, speak passionateagainst recent rises in gasoline prices when approached by television news crews; shoppers drive all omore fossil-fuel energy on the hot water to meticulously clean a tin is saved by its recycling. Despite these jarring contradictions, the technocratic, sanitary, and individualized framing of environmentalism prevails, largely because it continually reinforced. Consider, for example, recent millennial issues oTime and Newsweek that look to life in the future. They paint a picture of

Is Efficient Sufficient? 33 22 March 2010
in med,
ter nsumers will buy it, and society will be transformed for the
etter. A struggle-free ecorevolution awaits, one made possible by the
y e
sk, or left operating for long periods of inactivity, or powered by the rong fuel, or if people acquire large numbers of them without retiring the old ones from
n.
ce,
or area of service provided.51 This is a belief we could temporarily afford in an era f cheap energy and economic surplus, but not in a world of scarcity and profound climate
the label. If that were true, the best ENERGY STAR
pecifications would be just stringent enough to allow every product manufactured today to
ly
learn that a new ENERGY STAR
levision will use more energy and cost more to operate than the one they already own, or
smart appliances, computer-guided automobiles, clean neighborhoods, ecofriendly energy systems, and happy citizens. How do we get to this future? Not through bold political leadership or citizen-based debate withenabling democratic institutions – but rather via consumer choice: infordecentralized, apolitical, individualized. Corporations will build a betmousetrap, cobcombination of technological innovation and consumer choice with a conscience.50
Maniates and his fellow authors challenge us not to abandon efforts to improve the energefficiency of consumer products, but to stop pretending that is all or even mostly all that wneed to do. If products are highly efficient from a technical standpoint, but grossly oversized for the tawservice, consumption will continue to rise no matter how “efficient” the individual new products become. But many energy efficiency specifications have unintentionally helped feed the trend towardconspicuous consumption by consistently choosing linear or categorized efficiency specifications. These specifications can make it no more difficult for extremely large, luxurious, high performance, or costly devices to earn an environmental “seal of approval”than their simpler, more utilitarian counterparts that yield far lower total consumptioWhen the enormous restaurant-grade refrigerator or wall-spanning plasma TV or 10,000-square-foot (929 square meter) home bears the ENERGY STAR label without regard to its absolute consumption, it says to all the world that we can go on increasing material throughput and total energy consumption indefinitely without environmental consequenas long as we continue finding ways to reduce the amount of energy consumed per unit of volumeochange. The fallacy of encouraging or tolerating endless increase in a finite world imperils us all. The other fallacy ENERGY STAR and its international counterparts must face is the notion that success in voluntary labeling programs is to be judged by the extent to which the resulting specification is popular with manufacturers and their trade associations, or bynumber of devices that ultimately bear the squalify, because the largest number of manufacturers would support it and the largest number of products would bear the label. In fact, citizens expect the government to be steering them toward products that will trusave money and improve environmental quality on an absolute basis (either relative to the comparable products people already own or the typical ones they might purchase instead).Indeed, people understandably feel misled when they te
50 Michael Maniates, “Individualization: Plant a Tree, Buy a Bike, Save the World?” in Confronting Consumption, 2002, pp. 51, 55. 51 See also Chris Granda, Maggie Lynch, and Sam Rashkin, Tackling Efficiency Paradoxes: Possible Responses to Today’s Landscape of “Energy-Efficient” 10,000 sq. ft. Houses and 60-inch Televisions, 2008 ACEEE Summer Study.
Is Efficient Sufficient? 34 22 March 2010
e wrong
es
earn a rate of return on the resulting nergy savings from each rebated unit sold, and buy energy savings more cheaply than
ions
e
ghting services delivered, more iles of roadway installed, more people driving, more resulting congestion). I am not
g
used to
ly increases energy consumption. This approach invites despair and apathy instead of responding
est critique. Better, I think, to look at the ways that our present pproach to efficiency can be modified to make it more effective.
pecific Solutions
ar
nd
uld
ity
increasingly common in national and local programs focused on green homes. As the homes get larger, they must achieve progressively
when a “green” label was granted to a product on the basis of considering only the power consumed in its least consequential operating modes. It seems, in the end, as if our society has been pursuing the right objective from thdirection. Recognizing the problems of rising energy use and greenhouse gas emissions, wehave all been complicit in choosing to limit energy use or emissions per unit of service delivered rather than limiting the total energy use. This is a bargain that all of the stakeholders can live with in the near term, but that does not serve our collective objectivin the long term. Manufacturers and retailers get to continue promoting ever greater services and amenities per device sold, and try to sell as many of them as possible. The government and the environmental community get to triumph the dramatic percentage gains in efficiency. Many utilities (in the U.S.) get toeelectricity from new power plants. And, indeed, energy consumption does rise more slowly than it would have without the efficiency program. The problem is, except in rare cases, the efficiency program does not yield absolute reductin energy consumption if no other aspects that drive consumption are addressed simultaneously. So the problem it was intended to solve keeps getting worse. This could baddressed to some extent by shifting the metrics to include the energy use of the whole system (not just the individual light bulb or car) and to include a time scale long enough to capture unintended consequences down the road (more limarguing that efficiency no longer serves a useful purpose, but rather just that it is not beinframed holistically enough nor given sufficient context.52 Some would have us give up on the suite of policies and market tools now beingincrease the energy efficiency of products, arguing that reducing the energy use of an individual device simply drives people to use it more and ultimate
constructively to an earna
S I offer the following initial suggestions for consideration:
• Shift energy efficiency specifications away from categorical, discontinuous, or lineapproaches toward progressive and continuous ones that approach sufficiency limits and then cease to increase. This would minimize gaming by manufacturers abring economically progressive aspects to efficiency specifications. The products that would see the largest impact to their incremental cost in order to comply wobe the products that already tend to be more expensive than average and be purchased by wealthier than average buyers. They would have the greatest abiland willingness to pay, thus minimizing the chance that low income people are negatively impacted by efficiency requirements. Such progressive efficiency specifications are already
52 For other examples and background, see Princen, 2005, p. 119-123.

Is Efficient Sufficient? 35 22 March 2010
her
hese
an “A”
widespread that “A+” and “A++” rapidly become necessary to help consumers find
ones.
e
mpared
cts of its type, regardless of size or
performance level. This gives users two frames of reference – relative and absolute –
products with regard to test procedures, metrics, timing, scope, and stringency. This more
a-
Energy+ specifications have led to more energy efficient procurement practices in
of utility incentive programs on the sale of new, energy-efficient devices. Explore
x r.
higher point totals to qualify as “green.” Why not apply the same concept to otenergy-using products?
• Put in place the market intelligence and data collection mechanisms needed to
automatically update labeling levels annually for most product categories. Trecurring true-ups would ensure that an ENERGY STAR label always applies to the top 25% of available models, for example. Likewise, they would ensure that rating in Europe applies only to exemplary models, instead of becoming so
the best models. The need for rapid revision of qualification criteria is not a drawback of poorly designed labeling approaches; it is a hallmark of successful
• Extend the mandatory categorical53 product labeling currently practiced in Europe,
Australia and much of Asia to all energy-using consumer products in the U.S., Canada, and other countries that do not yet employ it. If a product category for some reason does not lend itself to a rating system, this should be well-proven beforan exception is made. Employ a 1 to 5 star or A to G rating system to easily and simply advise consumers on the relative efficiency of a particular product coto others of similar size or performance. Also employ an absolute scale illustrating how the annual energy cost or kWh consumption or greenhouse gas emissions ofany product compares to all other produ
by which to decide what to purchase. EPA and ACEEE already employ such an approach in the way they rate vehicles.
• Explicitly link voluntary and mandatory specifications in the U.S. for particular
is already done in Europe and Australia and should allow the U.S. to capture energy savings faster than it can by keeping the processes completely separate.
• Shift the focus of most rebates, white certificates and tax credits toward ultr
efficient products that use less energy than an average ENERGY STAR-labeled product on a relative and absolute basis. The TopTen approach currently in use inEurope and under development in the United States provides a promising framework for doing that. TopTen is not intended to replace ENERGY STAR, but rather to blaze trail in front of it by dynamically highlighting the ten most energyefficient products in any category and updating its lists frequently. Similarly
Europe. Both efforts help to drive competition among manufacturers to achieve best-in-class efficiency levels and lower absolute consumption than typical models.
• Make return and recycling of still-functional energy-using products a central feature
other mechanisms for limiting acquisitiveness as well, such as limitations on tacredits for multiple purchases of efficient devices by a single buyer in a given yea
53 Note the distinction between categorical specifications, which bunch products into functionally separate groups with different efficiency requirements, and categorical labeling, which helps consumers identify, at a glance, the most and least energy efficient products in retail showrooms.

Is Efficient Sufficient? 36 22 March 2010
oducts found not to comply with mandatory efficiency standards at all; such enforcement has been
the
ers. Shift toward progressively tiered rates instead, ensuring that those who purchase
issions if voluntary consumption targets are not
met. This gives individual consumers, retailers, manufacturers, and utilities a common incentive to find technological and behavioral strategies for moderating
id triggering the unwelcome economic measures that would
d steady, significant drops in absolute energy consumption to achieve 80% missions reductions by 2050. The pace of needed reductions in energy use in that scenario
ound
en end use, not by the extent to which they reduce energy onsumed per person, per unit of service delivered, or per unit of GNP. The climate, alas,
ldings and consumer products should only use
• Institute a corresponding system of fees on the least efficient and most energy consumptive products sold, so that consumers understand that A-rated or 5 star products are financially beneficial to purchase and G-rated or 1 star products are financially disadvantageous to purchase. Fees should be highest on pr
lacking in most countries with efficiency requirements. The revenue collected by fees would help to supplement the funding available for additional rebates, just as “feebates” or “bonus malus” programs have done for other end uses.
• Eliminate declining block utility rates for residential and commercial custom
more electricity or natural gas than average pay more for each incremental unit of energy beyond the average. These rate structures tend to improve the cost effectiveness of energy efficiency and renewable energy measures as well.
• Institute macroeconomic “backstop” provisions that trigger rising taxes on energy
consumption or greenhouse gas em
consumption, to avomake sure such reductions occur.
Climate Implications Even if a sustained push toward renewable energy allowed the world to achieve 50% reductions in the greenhouse gas emissions from our fuels and power plants by 2050, we will still neeewould be 1.5% of current consumption each year for the next 40 - a pace of progress that far surpasses what passes for “success” in most of today’s energy efficiency programs arthe world. Efficiency policies and programs should therefore be measuring and judging their success by the extent to which they reduce the total energy consumption or greenhouse gas emissions resulting from a givcdoes not know or care how many of us are being served how well or made how wealthy byour energy use – it only keeps score on the basis of total greenhouse gases emitted into a fixed volume of atmosphere. ACEEE (Figure 19), ASES, McKinsey and Company, and other organizations have argued convincingly that more than half of needed greenhouse gas reductions should come from demand-side measures.54 Others have proposed a more explicit link between supply- anddemand-side solutions, arguing that bui
54 Steve Nadel, Energy Efficiency Resource Standards, ACEEE, January 2009, p. 9. The presentation notes a number of states that are already achieving 1-2% annual reductions in total electricity consumption. See also www.ases.org/images/stories/file/ASES/climate_change.pdf and www.mckinsey.com/clientservice/ccsi/.

Is Efficient Sufficient? 37 22 March 2010
pproximately the amount of energy that can be met by renewable resources.55 Such goals acknowledge that we cannot know today how much of the solution will be met by cleaner energy sources and how much by reduced energy consumption, but that one will have to accomplish whatever the other cannot.
a
Figure 19: ACEEE projections of how an 80% greenhouse gas reduction might be achieved in the US.
Today, consumer products have gotten so much bigger, more powerful, more functional, and more numerous than they were 15 years ago, that very few end uses actually consume less energy on an absolute basis than they did 15 years ago. And yet we face an urgent nto achieve absolute reductions in greenhouse gas emissions of 80% between now and 2050. It is not p
eed
ractical or affordable to obtain most of those reductions from replacing the entire lobal energy infrastructure with renewable power plants and biofuels in such a short time,
so much of the needed savings have to come from absolute reductions in the amount of energy consumed. It is time to get started; we have much to do and not much time in which to do it.
g
55 Jeffrey Harris, Rick Diamond, Maithili Iyer, Christopher Payne, Carl Blumstein, and Hans-Paul Siderius, “Towards a sustainable energy balance: progressive efficiency and the return of energy efficiency,” Energy Efficiency, Springer Science + Business Media, April 4, 2008.

Is Efficient Sufficient? 38 22 March 2010
Acknowledgments In November 2004, the Ecos research team first proposed a progressive efficiency specification for televisions. Peter May-Ostendorp sketched that first curve. Even with a small data set and no final standardized test procedure, Peter was onto something. The curve he drew in 2004 was remarkably similar in shape to (though less stringent than) the one ENERGY STAR recently proposed for its version 5.0 TV specification, with the benefit of five years of additional technological innovation in displays, internationally standardized test procedure refinement, and data collection. A related recommendation emerged in our subsequent work on computers, where we proposed an upper bound to idle power use, regardless of computer capability or speed. Our research approach in each case was neither theoretical nor philosophical; we recommended these efficiency specifications because each represented the largest, most cost effective savings opportunity and the best fit to the data at hand. Our client for both projects was Noah Horowitz of the Natural Resources Defense Council. I want to gratefully acknowledge his support for that research and related projects over the last decade. It did not occur to us until mid-2007 that these two approaches were conceptually similar, helping to limit total consumption while sharply improving efficiency. We labeled the concepts “progressive efficiency” and “sufficiency” in the two papers and presentations we developed for the 2008 ACEEE Summer Study for Efficiency in Buildings, urging that these concepts be extended across a variety of energy-using product specifications. The first was a paper jointly prepared by myself and Laura Moorefield entitled Efficiency in a Climate-Constrained World: Are We Aiming High Enough? The second paper, developed by Ecos colleagues Paul Sheldon and Michael Rendon and delivered by Joel Watkins, was entitled Market Transformation and Guiding Principles of Sustainability. In the time since that conference, we were fortunate to receive research support for further investigation of these ideas from eceee (on behalf of its funder, the European Climate Foundation), and the EPA ENERGY STAR program (through its contractor ICF International). The opinions expressed in this paper are solely my own, and should not be construed as representing the official policy or views of the funders. They are intended to be provocative and stimulate new thinking, not just to celebrate past successes. Any critiques of past efficiency specifications or programs are offered in the spirit of improving future ones, not casting blame or criticizing actions in the past. To the extent I believe ENERGY STAR and other efficiency programs could be more effective in the future, that has nothing to do with the earnestness and commitment of the staff that have been doing the hard work to label energy efficient products for many years. It has everything to do with the very real challenge of keeping specifications stringent and current in a world of limited staff, constrained budgets, and ever-increasing political pressure to yield to manufacturers’ wishes. I would also like to gratefully acknowledge the extensive research and charting assistance of my former Ecos colleagues Peter May-Ostendorp and Brooke Frazer, as well as my current Ecos colleague Catherine Mercier. I am thankful also for the time Gregg Hardy has provided for me to do this work; it would not have been possible without some freedom from the day to day responsibilities of managing projects, teams, and budgets.

Is Efficient Sufficient? 39 22 March 2010
It has been a privilege to spend the last 18 months reading much of the growing body of energy-related literature on progressive efficiency, sufficiency, and consumption. In the process, I learned that many others in our field and related fields have been pursuing similar ideas simultaneously (and in many cases even earlier than they first occurred to me), which suggests some broader resonance to the thinking behind them. This paper stands on the shoulders of the many scholars who went before me and employs terminology first developed by them. I want to acknowledge here the breadth and depth of their original work and I commend the following authors and documents to those wishing to investigate these topics further: Progressive Efficiency and Sufficiency Concepts Alan Meier, “Living in a Carbon-Constrained World,” editorial in Home Energy, March/April 2000, p. 2. Thomas Princen, The Logic of Sufficiency, MIT Press, Cambridge, Massachusetts, 2005. Jeffrey Harris, Rick Diamond, Maithili Iyer, Christopher Payne, Carl Blumstein, and Hans-Paul Siderius, “Towards a sustainable energy balance: progressive efficiency and the return of energy efficiency,” Energy Efficiency, Springer Science + Business Media, April 4, 2008. (Articles in the on-line version of Energy Efficiency are available for eceee members at www.eceee.org). Focusing on Consumption as an Alternative to Efficiency Horace Herring, “Does energy efficiency save energy? The debate and its consequences,” Applied Energy, Vol. 63, 1999, pp. 209-226. Thomas Princen, Michael Maniates, and Ken Conca - editors, Confronting Consumption, MIT Press, Cambridge, Massachusetts, 2002. Hal Wilhite and Jørgen S. Norgard, A case for self-deception in energy policy, Proceedings of the eceee 2003 Summer Study in Energy Efficiency. (www.eceee.org/conference_proceedings/eceee/2003c/Panel_1/1206wilhite/) Harold Wilhite and Jorgen S. Norgard, “Equating efficiency with reduction: a self-deception in energy policy,” Energy & Environment, Vol. 15, No. 6, 2004, pp. 991-1009. Mithra Moezzi and Rick Diamond, Is Efficiency Enough? Towards a New Framework for Carbon Savings in the California Residential Sector, prepared by Lawrence Berkeley National Laboratory for the California Energy Commission’s Public Interest Energy Research (PIER) program, CEC-500-2005-162, October 2005.