Embed Size (px)
Citation preview
PATHWAYSResearch
on Pathwaysto Desistance
Volume 19
Is Desistance Just a Waiting Game?
Continued Inside
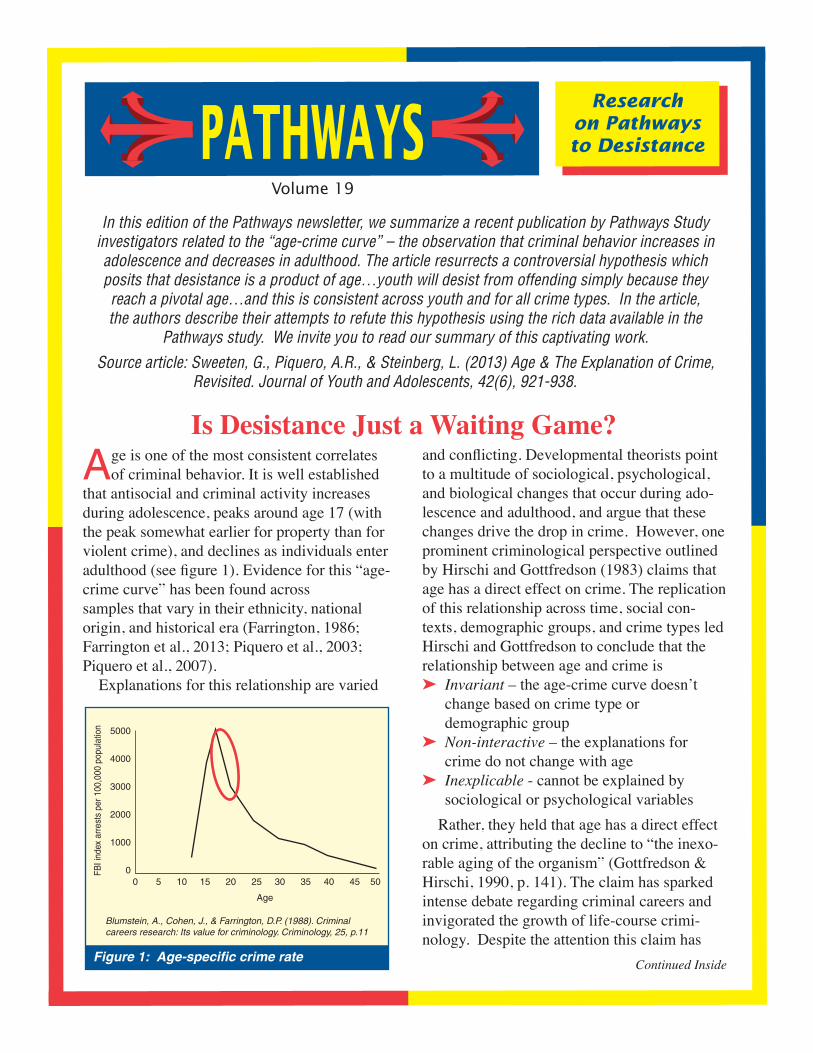
Age is one of the most consistent correlates of criminal behavior. It is well established
that antisocial and criminal activity increases during adolescence, peaks around age 17 (with the peak somewhat earlier for property than for violent crime), and declines as individuals enter adulthood (see figure 1). Evidence for this “age-crime curve” has been found across samples that vary in their ethnicity, national origin, and historical era (Farrington, 1986; Farrington et al., 2013; Piquero et al., 2003; Piquero et al., 2007).
Explanations for this relationship are varied
and conflicting. Developmental theorists point to a multitude of sociological, psychological, and biological changes that occur during ado-lescence and adulthood, and argue that these changes drive the drop in crime. However, one prominent criminological perspective outlined by Hirschi and Gottfredson (1983) claims that age has a direct effect on crime. The replication of this relationship across time, social con-texts, demographic groups, and crime types led Hirschi and Gottfredson to conclude that the relationship between age and crime is➤ Invariant – the age-crime curve doesn’t change based on crime type or demographic group➤ Non-interactive – the explanations for crime do not change with age➤ Inexplicable - cannot be explained by sociological or psychological variables
Rather, they held that age has a direct effect on crime, attributing the decline to “the inexo-rable aging of the organism” (Gottfredson & Hirschi, 1990, p. 141). The claim has sparked intense debate regarding criminal careers and invigorated the growth of life-course crimi-nology. Despite the attention this claim has
5000
4000
3000
2000
1000
00 5 10 15 20 25 30 35 40 45 50
Age
FBI i
ndex
arr
ests
per
100
,000
pop
ulat
ion
Figure 1: Age-specific crime rate
In this edition of the Pathways newsletter, we summarize a recent publication by Pathways Study investigators related to the “age-crime curve” – the observation that criminal behavior increases in adolescence and decreases in adulthood. The article resurrects a controversial hypothesis which posits that desistance is a product of age…youth will desist from offending simply because they reach a pivotal age…and this is consistent across youth and for all crime types. In the article, the authors describe their attempts to refute this hypothesis using the rich data available in the
Pathways study. We invite you to read our summary of this captivating work.
Source article: Sweeten, G., Piquero, A.R., & Steinberg, L. (2013) Age & The Explanation of Crime, Revisited. Journal of Youth and Adolescents, 42(6), 921-938.
Blumstein, A., Cohen, J., & Farrington, D.P. (1988). Criminal careers research: Its value for criminology. Criminology, 25, p.11
received, however, few direct empirical tests of it have been conducted and no study to date has provided evidence to refute the theory.
Why does it matter?The finality of the Hirschi & Gottfredson’s
claim is not simply academic discourse; if it is true that individuals will simply “age out of crime”, than the fundamental premise of the ju-venile justice system is called into question. In this framework, efforts by the juvenile system to intervene in the life of youth in order to stop offending behavior or hasten the decline would be futile; the system could therefore stop the practice of intervention and focus instead on retribution and incapacitation while waiting for time to pass.
Not so fast….Since the Gottfredson & Hirschi theory
emerged, various studies have examined as-pects of their three-pronged hypothesis. This work has hinted that the story may not stop with age alone. ➤ Tests of the invariance hypothesis have produced evidence of variation in the shape of the age-crime curve for particular offenses or subpopulation and advances in statistical approaches (e.g., group-based trajectory analysis) have reinforced this notion➤ Tests of the non-interactive hypothesis have produced evidence that some factors (e.g., employment, marriage) do have an influence on offending which varies with age➤ Tests of the inexplicability hypothesis have indicated that, although no single variable could explain the age effect, theoretically relevant sets of variables (e.g., several measures of peer relations) could account for some of the reduction in offending with age
The last set of findings regarding the inex-plicability hypothesis intrigued the Pathways study investigators, who recognized the op-portunity to examine this issue in a sample
of serious offenders---which has never been assessed. One of the biggest strengths of the Pathways data is the breadth of theoretically-relevant sociological and psychological vari-ables that are repeatedly measured in 10 waves across seven years. Unlike some of the previ-ous studies, the investigators would be able to simultaneously assess the strength of constructs from a number of domains to account for the age-crime relationship. The opportunity to test this relationship among active offenders would also be a benefit since many community and school-based samples have very low rates of of-fending which reduces the ability of any of the constructs tested to explain variation (i.e., there just isn’t that much variation to explain).
The study investigators used data from over 1,300 Pathways participants to test Hirschi & Gottfredson’s claim that the age-crime curve cannot be explained by sociological or psychological variables. Specifically, they used multilevel longitudinal models to assess the extent to which the direct effects of age are reduced to statistical and substantive non-significance when constructs from a wide range of developmental and criminological theories are accounted for. The variables the investigators took into account represent differing theoretical perspectives regarding crime, including:➤ social control- formal and informal controls ac count for crime (e.g., employment and marriage),

➤ procedural justice – people engage in crime because they have had a bad experience in the system which dampens their respect for “the law” (e.g., perceptions of the legitimacy and fairness of the legal system), ➤ social learning –people engage in crime because they associate with other people who commit crime (e.g., gang membership and exposure to antisocial peers), ➤ strain - social structures within society pressure individuals to commit crime (e.g., victimization and relationship breakup), ➤psychosocial maturity- people engage in crime because they have not yet developed internal controls or an ability to see beyond themselves (e.g., impulse control, self-regulation and moral disengagement), and➤ rational choice- youth engage in crime based on a rational consideration of factors such as potential benefits and costs (e.g., costs and rewards of crime).
First the authors looked to see how crime and age related to each other in the Pathways sample, without any other factors considered (see figure 2). This shows that the level of self-reported delinquency drops considerably as the Pathways sample ages, as would be expected.
The authors then looked to see if the variables from each of the six perspec-tives simultaneously influenced the “within person” variety of self-reported offending activities. That is, did changes over time for person X in variables related to social control influence the offending of person X? Did changes over time for person X in variables related to maturity influence the offending of person X? And so on.
What did they find?A strict interpretation of the inexplicabil-
ity hypothesis put forth by Hirschi & Gott-
Figure 2: Average offending variety score at each wave: Pathways study participants
15 16 17 18 19 20 21 22 23 24 25 Age
Sel
f-re
port
ed O
ffend
ing
Var
iety
4.5
4
3.5
3
2.5
2
1.5
1
0.5
0
Baseline
fredson would expect factors other than age to have no bearing on the drop-off in variety of offending (the number of distinct problem be-haviors engaged in by the youth). The findings from the current study do not fully support this statement. On the contrary, the investigators found that variables from the 6 perspectives, assessed separately, explained anywhere from 3% (procedural justice) to 49% (social learn-
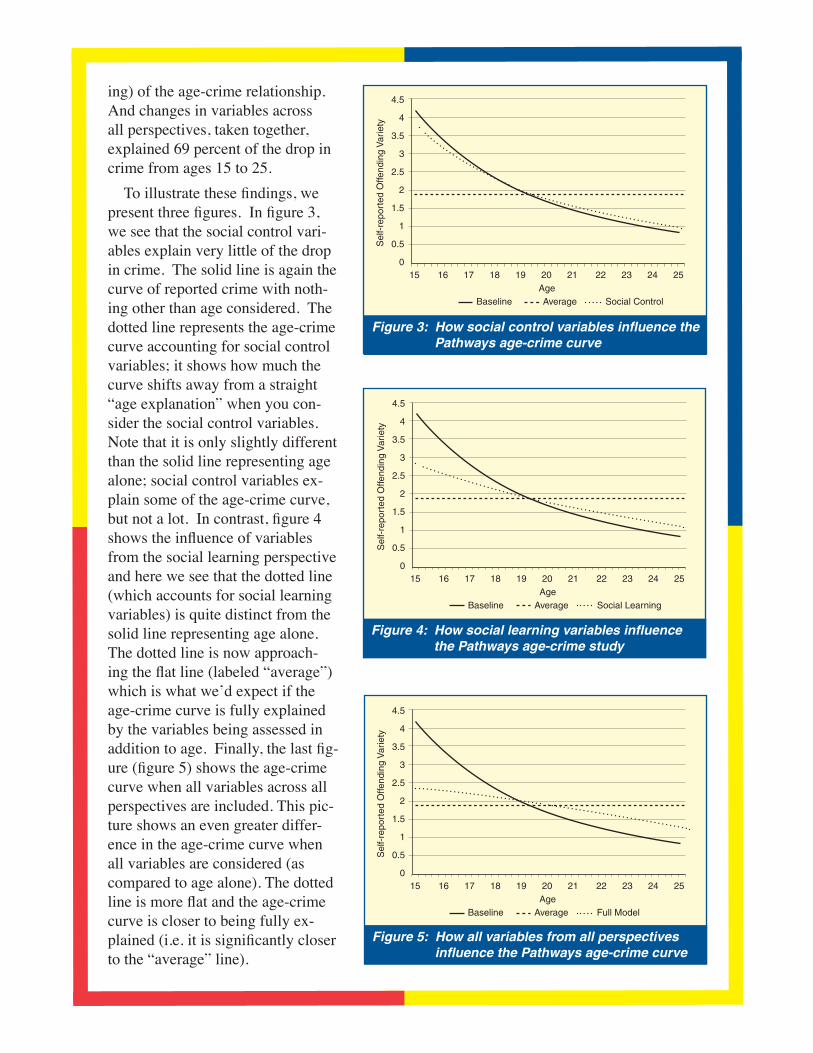
Figure 5: How all variables from all perspectives influence the Pathways age-crime curve
15 16 17 18 19 20 21 22 23 24 25 Age
Sel
f-re
port
ed O
ffend
ing
Var
iety
4.5
4
3.5
3
2.5
2
1.5
1
0.5
0
Baseline Average Full Model
ing) of the age-crime relationship. And changes in variables across all perspectives, taken together, explained 69 percent of the drop in crime from ages 15 to 25.
To illustrate these findings, we present three figures. In figure 3, we see that the social control vari-ables explain very little of the drop in crime. The solid line is again the curve of reported crime with noth-ing other than age considered. The dotted line represents the age-crime curve accounting for social control variables; it shows how much the curve shifts away from a straight “age explanation” when you con-sider the social control variables. Note that it is only slightly different than the solid line representing age alone; social control variables ex-plain some of the age-crime curve, but not a lot. In contrast, figure 4 shows the influence of variables from the social learning perspective and here we see that the dotted line (which accounts for social learning variables) is quite distinct from the solid line representing age alone. The dotted line is now approach-ing the flat line (labeled “average”) which is what we’d expect if the age-crime curve is fully explained by the variables being assessed in addition to age. Finally, the last fig-ure (figure 5) shows the age-crime curve when all variables across all perspectives are included. This pic-ture shows an even greater differ-ence in the age-crime curve when all variables are considered (as compared to age alone). The dotted line is more flat and the age-crime curve is closer to being fully ex-plained (i.e. it is significantly closer to the “average” line).
Figure 3: How social control variables influence the Pathways age-crime curve
15 16 17 18 19 20 21 22 23 24 25 Age
Sel
f-re
port
ed O
ffend
ing
Var
iety
4.5
4
3.5
3
2.5
2
1.5
1
0.5
0
Baseline Average Social Control
Figure 4: How social learning variables influence the Pathways age-crime study
15 16 17 18 19 20 21 22 23 24 25 Age
Sel
f-re
port
ed O
ffend
ing
Var
iety
4.5
4
3.5
3
2.5
2
1.5
1
0.5
0
Baseline Average Social Learning
PATHWAYS PERSONNEL Edward P. Mulvey, Ph.D.Carol Schubert, M.P.H.
University of Pittsburgh Medical Center3811 O’Hara Street • Pittsburgh, PA 15213Phone: (412) 647-4760 • Fax: (412) 647-4751
The authors conclude that the relation-ship between age and crime in adolescence and early adulthood is largely explainable, though not entirely, and attributable to mul-tiple co-occurring developmental changes. They found the strongest explanation in the social learning variables (exposure to anti-social peers and antisocial peer pressure). Each of the six tested theoretical perspectives, how-ever, had at least one variable that was a statistically significant pre-dictor of the shift in the level of reported crime. Thus, the age-crime relationship cannot be reduced to a single theory or overarching construct. These findings also imply that efforts by the juvenile justice system to intervene in the lives of youth involved in crime indeed offer promise. This is a story of hope that interventions can have a positive, sizable effect.
References (all cited in source article):Farrington, D. P. (1986). Age and crime. In M. Tonry & N. Morris (Eds.), Crime and justice: An annual review of research, vol. 7 (pp. 189-250). Chicago: University of Chicago Press.
Farrington, D.P., Piquero, A.R., & Jennings, W.G. (2013). Offending from childhood to late middle age: Recent results from the Cambridge Study in Delinquent Development. New York: Springer
Gottfredson, M.R., & Hirschi, T. (1990). A general theory of crime. Stanford, CA: Stanford University Press.
Hirschi, T., & Gottfredson, M. R. (1983). Age and the explanation of crime. American Journal of Sociology, 89, 552-84.
Piquero, A. R., Farrington, D. P., & Blumstein, A. (2003). The criminal career paradigm. In M. Tonry (Ed.), Crime and justice: A review of research, Vol. 30 (pp. 359-506). Chicago: University of Chicago Press.
Piquero, A. R., Farrington, D. P., & Blumstein, A. (2007). Key issues in criminal careers research: New analysis from the Cambridge study in delinquent development. Cambridge: Cambridge University Press.
Would you like to access the Pathways study data?The Pathways study data is available for use at the Interuniversity Consortium for Political and Social Research (ICPSR). Currently, the baseline subject and collateral data is available for public use as well as the time-point interview data. Some official record data (e.g. arrest) and the release interview data is available at the “restricted access” level. Below are links to each dataset on the ICPSR site.
◉ Baseline data: http://www.icpsr.umich.edu/icpsrweb/ICPSR/studies/29961 or http://dx.doi.org/10.3886/ICPSR29961.v1
◉ Subject data: http://dx.doi.org/10.3886/ICPSR29961
◉ Collateral data: http://dx.doi.org/10.3886/ICPSR32881 or http://www.icpsr.umich.edu/icpsrweb/NAHDAP/studies/32881
◉ Release interview data: http://dx.doi.org/10.3886/ICPSR34488.v1 or http://www.icpsr.umich.edu/icpsrweb/NAHDAP/studies/34488
◉ Official record reports of petitions/arrest prior to and after the study baseline interview: http://www.icpsr.umich.edu/icpsrweb/NAHDAP/studies/34605
We anticipate the release of the life-calendar data and additional official record data in December, 2013. These will also be restricted access. Visit the ICPSR website for instructions regarding accessing restricted data: http://www.icpsr.umich.edu. Visit the Pathways website for more information regarding each of these data sources: www.pathwaysstudy.pitt.edu

Coordinating CenterUniversity of Pittsburgh Medical Center3811 O’Hara StreetPittsburgh, PA 15213
Phone: 412-647-4760Fax: 412-647-4751