Embed Size (px)
Citation preview
Is Declining Union Membership Contributing to Low Wages Growth?
James Bishop and Iris Chan
Research Discussion Paper
R D P 2019 - 02

Figures in this publication were generated using Mathematica.
The contents of this publication shall not be reproduced, sold or distributed without the prior consent of the Reserve Bank of Australia and, where applicable, the prior consent of the external source concerned. Requests for consent should be sent to the Secretary of the Bank at the email address shown above.
ISSN 1448-5109 (Online)
The Discussion Paper series is intended to make the results of the current economic research within the Reserve Bank available to other economists. Its aim is to present preliminary results of research so as to encourage discussion and comment. Views expressed in this paper are those of the authors and not necessarily those of the Reserve Bank. Use of any results from this paper should clearly attribute the work to the authors and not to the Reserve Bank of Australia.
Enquiries:
Phone: +61 2 9551 9830 Facsimile: +61 2 9551 8033 Email: [email protected] Website: https://www.rba.gov.au

Is Declining Union Membership Contributing to Low Wages Growth?
James Bishop and Iris Chan
Research Discussion Paper 2019-02
April 2019
Economic Research Department Reserve Bank of Australia
We would like to thank Natasha Cassidy, Gianni La Cava, Tom Rosewall, Peter Siminski, John Simon,
and seminar participants at the Reserve Bank of Australia, the University of Sydney and the Asian
and Australasian Society of Labour Economics 2018 Conference for their helpful comments. The
views expressed in this paper are ours and do not necessarily reflect the views of the Reserve Bank
of Australia. Any errors are our own.
Authors: bishopj and chani at domain rba.gov.au
Media Office: [email protected]
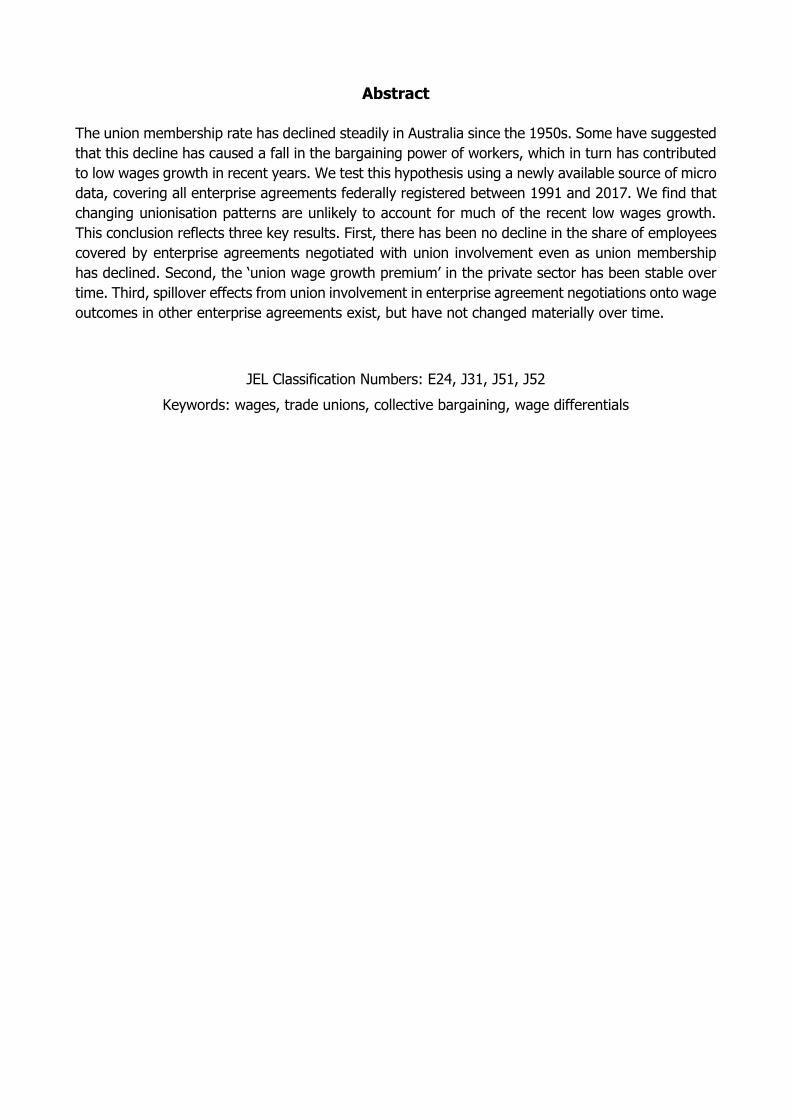
Abstract
The union membership rate has declined steadily in Australia since the 1950s. Some have suggested
that this decline has caused a fall in the bargaining power of workers, which in turn has contributed
to low wages growth in recent years. We test this hypothesis using a newly available source of micro
data, covering all enterprise agreements federally registered between 1991 and 2017. We find that
changing unionisation patterns are unlikely to account for much of the recent low wages growth.
This conclusion reflects three key results. First, there has been no decline in the share of employees
covered by enterprise agreements negotiated with union involvement even as union membership
has declined. Second, the ‘union wage growth premium’ in the private sector has been stable over
time. Third, spillover effects from union involvement in enterprise agreement negotiations onto wage
outcomes in other enterprise agreements exist, but have not changed materially over time.
JEL Classification Numbers: E24, J31, J51, J52
Keywords: wages, trade unions, collective bargaining, wage differentials
Table of Contents
1. Introduction 1
2. What Can Previous Research Tell Us? 2
3. Has There Been a Decline in Union Involvement in Wage Setting? 6
4. Is There a ‘Union Wage Growth Premium’ and Has This Shrunk over Time? 10
4.1 Data 12
4.1.1 Constructing agreement families 12
4.1.2 Measuring wage outcomes 13
4.1.3 Sample for estimation 14
4.2 Empirical Approach 14
4.2.1 Potential omitted variable bias 15
4.2.2 Transition probabilities 15
4.3 Baseline Results 16
4.4 Robustness Checks 17
4.4.1 Weighting by employee numbers 18
4.4.2 Accounting for renegotiation delays 19
4.4.3 Controlling for firm-specific shocks 20
4.4.4 Controlling for inertia in wage setting 21
4.4.5 Sample selection bias 21
4.5 Has the Union Wage Growth Premium Changed over Time? 22
4.5.1 Trends in the unmatched sample 23
4.6 Dynamics of the Union Wage Growth Premium 24
4.6.1 Implications of the dynamics 26
4.7 An Alternative Identification Strategy: A Natural Experiment 27
4.7.1 The natural experiment 27
4.7.2 Difference-in-differences model 29
4.7.3 Graphical results 30
4.7.4 Difference-in-differences results 31
4.7.5 Backing out the union wage growth premium 32
5. Are There Spillover Effects onto Wage Outcomes in Other Enterprise Agreements? 34
5.1 Spillover Effects Model 34
5.2 Spillover Effects Results 34
6. Conclusion: What Has Been the Overall Effect on Wages Growth? 36
Appendix A : Definitional Changes under the Fair Work Act 2009 38
Appendix B : Descriptive Statistics for Baseline Sample 39
Appendix C : Descriptive Statistics for Difference-in-differences Sample 41
References 42
Copyright and Disclaimer Notice 46

1. Introduction
The union membership rate in Australia has declined steadily since the middle of the 20th century.1
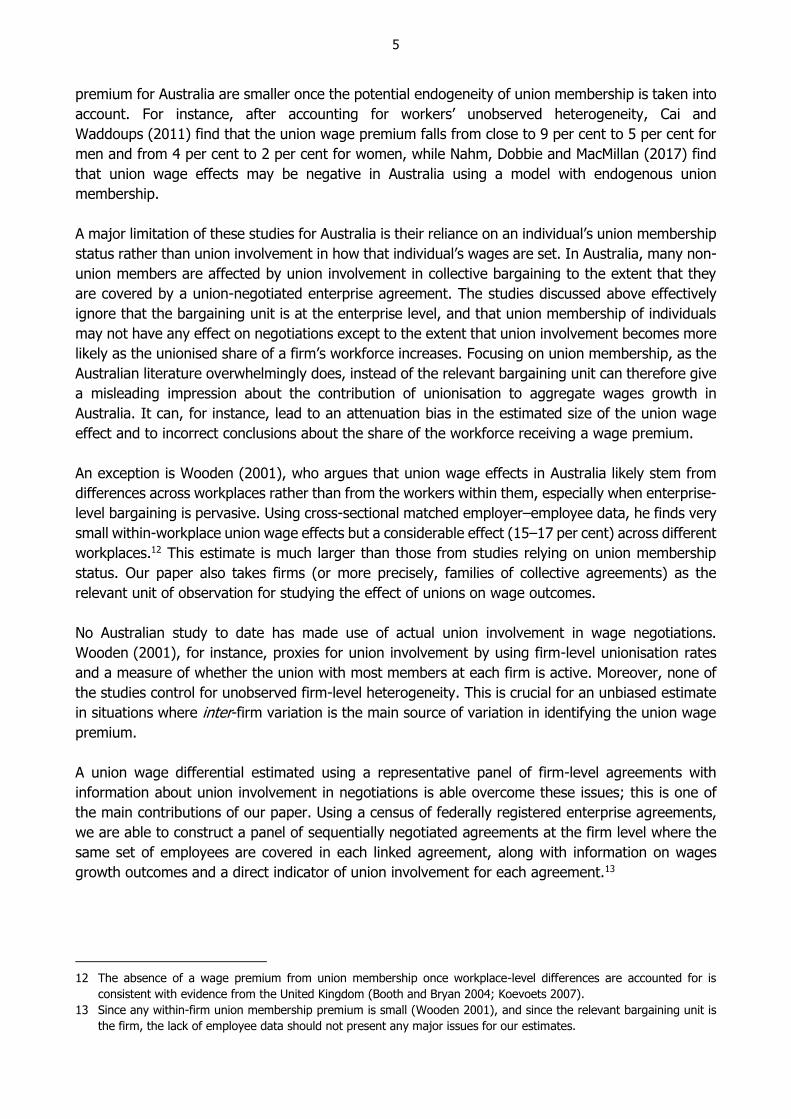
As at 2018, around 15 per cent of wage earners were members of a union (Figure 1). Some have
suggested that declining union membership has led to a fall in the bargaining power of workers,
which in turn has contributed to low wages growth over recent years (for instance, Isaac (2018) and
Leigh (2018)).2 This argument is typically based on academic research that finds an hourly wage
premium associated with trade union membership, even after taking account of differences in
workers’ skills, industry and location.
Figure 1: Trade Union Membership Rate
Share of all employees
Note: Excluding owner managers of incorporated enterprises
Sources: ABS; Authors’ calculations
While focusing on the union membership rate makes sense in countries where there is a tight link
between union membership and union involvement in wage bargaining (such as the United States),
it makes less sense in Australia.3 This is because a growing share of Australian employees choose
not to be union members but continue to be covered by a union-negotiated enterprise agreement.
Focusing on union membership – as much of the literature does – can therefore give a misleading
impression about the contribution of unionisation to aggregate wages growth in Australia. We argue
that a more appropriate measure of union influence on wages is the number of workers covered by
a union-negotiated enterprise agreement, regardless of membership status. Similarly, the causal
1 The union membership rate peaked in 1948 (Bowden 2011). See Productivity Commission (2015, pp 105–106) for a
brief discussion of the factors driving the more recent decline in the membership rate.
2 See Haldane (2017) for a discussion of the case in the United Kingdom.
3 Union membership is a good proxy for union coverage in the United States since once organised, most employees in
a firm tend to join the union (Bryson 2007).
20122006200019941988 20180
10
20
30
40
%
0
10
20
30
40
%
2
impact of unions on wage outcomes should be measured through their involvement at the enterprise
agreement level instead of through individuals’ union membership status.
To our knowledge, this is the first paper for Australia to estimate a union premium that both accounts
for union involvement at the agreement level and unobserved firm heterogeneity. It is also the first
time that administrative micro data on collective workplace agreements with union status information
have been used to produce estimates of union wage effects for Australia.
We present three key findings based on a census of federally registered enterprise agreements
between 1991 and 2017. First, despite declining union membership rates, the share of the workforce
covered by enterprise agreements negotiated with union involvement has not changed materially
over time. Second, the size of the private sector ‘union wage growth premium’ (the additional wages
growth employees receive by having a union involved in wage negotiations with the firm) has
remained stable at around ⅓ percentage point per year, despite changes to the industrial relations
framework over our sample period. This premium is estimated using changes in union involvement
in collective bargaining for the same firm over time. Our estimate is robust to a range of
methodological choices and an alternative identification strategy using an exogenous change to
union involvement. Third, we find little evidence that the spillover effects of union involvement onto
wages in other enterprise agreements have changed in recent years.
Based on these results, we conclude that trends in unionisation rates are unlikely to have contributed
materially to the decline in wages growth in recent years. It is important to note that this conclusion
is limited to only the most direct channel in which unions influence wages in Australia – taking part
in enterprise-level bargaining – and does not account for other aspects of influence. For instance,
declining membership may have affected unions’ ability to influence other wage outcomes in the
economy, or diverted limited resources away from non-wage matters. These are avenues for further
research.
2. What Can Previous Research Tell Us?
The literature on the link between union membership and wages is vast. This research generally
finds that employees who are members of a union tend to earn more than those who are not.4
However, to our knowledge the existing research has not directly examined the question of whether
declining union membership has contributed to the slow wages growth in advanced economies in
recent years; this is one of our paper’s main contributions.5 The closest related studies are those
that examine the impact of unions on wage flexibility, the labour share of income, and inequality.
The findings of these studies are mixed. Lower union membership has been found to be associated
with lower downward nominal and real wage rigidity (Dickens et al 2007; Holden and
Wulfsberg 2008), suggesting that declining unionisation may have reduced barriers to implementing
smaller wage increases. On the other hand, Elsby, Hobijn and Şahin (2013) find that the decline in
unionisation rates does not explain much of the decline in the labour share of income in the
United States. Moreover, despite large changes in union density, the differential in wage levels
4 See Farber et al (2018) for a brief review.
5 Papers that have drawn such a link tend to have a narrative focus and rely on the correlation between union density
and low wages growth (e.g. Mishel (2012); Shambaugh et al (2017, p 6); Bell and Blanchflower (2018, p 13); see
Isaac (2018) for an Australian example).
3
between union and non-union workers has remained essentially unchanged over much of the last
century in the United States (Farber et al 2018).6
Even if a stable wage level gap exists between union and non-union workers, as suggested by the
literature, it does not necessarily follow that declining unionisation rates would contribute to slower
wages growth. This could be for several reasons.
First, any observed wage differentials may reflect underlying differences between union and non-
union workers rather than any causal effect of unions on wages.7 If, say, union members are more
productive than otherwise similar non-union members, the observed correlation between union
membership and wages may overstate the causal effect of unions.8 One approach to dealing with
non-random selection has been to compare the wage rates for the same individual who switches
between jobs, one of which is unionised and the other which is not (for instance, Lemieux (1998)).
Other studies exploit discontinuities in unions’ ability to bargain to identify a causal effect. A
prominent example is DiNardo and Lee (2004), who use a regression discontinuity design around
the threshold at which a unionisation vote is barely lost or won to conclude that unionisation has
little effect on wages, business survival, employment, output and productivity in the United States.
The second important insight from the literature is that the size of this wage level premium depends
crucially on the unit of observation of the data used to estimate it. Most studies examine employee-
level survey data, rather than firm-level data as we do in this paper. This can have implications for
the results since union membership is not necessarily the same as union coverage in wage setting
– a point that we will return to later. In countries where union membership is considerably different
from union coverage, estimates of the premium can differ substantially depending on whether
employee-, firm- or industry-level data is used (Koevoets 2007; Fitzenberger, Kohn and
Lembcke 2013).9
A third issue, which is addressed less frequently in the literature, is how quickly union wage effects
emerge after workers at a firm first unionise. Most studies produce point-in-time estimates for a
given cross-section of firms or employees. It is unclear from these studies whether the observed
differences in wage levels between union and non-union members have emerged gradually over
time through a slow accumulation of differences in annual wages growth rates, or whether they
result from a ‘first contract effect’ – as Freeman and Kleiner (1990) argue – in which the immediate
6 Some studies have found a slight decline in the US union wage gap in recent decades (Blanchflower and Bryson 2004;
Hirsch 2010).
7 Other factors that could account for the correlation between union membership and wages include the low mobility
between union and non-union jobs, and mismeasurement of union status (Freeman 1984; Card 1996; Hirsch 2004).
8 There are similar omitted variable bias problems in firm-level studies: for example, unions may be more likely to
organise at profitable firms that are more likely to grow and pay higher wages.
9 Even where there is a close link between union membership and union coverage, as in the United States, firm-level
data may still be more appropriate for estimating the direct effects of a workplace becoming unionised (e.g. Freeman
and Kleiner 1990). For instance, employee-level studies may find different union wage premiums than firm-level
studies if the wage effects of a worker moving from the non-union to the union sector differs from any additional
amount that a firm must offer its workforce when it becomes unionised, if there is unobserved firm-level heterogeneity,
or if union status is measured more accurately for firms than for individuals (Freeman 1984; Freeman and Kleiner 1990;
Card 1996; LaLonde, Marschke and Troske 1996; DiNardo and Lee 2004). Some studies using employee-level data
attempt to limit the bias by including only those covered by union contracts in their sample (e.g. Budd and Na 2000;
Booth and Bryan 2004). Conclusions from such studies are necessarily limited to the wage difference between union
members and ‘free riders’ who nonetheless receive some of the union’s services, and cannot tell us the wage difference
caused by unions.
4
adjustment to wages on initial unionisation may differ from ongoing effects. This distinction is
important for our research question, as we are ultimately interested in how changing union activity
might cause the path of wages growth to evolve. Several papers distinguish between immediate and
lagged impacts of unionisation on wage levels. Freeman and Kleiner (1990) and DiNardo and
Lee (2004), for instance, attempt to reconcile estimates of the wage level gap between union and
non-union employees at a given point in time (which tend to be large) with estimates of the
immediate effect of union entry on wages (which tend to be small). These authors argue that such
differences may reflect that point-in-time estimates of the union wage premium capture a
combination of short- and long-run effects of union entry on wages (given that some firms have
become unionised workplaces more recently than other firms), while studies on union entry identify
only the effects from recent entry.10 This distinction matters if union involvement has a persistent
effect on wages growth over time, as we will argue in this paper.
Our study also distinguishes between long- and short-run wage effects as we believe this has
important implications for the link between unions and aggregate wages growth. Our approach to
doing this is more direct than in other studies in that our outcome variable of interest is the growth
rate of wages rather than the level. That is, we examine how wage increases that workers receive
each year differ by whether a union was involved in the negotiations. We also study whether this
‘union wage growth premium’ changes over time after a union first becomes involved, by making
use of data on sequential wage negotiations for the same group of workers over several decades.
Studies for Australia have focused on the wage level premium and faced similar limitations and
challenges to the overseas research discussed above. No Australian study to date has directly
examined the link between unions and aggregate wages growth, nor distinguished between the
short- and longer-term effects of union involvement in negotiations on wage outcomes. Most studies
of the union wage premium for Australia use survey data on individual workers to compare wages
of union members with wages of non-members. Most studies before the 1990s found evidence for
a union wage premium, despite Australia at the time having a highly centralised system of wage
setting in which a large number of workers were covered by the same awards regardless of their
union membership. The estimates in these studies ranged from around 5 to 15 per cent
(e.g. Christie (1992), Kornfeld (1993); see Miller and Mulvey (1993) for a comprehensive survey of
early major studies). By contrast, Miller and Mulvey (1996) find the union wage effect to be negligible
once firm size is accounted for.
A limited number of studies have re-examined this differential since Australia’s industrial relations
system shifted towards enterprise-level bargaining in the early 1990s, along with the ban on
compulsory unionism. These studies again tend to use survey data on employees and rely on
variation in union membership status. Most use individual-level panel data from the Household,
Income and Labour Dynamics in Australia (HILDA) Survey to find a small to negative union wage
premium.11 Cai and Liu (2008) find a union wage effect for men but not women, and a larger effect
at the lower end of the wage distribution. Studies have also found that estimates of the union wage
10 The distinctions between immediate and longer-run union effects have also been found in non-wage outcomes. Lee
and Mas (2012) is one such example. Using a regression discontinuity design on US data, the authors find almost no
immediate impact from union entry on a firm’s equity value, and that the full effect takes 15–18 months to appear.
11 Unlike these studies, Waddoups (2005) uses repeated cross-sectional data between 1993 and 2001 to conclude that
declining union density and industrial relations reforms had widened the union wage differential in highly unionised
industries.
5
premium for Australia are smaller once the potential endogeneity of union membership is taken into
account. For instance, after accounting for workers’ unobserved heterogeneity, Cai and
Waddoups (2011) find that the union wage premium falls from close to 9 per cent to 5 per cent for
men and from 4 per cent to 2 per cent for women, while Nahm, Dobbie and MacMillan (2017) find
that union wage effects may be negative in Australia using a model with endogenous union
membership.
A major limitation of these studies for Australia is their reliance on an individual’s union membership
status rather than union involvement in how that individual’s wages are set. In Australia, many non-
union members are affected by union involvement in collective bargaining to the extent that they
are covered by a union-negotiated enterprise agreement. The studies discussed above effectively
ignore that the bargaining unit is at the enterprise level, and that union membership of individuals
may not have any effect on negotiations except to the extent that union involvement becomes more
likely as the unionised share of a firm’s workforce increases. Focusing on union membership, as the
Australian literature overwhelmingly does, instead of the relevant bargaining unit can therefore give
a misleading impression about the contribution of unionisation to aggregate wages growth in
Australia. It can, for instance, lead to an attenuation bias in the estimated size of the union wage
effect and to incorrect conclusions about the share of the workforce receiving a wage premium.
An exception is Wooden (2001), who argues that union wage effects in Australia likely stem from
differences across workplaces rather than from the workers within them, especially when enterprise-
level bargaining is pervasive. Using cross-sectional matched employer–employee data, he finds very
small within-workplace union wage effects but a considerable effect (15–17 per cent) across different
workplaces.12 This estimate is much larger than those from studies relying on union membership
status. Our paper also takes firms (or more precisely, families of collective agreements) as the
relevant unit of observation for studying the effect of unions on wage outcomes.
No Australian study to date has made use of actual union involvement in wage negotiations.
Wooden (2001), for instance, proxies for union involvement by using firm-level unionisation rates
and a measure of whether the union with most members at each firm is active. Moreover, none of
the studies control for unobserved firm-level heterogeneity. This is crucial for an unbiased estimate
in situations where inter-firm variation is the main source of variation in identifying the union wage
premium.
A union wage differential estimated using a representative panel of firm-level agreements with
information about union involvement in negotiations is able overcome these issues; this is one of
the main contributions of our paper. Using a census of federally registered enterprise agreements,
we are able to construct a panel of sequentially negotiated agreements at the firm level where the
same set of employees are covered in each linked agreement, along with information on wages
growth outcomes and a direct indicator of union involvement for each agreement.13
12 The absence of a wage premium from union membership once workplace-level differences are accounted for is
consistent with evidence from the United Kingdom (Booth and Bryan 2004; Koevoets 2007).
13 Since any within-firm union membership premium is small (Wooden 2001), and since the relevant bargaining unit is
the firm, the lack of employee data should not present any major issues for our estimates.
6
The second contribution of our paper is to provide the first estimate of the share of Australia’s
workforce that is covered by an enterprise agreement negotiated with union involvement, and to
consider whether this has changed over time.
Finally, our paper estimates the union wage growth premium – and how it has changed over time –
for Australia using our enterprise-level dataset. This approach conveniently allows us to consider
more directly whether unions are contributing to the low wages growth of recent years. Our main
approach to estimating this premium is to track wages growth outcomes of firms over time as they
transition from having union involvement in bargaining to having no union involvement, or vice
versa. We are also able to use a series of legislative changes to provide useful exogenous variation
for causal identification. Our results provide some insight into how seemingly negligible immediate
effects from union entry could, over time, become the much larger union wage (level) premium seen
elsewhere in the literature.
3. Has There Been a Decline in Union Involvement in Wage Setting?
There are currently three methods of setting wages in Australia: awards, collective/enterprise
agreements, and individual arrangements. It is possible for unions to influence the wage outcomes
of employees covered by any of these methods, albeit to different degrees. The most direct channel
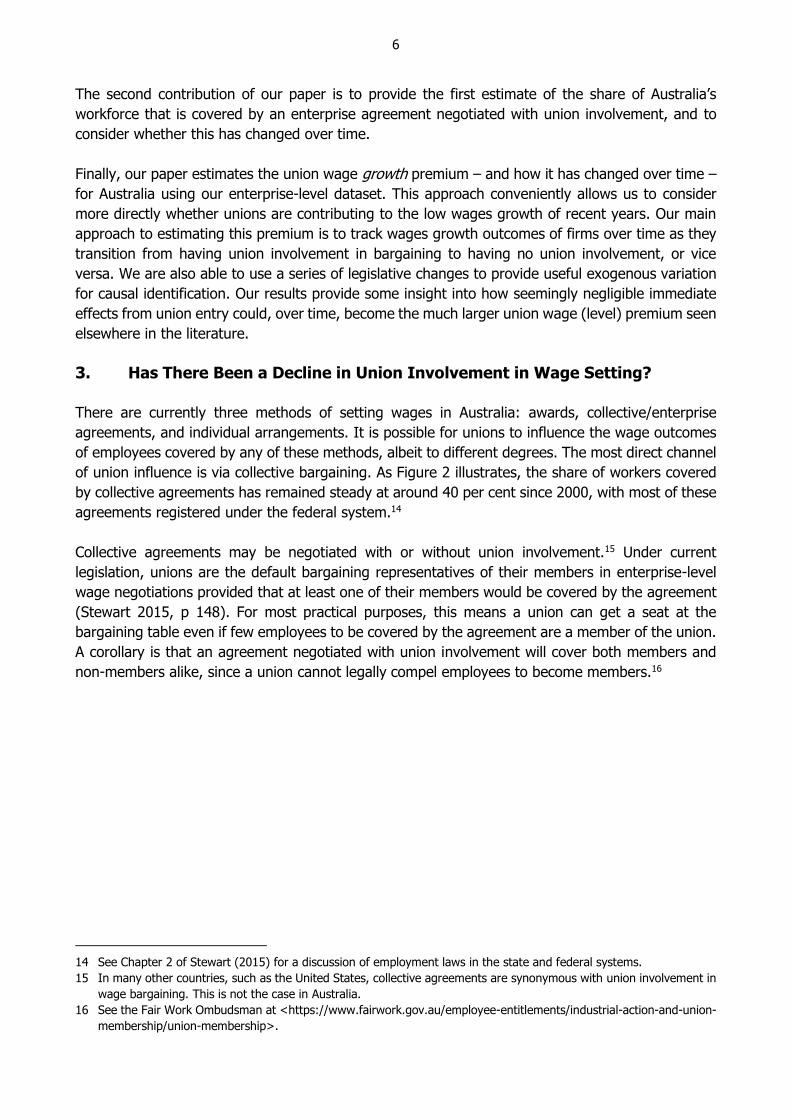
of union influence is via collective bargaining. As Figure 2 illustrates, the share of workers covered
by collective agreements has remained steady at around 40 per cent since 2000, with most of these
agreements registered under the federal system.14
Collective agreements may be negotiated with or without union involvement.15 Under current
legislation, unions are the default bargaining representatives of their members in enterprise-level
wage negotiations provided that at least one of their members would be covered by the agreement
(Stewart 2015, p 148). For most practical purposes, this means a union can get a seat at the
bargaining table even if few employees to be covered by the agreement are a member of the union.
A corollary is that an agreement negotiated with union involvement will cover both members and
non-members alike, since a union cannot legally compel employees to become members.16
14 See Chapter 2 of Stewart (2015) for a discussion of employment laws in the state and federal systems.
15 In many other countries, such as the United States, collective agreements are synonymous with union involvement in
wage bargaining. This is not the case in Australia.
16 See the Fair Work Ombudsman at <https://www.fairwork.gov.au/employee-entitlements/industrial-action-and-union-
membership/union-membership>.
7
Figure 2: Methods of Setting Pay
Share of all employees
Notes: Excluding owner managers of incorporated enterprises
(a) Data are unavailable for 2008 and not yet available for 2018
Sources: ABS; Authors’ calculations; Department of Jobs and Small Business; RBA
These features of collective bargaining in Australia have made it possible for the share of employees
covered by union-negotiated agreements to remain little changed since the mid 1990s despite a
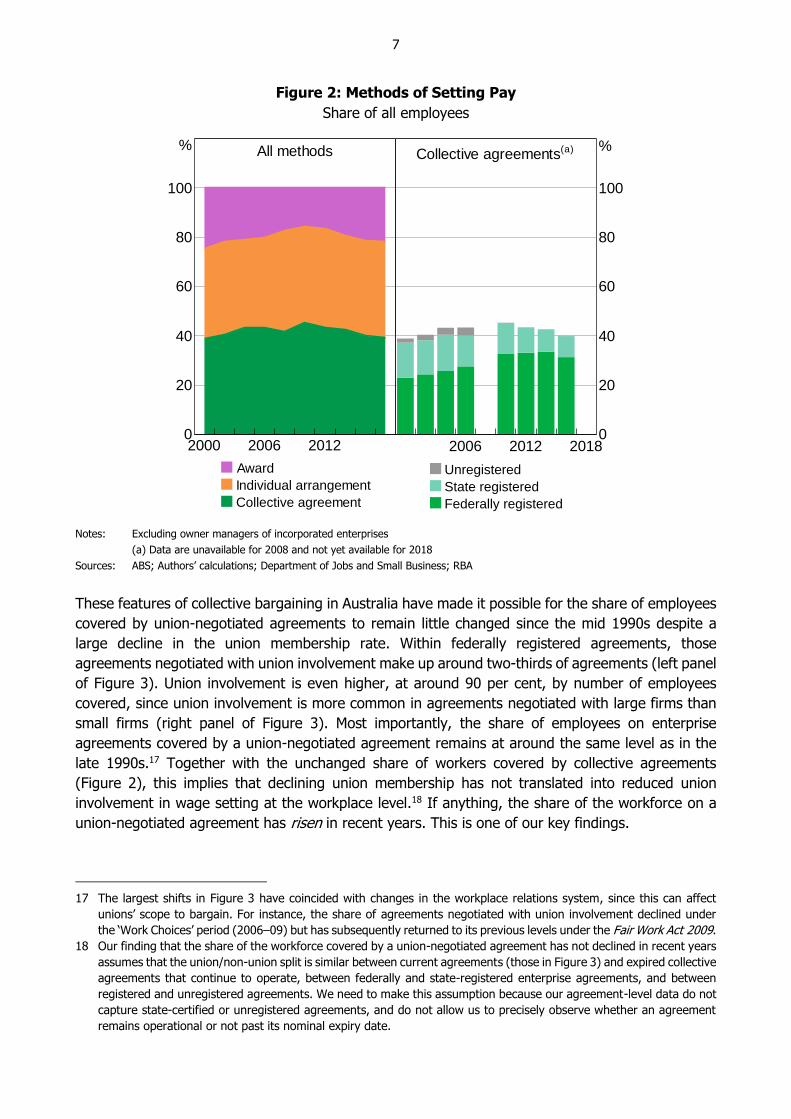
large decline in the union membership rate. Within federally registered agreements, those
agreements negotiated with union involvement make up around two-thirds of agreements (left panel
of Figure 3). Union involvement is even higher, at around 90 per cent, by number of employees
covered, since union involvement is more common in agreements negotiated with large firms than
small firms (right panel of Figure 3). Most importantly, the share of employees on enterprise
agreements covered by a union-negotiated agreement remains at around the same level as in the
late 1990s.17 Together with the unchanged share of workers covered by collective agreements
(Figure 2), this implies that declining union membership has not translated into reduced union
involvement in wage setting at the workplace level.18 If anything, the share of the workforce on a
union-negotiated agreement has risen in recent years. This is one of our key findings.
17 The largest shifts in Figure 3 have coincided with changes in the workplace relations system, since this can affect
unions’ scope to bargain. For instance, the share of agreements negotiated with union involvement declined under
the ‘Work Choices’ period (2006–09) but has subsequently returned to its previous levels under the Fair Work Act 2009.
18 Our finding that the share of the workforce covered by a union-negotiated agreement has not declined in recent years
assumes that the union/non-union split is similar between current agreements (those in Figure 3) and expired collective
agreements that continue to operate, between federally and state-registered enterprise agreements, and between
registered and unregistered agreements. We need to make this assumption because our agreement-level data do not
capture state-certified or unregistered agreements, and do not allow us to precisely observe whether an agreement
remains operational or not past its nominal expiry date.
All methods
2000 2006 20120
20
40
60
80
100
%
Award
Individual arrangement
Collective agreement
Collective agreements(a)
2006 2012 20180
20
40
60
80
100
%
Unregistered
State registered
Federally registered
8
Figure 3: Union Involvement in Federally Registered Enterprise Agreements
Share of enterprise agreements
Note: (a) Agreements between their nominal commencement and expiry dates in a given quarter
Sources: Authors’ calculations; Department of Jobs and Small Business Workplace Agreements Database
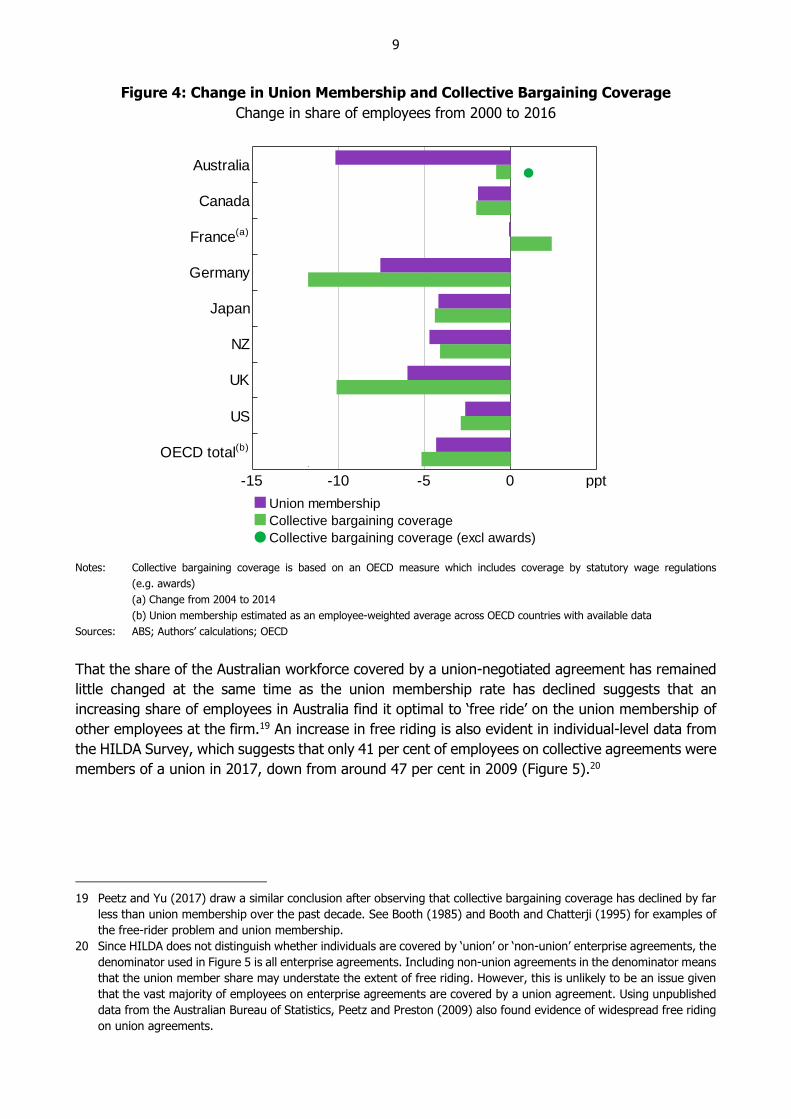
These developments appear relatively unique to Australia. The magnitude of Australia’s decline in
the union membership rate is large relative to other countries in the Organisation for Economic
Co-operation and Development (OECD). Notwithstanding this, Australia has experienced one of the
smallest declines in collective bargaining coverage (along with the unchanged share of employees
covered by union-negotiated collective agreements) among OECD countries (Figure 4). These
developments provide further motivation to consider the Australian case in detail, even though union
membership has also declined in many other countries facing similarly low wages growth.
By number of agreements
200719970
20
40
60
80
100
%
New agreements(flow)
By employees covered
20071997 20170
20
40
60
80
100
%
Current agreements(a)
(stock)
9
Figure 4: Change in Union Membership and Collective Bargaining Coverage
Change in share of employees from 2000 to 2016
Notes: Collective bargaining coverage is based on an OECD measure which includes coverage by statutory wage regulations
(e.g. awards)
(a) Change from 2004 to 2014
(b) Union membership estimated as an employee-weighted average across OECD countries with available data
Sources: ABS; Authors’ calculations; OECD
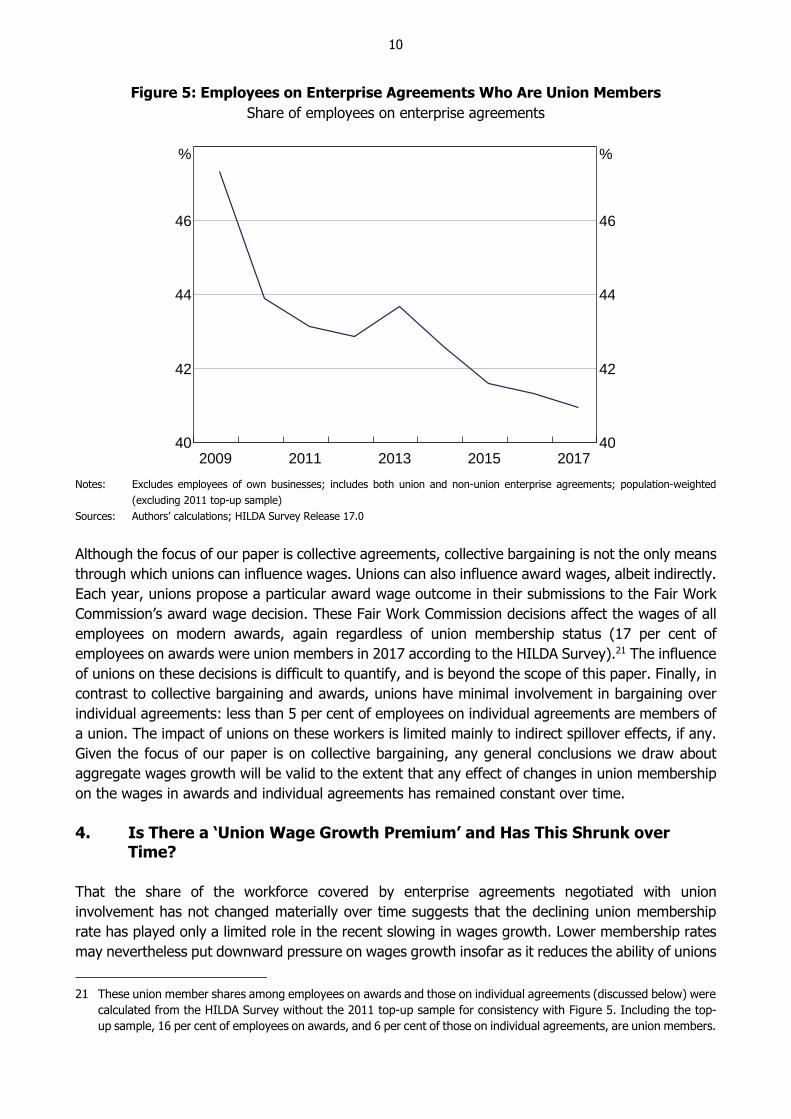
That the share of the Australian workforce covered by a union-negotiated agreement has remained
little changed at the same time as the union membership rate has declined suggests that an
increasing share of employees in Australia find it optimal to ‘free ride’ on the union membership of
other employees at the firm.19 An increase in free riding is also evident in individual-level data from
the HILDA Survey, which suggests that only 41 per cent of employees on collective agreements were
members of a union in 2017, down from around 47 per cent in 2009 (Figure 5).20
19 Peetz and Yu (2017) draw a similar conclusion after observing that collective bargaining coverage has declined by far
less than union membership over the past decade. See Booth (1985) and Booth and Chatterji (1995) for examples of
the free-rider problem and union membership.
20 Since HILDA does not distinguish whether individuals are covered by ‘union’ or ‘non-union’ enterprise agreements, the
denominator used in Figure 5 is all enterprise agreements. Including non-union agreements in the denominator means
that the union member share may understate the extent of free riding. However, this is unlikely to be an issue given
that the vast majority of employees on enterprise agreements are covered by a union agreement. Using unpublished
data from the Australian Bureau of Statistics, Peetz and Preston (2009) also found evidence of widespread free riding
on union agreements.
-15 -10 -5 0 ppt
OECD total(b)
US
UK
NZ
Japan
Germany
France(a)
Canada
Australia
Union membership
Collective bargaining coverage
Collective bargaining coverage (excl awards)
10
Figure 5: Employees on Enterprise Agreements Who Are Union Members
Share of employees on enterprise agreements
Notes: Excludes employees of own businesses; includes both union and non-union enterprise agreements; population-weighted
(excluding 2011 top-up sample)
Sources: Authors’ calculations; HILDA Survey Release 17.0
Although the focus of our paper is collective agreements, collective bargaining is not the only means
through which unions can influence wages. Unions can also influence award wages, albeit indirectly.
Each year, unions propose a particular award wage outcome in their submissions to the Fair Work
Commission’s award wage decision. These Fair Work Commission decisions affect the wages of all
employees on modern awards, again regardless of union membership status (17 per cent of
employees on awards were union members in 2017 according to the HILDA Survey).21 The influence
of unions on these decisions is difficult to quantify, and is beyond the scope of this paper. Finally, in
contrast to collective bargaining and awards, unions have minimal involvement in bargaining over
individual agreements: less than 5 per cent of employees on individual agreements are members of
a union. The impact of unions on these workers is limited mainly to indirect spillover effects, if any.
Given the focus of our paper is on collective bargaining, any general conclusions we draw about
aggregate wages growth will be valid to the extent that any effect of changes in union membership
on the wages in awards and individual agreements has remained constant over time.
4. Is There a ‘Union Wage Growth Premium’ and Has This Shrunk over Time?
That the share of the workforce covered by enterprise agreements negotiated with union
involvement has not changed materially over time suggests that the declining union membership
rate has played only a limited role in the recent slowing in wages growth. Lower membership rates
may nevertheless put downward pressure on wages growth insofar as it reduces the ability of unions
21 These union member shares among employees on awards and those on individual agreements (discussed below) were
calculated from the HILDA Survey without the 2011 top-up sample for consistency with Figure 5. Including the top-
up sample, 16 per cent of employees on awards, and 6 per cent of those on individual agreements, are union members.
2015201320112009 201740
42
44
46
%
40
42
44
46
%

11
to extract more favourable wage outcomes from firms. For example, fewer paying members may
lead to fewer resources allocated to wage negotiations at the firm level. As such, this section of our
paper examines whether the ability of unions to obtain higher wage outcomes changed over recent
years.
We can examine this question empirically by looking at whether a union wage growth premium
exists and, if so, whether this premium has declined over time.22 Private sector enterprise
agreements negotiated with union involvement tend to have higher wage increases than those
negotiated without union involvement, while there is little evidence of a similar differential in the
public sector (Figure 6).23 This unconditional difference in wages growth in the private sector appears
to have been relatively stable over recent years. Of course, this ‘raw’ difference could be due to
inherent differences between union and non-union agreements, rather than a causal effect of union
involvement per se. For instance, workplaces that are more profitable on average may also be more
likely to have unions involved in their wage negotiations; these workplaces may offer workers larger
wage increases even in the absence of union involvement. Our analysis in the following sections
attempts to abstract from these inherent differences and, instead, estimate the causal effect of
unions on wages growth in collective agreements.
Figure 6: Average Annualised Wage Increases in Federally Registered Enterprise Agreements
Current agreements
Notes: Agreements in force at quarter-end; weighted by number of employees
Sources: Authors’ calculations; Department of Jobs and Small Business Workplace Agreements Database
22 In this paper, any premium associated with union representation would be a ‘pure’ union premium within the subset
of employees covered by collective agreements, over and above any (positive or negative) premium associated with
collective bargaining. One limitation of our analysis is that we are unable to make more general conclusions about
whether the existence and magnitude of this union premium has had wider effects on the likelihood of employers and
employees choosing to set pay using enterprise agreements rather than awards or individual arrangements.
23 The wage growth data reported in Figure 6 – average annualised wage increases – are described in detail in
Section 4.1.2.
Private
200819992
3
4
5
%
Non-union
Union
Public
20081999 20172
3
4
5
%
12
4.1 Data
To estimate the union wage growth premium we use data from the Workplace Agreements
Database (WAD), which is manually compiled by the Department of Jobs and Small Business from
administrative data. This rich database includes information on every federally registered enterprise
agreement since the early 1990s (subsequently referred to as ‘enterprise agreements’ or
‘agreements’). There are more than 150,000 agreements in the WAD, with around 8,000 new
agreements added every year. Data are available on the size and timing of wage increases, the
number of employees covered, the industry and state of the firm, and the unions that were involved
in wage negotiations (if any).
Given the nature of the WAD, our unit of analysis is the agreement. We also make the case that this
is the most appropriate level of analysis for studying union wage effects in Australia. In most cases
an agreement will correspond to a single firm, since the vast majority of agreements cover only one
employer. But in some cases a single agreement may cover more than one firm (a ‘multi-enterprise
agreement’), or there may be multiple agreements covering different groups of workers within a
single firm. For the remainder of our paper, we use the terms ‘firm’ and ‘agreement’ interchangeably.
4.1.1 Constructing agreement families
The WAD allows us to follow ‘families’ of agreements over time: that is, sequentially negotiated
agreements that cover the same group of workers or positions, usually at a single firm. This means
that our data have a panel dimension that enables us to control for any time-invariant characteristics
of the firm, such as workplace culture. Our process for constructing agreement families in the WAD
can be described using the stylised example in Figure 7.24
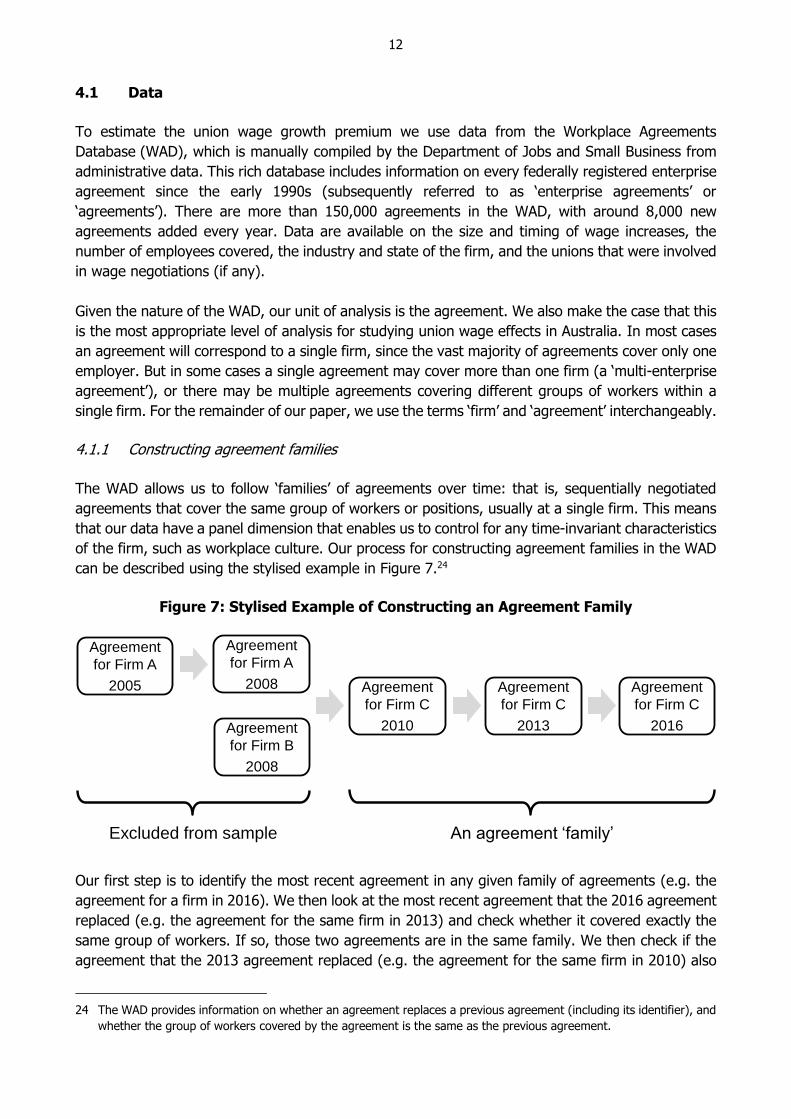
Figure 7: Stylised Example of Constructing an Agreement Family
Our first step is to identify the most recent agreement in any given family of agreements (e.g. the
agreement for a firm in 2016). We then look at the most recent agreement that the 2016 agreement
replaced (e.g. the agreement for the same firm in 2013) and check whether it covered exactly the
same group of workers. If so, those two agreements are in the same family. We then check if the
agreement that the 2013 agreement replaced (e.g. the agreement for the same firm in 2010) also
24 The WAD provides information on whether an agreement replaces a previous agreement (including its identifier), and
whether the group of workers covered by the agreement is the same as the previous agreement.
Agreement
for Firm C
2016
Agreement
for Firm C
2013
Agreement
for Firm C
2010
An agreement ‘family’
Agreement
for Firm A
2008
Agreement
for Firm B
2008
Agreement
for Firm A
2005
Excluded from sample

13
covered exactly the same group of workers. If so, all three of these agreements are in the same
family.
At some point we may find that an agreement covered a different group of workers to its
predecessors. In the stylised example in Figure 7, the 2010 agreement replaces two different
agreements. For example, Firm A might have merged with Firm B in 2010 and a new agreement
was created that covered all employees in the combined Firm C. Because the 2010 agreement
covered a different group of workers to earlier agreements, we do not include the 2008 agreements
– nor any of the agreements they themselves replaced – in our matched sample. Only the 2010,
2013 and 2016 agreements will constitute a ‘family’ and be included in our matched sample.
Our approach means that more recent agreements are systematically more likely to be included in
our matched sample. However, we are still capturing around 85 per cent of all agreements that we
can possibly capture in our matched panel.
4.1.2 Measuring wage outcomes
Our measure of the wage outcome from negotiations is the average annualised wage increase
(AAWI) over the life of the agreement. The AAWI captures any changes in base pay but not
allowances or bonuses paid separately to the base wage. We use the following formula to calculate
the AAWI of an agreement:
1
1
1 1 100N d
t t
t
AAWI w
where wt is the percentage wage increase at time t, N is the number of increases over the life of the
agreement, and d is the effective duration of the agreement in years.25 Effective duration is defined
as:
latest end date earliest start date
max , min , ,effective duration expidate lastincr certdate commdate firsincr
where expidate is an agreement’s nominal expiry date, lastincr is the date of the final wage increase
in the agreement, certdate is the agreement’s certification date, commdate is its formal
commencement date, and firsincr is the date of the first wage increase in the agreement. This
calculation of the effective duration recognises that certification dates often do not align with the
first wage rise (certification sometimes happen after the first wage rise), and that contracts often
overlap each other so that the first pay rise of a later contract is granted before the last pay rise of
the earlier agreement.26
25 This method of averaging implicitly assumes that the increases are evenly spaced across the agreement’s effective
duration.
26 In the vast majority of cases, an agreement’s nominal expiry date comes after the date of its final wage increase.
14
The AAWI calculation is similar to that used in Department of Jobs and Small Business (2018), with
a small modification to ensure that the measure is appropriate for modelling. Unlike in the measure
used by the Department, we do not use the actual termination date for an agreement as its end
date if the agreement is terminated before its nominal expiry date. This is because our research
question naturally focuses on the negotiation phase for each agreement: we want to include only
information that was available to bargaining participants at the time an agreement was signed and
not what happened subsequently. In Section 4.4.2, we consider whether our results are robust to
using some alternative measures of wages growth that are adjusted for renegotiation delays.
The WAD does not include information on the wage level in each agreement. As such, we cannot
directly estimate the union wage level premium commonly seen in the literature. We discuss the
implications of this in Section 4.6.
4.1.3 Sample for estimation
Our baseline models are estimated using a sample of around 46,000 agreements, which is only a
subset of the 150,000 or so agreements in the WAD. There are two reasons for this. First, some of
the agreements in the dataset do not have a measure of AAWI that was quantifiable at the date the
agreement was made. For example, we cannot construct an AAWI in cases where wages are indexed
or linked to the consumer price index, to Fair Work Commission award decisions, or to the firm’s
performance.27
Second, in many cases we cannot match an agreement to another in the same agreement family.28
We exclude these agreements as our baseline estimates of the union wage growth premium are
necessarily based only on cases where the same group of workers switch from negotiating with
union involvement to negotiating without unions (and vice versa). In Section 4.4.5, we examine if
this creates a selection bias by comparing our baseline estimates (with fixed effects) to a simpler
model (without fixed effects) estimated using the full sample of all agreements with a quantifiable
AAWI.
Descriptive statistics on the estimation sample can be found in Tables B1 and B2.
4.2 Empirical Approach
We use the following model to estimate the effects of union involvement in enterprise bargaining on
wages growth:
27 Another common reason why an agreement’s AAWI is not quantifiable is that it covers several groups of workers and
each group receives a different percentage wage rise. More information about non-quantifiable wage increases in the
WAD can be found in Department of Employment (2016).
28 There are several reasons why an agreement may not be matched. First, many agreements are never replaced (or
are yet to be replaced). For example, a new business may start up, sign an agreement, and then cease operating prior
to the agreement’s expiration date. This is common in the construction industry. Second, there are also cases where
the Department of Jobs and Small Business did not routinely check whether a new agreement replaced an existing
agreement in its database. For example, prior to 2011 the Department did not check ‘template or pattern’ agreements
to see if they replaced another agreement, which represented around 30 per cent of all agreements at the time.
Finally, an agreement may not be matched due to our specific procedure for constructing the matched sample.
15
ijst ijst ijst i jst ijstAAWI Union X (1)
where the dependent variable is the AAWI for firm i in industry j and state s in the quarter the
agreement started, t.29 The variable of interest (Unionijst) is a dummy variable that equals one if a
union was involved in bargaining, and zero otherwise. Xijst is a vector of controls that vary by firm,
industry, state and time.30 The fixed effects (i) control for any permanent differences in wages
growth across firms. The model also controls for the effects of the economic cycle and industry- and
location-specific shocks by including the three-way interaction between industry, state and time
period (jst). This absorbs the effects of any macro shocks that affect all firms in any given quarter,
along with any time-varying shocks to specific industries or states (or industry–state combinations).
The coefficient of interest () measures the union wage growth premium (if positive) or penalty
(if negative). The inclusion of fixed effects in Equation (1) means that the union premium will only
be identified by variation within firms over time. We will only be able to uncover a positive union
wage growth premium if, on average, the size of wage increases shrink when an agreement
negotiated with union involvement is replaced by one negotiated without union involvement, or vice
versa. Our baseline estimates are not weighted by the number of employees covered by each
agreement. We discuss some alternative weighting strategies in Section 4.4.1. Since unions in
Australia are typically organised along industry lines and engage with multiple firms, we adjust the
standard errors for two-way clustering at the firm and two-digit industry levels.
4.2.1 Potential omitted variable bias
For this approach to yield a causal estimate of the union premium, it is crucial that union involvement
is ‘as good as randomly assigned’ given our controls. One concern is that, despite our extensive
controls, union involvement could still be endogenous. An agreement negotiated without union
involvement could be replaced by one negotiated with union involvement (and vice versa) for
unobserved reasons that are also correlated with wages growth. The sign of any bias is unclear
ex ante. For example, our estimates will be upwardly biased if employees are more likely to start
involving a union in negotiations if they believe that they would receive a favourable outcome from
doing so. On the other hand, our estimates will be downwardly biased if employees ask a union to
step in to help offset the effect of a sudden reduction in their bargaining power in negotiations.
We address this concern by using a different identification strategy – one that relies on an exogenous
change in union involvement introduced by a change in legislation – to estimate the premium. As
will be discussed in Section 4.7, we find that the estimated premium using the alternative strategy
is larger than the analogous estimate based on Equation (1), but has not changed materially over
time.
4.2.2 Transition probabilities
It is also important to consider whether the within-firm variation is limited to only a few firms or
confined to a specific period. Among agreement families in our estimation sample that negotiated a
29 Industry is at the one-digit level under the 1993 or 2006 Australian and New Zealand Standard Industrial Classification
(ANZSIC).
30 Xijst includes the log of the number of employees covered by the agreement and a dummy for multi-enterprise
agreements.
16
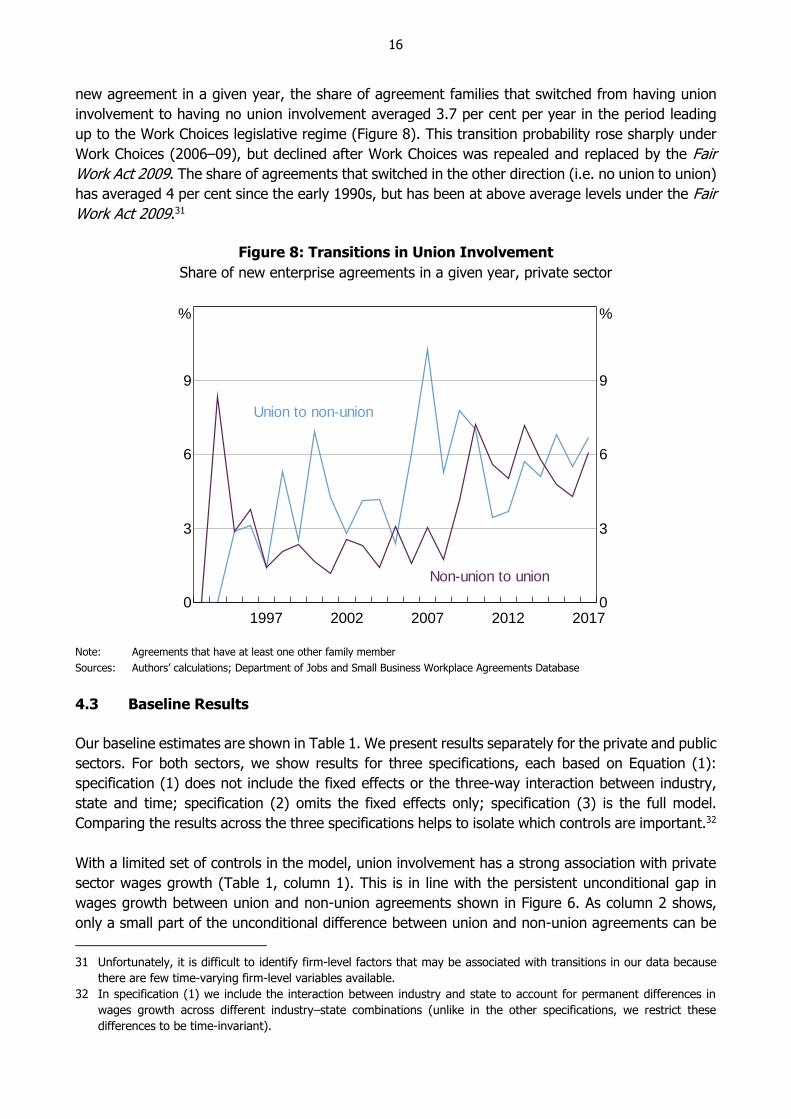
new agreement in a given year, the share of agreement families that switched from having union
involvement to having no union involvement averaged 3.7 per cent per year in the period leading
up to the Work Choices legislative regime (Figure 8). This transition probability rose sharply under
Work Choices (2006–09), but declined after Work Choices was repealed and replaced by the Fair
Work Act 2009. The share of agreements that switched in the other direction (i.e. no union to union)
has averaged 4 per cent since the early 1990s, but has been at above average levels under the Fair
Work Act 2009.31
Figure 8: Transitions in Union Involvement
Share of new enterprise agreements in a given year, private sector
Note: Agreements that have at least one other family member
Sources: Authors’ calculations; Department of Jobs and Small Business Workplace Agreements Database
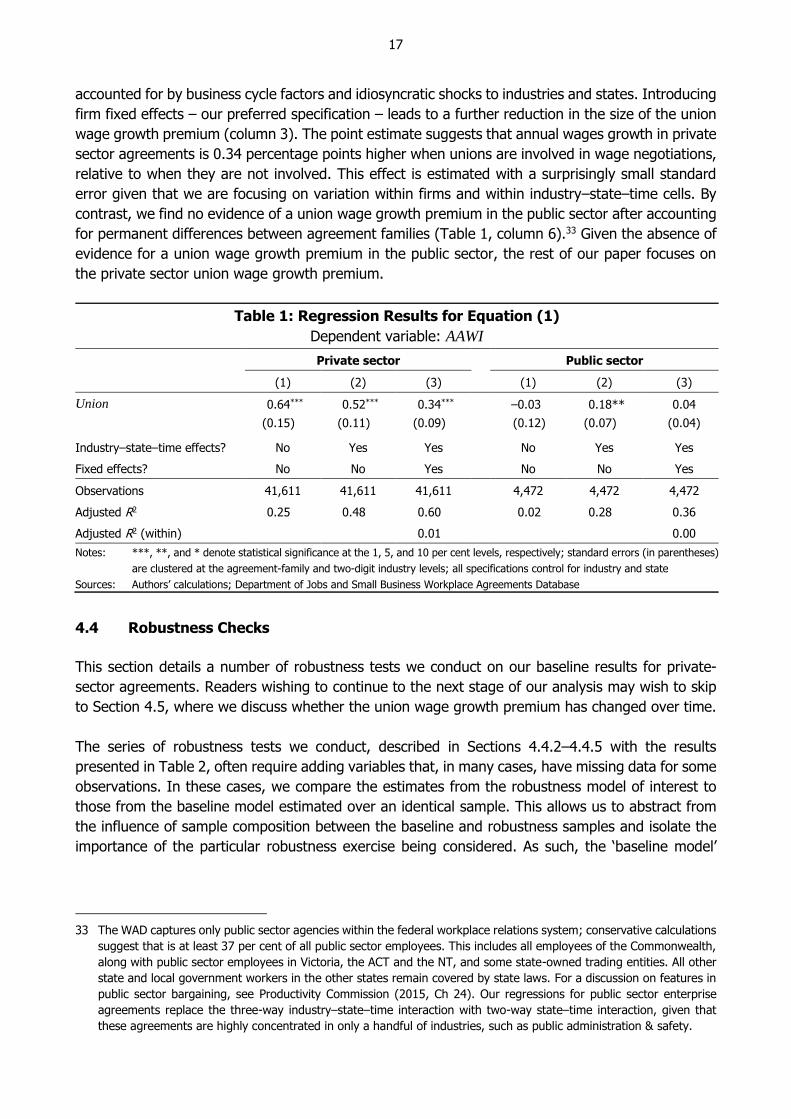
4.3 Baseline Results
Our baseline estimates are shown in Table 1. We present results separately for the private and public
sectors. For both sectors, we show results for three specifications, each based on Equation (1):
specification (1) does not include the fixed effects or the three-way interaction between industry,
state and time; specification (2) omits the fixed effects only; specification (3) is the full model.
Comparing the results across the three specifications helps to isolate which controls are important.32
With a limited set of controls in the model, union involvement has a strong association with private
sector wages growth (Table 1, column 1). This is in line with the persistent unconditional gap in
wages growth between union and non-union agreements shown in Figure 6. As column 2 shows,
only a small part of the unconditional difference between union and non-union agreements can be
31 Unfortunately, it is difficult to identify firm-level factors that may be associated with transitions in our data because
there are few time-varying firm-level variables available.
32 In specification (1) we include the interaction between industry and state to account for permanent differences in
wages growth across different industry–state combinations (unlike in the other specifications, we restrict these
differences to be time-invariant).
2012200720021997 20170
3
6
9
%
0
3
6
9
%
Non-union to union
Union to non-union
17
accounted for by business cycle factors and idiosyncratic shocks to industries and states. Introducing
firm fixed effects – our preferred specification – leads to a further reduction in the size of the union
wage growth premium (column 3). The point estimate suggests that annual wages growth in private
sector agreements is 0.34 percentage points higher when unions are involved in wage negotiations,
relative to when they are not involved. This effect is estimated with a surprisingly small standard
error given that we are focusing on variation within firms and within industry–state–time cells. By
contrast, we find no evidence of a union wage growth premium in the public sector after accounting
for permanent differences between agreement families (Table 1, column 6).33 Given the absence of
evidence for a union wage growth premium in the public sector, the rest of our paper focuses on
the private sector union wage growth premium.
Table 1: Regression Results for Equation (1)
Dependent variable: AAWI
Private sector Public sector
(1) (2) (3) (1) (2) (3)
Union 0.64***
(0.15)
0.52***
(0.11)
0.34***
(0.09)
–0.03
(0.12)
0.18**
(0.07)
0.04
(0.04)
Industry–state–time effects? No Yes Yes No Yes Yes
Fixed effects? No No Yes No No Yes
Observations 41,611 41,611 41,611 4,472 4,472 4,472
Adjusted R2 0.25 0.48 0.60 0.02 0.28 0.36
Adjusted R2 (within) 0.01 0.00
Notes: ***, **, and * denote statistical significance at the 1, 5, and 10 per cent levels, respectively; standard errors (in parentheses)
are clustered at the agreement-family and two-digit industry levels; all specifications control for industry and state
Sources: Authors’ calculations; Department of Jobs and Small Business Workplace Agreements Database
4.4 Robustness Checks
This section details a number of robustness tests we conduct on our baseline results for private-
sector agreements. Readers wishing to continue to the next stage of our analysis may wish to skip
to Section 4.5, where we discuss whether the union wage growth premium has changed over time.
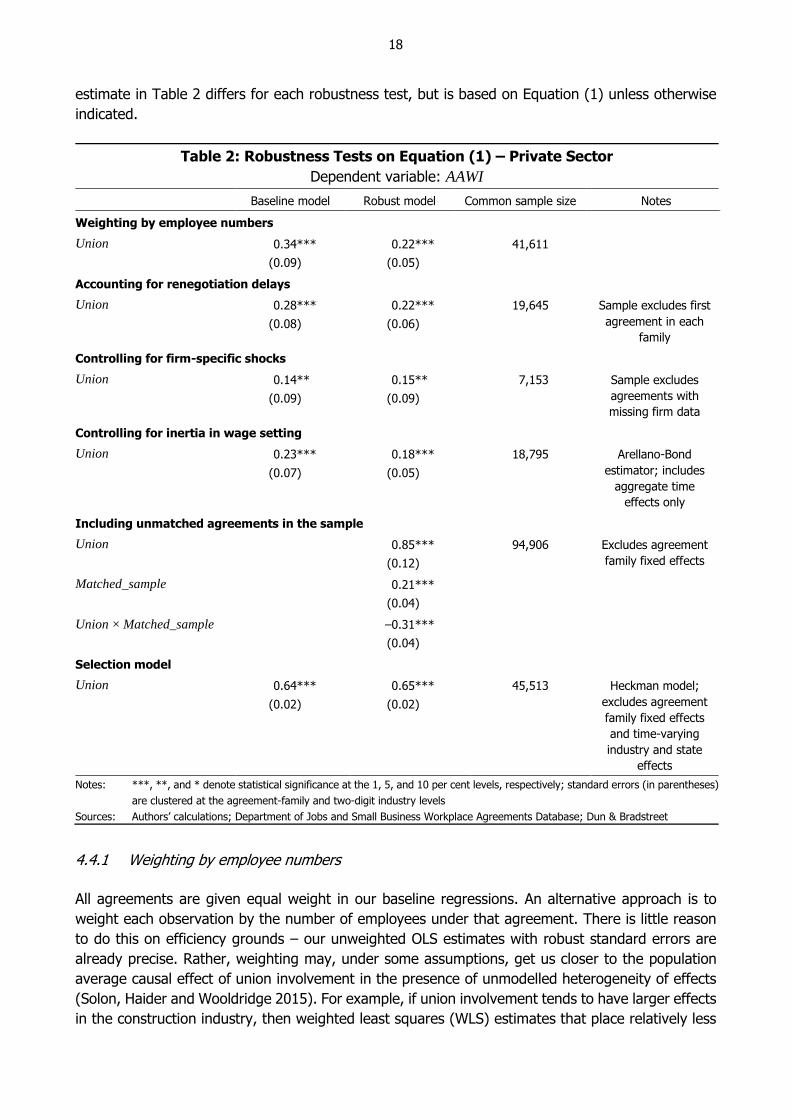
The series of robustness tests we conduct, described in Sections 4.4.2–4.4.5 with the results
presented in Table 2, often require adding variables that, in many cases, have missing data for some
observations. In these cases, we compare the estimates from the robustness model of interest to
those from the baseline model estimated over an identical sample. This allows us to abstract from
the influence of sample composition between the baseline and robustness samples and isolate the
importance of the particular robustness exercise being considered. As such, the ‘baseline model’
33 The WAD captures only public sector agencies within the federal workplace relations system; conservative calculations
suggest that is at least 37 per cent of all public sector employees. This includes all employees of the Commonwealth,
along with public sector employees in Victoria, the ACT and the NT, and some state-owned trading entities. All other
state and local government workers in the other states remain covered by state laws. For a discussion on features in
public sector bargaining, see Productivity Commission (2015, Ch 24). Our regressions for public sector enterprise
agreements replace the three-way industry–state–time interaction with two-way state–time interaction, given that
these agreements are highly concentrated in only a handful of industries, such as public administration & safety.
18
estimate in Table 2 differs for each robustness test, but is based on Equation (1) unless otherwise
indicated.
Table 2: Robustness Tests on Equation (1) – Private Sector
Dependent variable: AAWI
Baseline model Robust model Common sample size Notes
Weighting by employee numbers
Union 0.34***
(0.09)
0.22***
(0.05)
41,611
Accounting for renegotiation delays
Union 0.28***
(0.08)
0.22***
(0.06)
19,645 Sample excludes first
agreement in each
family
Controlling for firm-specific shocks
Union 0.14**
(0.09)
0.15**
(0.09)
7,153 Sample excludes
agreements with
missing firm data
Controlling for inertia in wage setting
Union 0.23***
(0.07)
0.18***
(0.05)
18,795 Arellano-Bond
estimator; includes
aggregate time
effects only
Including unmatched agreements in the sample
Union 0.85***
(0.12)
94,906 Excludes agreement
family fixed effects
Matched_sample 0.21***
(0.04)
Union × Matched_sample –0.31***
(0.04)
Selection model
Union 0.64***
(0.02)
0.65***
(0.02)
45,513 Heckman model;
excludes agreement
family fixed effects
and time-varying
industry and state
effects
Notes: ***, **, and * denote statistical significance at the 1, 5, and 10 per cent levels, respectively; standard errors (in parentheses)
are clustered at the agreement-family and two-digit industry levels
Sources: Authors’ calculations; Department of Jobs and Small Business Workplace Agreements Database; Dun & Bradstreet
4.4.1 Weighting by employee numbers
All agreements are given equal weight in our baseline regressions. An alternative approach is to
weight each observation by the number of employees under that agreement. There is little reason
to do this on efficiency grounds – our unweighted OLS estimates with robust standard errors are
already precise. Rather, weighting may, under some assumptions, get us closer to the population
average causal effect of union involvement in the presence of unmodelled heterogeneity of effects
(Solon, Haider and Wooldridge 2015). For example, if union involvement tends to have larger effects
in the construction industry, then weighted least squares (WLS) estimates that place relatively less

19
weight on smaller agreements – which are more common in construction – will yield a smaller overall
premium than OLS. In that case, it may seem that weighting should yield the weighted-average
effect of union involvement across the population of employees on enterprise agreements (which is
the quantity that we are ultimately interested in for our research question). However, as Solon
et al (2015) argue, this is only the case if certain strong assumptions are satisfied; otherwise WLS
and OLS are both inconsistent in the presence of unmodelled heterogeneous effects, and neither
identifies the population average effect of union involvement.
We find that WLS estimates of the union wage growth premium are smaller than our baseline OLS
estimates (0.22 versus 0.34; Table 2). That the differences between OLS and WLS estimates are not
large gives us confidence that our baseline results are not being unduly influenced by
misspecification bias due to a failure to model heterogeneous treatment effects (Solon et al 2015).
We leave the study of heterogeneous effects (e.g. by industry, firm size or union) for future research.
4.4.2 Accounting for renegotiation delays
Our baseline results are based on a measure of wages growth that is similar to the Department of
Jobs and Small Business calculation of AAWI. As defined in Section 4.1.2, this measure assumes that
the duration of an agreement is the length of time from the start date of the contract to the end
date of the contract (the ‘contractual duration’). Any length of time between the end of the firm’s
previous contract and the start of the current contract (the ‘renegotiation delay’) is ignored. All else
being equal, a longer renegotiation delay will reduce wages growth for a group of workers, as wages
are often frozen during the negotiation period. Failing to account for these delays could therefore
put a bias into our estimates if the length of these delays is related to union involvement in
bargaining.
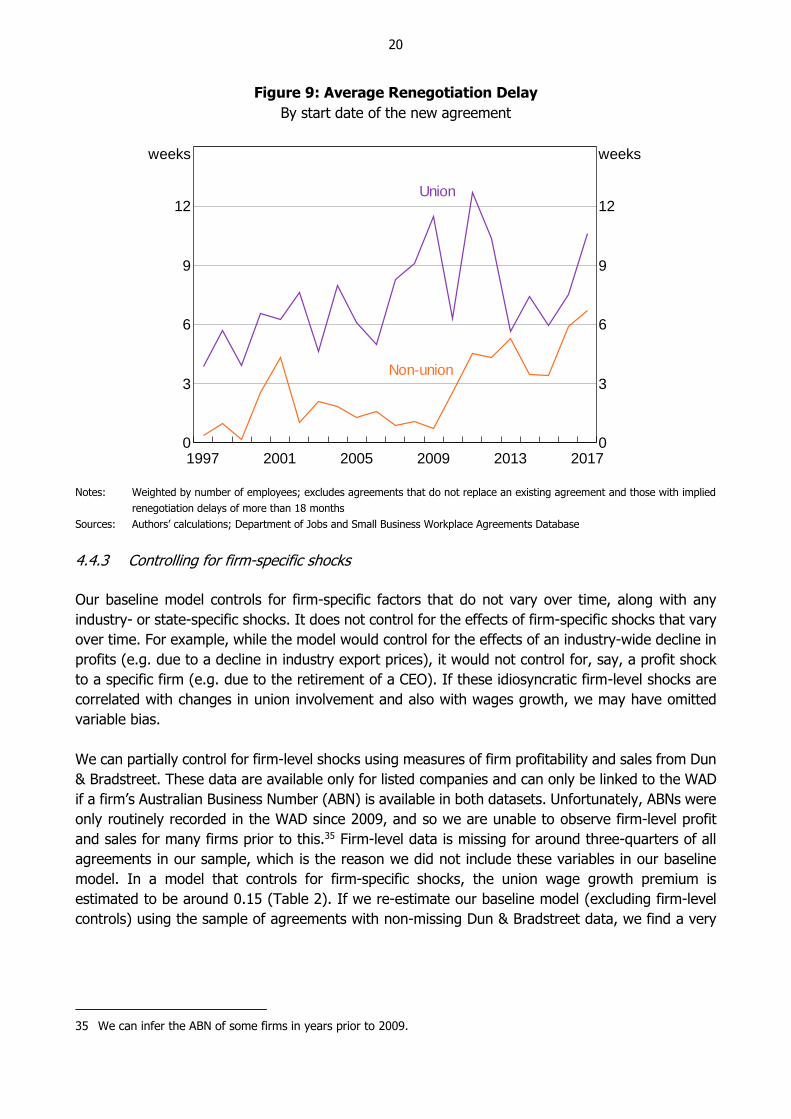
On average, agreements negotiated with union involvement take longer to renegotiate than
non-union agreements (Figure 9). After controlling for other factors (using a regression), we find
that union involvement in bargaining adds around four weeks to renegotiation delays, compared to
when unions are not involved.34 Since union involvement leads to more protracted wage negotiations
on average, our baseline estimates of the union wage growth premium (which do not adjust for
these lags) are likely to be biased upwards. However, the size of the bias does not appear to be
large: adjusting our measure of AAWI for renegotiation delays yields only a slightly smaller estimate
of the union wage growth premium than in the baseline model (0.22 versus 0.28; Table 2).
34 We replaced the dependent variable in our baseline model with a direct measure of the renegotiation delay (in weeks).
20
Figure 9: Average Renegotiation Delay
By start date of the new agreement
Notes: Weighted by number of employees; excludes agreements that do not replace an existing agreement and those with implied
renegotiation delays of more than 18 months
Sources: Authors’ calculations; Department of Jobs and Small Business Workplace Agreements Database
4.4.3 Controlling for firm-specific shocks
Our baseline model controls for firm-specific factors that do not vary over time, along with any
industry- or state-specific shocks. It does not control for the effects of firm-specific shocks that vary
over time. For example, while the model would control for the effects of an industry-wide decline in
profits (e.g. due to a decline in industry export prices), it would not control for, say, a profit shock
to a specific firm (e.g. due to the retirement of a CEO). If these idiosyncratic firm-level shocks are
correlated with changes in union involvement and also with wages growth, we may have omitted
variable bias.
We can partially control for firm-level shocks using measures of firm profitability and sales from Dun
& Bradstreet. These data are available only for listed companies and can only be linked to the WAD
if a firm’s Australian Business Number (ABN) is available in both datasets. Unfortunately, ABNs were
only routinely recorded in the WAD since 2009, and so we are unable to observe firm-level profit
and sales for many firms prior to this.35 Firm-level data is missing for around three-quarters of all
agreements in our sample, which is the reason we did not include these variables in our baseline
model. In a model that controls for firm-specific shocks, the union wage growth premium is
estimated to be around 0.15 (Table 2). If we re-estimate our baseline model (excluding firm-level
controls) using the sample of agreements with non-missing Dun & Bradstreet data, we find a very
35 We can infer the ABN of some firms in years prior to 2009.
20132009200520011997 20170
3
6
9
12
weeks
0
3
6
9
12
weeks
Union
Non-union
21
similar estimate as in the regression with firm-level controls (Table 2). This provides some
reassurance that our baseline results are not being driven by idiosyncratic shocks to firms.36
4.4.4 Controlling for inertia in wage setting
Our baseline model does not control for the wage outcome in the previous agreement from the same
agreement family. Including this variable leads to a large reduction in our sample size: we lose
observations both due to the lag itself and because deeper lags of wages growth are needed as
instruments. However, excluding this variable may result in biased estimates of the union premium
if the firm’s previous wage outcome is correlated with workers’ decision to negotiate with union
involvement. And since wages growth is serially correlated due to inertia in wage setting, omitting
lagged AAWI could put a bias into our estimate of the union premium.
To examine the importance of this bias, we re-estimate our baseline model including lagged wages
growth as an additional control. We used an Arellano and Bond (1991) estimator to obtain a
consistent estimator of the coefficient to lagged AAWI. In this specification the union wage growth
premium is only slightly smaller than in the baseline model when estimated over the same sample
(0.18 versus 0.23; Table 2).
4.4.5 Sample selection bias
Another potential concern around robustness is that the matched sample of agreements (i.e. those
with at least one family member) used in our analysis may not be representative of the broader
population of agreements in the WAD. For example, some firms do not have sufficient resources to
regularly renegotiate agreements, and as a result are less likely to be included in our matched
sample. If such firms also respond differently to union involvement in wage negotiations compared
with firms that are matched, then our estimates of the union wage growth premium could be biased.
We can examine this issue by estimating a pooled model using the full sample of all agreements –
both matched and unmatched – but excluding the agreement-family fixed effects. The estimation
sample in this model is more than twice the size of that in the baseline model. We also include a
dummy variable that equals one if an agreement is in the matched sample and zero otherwise, and
an interaction between this dummy and the dummy for union involvement.
The coefficient of interest is the coefficient on the interaction term, which tells us whether the union
premium is different across matched and unmatched samples, conditional on the variables included
in the baseline model. We find that this interaction is statistically significant (Table 2). Its sign
suggests that the union premium in the unmatched sample is larger than the matched sample. This
suggests that our baseline estimates of the union premium may be downwardly biased. However,
we show in Section 4.5.1 that these differences between the matched and unmatched samples do
not affect our conclusions regarding the role of unions in the decline in aggregate wages growth.
Another sample selection issue is that our baseline model is restricted to agreements whose wage
outcomes can be expressed in terms of a ‘quantifiable’ AAWI. This could lead to a selection bias if
agreements with a quantifiable AAWI are not a random sample of enterprise agreements
(Heckman 1979). For example, workers with less bargaining power may be relatively more willing
36 That the estimated premium is smaller than our baseline estimate in Table 1 (specification (3)) mainly reflects that
firms with non-missing Dun & Bradstreet data are not a random sample of enterprise agreements.
22
to agree to wage outcomes that are linked to the consumer price index or to the Fair Work
Commission’s award decisions (and hence the AAWI cannot be calculated ex ante; see Section 4.1.3
for further details). Union involvement in negotiations may have a different effect for such workers.
We can test for this type of bias using Heckman’s two-step procedure to correct for selection bias.
In the first stage we model the probability of having a quantifiable AAWI using a probit model. This
step requires an ‘excluded instrument’ – that is, a variable that influences whether an agreement
has a quantifiable AAWI but does not have a direct effect on the AAWI itself. We use the share of
non-expired agreements in the firm’s industry that had quantifiable AAWIs in the previous quarter
(weighted by firm size) as the instrument. The idea is that a firm’s wage-setting practices will be
influenced by wage-setting trends in the firm’s industry. In the second stage we correct for
self-selection by incorporating a transformation of the predicted probabilities from the first stage as
an additional explanatory variable in Equation (1).37 We find no evidence of a selectivity effect
(Table 2). This justifies our focus on the sample of agreements with non-missing AAWI in our
baseline model.
4.5 Has the Union Wage Growth Premium Changed over Time?
In this section, we use our baseline model to examine whether the influence of unions on wages
growth has changed over time. Factors such as the decline in membership rates and changes in the
workplace relations system, for instance, may have affected union influence. Any decline in unions’
ability to negotiate favourable wage outcomes should manifest itself in a smaller union premium
over time.
We can examine the stability of the premium by interacting the Union indicator variable in
Equation (1) with dummies for the four major legislative regimes governing the agreements in our
sample. These regimes are: the Industrial Relations Act 1988 (1991 to 1996); the Workplace
Relations Act 1996 (1996 to 2006); the Work Choices period (2006 to 2009); and the Fair Work
Act 2009 (2009 onwards).38
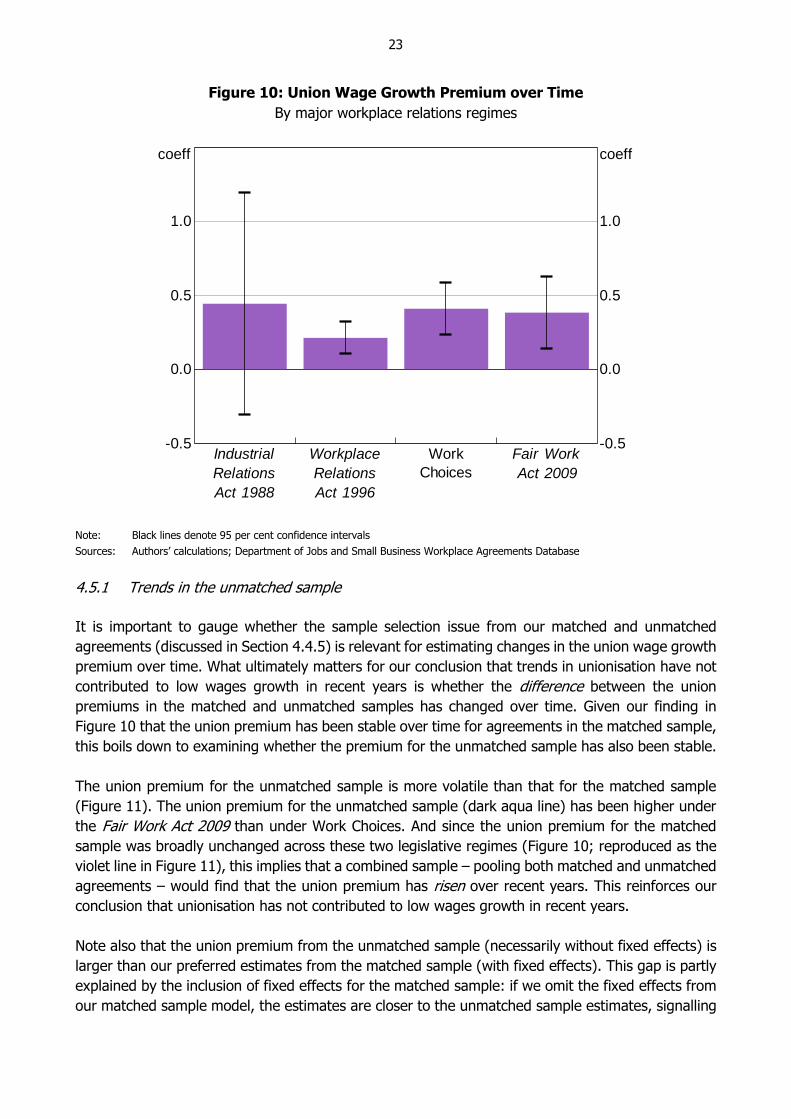
The results in Figure 10 suggest there has been little change in the union wage growth premium
over time. Indeed, the premium has increased since the Workplace Relations Act 1996 despite the
declining union membership rate. We find no evidence of a more recent shift in the union premium:
a test for the equality of the coefficients to the interacted indicator variables for Work Choices and
the Fair Work Act 2009 cannot be rejected (p-value = 0.704). Indeed, the estimated premium under
both of these periods is similar in size to the full-sample estimate.39 This finding is consistent with
studies in the United States and United Kingdom, which also find no evidence of a secular decline in
the union wage premium over time (Farber et al 2018; Bryson 2007).
37 To isolate this type of bias, we estimate this equation using the matched sample only. We cannot control for
agreement-family fixed effects in this specification.
38 See Chapter 2 of Stewart (2015) for a brief overview of these legislative regimes.
39 We show in Appendix A that this conclusion is not affected by changes to the definition of union coverage in the Fair
Work Act 2009.
23
Figure 10: Union Wage Growth Premium over Time
By major workplace relations regimes
Note: Black lines denote 95 per cent confidence intervals
Sources: Authors’ calculations; Department of Jobs and Small Business Workplace Agreements Database
4.5.1 Trends in the unmatched sample
It is important to gauge whether the sample selection issue from our matched and unmatched
agreements (discussed in Section 4.4.5) is relevant for estimating changes in the union wage growth
premium over time. What ultimately matters for our conclusion that trends in unionisation have not
contributed to low wages growth in recent years is whether the difference between the union
premiums in the matched and unmatched samples has changed over time. Given our finding in
Figure 10 that the union premium has been stable over time for agreements in the matched sample,
this boils down to examining whether the premium for the unmatched sample has also been stable.
The union premium for the unmatched sample is more volatile than that for the matched sample
(Figure 11). The union premium for the unmatched sample (dark aqua line) has been higher under
the Fair Work Act 2009 than under Work Choices. And since the union premium for the matched
sample was broadly unchanged across these two legislative regimes (Figure 10; reproduced as the
violet line in Figure 11), this implies that a combined sample – pooling both matched and unmatched
agreements – would find that the union premium has risen over recent years. This reinforces our
conclusion that unionisation has not contributed to low wages growth in recent years.
Note also that the union premium from the unmatched sample (necessarily without fixed effects) is
larger than our preferred estimates from the matched sample (with fixed effects). This gap is partly
explained by the inclusion of fixed effects for the matched sample: if we omit the fixed effects from
our matched sample model, the estimates are closer to the unmatched sample estimates, signalling
Industrial
Relations
Act 1988
Workplace
Relations
Act 1996
Work
Choices
Fair Work
Act 2009
-0.5
0.0
0.5
1.0
coeff
-0.5
0.0
0.5
1.0
coeff

24
the presence of unobserved heterogeneity that is positively correlated with wages growth and union
involvement (yellow line in Figure 11). However, as discussed in Section 4.4.5 some of the gap is
also unexplained.
Figure 11: Union Wage Growth Premium over Time
Matched versus unmatched sample
Sources: Authors’ calculations; Department of Jobs and Small Business Workplace Agreements Database
4.6 Dynamics of the Union Wage Growth Premium
We have so far discussed the wage growth premium from union involvement in bargaining. However,
our baseline results do not reveal how this union wage growth premium evolves over the duration
of a union’s involvement with a particular agreement family, and what this means for wage levels.
Although our estimates of the union wage growth premium are only identified if an agreement
transitions in union status, all wage observations for a given agreement family before and after the
transition contribute to the estimation.40 This means our baseline estimate could be consistent with
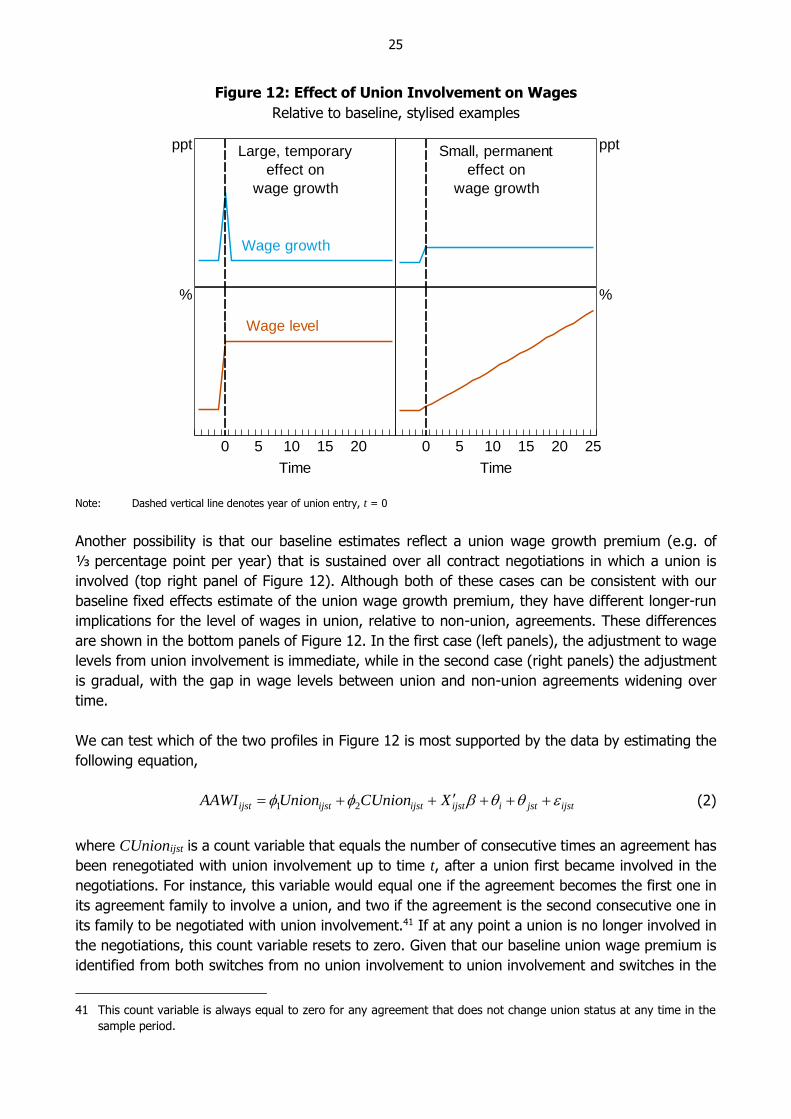
several possible dynamic paths for wages growth following a change in union status. One possibility
is that the union wage growth premium reflects a large one-off spike in wages growth immediately
after an agreement changes from no union involvement to union involvement or vice versa, with no
further effect on wages growth (relative to the counterfactual of no union involvement) in
subsequent negotiations. A stylised example of this case is depicted in the top left panel of Figure 12.
40 This is true in cases where union status changes once within an agreement family. In cases where union status
changes more than once, the difference in wage growth outcomes between all observations with and all observations
without union involvement in an agreement family contribute to the estimate.
Industrial
Relations
Act 1988
Workplace
Relations
Act 1996
Work
Choices
Fair Work
Act 2009
0.0
0.3
0.6
0.9
ppt
0.0
0.3
0.6
0.9
ppt
Unmatched – no fixed effects
Matched – no fixed effects
Matched – with fixed effects
25
Figure 12: Effect of Union Involvement on Wages
Relative to baseline, stylised examples
Note: Dashed vertical line denotes year of union entry, t = 0
Another possibility is that our baseline estimates reflect a union wage growth premium (e.g. of
⅓ percentage point per year) that is sustained over all contract negotiations in which a union is
involved (top right panel of Figure 12). Although both of these cases can be consistent with our
baseline fixed effects estimate of the union wage growth premium, they have different longer-run
implications for the level of wages in union, relative to non-union, agreements. These differences
are shown in the bottom panels of Figure 12. In the first case (left panels), the adjustment to wage
levels from union involvement is immediate, while in the second case (right panels) the adjustment
is gradual, with the gap in wage levels between union and non-union agreements widening over
time.
We can test which of the two profiles in Figure 12 is most supported by the data by estimating the
following equation,
1 2ijst ijst ijst ijst i jst ijstAAWI Union CUnion X (2)
where CUnionijst is a count variable that equals the number of consecutive times an agreement has
been renegotiated with union involvement up to time t, after a union first became involved in the
negotiations. For instance, this variable would equal one if the agreement becomes the first one in
its agreement family to involve a union, and two if the agreement is the second consecutive one in
its family to be negotiated with union involvement.41 If at any point a union is no longer involved in
the negotiations, this count variable resets to zero. Given that our baseline union wage premium is
identified from both switches from no union involvement to union involvement and switches in the
41 This count variable is always equal to zero for any agreement that does not change union status at any time in the
sample period.
Large, temporary
effect on
wage growth
ppt
Wage growth
Small, permanent
effect on
wage growth
ppt
0 5 10 15 20
%
Time
Wage level
0 5 10 15 20 25
%
Time
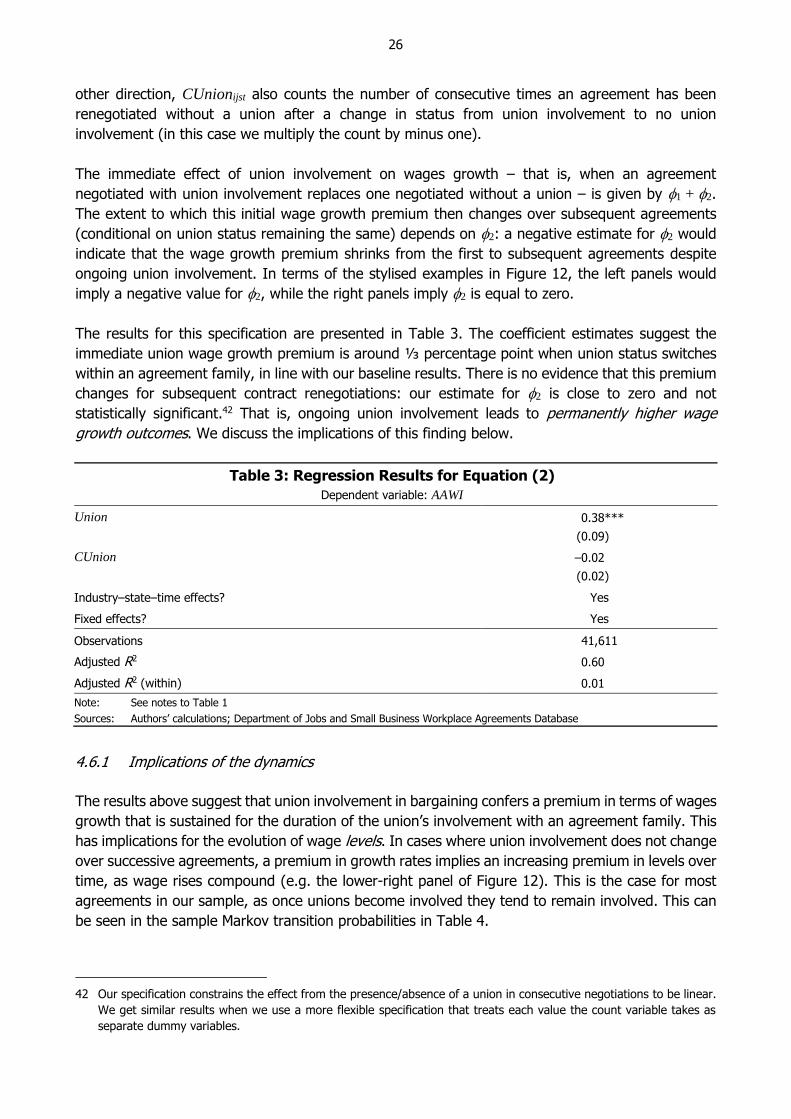
26
other direction, CUnionijst also counts the number of consecutive times an agreement has been
renegotiated without a union after a change in status from union involvement to no union
involvement (in this case we multiply the count by minus one).
The immediate effect of union involvement on wages growth – that is, when an agreement
negotiated with union involvement replaces one negotiated without a union – is given by 1 + 2.
The extent to which this initial wage growth premium then changes over subsequent agreements
(conditional on union status remaining the same) depends on 2: a negative estimate for 2 would
indicate that the wage growth premium shrinks from the first to subsequent agreements despite
ongoing union involvement. In terms of the stylised examples in Figure 12, the left panels would
imply a negative value for 2, while the right panels imply 2 is equal to zero.
The results for this specification are presented in Table 3. The coefficient estimates suggest the
immediate union wage growth premium is around ⅓ percentage point when union status switches
within an agreement family, in line with our baseline results. There is no evidence that this premium
changes for subsequent contract renegotiations: our estimate for 2 is close to zero and not
statistically significant.42 That is, ongoing union involvement leads to permanently higher wage
growth outcomes. We discuss the implications of this finding below.
Table 3: Regression Results for Equation (2)
Dependent variable: AAWI
Union 0.38***
(0.09)
CUnion –0.02
(0.02)
Industry–state–time effects? Yes
Fixed effects? Yes
Observations 41,611
Adjusted R2 0.60
Adjusted R2 (within) 0.01
Note: See notes to Table 1
Sources: Authors’ calculations; Department of Jobs and Small Business Workplace Agreements Database
4.6.1 Implications of the dynamics
The results above suggest that union involvement in bargaining confers a premium in terms of wages
growth that is sustained for the duration of the union’s involvement with an agreement family. This
has implications for the evolution of wage levels. In cases where union involvement does not change
over successive agreements, a premium in growth rates implies an increasing premium in levels over
time, as wage rises compound (e.g. the lower-right panel of Figure 12). This is the case for most
agreements in our sample, as once unions become involved they tend to remain involved. This can
be seen in the sample Markov transition probabilities in Table 4.
42 Our specification constrains the effect from the presence/absence of a union in consecutive negotiations to be linear.
We get similar results when we use a more flexible specification that treats each value the count variable takes as
separate dummy variables.
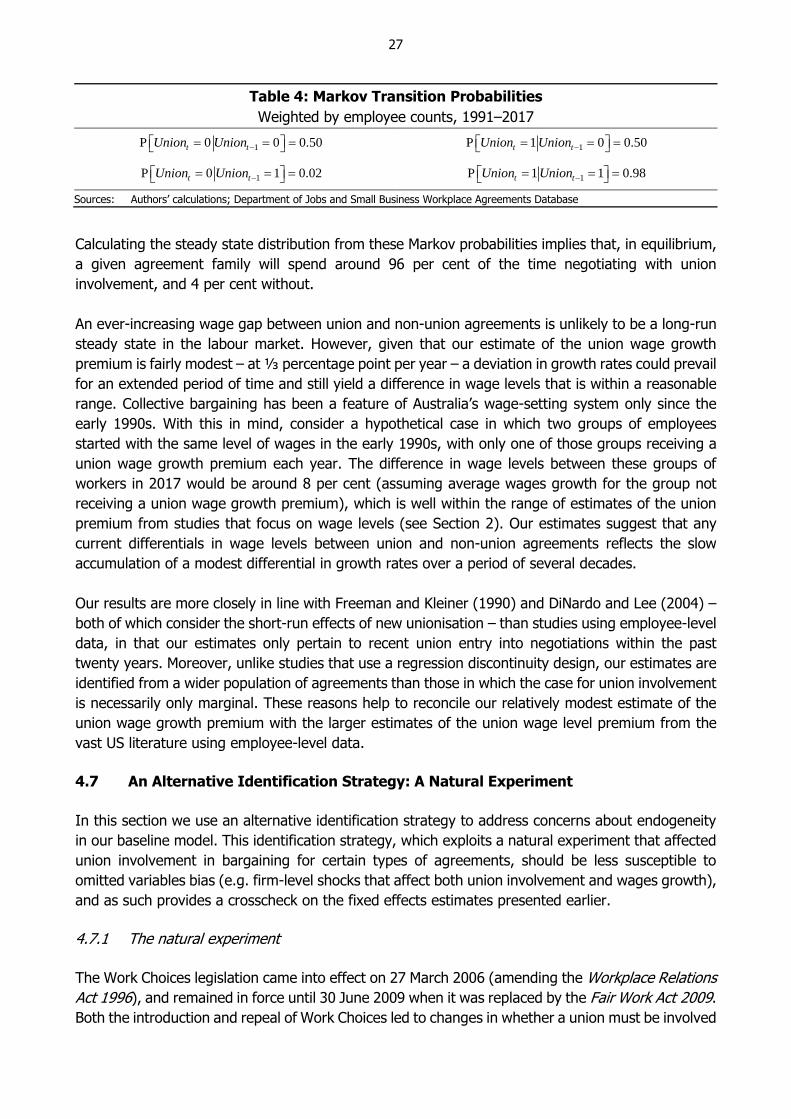
27
Table 4: Markov Transition Probabilities
Weighted by employee counts, 1991–2017
1P 0 0 0.50t tUnion Union 1P 1 0 0.50t tUnion Union
1P 0 1 0.02t tUnion Union 1P 1 1 0.98t tUnion Union
Sources: Authors’ calculations; Department of Jobs and Small Business Workplace Agreements Database
Calculating the steady state distribution from these Markov probabilities implies that, in equilibrium,
a given agreement family will spend around 96 per cent of the time negotiating with union
involvement, and 4 per cent without.
An ever-increasing wage gap between union and non-union agreements is unlikely to be a long-run
steady state in the labour market. However, given that our estimate of the union wage growth
premium is fairly modest – at ⅓ percentage point per year – a deviation in growth rates could prevail
for an extended period of time and still yield a difference in wage levels that is within a reasonable
range. Collective bargaining has been a feature of Australia’s wage-setting system only since the
early 1990s. With this in mind, consider a hypothetical case in which two groups of employees
started with the same level of wages in the early 1990s, with only one of those groups receiving a
union wage growth premium each year. The difference in wage levels between these groups of
workers in 2017 would be around 8 per cent (assuming average wages growth for the group not
receiving a union wage growth premium), which is well within the range of estimates of the union
premium from studies that focus on wage levels (see Section 2). Our estimates suggest that any
current differentials in wage levels between union and non-union agreements reflects the slow
accumulation of a modest differential in growth rates over a period of several decades.
Our results are more closely in line with Freeman and Kleiner (1990) and DiNardo and Lee (2004) –
both of which consider the short-run effects of new unionisation – than studies using employee-level
data, in that our estimates only pertain to recent union entry into negotiations within the past
twenty years. Moreover, unlike studies that use a regression discontinuity design, our estimates are
identified from a wider population of agreements than those in which the case for union involvement
is necessarily only marginal. These reasons help to reconcile our relatively modest estimate of the
union wage growth premium with the larger estimates of the union wage level premium from the
vast US literature using employee-level data.
4.7 An Alternative Identification Strategy: A Natural Experiment
In this section we use an alternative identification strategy to address concerns about endogeneity
in our baseline model. This identification strategy, which exploits a natural experiment that affected
union involvement in bargaining for certain types of agreements, should be less susceptible to
omitted variables bias (e.g. firm-level shocks that affect both union involvement and wages growth),
and as such provides a crosscheck on the fixed effects estimates presented earlier.
4.7.1 The natural experiment
The Work Choices legislation came into effect on 27 March 2006 (amending the Workplace Relations
Act 1996), and remained in force until 30 June 2009 when it was replaced by the Fair Work Act 2009.
Both the introduction and repeal of Work Choices led to changes in whether a union must be involved

28
in the negotiations of greenfields enterprise agreements. A greenfields agreement is one made in
relation to a new business or project, before any workers are employed. Under Work Choices, these
agreements could be created without a union – the employer would essentially strike an ‘agreement’
with itself, and a union had no right to demand a seat at the bargaining table (Bray and
Stewart 2013). An employer could also choose to make a greenfields agreement with a union. Under
the preceding and subsequent legislation, however, greenfields agreements could only be made with
a union. These legislative changes are summarised in Table 5, which also shows that there were no
changes to rules on whether a union must be involved in non-greenfields agreements during this
period.
Table 5: Union Involvement in Enterprise Agreements
Greenfields agreements(a)
(‘treatment group’)
Non-greenfields agreements
(‘control group’)
Before Work Choices Compulsory Not compulsory
During Work Choices Not compulsory Not compulsory
After Work Choices Compulsory Not compulsory
Note: (a) An agreement made in relation to a new business or project, before any workers are engaged
These legislative changes can help us identify the union wage effect in two ways. First, we can study
the initial introduction of Work Choices to see if the associated decrease in union involvement in
greenfields agreements after March 2006 caused wage growth outcomes in those agreements to be
lower (we refer to this as ‘experiment 1’). We can also study the reverse experiment that occurred
when Work Choices was repealed in 2009, to see if the associated increase in union involvement in
greenfields agreements led to higher wage growth outcomes (‘experiment 2’). In both cases,
greenfields agreements are the ‘treatment group’ that is affected by the policy changes governing
union involvement in bargaining. The ‘control group’ comprises non-greenfields agreements, which
were unaffected by those policy changes on union involvement. For both experiments, we can
estimate the causal impact of union involvement on wages growth by comparing the wage outcomes
of both groups before and after the policy changes using a difference-in-differences model.
As far as we are aware, beyond the changes to the requirements for union involvement, the
legislative changes had no other substantive differential effect on greenfields and non-greenfields
agreements.
Prior to Work Choices, our data suggest that all greenfields agreements were made with union
involvement, consistent with legislation in place at the time (Figure 13). During the Work Choices
period, when union involvement was no longer compulsory for any agreement, the share of
greenfields agreements involving a union fell sharply to reach a low of 45 per cent in late 2008.
Following the repeal of Work Choices in 2009, union involvement returned to 100 per cent for all
greenfields agreements as compulsory union involvement was reinstated for those agreements. By
contrast, the rate of union involvement in non-greenfields agreements was little changed over the
entire period.

29
Figure 13: Union Involvement in Enterprise Agreements
Share of agreements certified in each quarter
Sources: Authors’ calculations; Department of Jobs and Small Business Workplace Agreements Database
4.7.2 Difference-in-differences model
We use a difference-in-differences (DD) approach to study the effect of the two policy changes (in
2006 and 2009) to union involvement on wage outcomes in enterprise agreements. First, to study
the effects of the introduction of Work Choices – our ‘experiment 1’ – we estimate the following
model:
1 2 3it i t i t itAAWI Greenfields WC Greenfields WC (3)
where the dependent variable is the average annualised wage increase in firm i in period t; the two
time periods in t are ‘before’ and ‘after’ the introduction of Work Choices. WCt is a dummy variable
that equals one if the agreement was lodged under Work Choices and zero if it was lodged under
the previous legislation (the Workplace Relations Act 1996), and Greenfieldsi is a dummy that equals
one if the agreement is greenfields and zero otherwise. The coefficient of interest is 3. Differences
in overall average wages growth between greenfields and non-greenfields agreements and changes
over time that are common to both groups are captured by 1 and 2, respectively. We use data
from a symmetric 3¼-year window around the policy change (21 December 2002 to 30 June 2009)
for our estimation.43 Unlike in Equation (1), this difference-in-differences approach does not require
a matched sample.
43 We use a 3¼-year window as this was the length of time Work Choices was in place.
2010200820062004 201220
40
60
80
100
%
20
40
60
80
100
%Work Choices
period
Non-greenfields
Greenfields
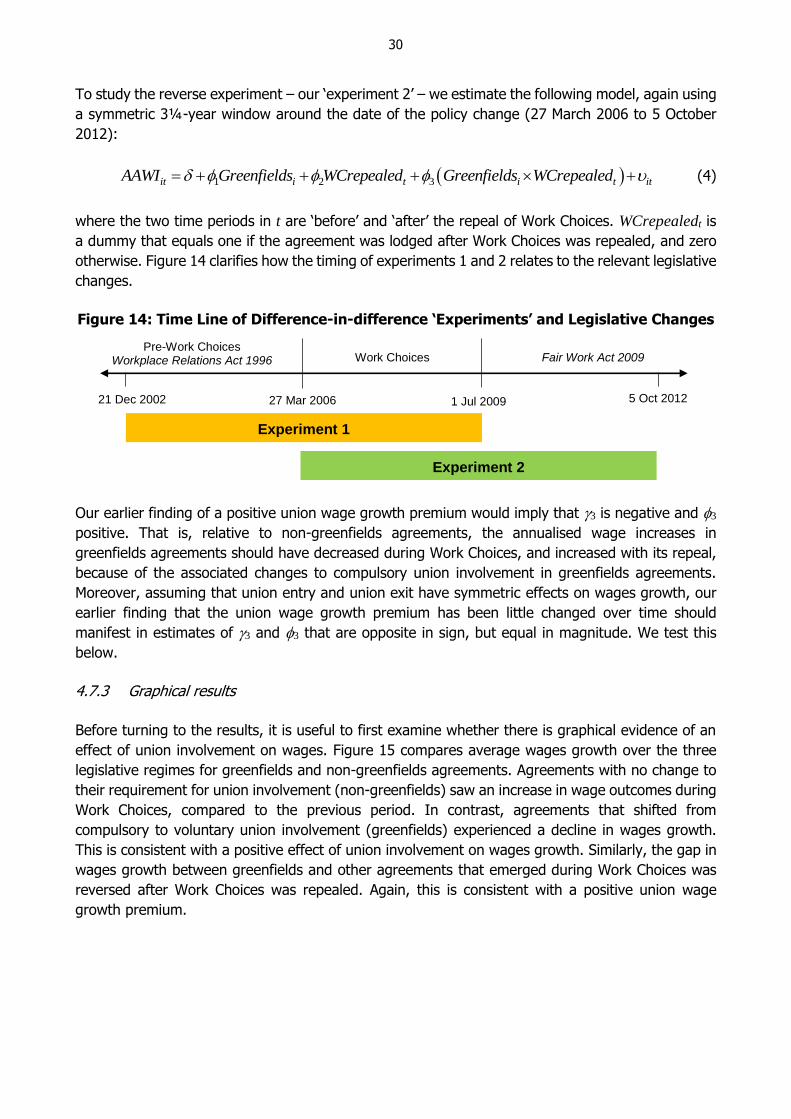
30
To study the reverse experiment – our ‘experiment 2’ – we estimate the following model, again using
a symmetric 3¼-year window around the date of the policy change (27 March 2006 to 5 October
2012):
1 2 3it i t i t itAAWI Greenfields WCrepealed Greenfields WCrepealed (4)
where the two time periods in t are ‘before’ and ‘after’ the repeal of Work Choices. WCrepealedt is
a dummy that equals one if the agreement was lodged after Work Choices was repealed, and zero
otherwise. Figure 14 clarifies how the timing of experiments 1 and 2 relates to the relevant legislative
changes.
Figure 14: Time Line of Difference-in-difference ‘Experiments’ and Legislative Changes
Our earlier finding of a positive union wage growth premium would imply that 3 is negative and 3
positive. That is, relative to non-greenfields agreements, the annualised wage increases in
greenfields agreements should have decreased during Work Choices, and increased with its repeal,
because of the associated changes to compulsory union involvement in greenfields agreements.
Moreover, assuming that union entry and union exit have symmetric effects on wages growth, our
earlier finding that the union wage growth premium has been little changed over time should
manifest in estimates of 3 and 3 that are opposite in sign, but equal in magnitude. We test this
below.
4.7.3 Graphical results
Before turning to the results, it is useful to first examine whether there is graphical evidence of an
effect of union involvement on wages. Figure 15 compares average wages growth over the three
legislative regimes for greenfields and non-greenfields agreements. Agreements with no change to
their requirement for union involvement (non-greenfields) saw an increase in wage outcomes during
Work Choices, compared to the previous period. In contrast, agreements that shifted from
compulsory to voluntary union involvement (greenfields) experienced a decline in wages growth.
This is consistent with a positive effect of union involvement on wages growth. Similarly, the gap in
wages growth between greenfields and other agreements that emerged during Work Choices was
reversed after Work Choices was repealed. Again, this is consistent with a positive union wage
growth premium.
1 Jul 2009 27 Mar 2006 21 Dec 2002 5 Oct 2012
Work Choices Fair Work Act 2009 Pre-Work Choices
Workplace Relations Act 1996
Experiment 2
Experiment 1

31
Figure 15: Wages Growth by Agreement Type
Average AAWI for agreements certified in each regime
Note: Agreements certified between 21 December 2002 and 5 October 2012
Sources: Authors’ calculations; Department of Jobs and Small Business Workplace Agreements Database
4.7.4 Difference-in-differences results
The difference-in-differences estimates for Equations (3) and (4) are shown in column 1 of Table 6.44
Focusing first on the results for experiment 1, the DD estimate suggests that the abolition of
compulsory union involvement after 2006 led to a 0.48 percentage point decrease in wages growth
in greenfields agreements relative to non-greenfields agreements. As expected, the estimated effect
is opposite in sign and only slightly smaller in magnitude (0.44) for the reverse experiment in 2009.
A test that the estimates for experiments 1 and 2 are equal in magnitude (but opposite in sign)
cannot be rejected (p-value = 0.90).
44 We also include controls for industry–state fixed effects to help control for any compositional changes over time.
Workplace
Relations
Act 1996
Work
Choices
Fair Work
Act 2009
3.8
4.0
4.2
4.4
4.6
%
3.8
4.0
4.2
4.4
4.6
%
Non-greenfields
Greenfields

32
Table 6: Difference-in-differences and Instrumental Variable Regression Results
Effect of policy change
on AAWI
(1)
Effect of policy change
on union involvement
(2)
Effect of union
involvement on AAWI
(3) = (1)/(2)
Experiment 1(a) –0.48***
(0.17)
–0.23***
(0.07)
2.14***
(0.63)
Experiment 2(b) 0.44***
(0.16)
0.28***
(0.07)
1.59*
(0.96)
Test of equal effect size (2)(c) 0.01 4.13 0.23
Pr(test statistic > 2) 0.90 0.04 0.63
Notes: ***, **, and * denote statistical significance at the 1, 5, and 10 per cent levels, respectively; standard errors (in parentheses)
are clustered at the two-digit industry level
(a) Equation (3); N = 33,894; adj R2 = 0.20, 0.19 and 0.09 in columns (1), (2) and (3), respectively
(b) Equation (4); N = 29,385; adj R2 = 0.36, 0.14 and 0.34 in columns (1), (2) and (3), respectively
(c) Cross-model hypothesis tests are performed using the suest command in Stata; for columns (1) and (2), this is a test
that the sum of the DD coefficient in experiment 1, 3, and the DD coefficient in experiment 2, 3, equals zero; for column (3),
it is a test that the difference between the Wald ratios in experiments 1 and 2 equals zero
Sources: Authors’ calculations; Department of Jobs and Small Business Workplace Agreements Database
4.7.5 Backing out the union wage growth premium
The results in column 1 of Table 6 do not provide a direct estimate of the union wage growth
premium. For example, in the case of experiment 1 the DD model yields the average effect of the
abolition of compulsory union involvement on wages growth, which would only translate directly into
a union effect on wages if the policy change caused the treatment group to go from having
compulsory union involvement to having no union involvement at all. This was not the case because
although union involvement was not compulsory under Work Choices, many of those agreements
did have union involvement (Figure 13). Using experiment 2 as an example, this suggests that in a
counterfactual world in which Work Choices had not been repealed, some greenfields agreements
would still have been negotiated with a union between 2009 and 2012. That is, some of the
agreements that were ‘treated’ after the policy change would still have been treated even if the
policy change had not occurred.
To translate our DD estimates into estimates of the union wage growth premium we need to adjust
them by an estimate of the share of greenfields agreements whose union involvement was actually
affected by the policy changes.45 We can estimate this share by replacing the dependent variable in
Equations (3) and (4) with our dummy variable for union involvement. The results for this
specification are shown in column (2) of Table 6. For experiment 1, the point estimates suggest that
the abolition of compulsory union involvement due to the introduction of Work Choices induced
23 per cent of agreements to forgo union involvement in bargaining; for experiment 2, the
45 The intuition is that only a subset of the agreements are actually affected by the policy change because only that
subset would choose to have no union involvement in the absence of any legislative requirement for involvement
(‘compliers’). The DD estimate captures the average effect on all greenfields agreements, whether or not they were
actually affected by the policy change. As such, we can obtain an estimate of the union wage growth premium by
dividing the DD estimate by the fraction of agreements actually affected by the policy change. This estimate could be
interpreted as an overall union wage growth premium if other groups have similar responses as the compliers; we
discuss this possibility in more detail later in the section.

33
reinstatement of compulsory union involvement (from the repeal of Work Choices) induced
28 per cent of agreements to take up union involvement.
The union wage growth premium can then be obtained by dividing the estimates in column (1) by
those in column (2). This estimator is equivalent to an instrumental variable (IV) regression of AAWI
on union involvement, where union involvement is instrumented using the DD interaction term.46
The results, in column (3), imply a union wage growth premium of 2.14 percentage points for
experiment 1, and 1.59 percentage points for experiment 2. The difference between these estimates
is not statistically significant (p-value = 0.63). This provides us with further evidence that the union
wage growth premium has not declined materially in recent years.
The union wage growth premium implied by the DD models is several times larger than the fixed
effects estimates in Section 4.3. This could reflect several things. First, it may be that union wage
effects are heterogeneous by type of agreement: unions may be able to extract larger wage
outcomes from greenfields agreements than non-greenfields agreements. This seems plausible given
that, in the absence of union involvement, the baseline level of worker bargaining power across
these agreements was very different – under Work Choices an employer could simply strike a
greenfields ‘agreement’ with itself, while a non-greenfields agreement still had to be agreed to by
its employees. As such, the potential upside in wage outcomes for unions may have been larger for
greenfields agreements.47 The effects could also be heterogeneous among greenfields agreements.
This matters because our IV estimator has a local average treatment effect interpretation: it yields
the effect of union involvement on wages only for those firms that were induced by the legislative
changes to change union involvement status. These firms may have had more bargaining power
relative to other greenfields employers, making it possible for them to forgo negotiations with a
union and instead set their own terms.
Another possible explanation for the discrepancy between the fixed effects and IV estimates is that
one (or both) of these estimators are biased. For example, the fixed effects estimates may be
downwardly biased due to omitted, time-varying, firm-level factors that are positively correlated with
union involvement but negatively correlated with wages. The DD/IV estimates could be upwardly
biased by a macro shock during the Work Choices period that reduced wage outcomes in greenfields
relative to non-greenfields agreements (e.g. any shock that differentially affected new businesses,
relative to existing businesses). It is nevertheless reassuring that, despite differences in the size of
the premium, both identification strategies point to a relatively stable union premium over recent
years.
46 This is an application of a Wald estimator (see Angrist and Pischke (2009, pp 127–133) for further details).
47 Until recently, firms also had limited avenues to resolve bargaining stalemates with unions in greenfields agreements.
Unions could therefore potentially use negotiation delays to influence the starting date and viability of projects – a
strategy that would likely have been less effective in non-greenfields agreements. For a discussion of union bargaining
power in greenfields agreements after the repeal of Work Choices, see Productivity Commission (2015) and
Department of Employment (2017). When the Fair Work Amendment Act 2015 came into force on 27 November 2015,
‘good faith’ bargaining requirements were extended to greenfields agreements, and an avenue was created for
employers to take the agreement to the Fair Work Commission for approval if agreement could be reached with a
union after six months. See Productivity Commission (2015, p 712) and Department of Employment (2017) for further
details.
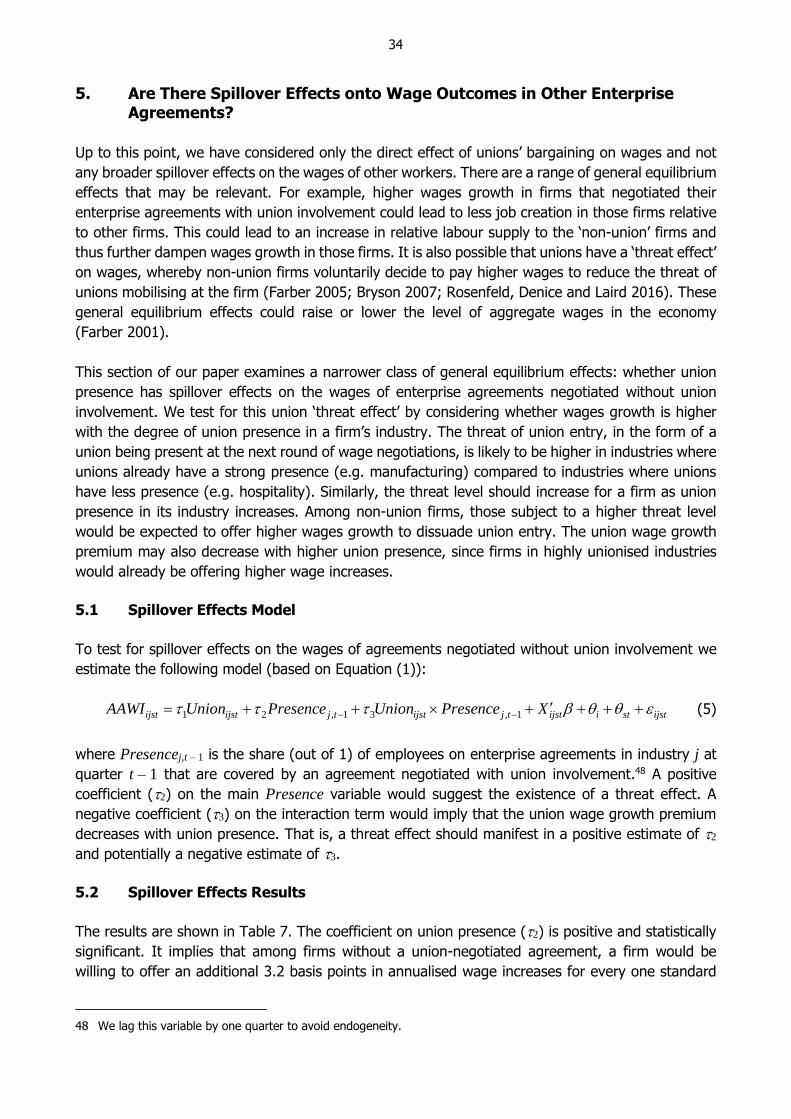
34
5. Are There Spillover Effects onto Wage Outcomes in Other Enterprise Agreements?
Up to this point, we have considered only the direct effect of unions’ bargaining on wages and not
any broader spillover effects on the wages of other workers. There are a range of general equilibrium
effects that may be relevant. For example, higher wages growth in firms that negotiated their
enterprise agreements with union involvement could lead to less job creation in those firms relative
to other firms. This could lead to an increase in relative labour supply to the ‘non-union’ firms and
thus further dampen wages growth in those firms. It is also possible that unions have a ‘threat effect’
on wages, whereby non-union firms voluntarily decide to pay higher wages to reduce the threat of
unions mobilising at the firm (Farber 2005; Bryson 2007; Rosenfeld, Denice and Laird 2016). These
general equilibrium effects could raise or lower the level of aggregate wages in the economy
(Farber 2001).
This section of our paper examines a narrower class of general equilibrium effects: whether union
presence has spillover effects on the wages of enterprise agreements negotiated without union
involvement. We test for this union ‘threat effect’ by considering whether wages growth is higher
with the degree of union presence in a firm’s industry. The threat of union entry, in the form of a
union being present at the next round of wage negotiations, is likely to be higher in industries where
unions already have a strong presence (e.g. manufacturing) compared to industries where unions
have less presence (e.g. hospitality). Similarly, the threat level should increase for a firm as union
presence in its industry increases. Among non-union firms, those subject to a higher threat level
would be expected to offer higher wages growth to dissuade union entry. The union wage growth
premium may also decrease with higher union presence, since firms in highly unionised industries
would already be offering higher wage increases.
5.1 Spillover Effects Model
To test for spillover effects on the wages of agreements negotiated without union involvement we
estimate the following model (based on Equation (1)):
1 2 , 1 3 , 1ijst ijst j t ijst j t ijst i st ijstAAWI Union Presence Union Presence X (5)
where Presencej,t – 1 is the share (out of 1) of employees on enterprise agreements in industry j at
quarter t – 1 that are covered by an agreement negotiated with union involvement.48 A positive
coefficient (2) on the main Presence variable would suggest the existence of a threat effect. A
negative coefficient (3) on the interaction term would imply that the union wage growth premium
decreases with union presence. That is, a threat effect should manifest in a positive estimate of 2
and potentially a negative estimate of 3.
5.2 Spillover Effects Results
The results are shown in Table 7. The coefficient on union presence (2) is positive and statistically
significant. It implies that among firms without a union-negotiated agreement, a firm would be
willing to offer an additional 3.2 basis points in annualised wage increases for every one standard
48 We lag this variable by one quarter to avoid endogeneity.
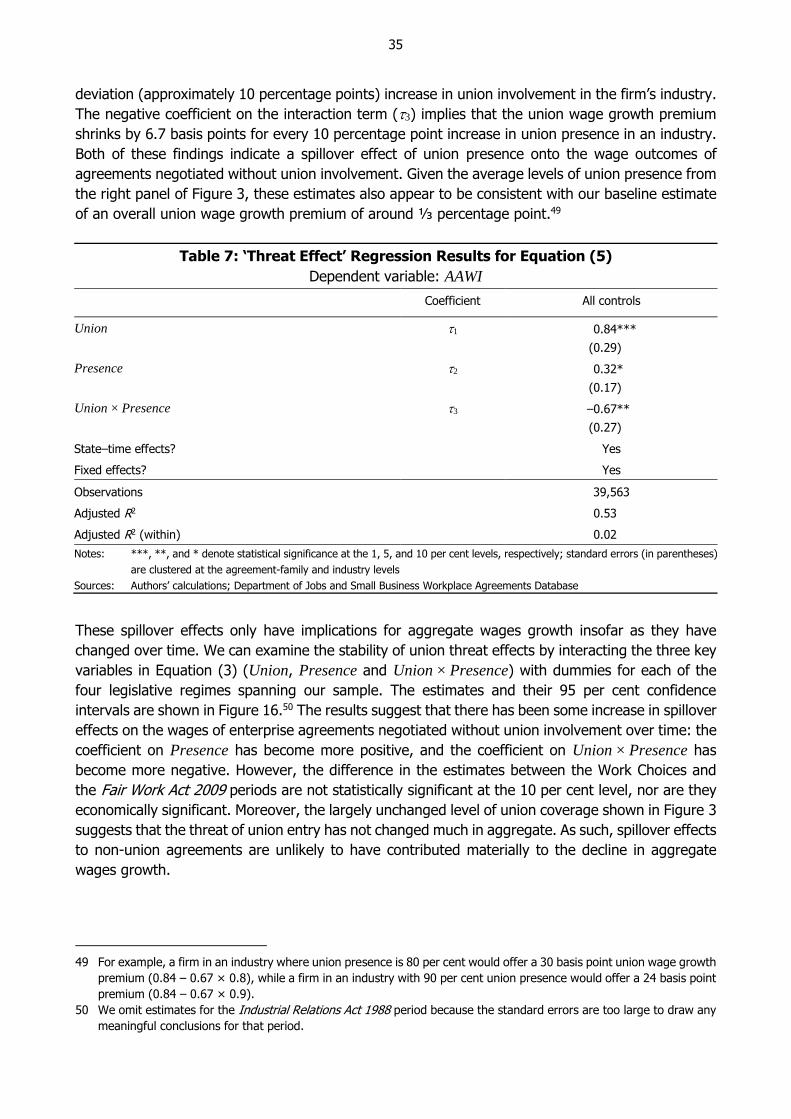
35
deviation (approximately 10 percentage points) increase in union involvement in the firm’s industry.
The negative coefficient on the interaction term (3) implies that the union wage growth premium
shrinks by 6.7 basis points for every 10 percentage point increase in union presence in an industry.
Both of these findings indicate a spillover effect of union presence onto the wage outcomes of
agreements negotiated without union involvement. Given the average levels of union presence from
the right panel of Figure 3, these estimates also appear to be consistent with our baseline estimate
of an overall union wage growth premium of around ⅓ percentage point.49
Table 7: ‘Threat Effect’ Regression Results for Equation (5)
Dependent variable: AAWI
Coefficient All controls
Union 1 0.84***
(0.29)
Presence 2 0.32*
(0.17)
Union × Presence 3 –0.67**
(0.27)
State–time effects? Yes
Fixed effects? Yes
Observations 39,563
Adjusted R2 0.53
Adjusted R2 (within) 0.02
Notes: ***, **, and * denote statistical significance at the 1, 5, and 10 per cent levels, respectively; standard errors (in parentheses)
are clustered at the agreement-family and industry levels
Sources: Authors’ calculations; Department of Jobs and Small Business Workplace Agreements Database
These spillover effects only have implications for aggregate wages growth insofar as they have
changed over time. We can examine the stability of union threat effects by interacting the three key
variables in Equation (3) (Union, Presence and Union × Presence) with dummies for each of the
four legislative regimes spanning our sample. The estimates and their 95 per cent confidence
intervals are shown in Figure 16.50 The results suggest that there has been some increase in spillover
effects on the wages of enterprise agreements negotiated without union involvement over time: the
coefficient on Presence has become more positive, and the coefficient on Union × Presence has
become more negative. However, the difference in the estimates between the Work Choices and
the Fair Work Act 2009 periods are not statistically significant at the 10 per cent level, nor are they
economically significant. Moreover, the largely unchanged level of union coverage shown in Figure 3
suggests that the threat of union entry has not changed much in aggregate. As such, spillover effects
to non-union agreements are unlikely to have contributed materially to the decline in aggregate
wages growth.
49 For example, a firm in an industry where union presence is 80 per cent would offer a 30 basis point union wage growth
premium (0.84 – 0.67 × 0.8), while a firm in an industry with 90 per cent union presence would offer a 24 basis point
premium (0.84 – 0.67 × 0.9).
50 We omit estimates for the Industrial Relations Act 1988 period because the standard errors are too large to draw any
meaningful conclusions for that period.
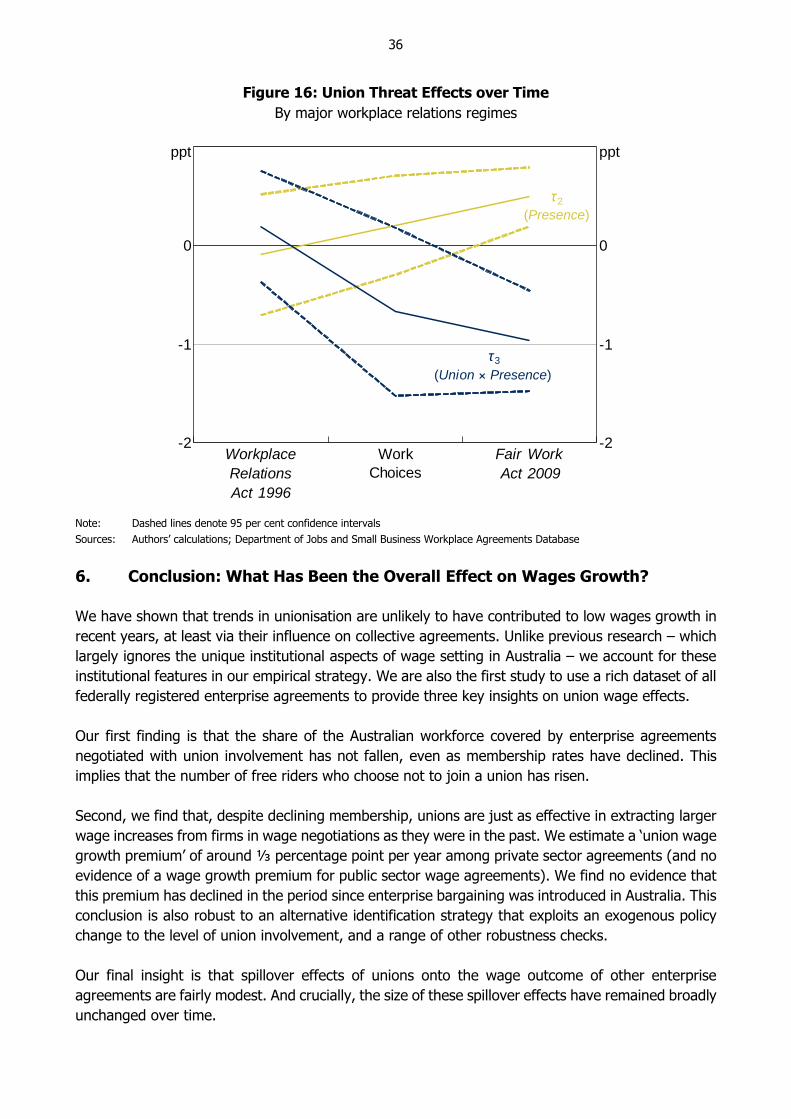
36
Figure 16: Union Threat Effects over Time
By major workplace relations regimes
Note: Dashed lines denote 95 per cent confidence intervals
Sources: Authors’ calculations; Department of Jobs and Small Business Workplace Agreements Database
6. Conclusion: What Has Been the Overall Effect on Wages Growth?
We have shown that trends in unionisation are unlikely to have contributed to low wages growth in
recent years, at least via their influence on collective agreements. Unlike previous research – which
largely ignores the unique institutional aspects of wage setting in Australia – we account for these
institutional features in our empirical strategy. We are also the first study to use a rich dataset of all
federally registered enterprise agreements to provide three key insights on union wage effects.
Our first finding is that the share of the Australian workforce covered by enterprise agreements
negotiated with union involvement has not fallen, even as membership rates have declined. This
implies that the number of free riders who choose not to join a union has risen.
Second, we find that, despite declining membership, unions are just as effective in extracting larger
wage increases from firms in wage negotiations as they were in the past. We estimate a ‘union wage
growth premium’ of around ⅓ percentage point per year among private sector agreements (and no
evidence of a wage growth premium for public sector wage agreements). We find no evidence that
this premium has declined in the period since enterprise bargaining was introduced in Australia. This
conclusion is also robust to an alternative identification strategy that exploits an exogenous policy
change to the level of union involvement, and a range of other robustness checks.
Our final insight is that spillover effects of unions onto the wage outcome of other enterprise
agreements are fairly modest. And crucially, the size of these spillover effects have remained broadly
unchanged over time.
Workplace
Relations
Act 1996
Work
Choices
Fair Work
Act 2009
-2
-1
0
ppt
-2
-1
0
ppt
(Union Presence)
(Presence)
3
2

37
Our research is another step toward answering the question of why aggregate wages growth
outcomes continue to be so low in Australia. The findings in our paper suggest that we can rule out
one key channel through which a decline in employee bargaining power might be dragging on wages
growth. However, our analysis does not rule out the possibility that other shifts in labour bargaining
power – such as that due to rising competition from automation or a move towards global supply
chains – are at work, or that the role of unions in other forms of wage setting (e.g. awards) has
changed.
38
Appendix A: Definitional Changes under the Fair Work Act 2009
The classification of union and non-union enterprise agreements in the WAD changed following the
introduction of the Fair Work Act 2009. Prior to the Fair Work Act 2009, the ‘union’ indicator variable
in the WAD measured whether or not a union was involved in bargaining. Under the Fair Work
Act 2009 it instead measured whether a union is covered by the agreement. Being covered enhances
the union’s rights to enforce the terms of the agreement (Bray and Stewart 2013).
Under the Fair Work Act 2009 unions need to apply to the Fair Work Commission to be covered by
an agreement; that is, it is at a union’s discretion as to whether to apply to be covered when they
have been involved in the negotiations. A union may therefore choose to be covered only when the
wage outcome is favourable, potentially biasing our estimate of the union wage growth premium
upwards during the post-2009 sample period. Conversely, our estimates will be biased downwards
if unions are more likely to apply for coverage in cases where employee bargaining power (and
hence wages growth) is low, in order to ensure the firm upholds the terms of the agreement.
This definitional change does not appear to be driving our finding that the union wage growth
premium has been little changed over time. Indeed, the difference-in-differences estimates in
column (1) of Table 6 are unaffected by the recent definitional changes to union involvement. In
the difference-in-differences model, the effect of unions on wages growth is inferred based on
whether an agreement was greenfields or not, and hence any endogeneity in unions’ decisions to
apply for coverage would not affect these results. That these estimates also show no evidence of a
decline in the effect of unions on wages growth in recent years gives us confidence that our baseline
estimates from Sections 4.3 and 4.4 are not biased materially by these definitional changes.
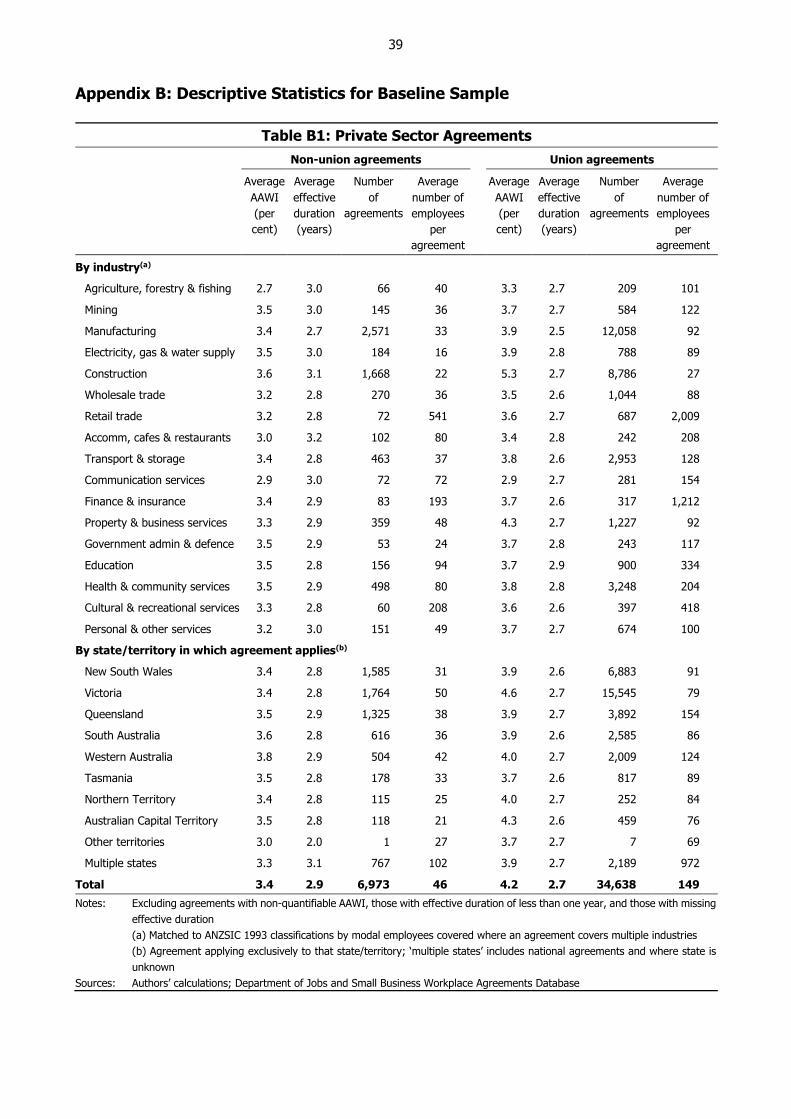
39
Appendix B: Descriptive Statistics for Baseline Sample
Table B1: Private Sector Agreements
Non-union agreements Union agreements
Average
AAWI
(per
cent)
Average
effective
duration
(years)
Number
of
agreements
Average
number of
employees
per
agreement
Average
AAWI
(per
cent)
Average
effective
duration
(years)
Number
of
agreements
Average
number of
employees
per
agreement
By industry(a)
Agriculture, forestry & fishing 2.7 3.0 66 40 3.3 2.7 209 101
Mining 3.5 3.0 145 36 3.7 2.7 584 122
Manufacturing 3.4 2.7 2,571 33 3.9 2.5 12,058 92
Electricity, gas & water supply 3.5 3.0 184 16 3.9 2.8 788 89
Construction 3.6 3.1 1,668 22 5.3 2.7 8,786 27
Wholesale trade 3.2 2.8 270 36 3.5 2.6 1,044 88
Retail trade 3.2 2.8 72 541 3.6 2.7 687 2,009
Accomm, cafes & restaurants 3.0 3.2 102 80 3.4 2.8 242 208
Transport & storage 3.4 2.8 463 37 3.8 2.6 2,953 128
Communication services 2.9 3.0 72 72 2.9 2.7 281 154
Finance & insurance 3.4 2.9 83 193 3.7 2.6 317 1,212
Property & business services 3.3 2.9 359 48 4.3 2.7 1,227 92
Government admin & defence 3.5 2.9 53 24 3.7 2.8 243 117
Education 3.5 2.8 156 94 3.7 2.9 900 334
Health & community services 3.5 2.9 498 80 3.8 2.8 3,248 204
Cultural & recreational services 3.3 2.8 60 208 3.6 2.6 397 418
Personal & other services 3.2 3.0 151 49 3.7 2.7 674 100
By state/territory in which agreement applies(b)
New South Wales 3.4 2.8 1,585 31 3.9 2.6 6,883 91
Victoria 3.4 2.8 1,764 50 4.6 2.7 15,545 79
Queensland 3.5 2.9 1,325 38 3.9 2.7 3,892 154
South Australia 3.6 2.8 616 36 3.9 2.6 2,585 86
Western Australia 3.8 2.9 504 42 4.0 2.7 2,009 124
Tasmania 3.5 2.8 178 33 3.7 2.6 817 89
Northern Territory 3.4 2.8 115 25 4.0 2.7 252 84
Australian Capital Territory 3.5 2.8 118 21 4.3 2.6 459 76
Other territories 3.0 2.0 1 27 3.7 2.7 7 69
Multiple states 3.3 3.1 767 102 3.9 2.7 2,189 972
Total 3.4 2.9 6,973 46 4.2 2.7 34,638 149
Notes: Excluding agreements with non-quantifiable AAWI, those with effective duration of less than one year, and those with missing
effective duration
(a) Matched to ANZSIC 1993 classifications by modal employees covered where an agreement covers multiple industries
(b) Agreement applying exclusively to that state/territory; ‘multiple states’ includes national agreements and where state is
unknown
Sources: Authors’ calculations; Department of Jobs and Small Business Workplace Agreements Database
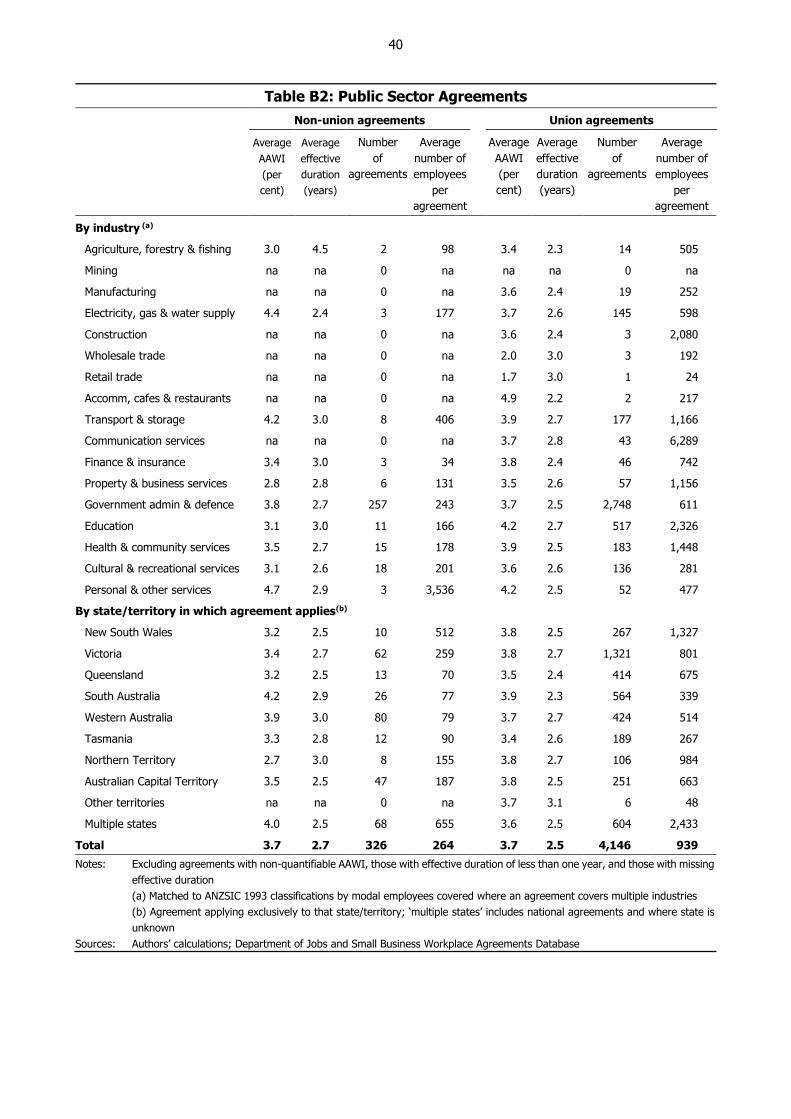
40
Table B2: Public Sector Agreements
Non-union agreements Union agreements
Average
AAWI
(per
cent)
Average
effective
duration
(years)
Number
of
agreements
Average
number of
employees
per
agreement
Average
AAWI
(per
cent)
Average
effective
duration
(years)
Number
of
agreements
Average
number of
employees
per
agreement
By industry (a)
Agriculture, forestry & fishing 3.0 4.5 2 98 3.4 2.3 14 505
Mining na na 0 na na na 0 na
Manufacturing na na 0 na 3.6 2.4 19 252
Electricity, gas & water supply 4.4 2.4 3 177 3.7 2.6 145 598
Construction na na 0 na 3.6 2.4 3 2,080
Wholesale trade na na 0 na 2.0 3.0 3 192
Retail trade na na 0 na 1.7 3.0 1 24
Accomm, cafes & restaurants na na 0 na 4.9 2.2 2 217
Transport & storage 4.2 3.0 8 406 3.9 2.7 177 1,166
Communication services na na 0 na 3.7 2.8 43 6,289
Finance & insurance 3.4 3.0 3 34 3.8 2.4 46 742
Property & business services 2.8 2.8 6 131 3.5 2.6 57 1,156
Government admin & defence 3.8 2.7 257 243 3.7 2.5 2,748 611
Education 3.1 3.0 11 166 4.2 2.7 517 2,326
Health & community services 3.5 2.7 15 178 3.9 2.5 183 1,448
Cultural & recreational services 3.1 2.6 18 201 3.6 2.6 136 281
Personal & other services 4.7 2.9 3 3,536 4.2 2.5 52 477
By state/territory in which agreement applies(b)
New South Wales 3.2 2.5 10 512 3.8 2.5 267 1,327
Victoria 3.4 2.7 62 259 3.8 2.7 1,321 801
Queensland 3.2 2.5 13 70 3.5 2.4 414 675
South Australia 4.2 2.9 26 77 3.9 2.3 564 339
Western Australia 3.9 3.0 80 79 3.7 2.7 424 514
Tasmania 3.3 2.8 12 90 3.4 2.6 189 267
Northern Territory 2.7 3.0 8 155 3.8 2.7 106 984
Australian Capital Territory 3.5 2.5 47 187 3.8 2.5 251 663
Other territories na na 0 na 3.7 3.1 6 48
Multiple states 4.0 2.5 68 655 3.6 2.5 604 2,433
Total 3.7 2.7 326 264 3.7 2.5 4,146 939
Notes: Excluding agreements with non-quantifiable AAWI, those with effective duration of less than one year, and those with missing
effective duration
(a) Matched to ANZSIC 1993 classifications by modal employees covered where an agreement covers multiple industries
(b) Agreement applying exclusively to that state/territory; ‘multiple states’ includes national agreements and where state is
unknown
Sources: Authors’ calculations; Department of Jobs and Small Business Workplace Agreements Database
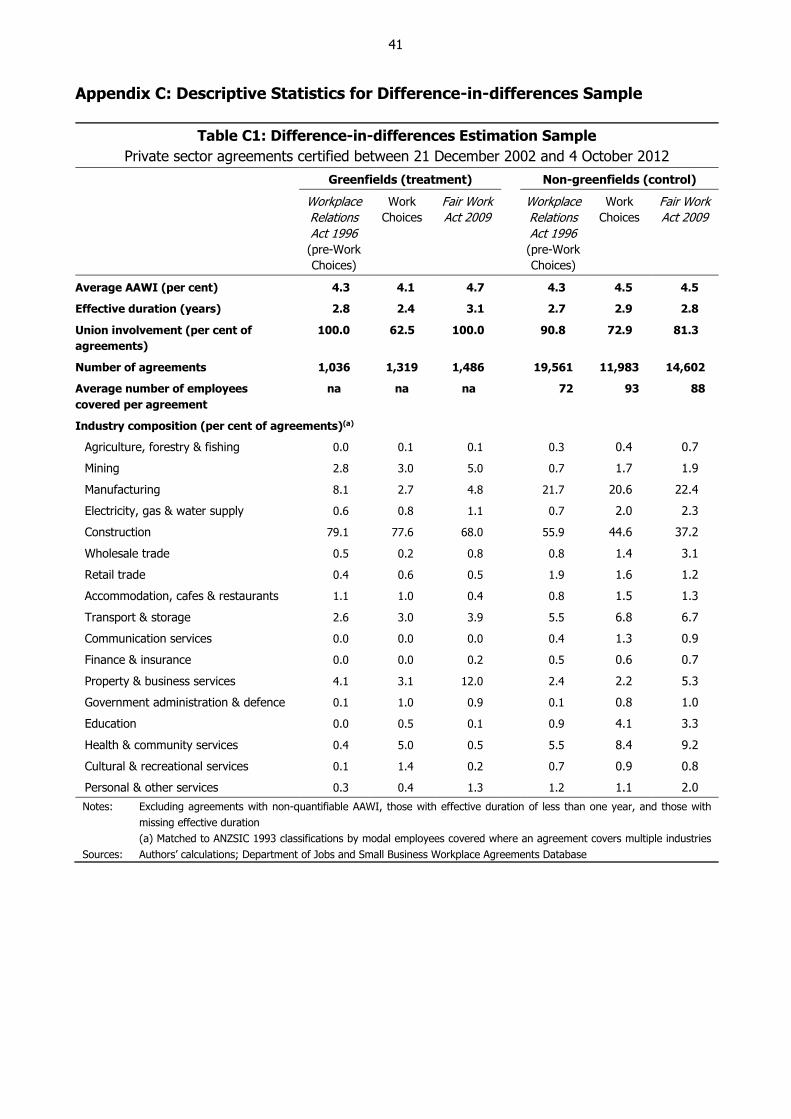
41
Appendix C: Descriptive Statistics for Difference-in-differences Sample
Table C1: Difference-in-differences Estimation Sample
Private sector agreements certified between 21 December 2002 and 4 October 2012
Greenfields (treatment) Non-greenfields (control)
Workplace
Relations
Act 1996
(pre-Work
Choices)
Work
Choices
Fair Work
Act 2009
Workplace
Relations
Act 1996
(pre-Work
Choices)
Work
Choices
Fair Work
Act 2009
Average AAWI (per cent) 4.3 4.1 4.7 4.3 4.5 4.5
Effective duration (years) 2.8 2.4 3.1 2.7 2.9 2.8
Union involvement (per cent of
agreements)
100.0 62.5 100.0 90.8 72.9 81.3
Number of agreements 1,036 1,319 1,486 19,561 11,983 14,602
Average number of employees
covered per agreement
na na na 72 93 88
Industry composition (per cent of agreements)(a)
Agriculture, forestry & fishing 0.0 0.1 0.1 0.3 0.4 0.7
Mining 2.8 3.0 5.0 0.7 1.7 1.9
Manufacturing 8.1 2.7 4.8 21.7 20.6 22.4
Electricity, gas & water supply 0.6 0.8 1.1 0.7 2.0 2.3
Construction 79.1 77.6 68.0 55.9 44.6 37.2
Wholesale trade 0.5 0.2 0.8 0.8 1.4 3.1
Retail trade 0.4 0.6 0.5 1.9 1.6 1.2
Accommodation, cafes & restaurants 1.1 1.0 0.4 0.8 1.5 1.3
Transport & storage 2.6 3.0 3.9 5.5 6.8 6.7
Communication services 0.0 0.0 0.0 0.4 1.3 0.9
Finance & insurance 0.0 0.0 0.2 0.5 0.6 0.7
Property & business services 4.1 3.1 12.0 2.4 2.2 5.3
Government administration & defence 0.1 1.0 0.9 0.1 0.8 1.0
Education 0.0 0.5 0.1 0.9 4.1 3.3
Health & community services 0.4 5.0 0.5 5.5 8.4 9.2
Cultural & recreational services 0.1 1.4 0.2 0.7 0.9 0.8
Personal & other services 0.3 0.4 1.3 1.2 1.1 2.0
Notes: Excluding agreements with non-quantifiable AAWI, those with effective duration of less than one year, and those with
missing effective duration
(a) Matched to ANZSIC 1993 classifications by modal employees covered where an agreement covers multiple industries
Sources: Authors’ calculations; Department of Jobs and Small Business Workplace Agreements Database

42
References
Angrist JD and J-S Pischke (2009), Mostly Harmless Econometrics: An Empiricist’s Companion, Princeton
University Press, Princeton.
Arellano M and S Bond (1991), ‘Some Tests of Specification for Panel Data: Monte Carlo Evidence and an
Application to Employment Equations’, The Review of Economic Studies, 58(2), pp 277–297.
Bell DNF and DG Blanchflower (2018), ‘The Lack of Wage Growth and the Falling NAIRU’, NBER Working
Paper No 24502.
Blanchflower DG and A Bryson (2004), ‘The Union Wage Premium in the US and the UK’, Centre for
Economic Performance, CEP Discussion Paper No CEPDP0612.
Booth AL (1985), ‘The Free Rider Problem and a Social Custom Model of Trade Union Membership’, The
Quarterly Journal of Economics, 100(1), pp 253–261.
Booth AL and ML Bryan (2004), ‘The Union Membership Wage-Premium Puzzle: Is There a Free Rider
Problem?’, ILR Review, 57(3), pp 402–421.
Booth AL and M Chatterji (1995), ‘Union Membership and Wage Bargaining When Membership is Not
Compulsory’, The Economic Journal, 105(429), pp 345–360.
Bowden B (2011), ‘The Rise and Decline of Australian Unionism: A History of Industrial Labour from the
1820s to 2010’, Labour History, 100, pp 51–82.
Bray M and A Stewart (2013), ‘From the Arbitration System to the Fair Work Act: The Changing Approach
in Australia to Voice and Representation at Work’, Adelaide Law Review, 34(1), pp 21–41.
Bryson A (2007), ‘The Effect of Trade Unions on Wages’, Reflets et Perspectives de la Vie Économique,
46(2), pp 33–45.
Budd JW and I-G Na (2000), ‘The Union Membership Wage Premium for Employees Covered by Collective
Bargaining Agreements’, Journal of Labor Economics, 18(4), pp 783–807.
Cai L and AYC Liu (2008), ‘Union Wage Effects in Australia: Is There Variation along the Distribution?’,
Economic Record, 84(267), pp 496–510.
Cai L and CJ Waddoups (2011), ‘Union Wage Effects in Australia: Evidence from Panel data’, British Journal
of Industrial Relations, 49(s2), pp s279–s305.
Card D (1996), ‘The Effect of Unions on the Structure of Wages: A Longitudinal Analysis’, Econometrica,
64(4), pp 957–979.
Christie V (1992), ‘Union Wage Effects and the Probability of Union Membership’, Economic Record, 68(1),
pp 43–56.
Department of Employment (2016), ‘Non-Quantifiable Wage Increases in Federal Enterprise Agreements’,
Research paper. Available at <https://docs.jobs.gov.au/system/files/doc/other/non-quants_paper.pdf>.
43
Department of Employment (2017), ‘Greenfields Agreements Review: Background Paper’.
Department of Jobs and Small Business (2018), ‘Trends in Federal Enterprise Bargaining Report’,
September Quarter.
Dickens WT, L Goette, EL Groshen, S Holden, J Messina, ME Schweitzer, J Turunen and ME Ward
(2007), ‘How Wages Change: Micro Evidence from the International Wage Flexibility Project’, Journal of
Economic Perspectives, 21(2), pp 195–214.
DiNardo J and DS Lee (2004), ‘Economic Impacts of New Unionization on Private Sector Employers:
1984–2001’, The Quarterly Journal of Economics, 119(4), pp 1383–1441.
Elsby MWL, B Hobijn and A Şahin (2013), ‘The Decline of the U.S. Labor Share’, Brookings Papers on
Economic Activity, Fall, pp 1–52.
Farber HS (2001), ‘Notes on the Economics of Labor Unions’, Princeton University, Industrial Relations
Section Working Paper No 452.
Farber HS (2005), ‘Nonunion Wage Rates and the Threat of Unionization’, ILR Review, 58(3), pp 335–352.
Farber HS, D Herbst, I Kuziemko and S Naidu (2018), ‘Unions and Inequality Over the Twentieth
Century: New Evidence from Survey Data’, NBER Working Paper No 24587.
Fitzenberger B, K Kohn and AC Lembke (2013), ‘Union Density and Varieties of Coverage: The Anatomy
of Union Wage Effects in Germany’, ILR Review, 66(1), pp 169–197.
Freeman RB (1984), ‘Longitudinal Analyses of the Effects of Trade Unions’, Journal of Labor Economics,
2(1), pp 1–26.
Freeman RB and MM Kleiner (1990), ‘The Impact of New Unionization on Wages and Working Conditions’,
Journal of Labor Economics, 8(1, Part 2), pp S8–S25.
Haldane AG (2017), ‘Work, Wages and Monetary Policy’, Speech given at the National Science and Media
Museum, Bradford, 20 June.
Heckman JJ (1979), ‘Sample Selection Bias as a Specification Error’, Econometrica, 47(1), pp 153–161.
Hirsch BT (2004), ‘Reconsidering Union Wage Effects: Surveying New Evidence on an Old Topic’, Journal of
Labor Research, 25(2), pp 233–266.
Hirsch BT (2010), ‘Unions, Dynamism, and Economic Performance’, Institute for the Study of Labor, IZA
Discussion Paper No 5342.
Holden S and F Wulfsberg (2008), ‘Downward Nominal Wage Rigidity in the OECD’, The B.E. Journal of
Macroeconomics, 8(1), Advances, Article 15.
Isaac J (2018), ‘Why Are Australian Wages Lagging and What Can Be Done About It?’, The Australian
Economic Review, 51(2), pp 175–190.
Koevoets W (2007), ‘’Union Wage Premiums in Great Britain: Coverage or Membership’, Labour Economics,
14(1), pp 53–71.
44
Kornfeld R (1993), ‘The Effects of Union Membership on Wages and Employee Benefits: The Case of
Australia’, ILR Review, 47(1), pp 114–128.
LaLonde RJ, G Marschke and K Troske (1996), ‘Using Longitudinal Data on Establishments to Analyze
the Effects of Union Organizing Campaigns in the United States’, Annales d’Économie et de Statistique, 41/42,
pp 155–185.
Lee DS and A Mas (2012), ‘Long-Run Impacts of Unions on Firms: New Evidence from Financial Markets,
1961–1999’, The Quarterly Journal of Economics, 127(1), pp 333–378.
Leigh A (2018), ‘Why Unions are Vital to Advance Australia Fair’, Speech given at a Per Capita event,
Melbourne, 2 October. Available at <http://www.andrewleigh.com/why_unions_are_vital_to_advance_
australia_fair_speech_melbourne>.
Lemieux T (1998), ‘Estimating the Effects of Unions on Wage Inequality in a Panel Data Model with
Comparative Advantage and Nonrandom Selection’, Journal of Labor Economics, 16(2), pp 261–291.
Miller P and C Mulvey (1993), ‘What Do Australian Unions Do?’, Economic Record, 69(3), pp 315–342.
Miller P and C Mulvey (1996), ‘Unions, Firm Size and Wages’, Economic Record, 72(217), pp 138–151.
Mishel L (2012), ‘Unions, Inequality, and Faltering Middle-Class Wages’, Economic Policy Institute Issue Brief
No 342.
Nahm D, M Dobbie and C MacMillan (2017), ‘Union Wage Effects in Australia: An Endogenous Switching
Approach’, Applied Economics, 49(39), pp 3927–3942.
Peetz D and A Preston (2009), ‘Individual Contracting, Collective Bargaining and Wages in Australia’,
Industrial Relations Journal, 40(5), pp 444–461.
Peetz D and S Yu (2017), Explaining Recent Trends in Collective Bargaining, Fair Work Commission
Research Report 4/2017, Fair Work Commission, Canberra.
Productivity Commission (2015), Workplace Relations Framework: Volume 1, Final Report, Productivity
Commission Inquiry Report No 76, Productivity Commission, Canberra.
Rosenfeld J, P Denice and J Laird (2016), ‘Union Decline Lowers Wages of Nonunion Workers: The
Overlooked Reason Why Wages are Stuck and Inequality is Growing’, Economic Policy Institute Report,
30 August.
Shambaugh J, R Nunn, P Lui and G Nantz (2017), ‘Thirteen Facts about Wage Growth’, Economic Facts,
The Hamiliton Project, September. Available at <http://www.hamiltonproject.org/assets/files/
thirteen_facts_wage_growth.pdf>.
Solon G, SJ Haider and JM Wooldridge (2015), ‘What Are We Weighting For?’, The Journal of Human
Resources, 50(2), pp 301–316.
Stewart A (2015), Stewart’s Guide to Employment Law, 5th edn, The Federation Press, Annandale.

45
Waddoups CJ (2005), ‘Trade Union Decline and Union Wage Effects in Australia’, Industrial Relations: A
Journal of Economy and Society, 44(4), pp 607–624.
Wooden M (2001), ‘Union Wage Effects in the Presence of Enterprise Bargaining’, Economic Record,
77(236), pp 1–18.
46
Copyright and Disclaimer Notice
HILDA
The following Disclaimer applies to data obtained from the HILDA Survey and reported in this RDP.
Disclaimer
This paper uses unit record data from the Household, Income and Labour Dynamics in Australia
(HILDA) Survey. The unit record data from the HILDA Survey was obtained from the Australian Data
Archive, which is hosted by The Australian National University. The HILDA Survey was initiated and
is funded by the Australian Government Department of Social Services (DSS) and is managed by the
Melbourne Institute of Applied Economic and Social Research (Melbourne Institute). The findings
and views based on the data, however, are those of the authors and should not be attributed to the
Australian Government, DSS, the Melbourne Institute, the Australian Data Archive or The Australian
National University and none of those entities bear any responsibility for the analysis or interpretation
of the unit record data from the HILDA Survey provided by the authors.