Embed Size (px)
Citation preview

is air pollution a serious threat to health?
AI Air Pollution INT 8/17/04 9:19 AM Page 1

Other books in the At Issue series:Affirmative ActionAre Efforts to Reduce Terrorism Successful?Are the World’s Coral Reefs Threatened?Club DrugsDo Animals Have Rights?Does the World Hate the United States?Do Infectious Diseases Pose a Serious Threat?Do Nuclear Weapons Pose a Serious Threat?The Ethics of Capital PunishmentThe Ethics of EuthanasiaThe Ethics of Genetic EngineeringThe Ethics of Human CloningFast FoodFood SafetyGay and Lesbian FamiliesGay MarriageGene TherapyHow Can School Violence Be Prevented?How Should America’s Wilderness Be Managed?How Should the United States Withdraw from Iraq?Internet PiracyIs America Helping Afghanistan?Is Gun Ownership a Right?Is North Korea a Global Threat?Is Racism a Serious Problem?The Israeli-Palestinian ConflictMedia BiasThe Peace MovementReproductive TechnologySex EducationShould Juveniles Be Tried as Adults?Teen SuicideTreating the Mentally IllUFOsWhat Energy Sources Should Be Pursued?What Motivates Suicide Bombers?Women in the Military
AI Air Pollution INT 8/17/04 9:19 AM Page 2

is air pollution a serious threat to health?
Bruce Glassman, Vice PresidentBonnie Szumski, PublisherHelen Cothran, Managing Editor
Andrea C. Nakaya, Book Editor
Detroit • New York • San Francisco • San Diego • New Haven, Conn.Waterville, Maine • London • Munich
AI Air Pollution INT 8/17/04 9:19 AM Page 3

© 2005 Thomson Gale, a part of The Thomson Corporation.
Thomson and Star Logo are trademarks and Gale and Greenhaven Press are registered trademarksused herein under license.
For more information, contactGreenhaven Press27500 Drake Rd.Farmington Hills, MI 48331-3535Or you can visit our Internet site at http://www.gale.com
ALL RIGHTS RESERVED.No part of this work covered by the copyright hereon may be reproduced or used in any formor by any means—graphic, electronic, or mechanical, including photocopying, recording,taping, Web distribution or information storage retrieval systems—without the writtenpermission of the publisher.
Every effort has been made to trace the owners of copyrighted material.
Is air pollution a serious threat to health? / Andrea C. Nakaya, book editor.p. cm. — (At issue)
Includes bibliographical references and index.ISBN 0-7377-2392-0 (lib. : alk. paper) — ISBN 0-7377-2393-9 (pbk. : alk. paper)
1. Air—Pollution—Health aspects. 2. Air—Pollution—Health aspects—UnitedStates. I. Nakaya, Andrea C., 1976– . II. At issue (San Diego, Calif.)RA576.I686 2005616.2—dc22 200440532
Printed in the United States of America
LIBRARY OF CONGRESS CATALOGING-IN-PUBLICATION DATA
AI Air Pollution INT 8/17/04 9:19 AM Page 4

ContentsPage
Introduction 7
1. Air Pollution and Health: An Overview 11Pamela Myer et al.
2. Poor Air Quality Threatens Human Health 20Arthur L. Williams
3. Air Quality Has Improved 25U.S. Environmental Protection Agency
4. The Threat Posed by Pollution Has Been Exaggerated 33Joel Schwartz
5. Global Warming Caused by Air Pollution Will Harm 43Human Health
Jonathan A. Patz and R. Sari Kovats
6. Global Warming Caused by Air Pollution Will Not 49Harm Human Health
Thomas Gale Moore
7. Indoor Air Pollution Is a Major Risk to Public Health 56John Manuel
8. Air Pollution Is a Serious Health Risk in Asia 66Charles W. Petit
9. Pollution Regulation Reforms Will Worsen Air Quality 70John Edwards
10. Pollution Regulation Reforms Will Improve Air Quality 75Christopher Bond
11. A Global Approach to Pollution Regulation Is Necessary 78Christopher G. Reuther
Organizations to Contact 85
Bibliography 89
Index 92
AI Air Pollution INT 8/17/04 9:19 AM Page 5

AI Air Pollution INT 8/17/04 9:19 AM Page 6

7
Introduction
In October 1948 the small industrial town of Donora, Pennsylvania, expe-rienced one of the worst cases of air pollution in the history of the UnitedStates. Sulfur dioxide, carbon dioxide, and metal dust descended fromnearby zinc smelter smokestacks and were trapped by stagnant air. The re-sult was a thick, poisonous cloud that blanketed the town for five days. Atthat time, most people were still unaware of the potentially deadly healtheffects of deadly air pollution; it was viewed mainly as a nuisance. So, al-though the residents of Donora could barely see through the smoggy air,they continued with their daily routines as much as possible, oblivious tothe danger they were in. It was not until the smog lifted, leaving twenty-one people dead and six thousand people—a third of the town’s popula-tion—sick or hospitalized, that many began to realize that air pollutionwas more than a nuisance.
The Donora catastrophe and similar incidents elsewhere during themid–twentieth century changed the way many people thought about airpollution. As they began to see overwhelming evidence of the connectionbetween air pollution and illness, Americans began to realize that poor airquality threatened their health and that, for their protection, emissionsneeded to be monitored and controlled. The result has been a successionof regulations designed to monitor and control air quality in the UnitedStates. Unfortunately, these regulations have been at the center of aheated debate between those concerned about human health and the en-vironment and those in American industry.
In 1970 Congress passed the landmark Clean Air Act, which hasformed the basis of the nation’s efforts to control air pollution. The actgives the Environmental Protection Agency (EPA) the authority to estab-lish and enforce National Ambient Air Quality Standards (NAAQS). TheEPA monitors emissions of the six major air pollutants—ozone, particu-late matter (such as dust, dirt, smoke, and soot), carbon monoxide, ni-trogen oxides, sulfur, and lead. The Clean Air Act also charges the EPAwith periodically reviewing the latest scientific studies regarding air pol-lution and reaffirming or modifying the standards as necessary to protectthe public’s health. The act was amended with more stringent emissionsstandards in 1977, 1990, and 1997.
As a result of the Clean Air Act, air quality has improved greatly in theUnited States since the 1970s. According to the EPA’s 2003 air quality report,aggregate emissions of the six major pollutants have decreased 48 percentsince 1970. This improvement has occurred despite a 42 percent increase inenergy consumption and a 155 percent increase in vehicle miles traveled.Yet, according to the American Lung Association, in 2003 more than halfthe American population continued to breathe polluted air that was harm-ful to their health. In 2002 Bernie Fischlowitz-Roberts of the Earth Policy In-stitute found that the death toll from air pollution is high. He states:
AI Air Pollution INT 8/17/04 9:19 AM Page 7

8 At Issue
In the United States, traffic fatalities total just over 40,000per year, while air pollution claims 70,000 lives annually.U.S. air pollution deaths are equal to deaths from breastcancer and prostate cancer combined. This scourge of citiesin industrial and developing countries alike threatens thehealth of billions of people. . . . While deaths from heart dis-ease and respiratory illness from breathing polluted air maylack the drama of deaths from an automobile crash, withflashing lights and sirens, they are no less real.
There is sound evidence from hundreds of studies conducted world-wide that polluted air has adverse effects on health. Its effects range frommild respiratory irritation to lung cancer and cardiovascular disease. Indeveloping nations, where air quality is frequently poor, the link betweenair pollution and health is often obvious. In China, the air quality inmany cities is so bad that simply breathing is the same as smoking a packof cigarettes a day, and respiratory diseases from air pollution are a lead-ing cause of death. When asked to draw the sky, many Chinese childrenchoose a gray or yellow crayon.
However, in the United States, where the sky is usually blue, and airquality has improved dramatically in recent years, the connection be-tween air pollution and health is less clear. There is widespread debateover whether air quality is currently threatening the health of Americans.Some researchers are finding evidence of serious health problems from in-creasingly small pollution particles. In an August 2003 issue of ScienceNews, Janet Raloff reviews the results of a number of air pollution studies,finding that “community death rates rise and fall nearly in lock-step withlocal changes of tiny dust particles—even when concentrations of thoseparticles are just one-quarter of the federal limit for outdoor air.” How-ever, other researchers argue that there is no scientific evidence for suchclaims, and contend that air pollution is not a problem in the UnitedStates. Gregg Easterbrook, of the Brookings Institution, an organizationdevoted to research and analysis of public policy, states that the qualityof U.S. air is so good that it should be “a national cause for celebration.”
Disagreements about whether or not air pollution is currently threat-ening Americans’ health fuels the debate over how air quality should beregulated. Emissions reductions can be extremely expensive for industryand, ultimately, the consumer. Regulatory agencies face the difficult taskof weighing the potential health benefits of regulation against the coststo industry and finding the most desirable balance between the two.
Many people are critical of current regulations, claiming that thecosts of the EPA’s anti-pollution measures far outweigh the benefits. Theyargue that the huge expenses of implementing increasingly stringentstandards impede technological innovation and hinder industry produc-tivity, seriously harming the U.S. economy while only slightly benefitingthe health of the American population. According to associate professorof economics Craig S. Marksen, in the Summer 2000 issue of the Indepen-dent Review,
The Clean Air Act and its amendments force the EPA to man-date reduction of air pollution to levels that would have noadverse health effects on even the most sensitive person in
AI Air Pollution INT 8/17/04 9:19 AM Page 8

the population. The EPA relentlessly presses forward on itsabsurd quest, like a madman setting fire to his house in aninsane determination to eliminate the last of the insects in-festing it.
Critics of regulation charge that the EPA has squandered billions of dol-lars, with negligible results, and that the U.S. population would have ex-perienced far greater benefits if this money were spent elsewhere.
Others contend that current regulation is not stringent enough. Theymaintain that human health is more important than industry profits andneeds to be better protected. In a September 2003 statement, John Kirk-wood, president and chief executive of the American Lung Association,states:
Reams of scientific studies have shown conclusively that airpollution causes increased asthma attacks, emergency roomvisits, hospital admissions, and increased risk of death. Astudy conducted three years ago estimated that tens ofthousands of Americans are dying prematurely each yearbecause of our failure to clean up [industrial] facilities.Emerging research is linking pollution to lung cancer, birthdefects, strokes and heart attacks. What is lacking is thecommitment of the [Bush] administration to clean air andthe health of Americans.
Proponents of stronger regulation argue that the development of new,cleaner technologies is usually less expensive than the prohibitive costsoften claimed by industry.
In 2003 the debate over clean air regulation continued as the admin-istration under President George W. Bush advocated controversial re-forms to air pollution regulation. One significant change was to the NewSource Review (NSR) provisions of the Clean Air Act. Under NSR, powerplants built before 1977 must install modern pollution-control equip-ment when they expand or upgrade their facilities beyond routine main-tenance. However, under a 2003 reform to the rules, some plants will beable to make modifications to their facilities without being subject to newemissions standards. The less-stringent rules also mean that the EPA willbe forced to drop a number of current investigations of power plant vio-lations of the Clean Air Act. The changes to NSR provoked heated debatefrom many different groups. Proponents of the reforms argue that it ispossible to reduce emissions without hurting business, and that theseamendments will allow industry the flexibility it needs to reduce pollu-tion and contribute to a strong economy. Critics argue that the Bushadministration favors industry over the environment, and that the mod-ifications constitute a weakening of pollution regulation and will signifi-cantly increase air pollution.
Arguments such as these have been voiced since the beginning ofemissions monitoring and regulation in the United States. Today there isstill no uncontested strategy to clean the air to the satisfaction of healthexperts and environmentalists while easing the regulatory burden suffi-ciently in the eyes of industry. In the ongoing effort to balance the costsand benefits of regulation, there is continued disagreement over how to
Introduction 9
AI Air Pollution INT 8/17/04 9:19 AM Page 9

10 At Issue
measure the value of human health and the value of economic growth,and how to create a regulatory balance that effectively protects themboth. The authors in At Issue: Is Air Pollution a Serious Threat to Health? pre-sent various opinions on the effect of air pollution on health in theUnited States and around the world and debate ways to address pollutionproblems.
AI Air Pollution INT 8/17/04 9:19 AM Page 10

11Air Pollution and Health:
An OverviewPamela Myer, David Mannino, David Homa,
Luke Naeher, and Stephen Redd
Pamela Myer, David Mannino, David Homa, Luke Naeher, and StephenRedd are epidemiologists with the National Center for EnvironmentalHealth at the Centers for Disease Control and Prevention in Atlanta,Georgia.
Pollution can be harmful to human health. Since the mid–nineteenth century, numerous organizations have been created tomonitor and control outdoor air pollution—which is caused pri-marily by the burning of fossil fuels—in the United States andaround the world. A succession of air quality regulations have alsobeen enacted to protect human health. In addition to outdooremissions from motor vehicles, power plants, and industry, poten-tially hazardous air pollutants exist indoors. They can often be de-tected through testing, and in most cases can be eliminated frombuildings. While air quality in the United States has improved sig-nificantly since the 1950s, pollution still exists, and continualmonitoring and pollution reduction efforts are essential.
Whether at work or play, indoors or out, we are all exposed to pollu-tants in the air we breathe. More work lies ahead to ensure clean air
for all.In the course of a day, we breathe 5,000 to 15,000 liters of air. With
each breath, we inhale life-sustaining oxygen, which is absorbed in ourlungs and carried throughout our body. Air also contains pollutants, in-cluding pollen, microbes, particles such as soot and dust, and gases suchas carbon monoxide—substances that can harm the human body. Con-tact with these harmful substances, which are filtered through the lungsand can also irritate the eyes and skin, triggers several defense mecha-nisms such as coughing, sneezing, and the production of secretions.When these defense mechanisms are overwhelmed, human tissue is dam-aged or destroyed. Chronic or severe exposure may hasten the onset and
Pamela Myer, David Mannino, David Homa, Luke Naeher, and Stephen Redd, “Every Breath WeTake,” Forum for Applied Research and Public Policy, vol. 14, Winter 1999, p. 43. Copyright © 1999by University of Tennessee, EERC. Reproduced by permission.
11
AI Air Pollution INT 8/17/04 9:19 AM Page 11

progression of disease and even result in death.Although air pollution has plagued crowded cities for centuries, sev-
eral episodes in the United States and Europe since 1930 have driven homethe harmful effects of air pollution. The worst air pollution episode in theUnited States occurred in Donora, Pennsylvania, on October 26, 1948,when sulfur dioxide, carbon monoxide, and metal dust emitted by localzinc smelter smokestacks was trapped by stagnant air and formed poiso-nous compounds over the industrial town. During the next five days, 43percent of the 14,000 people in the community became sick. Ten percentof them were severely affected, and 19 people died. Statistically, only twodeaths would have likely occurred in that small a population at the time.
Ozone is a powerful respiratory irritant that caninterfere with the lungs’ immunity, constrict airways,and increase respiratory symptoms in healthy adultsand susceptible people.
Perhaps the most severe episode of ambient air pollution in the worldoccurred in London, England, in December 1952, when stagnant airtrapped thick fog and air pollution for several days. More than 4,000 ex-cess deaths were recorded. These acute episodes motivated the UnitedStates and other countries to implement ambient air-quality standardsand strategies to reduce emissions that contribute to air pollution.
Since the implementation of these standards, air pollution levels havedecreased in many parts of the world, but current ambient concentrationsstill cause adverse health effects. In particular, air pollution exacerbateschronic heart and lung disease and causes death. Although the most com-mon cause of heart and lung illness and death in the United States is to-bacco smoke, there is substantial evidence of the harmful effects of air pol-lution. One way to reduce our risk of illness from air pollution is to learnabout the common air pollutants so we can control our exposure to them.
Outdoor air pollutionOutdoor air pollution is produced primarily by the burning of fossil fuelsby motor vehicles, power plants, and industries. Concern about reducedvisibility and evidence of adverse health effects led Congress to enact sev-eral laws concerning air quality. Beginning in 1955, air pollution researchwas authorized by the Air Pollution Control Act. Later, the 1963 Clean AirAct authorized the federal government to legislate and enforce air pollu-tion controls. Paving the way for national air quality standards was theMotor Vehicle Air Pollution Act of 1965, which defined a process for im-plementing national emissions standards for new motor vehicles. But the1970 Clean Air Act established the public health basis of the nation’s ef-fort to control air pollution.
Subsequently, Congress established the U.S. Environmental ProtectionAgency (EPA), and charged it with setting National Ambient Air QualityStandards (NAAQS) to protect the public’s health, including the health ofsensitive groups within the population. EPA’s role is to identify air pollu-
12 At Issue
AI Air Pollution INT 8/17/04 9:19 AM Page 12

tants that are likely to endanger public health. Accordingly, EPA identifiedsix air pollutants—known as the criteria pollutants—which pose the great-est threat to our health: ozone, sulfur dioxide, particulate matter, nitrogendioxide, carbon monoxide, and lead. The Clean Air Act of 1990 alsocharges EPA with periodically reviewing and, if appropriate, revising theNAAQS to keep standards in line with current scientific knowledge.
After the United States phased out tetraethyl lead—a highly toxic ad-ditive that took the knock out of automotive engines—from gasoline inthe mid-1970s to 1980, airborne lead levels decreased, and more impor-tantly, blood lead levels among children in the nation also decreased.From 1988 through 1997, ambient lead concentrations decreased 67 per-cent. While lead from paint in older homes continues to pose a healththreat, especially to young children, lead is no longer considered a majorsource of outdoor air pollution in this country.
Ozone. Ozone occurs naturally in the stratosphere, seven to 31 milesabove the Earth, and protects human health by blocking the sun’s harm-ful ultraviolet rays. In contrast, ground-level ozone is produced by chem-ical reactions with nitrogen dioxide and volatile organic compounds suchas benzene and toluene in the atmosphere, and it is the main componentof smog. Because the formation of ground level ozone is stimulated bysunlight and heat, ozone levels peak in late spring and summer and dur-ing the afternoon—when people spend more time outdoors.
Air pollution, once viewed as a local problem,especially in urban areas, has become a regionalissue.
Ozone is a powerful respiratory irritant that can interfere with thelungs’ immunity, constrict airways, and increase respiratory symptoms inhealthy adults and susceptible people. Most vulnerable are the very young,whose lungs are immature; the elderly, whose lungs are less effective at fil-tering irritants; those with lung disease such as asthma and emphysema,and those with heart disease. While the adverse effects of short-term ex-posure to ozone are well documented, researchers are conducting studiesof the long-term effects of repeated, intermittent exposures to ozone.
Particulate matter. Particulate matter includes naturally occurring dustand pollen as well as soot and aerosols from combustion activities such asagricultural burning, transportation, manufacturing, and power genera-tion. The most harmful particles are not the large particles, which aremostly removed in the upper airways, but the small particles that may bedeposited deep in the lungs. Before 1987, the standard for measuring par-ticulate matter was based on total suspended particulate matter, no mat-ter the size. In 1987, EPA changed its standard to measure only the per-centage of particles with an aerodynamic diameter of 10 microns or less.However, recent research has shown that fine particulate matter—whichincludes particles with an aerodynamic diameter smaller than 2.5 micro-meters—is inhaled deeper into lung tissue, and is therefore more harmful.In 1997, EPA issued new standards to address these smaller particles,which several epidemiological studies have linked with decreased lung
Air Pollution and Health: An Overview 13
AI Air Pollution INT 8/17/04 9:19 AM Page 13

function, increased respiratory symptoms, increased school absenteeism,increased respiratory hospital admissions, and increased mortality, espe-cially from respiratory and cardiovascular failure.
In contrast to controlled laboratory studies, epidemiological studiesmeasure human health effects of exposure to ambient air pollution. Am-bient air typically contains several pollutants, and epidemiological stud-ies allow researchers to evaluate the effects of individual and combinedpollutants. Since epidemiological studies are observational, it is possibleto study the health effects among vulnerable populations.
Indoor air pollutants probably have a greater impacton our health than outdoor air pollutants becausepeople in the United States tend to spend more timeindoors than outdoors.
Sulfur dioxide. The burning of sulfur, a natural contaminant of all fos-sil fuels, results in the formation of sulfur oxides. Sulfur dioxide is pro-duced primarily by industrial and electrical power-generating processes in-volving fossil fuel combustion. Sulfur dioxide combines with atmosphericwater, oxygen, and oxidants to create weak acids that fall to the Earth asdry particles, snow, fog, or rain, which is commonly referred to as acidrain. When these acidic substances fall to the Earth, they can harm vege-tation and acidify lakes and streams. Sulfur dioxide can also constrict airpassages, making breathing difficult for those with asthma, and may alsoalter the immune system and aggravate existing cardiovascular disease.
Nitrogen dioxide. Nitrogen dioxide is a product of high-temperaturecombustion and contributes to the formation of ozone. Motor vehicleemissions are the primary source of nitrogen dioxide in outdoor air, butpower plants and fossil-fuel-burning industries also contribute. Nitrogendioxide can irritate the lung and alter its defense mechanisms, therebyincreasing a person’s risk for respiratory infections.
Carbon monoxide. Carbon monoxide is produced during the incom-plete combustion of carbon-containing materials, including gasoline, nat-ural gas, oil, coal, wood, and tobacco. The principal source of carbonmonoxide in outdoor air is motor vehicle emissions. Outdoor concentra-tions of carbon monoxide vary depending on how and where and whenthe gas is produced. For example, in urban areas, carbon monoxide levelsare greatest in downtown areas where motor vehicle density is high, dur-ing peak commuting times, and in the passenger compartments of motorvehicles. Carbon monoxide interferes with the ability of the blood tocarry oxygen to tissues; the most sensitive of these tissues are in the heartand brain. The health effects of carbon monoxide poisoning range fromimpaired mental alertness and performance, headaches, nausea, fatigue,and dizziness to coma and death.
Controlling outdoor air pollutionStrategies to reduce outdoor air pollution include implementing automo-bile emission standards, improving technology to reduce smokestack
14 At Issue
AI Air Pollution INT 8/17/04 9:19 AM Page 14

emissions of particulate matter, and requiring more-stringent standardsfor sulfur content in fossil fuels. Levels of the six criteria pollutants all de-creased from 1988 to 1995. The greatest decrease was for lead, at 67 per-cent, and the least was for nitrogen dioxide, at 14 percent.
Air pollution, once viewed as a local problem, especially in urban ar-eas, has become a regional issue. Sulfur dioxide, particulate matter, andthe precursors of ground-level ozone can travel long distances. Industriescontributed to the problem when they switched from short smokestacksto tall smokestacks, which released pollutants at higher levels in the at-mosphere where they could be transported longer distances and crossgeopolitical boundaries.
Several regional organizations have been created to address regionalair pollution issues in the United States. These organizations vary in thecomposition of their members, but many include representatives fromfederal, state, and local agencies; environmental groups; industry; acade-mic institutions; and private citizens.
The 1990 Clean Air Act Amendments, for example, established theOzone Transport Commission and the Northeast Ozone Transport Regionto address long-standing ozone problems in the northeastern UnitedStates. Commission representatives include governors and air pollution-control officials from each of the 12 members’ states—Maine, New Hamp-shire, Vermont, Massachusetts, Rhode Island, Connecticut, New York,Pennsylvania, New Jersey, Delaware, Maryland, and Virginia—and theDistrict of Columbia. Administrators from three northeastern EPA Re-gions also participate. To reduce regional air pollution, the members haveagreed to introduce a low-emission vehicle program and to reduce emis-sions of nitrogen oxides.
Each year hundreds of people die from carbonmonoxide poisoning in homes, automobiles, andother enclosed spaces with improper ventilation.
Aside from mandated organizations, there are also voluntary organi-zations whose mission is to find regional solutions to regional problems.For example, the Southern Appalachian Mountains Initiative, which isled by eight southern states in the Appalachian region, works with EPA,industries, federal agencies, academic institutions, environmental groups,and private citizens to seek solutions to the region’s specific challenges.Because of the geography and meteorological conditions of the area, airpollution tends to stagnate over the area, which includes 10 of the na-tion’s national parks and wilderness areas.
A larger regional group that works to address long-range transport ofair pollution is the Ozone Transport Assessment Group (OTAG), whichwas formed to identify and recommend cost-effective control strategiesfor volatile organic compounds and nitrogen oxides to facilitate compli-ance with NAAQS for ozone. OTAG is a partnership between EPA and theEnvironmental Council of States and includes representatives from 37states east of the Rocky Mountains, industry, and environmental groups.
In addition to regional groups within the United States, there are in-
Air Pollution and Health: An Overview 15
AI Air Pollution INT 8/17/04 9:19 AM Page 15

ternational agreements with Mexico and Canada to control air pollution.Created in 1994 under the North American Free Trade Agreement(NAFTA), the Commission for Environmental Cooperation addresses airpollution control in the three countries to ensure that pollution createdin one country does not affect the health of citizens in another.
The creation of these regional and international cooperative groups isevidence of increased attention being paid to the necessity of addressingair quality issues across arbitrary boundaries. In addition, there is a grow-ing consensus that a strict regulatory approach alone is inadequate to ad-dress these problems.
Indoor air pollutionWhile we’ve spent decades working to clean up the air we breathe out-side, only recently have indoor sources of air pollution received much at-tention. Since the oil crisis of the 1970s, office and home construction ofnew buildings and retrofitting of old buildings have created airtight struc-tures. In addition, new materials such as particle board and carpet cancontain high levels of chemicals that are trapped inside and are emittedinto the air long after installation.
In recent years, EPA and its Science Advisory Board ranked indoor airpollution among the top five environmental risks to public health. In-door air pollutants probably have a greater impact on our health thanoutdoor pollutants because people in the United States tend to spendmore time indoors than outdoors.
Tobacco smoke and emissions from unvented combustion appli-ances, woodstoves, and fireplaces are the principal indoor air pollutants;other potential pollutants include biologic agents such as bacteria andviruses, naturally occurring carcinogenic radon, dusts, and volatile or-ganic compounds found in office and home furnishings.
Outdoor air pollutants may also enter a building through open win-dows or ventilation systems and contribute to the concentration of indoorair pollutants; the degree of infiltration depends on the characteristics of abuilding’s construction and the efficiency of its heating, ventilation, andair conditioning system.
Moreover, while workers in factory and construction jobs are protectedthrough the Occupational Safety and Health Administration from occupa-tional hazards such as exposure to toxic emissions, no single federal agencyhas statutory jurisdiction over indoor air quality. The responsibility for in-door air quality research, policy, and monitoring is shared by several fed-eral agencies. The EPA established a research program to address radon andother indoor pollutants; the Department of Housing and Urban Develop-ment sets standards for agency-funded projects and for mobile homes; theConsumer Product Safety Commission regulates injurious products thatpollute indoor air, such as asbestos; and the Department of Energy has sup-ported the development of more-efficient and less-polluting energy tech-nologies, and it monitors the health effects of energy conservation.
Federal efforts to reduce indoor air pollution include developing vol-untary industry codes, establishing product safety standards, publishingguidelines for dealing with radon, and offering guidance for handling as-bestos in schools. Therefore, it is important for building supervisors in
16 At Issue
AI Air Pollution INT 8/17/04 9:19 AM Page 16

schools and office buildings, and individual homeowners, to educatethemselves on the possible sources of indoor air pollution and to work to-ward reducing exposure to occupants.
Of the many possible sources of indoor air pollution, six pollutantsare of particular concern in terms of public health.
Combustion by-products. Incomplete combustion of wood and fossil fu-els such as coal, oil, and gas produces nitrogen oxides, carbon oxides, andparticulate matter. The concentrations of combustion products in ourhomes depend on the efficiency of combustion and ventilation and on themaintenance and function of heat-generating equipment. Gas stoves,which produce nitrogen dioxide and carbon monoxide, are used by half ofthe U.S. population. The use of gas stoves for cooking in homes has beenlinked to an increased risk for lower respiratory illness among children.Gas or kerosene space heaters emit carbon monoxide, nitrogen dioxide,and particles, and these fuels contain high levels of sulfur. In addition,each year hundreds of people die from carbon monoxide poisoning inhomes, automobiles, and other enclosed spaces with improper ventilation.
Tobacco smoke. Tobacco smoke contains more than 4,500 compounds,50 of which are known or suspected carcinogens, and six of which are de-velopmental or reproductive toxicants. The undeniable health effects ofprimary cigarette smoking include premature mortality, lung cancer, andobstructive lung diseases such as emphysema. Secondhand tobaccosmoke, or environmental tobacco smoke, has been associated with lowbirth weight, sudden infant death syndrome, and acute lower respiratorytract infections among children. Secondhand smoke can also aggravateasthma, and it is associated with acute and chronic heart disease as well asmortality from heart disease.
Because of the considerable number of people stillexposed to air pollution, we need continuedevaluation of the safety of current standards.
Volatile organic compounds. Volatile organic compounds—gases thatoccur at normal temperatures from a wide variety of human made prod-ucts—are emitted by modern furnishings, construction materials, and con-sumer products. One of the most common of these compounds isformaldehyde, which is used in many products commonly found inhomes, such as cosmetics, toiletries, and the resins used in laminatedwood products and particle board. Harmful vapors can be emitted for longperiods after these materials are installed. For example, urea formaldehydefoam insulation, which became popular in the mid-1970s, emits a burst offormaldehyde immediately after application and then continuously emitslower levels. When improperly installed, formaldehyde can be released athigh concentrations indoors. Formaldehyde irritates the respiratory tractand at high concentrations is toxic.
Asbestos. From the beginning of the century until the early 1970s whenEPA banned its use in certain applications, asbestos was commonly used inbuilding construction for thermal and acoustic insulation and fire protec-tion. Asbestos causes lung diseases, especially a chronic irritation and in-
Air Pollution and Health: An Overview 17
AI Air Pollution INT 8/17/04 9:19 AM Page 17

flammation of the lung, asbestosis, but also lung cancer and mesothe-lioma—a malignant tumor of the lining of the lung—among people ex-posed to asbestos in the workplace. Whether people in nonoccupational set-tings are at risk for lung cancer has not yet been resolved with certainty.Although asbestos use has declined in the United States, asbestos-containingmaterials are still present in many homes, schools, and offices.
Children . . . spend more time than adults engagedin vigorous activities, and therefore have a higherrelative intake of pollutants into their lungs.
Radon. Radon is a radioactive gas created during the decay of radium,which itself is a decay product of naturally occurring uranium. Naturalradon gas in the soil is the main source of radon in buildings and can pen-etrate through the foundation into the air in homes. EPA estimates thatas many as 6 million homes throughout the country have elevated levelsof radon. Elevated radon concentrations can cause lung cancer.
Biologic contaminants. Biologic contaminants, which are present tosome extent in all buildings, can become airborne and enter our respira-tory systems, causing infections and disease. They can also trigger allergicreactions and asthma attacks. Such contaminants include pollens; housedust mites; insect excreta and body parts; animal dander and excreta; andmicrobes such as viruses, bacteria, fungal spores, protozoans, and algae.Biologic contaminants can be found in any environment that providesnutrients and moisture for their growth.
Reducing indoor air pollutionThe sources of indoor air pollutants are diverse and require different con-trol measures. Control of environmental tobacco smoke, one of the mostcommon and harmful indoor pollutants, can be accomplished by limitingareas where people can smoke. Employer and government policies havebeen successful in decreasing secondhand smoke in work sites and publicareas, but these policies obviously cannot be enforced in private homes.
The presence of asbestos in a home or building does not necessarilyindicate risk to health. Asbestos becomes harmful when it is damaged ordisturbed and its fibers become airborne. Encapsulating asbestos by ap-plying sealants to surfaces or removing it may reduce the risk of exposure.
Because radon can cause lung cancer, it is important to test for thepresence of radon. Homeowners can purchase low-cost radon test kits orhire a trained contractor to test for radon. If high levels of radon arefound, remediation may be necessary. This generally requires sealing abuilding’s foundation to prevent soil gases from entering, or venting thegas produced underneath the foundation to the outside of the building.
Strategies for the control of indoor biologic contaminants include re-ducing relative humidity; repairing leaks and seepage from roofs and wa-ter pipes; properly maintaining heating, ventilating, and air conditioningequipment; and cleaning buildings regularly and avoiding the use of toxiccleaners.
18 At Issue
AI Air Pollution INT 8/17/04 9:19 AM Page 18

Improving air quality for the futureDespite improvements in air quality, nearly one in five Americans, or 50million people, lived in counties that exceeded the NAAQS for at least onepollutant in 1996. Because of the considerable number of people still ex-posed to air pollution, we need continued evaluation of the safety of cur-rent standards. We also need to incorporate new information into regula-tions to control air pollution, as EPA did in 1997 by recommendingmore-stringent standards for ozone and fine particulate matter, effectivelydoubling to 107 million the number of people living in polluted areas.
We also need support from the health community. A goal for reduc-ing the public’s exposure to harmful air [was] established as part ofHealthy People 2000, a national prevention initiative. For two decades,the U.S. Department of Health and Human Services has used health pro-motion and disease prevention objectives to improve the health of theAmerican people. . . .
Strides in improving air quality must continue, particularly to protectpeople most susceptible to the adverse effects of both indoor and outdoorair pollutants, such as children; the elderly; tobacco smokers; and peoplewith pre-existing cardiopulmonary diseases, including asthma, allergicrhinitis, cystic fibrosis, and acquired immunodeficiency syndrome (AIDS).
Children, the largest susceptible group, spend more time than adultsengaged in vigorous activities, and therefore have a higher relative intakeof pollutants into their lungs. Children also spend more time outdoorsthan adults, particularly in the summer when ozone levels are highest.
Air pollution, whether indoors or outdoors, adversely affects humanhealth. The effective control of air pollution will involve multiple ap-proaches. Government can develop and enforce regulations to reduce am-bient pollutants and environmental tobacco smoke, employers can en-courage employees to carpool or use public transportation, and individualscan learn about air pollutants and make personal lifestyle changes to reducetheir exposures. After all, improving air quality is everyone’s responsibility.
Air Pollution and Health: An Overview 19
AI Air Pollution INT 8/17/04 9:19 AM Page 19

22Poor Air Quality
Threatens Human HealthArthur L. Williams
Arthur L. Williams is the director of the Air Pollution Control Districtof Jefferson County, Kentucky.
Since the implementation of the 1990 amendments to the CleanAir Act, there has been a significant reduction of air pollution inthe United States; however, despite this reduction, poor air qual-ity continues to be a serious public health hazard. Fine particulatematter poses the greatest health risk, causing respiratory and car-diovascular damage. In many U.S. counties, fine particulate levelscontinue to exceed health standards. Levels of ozone, anotherharmful air pollutant, also exceed health standards in many areas.Power plants and nonroad diesel engines are two of the biggestcauses of particulate and ozone pollution, and until their emis-sions are reduced, air pollution will continue to be a seriousthreat. With hazardous air pollutants currently threatening thehealth of millions of Americans, further regulation and enforce-ment is vitally important for the protection of the population.
Editor’s Note: The following viewpoint was excerpted from the testimony ofArthur L. Williams, director of the Air Pollution Control District of JeffersonCounty, Kentucky, before the House Energy and Commerce Committee, Subcom-mittee on Energy and Air Quality, June 5, 2002.
Notwithstanding [the] impressive progress associated with implemen-tation of the [1990] Clean Air Act—progress that federal, state and lo-
cal governments have achieved together —our nation continues to faceair quality and public health challenges of substantial proportions. . . .
Perhaps the most complex air quality problem we face is achievementand maintenance of the health-based NAAQS [National Ambient AirQuality Standards] for particulate matter and ozone.
Arthur L. Williams, testimony before the House Energy and Commerce Committee, Subcommitteeon Energy and Air Quality, Washington, DC, June 5, 2002.
20
AI Air Pollution INT 8/17/04 9:19 AM Page 20

Fine particulate matter and ozoneIn 1997, EPA [Environmental Protection Agency] established a new stan-dard for fine particulate matter (PM2.5). Although [in 2002] we are stillworking to complete the data-gathering efforts necessary to determinewhich areas of the country violate the PM2.5 standard, one thing is veryclear: PM2.5 poses the greatest health risk of any air pollutant, resulting inas many as 30,000 premature deaths each year. Additionally, fine parti-cles are responsible for a variety of adverse health impacts, including ag-gravation of existing respiratory and cardiovascular disease, damage tolung tissue, impaired breathing and respiratory symptoms, irregular heartbeat, heart attacks and lung cancer.
Fine particles are not only emitted into the atmosphere directly fromcombustion processes, they are also formed secondarily in the atmos-phere from such precursor emissions as oxides of nitrogen (NOx), SO2 andammonia; in addition to their adverse health consequences, fine particlesalso contribute to regional haze. Based on preliminary air quality moni-toring data, it appears that PM2.5 concentrations in 250 counties in theU.S.—located primarily in the East and in California—exceed the health-based standard.
Overall, progress in attaining clean air has been slowest with respectto ground-level ozone. In the southern and north central regions of theU.S., ozone levels have actually increased in the past 10 years, and in 29national parks, ozone levels have risen by more than 4 percent. A signif-icant factor in this trend is the increase we have experienced in NOx emis-sions, which are not only a precursor to ozone, but also a contributor tosuch public health and welfare threats as acid rain, eutrophication of wa-ter bodies, regional haze and . . . secondary PM2.5. Over the past 30 yearsor so, NOx emission have increased by almost 20 percent, largely due toemissions from nonroad engines and power plants. Current data showthat more than 300 counties measure exceedances of the eight-hourozone standard.
In 1997, EPA revised the health-based standard for ozone by estab-lishing an eight-hour standard, representing greater protection of publichealth. Litigation over both the new PM2.5 standard and the revisedozone standard has delayed their implementation; however, the courtshave now cleared the way for EPA, states and localities to move forward.. . . We urge timely and effective control programs for sources that con-tribute significantly to these air quality problems, including power plantsand nonroad heavy-duty diesels.
Power plantsElectric utilities are one of the most significant sources of harmful airemissions in the U.S., responsible for 64 percent of annual SO2 emissions,which contribute to acid rain and the formation of PM2.5, and 26 percentof NOx emissions.
In addition, electric utilities are responsible for 37 percent of U.S. car-bon dioxide emissions and emit upwards of 67 hazardous air pollutants(HAPs)—including nickel, arsenic and dioxins—in substantial quantities.In fact, power plants are the major emitter of hydrochloric acid, which is
Poor Air Quality Threatens Human Health 21
AI Air Pollution INT 8/17/04 9:19 AM Page 21

the HAP emitted in the greatest quantity in the U.S, and are also respon-sible for more than one-third of anthropogenic memory emissions. Thepersistent and bioaccumulative nature of mercury makes it of particularconcern relative to aquatic ecosystems, where it can contaminate aquaticlife and pose a serious threat to humans who consume the contaminatedspecies. Based on just such a threat, over 40 U.S. states and territories haveissued fish consumption advisories for mercury for some or all water bod-ies in their jurisdictions.
One hundred and twenty one million people live inareas of the country that violate at least one of thesix health-based NAAQS [National Ambient AirQuality Standards].
The magnitude of emissions from power plants, and the serious pub-lic health and welfare implications these emissions have, make control-ling electric utilities a top priority. Fortunately, there are tremendous op-portunities for doing so in a very cost-effective manner. Our nation’selectricity generation infrastructure is aged, comprised of many 30-, 40-and 50-year-old plants that continue to operate without modern pollu-tion control technology. . . .
Diesel enginesNonroad heavy-duty diesel engines (HDDEs), including construction(e.g., bulldozers and excavators), industrial (e.g., portable generators, air-port service equipment and forklifts) and agricultural (e.g., tractors, com-bines and irrigation pumps) equipment . . . are huge contributors to ele-vated levels of ozone and PM2.5—representing a substantial and growingshare of the emissions inventories for both NOx and PM—thus posing asubstantial threat to public health, including, among other things, pre-mature mortality from exposure to PM2.5. . . . In fact, the aggregate NOxand PM emissions from nonroad HDDEs exceed those from all of the na-tion’s highway diesel engines. In addition, the Clean Air Scientific Advi-sory Committee has concluded that diesel exhaust is a likely human car-cinogen at environmental levels of exposure, further heightening theneed to take swift and agressive action to control emissions from nonroadHDDEs. Given the limited authority states and localities have to regulateheavy-duty engines and their fuels, rigorous new federal standards fornonroad HDDEs and nonroad diesel fuel—equivalent to those for onroadHDDEs and fuels and in the same timeframes—are imperative. . . .
Unless emissions from nonroad HDDEs are sharply reduced, it is verylikely that many areas of the country will be unable to attain and main-tain national health-based air quality standards for ozone and PM. . . .
Hazardous air pollutantsThe serious and pervasive public health threat posed nationwide by emis-sions of hazardous air pollutants (HAPs) is another continuing concern. . . .
22 At Issue
AI Air Pollution INT 8/17/04 9:19 AM Page 22

Just last week, EPA released the results of its National-Scale Air Toxics As-sessment (NATA), which provides nationwide estimates of exposure andhealth risks associated with 32 HAPs. According to EPA, more than 200million people in the U.S. live in areas where the lifetime cancer risk fromexposure to HAPs exceeds 1 in 100,000. Moreover, approximately 3 mil-lion face a lifetime cancer risk of 1 in 10,000. Considering that EPA has es-tablished 1 in 1,000,000 as the generally acceptable level of risk, these es-timates not only illustrate the pervasive nature of the threat posed byHAPs, they also speak to the level of effort that will be required to reducethe risk and the high level of priority that should be placed on doing so.
According to EPA’s data and information collected by state and localagencies, one of the primary sources of HAPs is motor vehicles, includingcars and trucks. EPA has estimated that approximately 50 percent of allnational HAP emissions, which do not include diesel exhaust, comesfrom mobile sources. The agency has further estimated that for more than100 million people, the combined upper-bound lifetime cancer risk frommobile source air toxics exceeds 1 in 100,000. . . .
We must remember that the most valuable asset ournation can ever have is a healthy population and aclean environment. . . . Protecting these assets mustbe our highest priority.
With respect to industrial sources of toxic air pollution, the Clean AirAct called for EPA to establish technology-based standards for a largenumber of source categories by November 2000. These standards—knownas MACT (Maximum Achievable Control Technology) standards—were torequire new sources to apply state-of-the-art technology and existingsources to achieve reductions equal to those achieved by the top per-forming existing sources. Regrettably, EPA has not fulfilled its obligation;[in 2002] 36 MACT standards covering 62 source categories still have notbeen established. . . . Each day that these sources remain uncontrolled,many millions of people continue to be exposed to hazardous pollutants.EPA must do everything in its power to establish these standards asquickly as possible. . . .
Air pollution is a serious health threatIt is well established that air pollution presents a pervasive national threatto public health and the environment. The health risks are not only sig-nificant, we know of no other environmental problem presenting greaterrisk. Air quality regulators at all levels of government have worked dili-gently for many years in pursuit of our clean air goals. In spite of the con-siderable improvements that we have achieved, clean, healthful air na-tionwide still eludes us.
Over 160 million tons of pollution are still emitted into the air eachyear. One hundred and twenty one million people live in areas of thecountry that violate at least one of the six health-based NAAQS, not tomention the many millions of people who are exposed to toxic air pollu-
Poor Air Quality Threatens Human Health 23
AI Air Pollution INT 8/17/04 9:19 AM Page 23

tants that cause cancer and other health problems. The magnitude of ourair quality problem and the associated health effects make it clear thatfunding for the control of air pollution should be a top priority. Unfor-tunately, the reality is that state and local air agencies are underfunded.Although states and localities devote significant resources to their airquality programs, air agencies have been operating for years with inade-quate financial support from the federal government. As a result, many ofour programs are not as robust as they need to be. . . .
Above all, we must remember that the most valuable asset our nationcan ever have is a healthy population and a clean environment. In work-ing to achieve our clean air goals, protecting these assets must be ourhighest priority.
24 At Issue
AI Air Pollution INT 8/17/04 9:19 AM Page 24

33Air Quality Has Improved
U.S. Environmental Protection Agency
The U.S. Environmental Protection Agency is the federal agency incharge of protecting the environment and controlling pollution.
In accordance with the 1990 Clean Air Act, the U.S. Environmen-tal Protection Agency (EPA) monitors emissions and sets standardsfor air pollutants. EPA data show that from 1983 to 2000, con-centrations of the six principle air pollutants—nitrogen dioxide,ozone, sulfur dioxide, particulate matter, carbon monoxide, andlead—all decreased. Levels of acid rain and other toxic air pollu-tants such as benzene also declined. As a result of the implemen-tation of a number of air pollution prevention programs, air qual-ity in the United States has improved significantly and willcontinue to improve in the future.
Under the Clean Air Act, EPA [Environmental Protection Agency] es-tablishes air quality standards to protect public health, including the
health of “sensitive” populations such as people with asthma, children,and older adults. EPA also sets limits to protect public welfare. This in-cludes protecting ecosystems, including plants and animals, from harm,as well as protecting against decreased visibility and damage to crops, veg-etation, and buildings.
EPA has set national air quality standards for six principal air pollu-tants (also called the criteria pollutants): nitrogen dioxide (NO2), ozone(O3), sulfur dioxide (SO2), particulate matter (PM), carbon monoxide(CO), and lead (Pb). Four of these pollutants (CO, Pb, NO2, and SO2) areemitted directly from a variety of sources. Ozone is not directly emitted,but is formed when NOx and volatile organic compounds (VOCs) react inthe presence of sunlight. PM can be directly emitted, or it can be formedwhen emissions of nitrogen oxides (NOx), sulfur oxides (SOx), ammonia,organic compounds, and other gases react in the atmosphere.
Each year EPA looks at the levels of these pollutants in the air and theamounts of emissions from various sources to see how both have changedover time and to summarize the current status of air quality.
U.S. Environmental Protection Agency, Latest Findings on National Air Quality: 2002 Status andTrends, August 2003.
25
AI Air Pollution INT 8/17/04 9:19 AM Page 25

Reporting trendsEach year, air quality trends are created using measurements from moni-tors located across the country. . . . Air quality based on concentrations ofthe principal pollutants has improved nationally over the past 20 years(1983–2002).
EPA estimates nationwide emissions of ambient air pollutants andthe pollutants they are formed from (their precursors). These estimatesare based on actual monitored readings or engineering calculations of theamounts and types of pollutants emitted by vehicles, factories, and othersources. Emission estimates are based on many factors, including levels ofindustrial activity, technological developments, fuel consumption, vehi-cle miles traveled, and other activities that cause air pollution. . . .
The Clean Air ActThe Clean Air Act provides the principal framework for national, state,tribal, and local efforts to protect air quality. Improvements in air qualityare the result of effective implementation of clean air laws and regula-tions, as well as efficient industrial technologies. Under the Clean Air Act,EPA has a number of responsibilities, including
• Conducting periodic reviews of the NAAQS [National Ambient AirQuality Standards] for the six principal pollutants that are consideredharmful to public health and the environment.
• Ensuring that these air quality standards are met (in cooperationwith the state, tribal, and local governments) through national standardsand strategies to control air pollutant emissions from vehicles, factories,and other sources.
• Reducing emissions of SO2 and NOx that cause acid rain.• Reducing air pollutants such as PM, SOx, and NOx, which can re-
duce visibility across large regional areas, including many of the nation’smost treasured parks and wilderness areas.
• Ensuring that sources of toxic air pollutants that may cause cancerand other adverse human health and environmental effects are well con-trolled and that the risks to public health and the environment are sub-stantially reduced.
• Limiting the use of chemicals that damage the stratospheric ozonelayer in order to prevent increased levels of harmful ultraviolet radiation.
Nitrogen oxidesNitrogen dioxide is a reddish brown, highly reactive gas that is formedin the ambient air through the oxidation of nitric oxide (NO). Nitrogenoxides (NOx), the generic term for a group of highly reactive gases thatcontain nitrogen and oxygen in varying amounts, play a major role inthe formation of ozone, PM, haze, and acid rain. While EPA tracks na-tional emissions of NOx, the national monitoring network measuresambient concentrations of NO2 for comparison to national air qualitystandards. The major sources of man-made NOx emissions are high-temperature combustion processes such as those that occur in automo-biles and power plants. Home heaters and gas stoves can also produce
26 At Issue
AI Air Pollution INT 8/17/04 9:19 AM Page 26

substantial amounts of NO2 in indoor settings. . . .Since 1983, monitored levels of NO2 have decreased 21 percent. These
downward trends in national NO2 levels are reflected in all regions of thecountry. Nationally, average NO2 concentrations are well below theNAAQS and are currently at the lowest levels recorded [since 1983]. All ar-eas of the country that once violated the NAAQS for NO2 now meet thatstandard. [Since 1983] national emissions of NOx have declined by almost15 percent. . . . While overall NOx emissions are declining, emissions fromsome sources such as nonroad engines have actually increased since1983.These increases are of concern given the significant role NOx emis-sions play in the formation of ground-level ozone (smog) as well as otherenvironmental problems like acid rain and nitrogen loadings to water-bodies described above. In response, EPA has proposed regulations thatwill significantly control NOx emissions from nonroad diesel engines. . . .
OzoneOzone is not emitted directly into the air but is formed by the reaction ofVOCs and NOx in the presence of heat and sunlight. Ground-level ozoneforms readily in the atmosphere, usually during hot summer weather.VOCs are emitted from a variety of sources, including motor vehicles,chemical plants, refineries, factories, consumer and commercial products,and other industrial sources. NOx is emitted from motor vehicles, powerplants, and other sources of combustion. Changing weather patterns con-tribute to yearly differences in ozone concentrations from region to re-gion. Ozone and the pollutants that form ozone also can be transportedinto an area from pollution sources found hundreds of miles upwind. . . .
Air quality based on concentrations of the principalpollutants has improved nationally over the past 20years.
In 1997, EPA revised the NAAQS for ozone by setting an 8-hour stan-dard at 0.08 ppm. [In 2003] EPA is tracking trends based on 1-hour and8-hour data. [Since 1983], national ambient ozone levels decreased 22percent based on 1-hour data and 14 percent based on 8-hour data. Be-tween 1983 and 2002, emissions of VOCs (excluding wildfires and pre-scribed burning) decreased 40 percent. During that same time, emissionsof NOx decreased 15 percent. Additional NOx reductions will be necessarybefore more substantial ozone air quality improvements are realized. Forexample, future emission reductions from existing and recently enactedNOx control programs such as the NOx SIP Call,Tier 2, Heavy Duty Diesel,Non-road Proposal, and, potentially, Clear Skies legislation will result inmillions of fewer tons of NOx emissions.
For the period 1983 to 2002, a downward national trend in 1-hourand 8-hour ozone levels occurred in most geographic areas in the coun-try. The Northeast and Pacific Southwest exhibited the most substantialimprovement for l-hour and 8-hour ozone levels. The Mid-Atlantic andNorth Central regions experienced minimal decreases in 8-hour ozone
Air Quality Has Improved 27
AI Air Pollution INT 8/17/04 9:19 AM Page 27

levels. In contrast, the Pacific Northwest region showed a slight increasein the 8-hour ozone over the period 1983 to 2002.
For the 10-year period 1993–2002, the national trend in 8-hour ozoneshows a 4 percent increase and the national trend in 1-hour ozone showsa 2 percent decrease. However, standard statistical tests show that thesetrends are not statistically significant. Ozone concentrations varied overthis 10-year period from year to year but did not change overall. . . .
Although the recent national trends in l-hour and 8-hour ozone arerelatively unchanged, important regional decreases have occurred. EPA iscontinuing to investigate these regional assessments to further evaluatethe trends in 1-hour and 8-hour ozone.
Sulfur dioxideSulfur dioxide belongs to the family of SOx gases. These gases are formedwhen fuel containing sulfur (mainly coal and oil) is burned at powerplants and during metal smelting and other industrial processes. MostSO2 monitoring stations are located in urban areas. The highest moni-tored concentrations of SO2 are recorded near large industrial facilities.Fuel combustion, largely from electricity generation, accounts for most ofthe total SO2 emissions. . . .
Nationally, average SO2 ambient concentrations have decreased 54percent from 1983 to 2002 and 39 percent over the more recent 10-yearperiod 1993 to 2002. SO2 emissions decreased 33 percent from 1983 to2002 and 31 percent from 1993 to 2002. Reductions in SO2 concentra-tions and emissions since 1990 are due, in large part, to controls imple-mented under EPA’s Acid Rain Program which began in 1995. In addi-tion, in 2001 and 2002, energy consumption for electricity generationand industrial power leveled off; therefore, SO2 and NOx emissions fromthis sector did not increase as much as expected.
Particulate matterParticulate matter is the general term used for a mixture of solid particlesand liquid droplets found in the air. Some particles are large enough to beseen as dust or dirt. Others are so small they can be detected only with anelectron microscope. PM2.5 describes the “fine” particles that are less thanor equal to 2.5 µm in diameter. “Coarse fraction” particles are greater than2.5 µm, but less than or equal to 10 µm in diameter. PM10 refers to all par-ticles less than or equal to 10 µm in diameter (about one-seventh the di-ameter of a human hair). PM can be emitted directly or formed in the at-mosphere. “Primary” particles, such as dust from roads or black carbon(soot) from combustion sources, are emitted directly into the atmosphere.
“Secondary” particles are formed in the atmosphere from primarygaseous emissions. Examples include sulfates formed from SO2 emissionsfrom power plants and industrial facilities; nitrates formed from NOx emis-sions from power plants, automobiles, and other combustion sources; andcarbon formed from organic gas emissions from automobiles and industrialfacilities. The chemical composition of particles depends on location, timeof year, and weather. Generally, coarse PM is composed largely of primaryparticles and fine PM contains many more secondary particles. . . .
28 At Issue
AI Air Pollution INT 8/17/04 9:19 AM Page 28

Between 1993 and 2002, average PM10 concentrations decreased 13percent, while direct PM10 emissions decreased 22 percent.
Direct PM2.5 emissions from man-made sources deceased 17 percentnationally between 1993 and 2002. . . .
PM2.5 concentrations vary regionally. Based on the monitoring data,parts of California and many areas in the eastern United States have an-nual average PM2.5 concentrations above the level of the annual PM2.5standard. With few exceptions, the rest of the country generally has an-nual average concentrations below the level of the annual PM2.5 healthstandard. . . .
Carbon monoxideCarbon monoxide is a colorless and odorless gas, formed when carbon infuel is not burned completely. It is a component of motor vehicle exhaust,which contributes about 60 percent of all CO emissions nationwide. Non-road vehicles account for the remaining CO emissions from transportationsources. High concentrations of CO generally occur in areas with heavytraffic congestion. In cities, as much as 95 percent of all CO emissions maycome from automobile exhaust. Other sources of CO emissions include in-dustrial processes, nontransportation fuel combustion, and natural sourcessuch as wildfires. Peak CO concentrations typically occur during the coldermonths of the year when CO automotive emissions are greater and night-time inversion conditions (where air pollutants are trapped near theground beneath a layer of warm air) are more frequent. . . .
Nationally, the 2002 ambient average COconcentration is almost 65 percent lower than thatfor 1983 and is the lowest level recorded during thepast 20 years.
Nationally, the 2002 ambient average CO concentration is almost 65percent lower than that for 1983 and is the lowest level recorded duringthe past 20 years. CO emissions from transportation sources, the majorcontributor to ambient CO concentration, decreased dramatically duringthis period as indicated by EPA’s improved new model of highway vehi-cle emissions. In particular, this report’s higher estimate of CO emissionsin the 1980s and early 1990s reflects an improved understanding of emis-sions from real-world driving. Between 1993 and 2002, ambient CO con-centrations decreased 42 percent. Total CO emissions decreased 21 per-cent (excluding wildfires and prescribed burning) for the same period.This improvement in air quality occurred despite a 23 percent increase invehicle miles traveled during the 10-year period.
LeadIn the past, automotive sources were the major contributor of lead emis-sions to the atmosphere. As a result of EPA’s regulatory efforts to reducethe content of lead in gasoline, however, the contribution of air emissions
Air Quality Has Improved 29
AI Air Pollution INT 8/17/04 9:19 AM Page 29

of lead from the transportation sector, and particularly the automotive sec-tor, has greatly declined over the past two decades. Today, industrialprocesses, primarily metals processing, are the major source of lead emis-sions to the atmosphere. The highest air concentrations of lead are usuallyfound in the vicinity of smelters and battery manufacturers. . . .
Because of the phaseout of leaded gasoline, lead emissions and con-centrations decreased sharply during the 1980s and early 1990s. The 2002average air quality concentration for lead is 94 percent lower than in1983. Emissions of lead decreased 93 percent over the 21-year period1982–2002. These large reductions in long-term lead emissions fromtransportation sources have changed the nature of the ambient lead prob-lem in the United States. Because industrial processes are now responsiblefor all violations of the lead NAAQS, the lead monitoring strategy cur-rently focuses on emissions from these point sources. Today, the only vi-olations of the lead NAAQS occur near large industrial sources such aslead smelters and battery manufacturers. Various enforcement and regu-latory actions are being actively pursued by EPA and the states for clean-ing up these sources.
Acid rainAcidic deposition or “acid rain” occurs when emissions of sulfur dioxideand nitrogen oxides in the atmosphere react with water, oxygen, and ox-idants to form acidic compounds. These compounds fall to the Earth ineither dry form (gas and particles) or wet form (rain, snow, and fog). Someare carried by the wind, sometimes hundreds of miles, across state and na-tional borders. In the United States, about 63 percent of annual SO2 emis-sions and 22 percent of NOx emissions are produced by burning fossil fu-els for electricity generation. . . .
SO2 emissions reductions were significant in the first 6 years of EPA’sAcid Rain Program. In 2002, sources in the Acid Rain Program emitted10.2 million tons, down from 15.7 million tons in 1990. Emissions of SO2in 2002 were 400,000 tons less than in 2001. . . .
NOx emissions from all Acid Rain Program sources have also declinedsince 1990. NOx emissions have decreased steadily from 6 million tons in1997 to 4.5 million tons in 2002. The more than 1,000 sources affectedby the Acid Rain NOx Program emitted 4.1 million tons in 2000, approx-imately 1.5 million tons (25 percent) less than they did in 1990. NOxemissions from these sources in 2001 were 3.6 million tons (over 40 per-cent) below what emissions were projected to have been in 2000 withoutthe Acid Rain Program.
Toxic air pollutantsToxic air pollutants, or air toxics, are those pollutants that cause or maycause cancer or other serious health effects, such as reproductive effects orbirth defects. Air toxics may also cause adverse environmental and eco-logical effects. Examples of toxic air pollutants include benzene, found ingasoline; perchloroethylene, emitted from some dry cleaning facilities;and methylene chloride, used as a solvent by a number of industries. Mostair toxics originate from man-made sources, including mobile sources
30 At Issue
AI Air Pollution INT 8/17/04 9:19 AM Page 30

(e.g., cars, trucks, construction equipment) and stationary sources (e.g.,factories, refineries, power plants), as well as indoor sources (e.g., somebuilding materials and cleaning solvents). Some air toxics are also releasedfrom natural sources such as volcanic eruptions and forest fires. The CleanAir Act identifies 188 air toxics from industrial sources. EPA has identified21 pollutants as mobile source air toxics, including diesel particulate mat-ter and diesel exhaust organic gases. In addition, EPA has listed 33 urbanhazardous air pollutants that pose the greatest threats to public health inurban areas. . . .
EPA and state regulations, as well as voluntaryreductions by industry, have clearly achieved largereductions in overall air toxic emissions.
Based on the data in the NEI [National Emissions Inventory], esti-mates of nationwide air toxics emissions decreased by approximately 24percent between baseline (1990–1993) and 1996. Thirty-three of these airtoxics that pose the greatest threat to public health in urban areas havesimilarly decreased 31 percent. Although changes in how EPA compiledthe national inventory over time may account for some differences, EPAand state regulations, as well as voluntary reductions by industry, haveclearly achieved large reductions in overall air toxic emissions.
Trends for individual air toxics vary from pollutant to pollutant. Ben-zene, which is the most widely monitored toxic air pollutant, is emittedfrom cars, trucks, oil refineries, and chemical processes. The graph belowshows trends for benzene at 95 urban monitoring sites around the coun-try. These urban areas generally have higher levels of benzene than otherareas of the country. Measurements taken at these sites show, on average,a 47 percent drop in benzene levels from 1994 to 2000. During this pe-riod, EPA phased in new (so-called tier 1) car emission standards; requiredmany cities to begin using cleaner burning gasoline; and set standardsthat required significant reductions in benzene and other pollutants emit-ted from oil refineries and chemical processes. EPA estimates that ben-zene emissions from all sources dropped 20 percent nationwide from1990 to 1996. . . .
Programs to reduce air toxicsSince 1990, EPA’s technology-based emission standards for industrial andcombustion sources (e.g., chemical plants, oil refineries, dry cleaners, andmunicipal waste combustors) have proven extremely successful in reduc-ing emissions of air toxics. Once fully implemented, these standards willcut annual emissions of toxic air pollutants by nearly 1.5 million tonsfrom 1990 levels. Of this total reduction, dioxin emissions from munici-pal waste combustors and municipal waste incinerator units will havebeen reduced by approximately 99 percent and mercury emissions by 95percent. Additional reductions are expected by 2005. EPA has also putinto place important controls for motor vehicles and their fuels, includ-ing introduction of reformulated gasoline and low sulfur diesel fuel, and
Air Quality Has Improved 31
AI Air Pollution INT 8/17/04 9:19 AM Page 31

is taking additional steps to reduce air toxics from vehicles. Furthermore,air toxics emissions will further decline as the motor vehicle fleet turnsover, with newer vehicles replacing older higher-emitting vehicles. By theyear 2020, these requirements are expected to reduce emissions of a num-ber of air toxics (benzene, formaldehyde, acetaldehyde, and 1,3-butadiene) from highway motor vehicles by about 75 percent and dieselPM by over 90 percent from 1990 levels. . . .
ImprovementsThe Clean Air Act has resulted in many improvements in the quality ofthe air in the United States. Scientific and international developmentscontinue to have an effect on the air pollution programs that are imple-mented by the U.S. Environmental Protection Agency and state, local,and tribal agencies. New data help identify sources of pollutants and theproperties of these pollutants. Although much progress has been made toclean up our air, work must continue to ensure steady improvements inair quality, especially because our lifestyles create more pollution sources.Many of the strategies for air quality improvement will continue to be de-veloped through coordinated efforts with EPA, state, local, and tribal gov-ernments, as well as industry and other environmental organizations.
32 At Issue
AI Air Pollution INT 8/17/04 9:19 AM Page 32

44The Threat Posed by Pollution Has Been Exaggerated
Joel Schwartz
Joel Schwartz is a senior fellow in the Environment Program at the Rea-son Public Policy Institute, a public-policy think tank that promotes mar-ket competition. He has written numerous articles on the links betweenair pollution and health.
Air pollution has been substantially reduced in the United Statesover the past few decades, yet a majority of Americans falsely be-lieve that air quality has worsened and seriously threatens theirhealth. This belief is due to misleading reports by environmental-ists and regulatory agencies. The American Lung Association, thePublic Interest Research Group, and the Environmental ProtectionAgency have all exaggerated the frequency and geographic extentof harmful ozone levels, and often blur the distinction betweenmodest and severe health risks associated with air pollution. Thedata show that ozone levels have actually declined, despite an in-crease in population and vehicle travel, and will continue to de-cline in the future.
The United States has made dramatic progress in reducing air pollutionover the last few decades, and most American cities now enjoy rela-
tively good air quality. But polls show that most Americans believe airpollution has grown worse or will become worse in the future, and thatmost people face serious risks from air pollution.
This disconnect between perception and reality is, in part, the resultof environmental activists’ exaggerations of air pollution levels and risks,which make air pollution appear to be increasing when in fact it has beendeclining. State and federal regulatory agencies sometimes also resort tosuch tactics, and the media generally report those claims uncritically. Asa result, public fears over air pollution are out of all proportion to the ac-tual risks posed by current air pollution levels, and there is widespread
Joel Schwartz, “Clearing the Air,” Regulation, Summer 2003. Copyright © 2003 by the CatoInstitute. All rights reserved. Reproduced by permission.
33
AI Air Pollution INT 8/17/04 9:19 AM Page 33
but unwarranted pessimism about the nation’s prospects for further airpollution improvements.
If people overestimate their exposure to and risk from air pollution,they will demand stricter, more costly air pollution regulation. We facemany threats to our health and safety, but have limited resources withwhich to address them: by devoting excessive resources to one exagger-ated risk, we are less able to counter other genuinely more serious risks.People can make informed decisions about air pollution control only ifthey have accurate information on the risks they face.
Perception and realityThe Environmental Protection Agency (EPA) monitors ozone and otherair pollutants at hundreds of locations around the United States. EPA hastwo ozone standards: The first, known as the “one-hour standard,” re-quires that daily ozone levels exceed 125 parts per billion (ppb) on nomore than three days in any consecutive three-year period. Ozone levelsare determined based on hourly averages (hence the name of the stan-dard). EPA’s “eight-hour standard,” promulgated in 1997 is more strin-gent. It requires that the average of the fourth-highest daily, eight-houraverage ozone level from each of the most recent three years not exceed85 ppb. The standards are difficult to compare because of their differentforms, but the one-hour standard is roughly equivalent to an eight-hourstandard set at about 95 ppb.
In the early 1980s, half of the nation’s monitoring stations registeredozone in excess of the federal one-hour health standard, and they aver-aged more than 12 such exceedances per year. But as of the end of 2002,only 13 percent of the stations failed the one-hour standard and they av-eraged just four exceedances per year. . . . Even the most polluted areas ofthe country achieved impressive ozone reductions during the last 20years. About 40 percent of monitoring locations currently exceed themore stringent eight-hour standard, but peak eight-hour ozone levels arealso declining in most areas.
Public fears over air pollution are out of allproportion to the actual risks posed by current airpollution levels.
The nation’s success with air quality extends beyond ozone to otherpollutants. For example, between 1981 and 2000, carbon monoxide (CO)declined 61 percent, sulfur dioxide (SO2) 50 percent, and nitrogen oxides(NOx) 14 percent. Only two among hundreds of the nation’s monitoringlocations still exceed the CO and SO2 standards. All areas of the countrymeet the NOx standard. For all three pollutants, pollution levels are wellbelow the EPA standards in almost all cases.
Likewise, airborne particulate matter (PM) has also registered large de-clines. PM2.5 (PM up to 2.5 microns in diameter) dropped 33 percent from1980 to 2000, while the soot emissions rate from diesel trucks is down al-most 85 percent since 1975.
34 At Issue
AI Air Pollution INT 8/17/04 9:19 AM Page 34

This downward trend in pollution levels will continue. On-road pol-lution measurements show per-mile emissions from gasoline vehicles aredropping by about 10 percent per year as the fleet turns over to more re-cent models that start out and stay much cleaner than vehicles built yearsago. Diesel truck emissions are also declining, albeit about half as fast. Al-though motorists are driving more miles each year and populationgrowth means more motorists on the roads, the increases in driving aretiny compared to the large declines in vehicle emission rates and will dolittle to slow progress on auto pollution.
Emissions from industrial sources will also continue to drop. Startingin 2004, EPA regulations require a 60 percent reduction in warm-seasonNOx emissions from coal-fired power plants and industrial boilers—themajor industrial sources of ozone-forming pollution. The federal Clean AirAct requires a 20 percent reduction in PM-forming SO2 from power plantsbetween 2000 and 2010. Those reductions are in addition to substantialdeclines in industrial NOx and SO2 emissions over the last 30 years.
MisperceptionsDespite past success in reducing air pollution and the positive outlook forthe future, polls show most Americans think air pollution is gettingworse. For example:
• A January 2002 Wirthlin Poll found that 66 percent of Americansbelieve air pollution has gotten worse during the past 10 years, up from61 percent two years before, while a poll commissioned by Environmen-tal Defense in 2000 found that 57 percent of Americans believe environ-mental conditions have gotten worse during the last 30 years.
• Americans also believe that environmental quality will decline inthe future. The 2000 Environmental Defense poll found that 67 percentof Americans believe air pollution will continue to get worse. Likewise, aMarch 2001 Gallup Poll found that 57 percent of Americans believe en-vironmental quality is deteriorating. A 1999 Washington Post poll foundthat 51 percent of Americans believe pollution will greatly increase in thefuture, up from 44 percent in 1996. State-based surveys have found simi-lar results. The Public Policy Institute of California recently reported that78 percent of Californians believe the state has made only “some” or“hardly any” progress in solving environmental problems.
• Most Americans also believe air pollution is still a serious threat totheir health. Some 80 percent of New Yorkers rate air pollution as a “veryserious” or “somewhat serious” problem, as do 77 percent of Texans.When asked about the most serious environmental issue facing Califor-nia, a 34 percent plurality chose air pollution, with “growth” coming ina distant second at 13 percent.
According to the old saying, “It’s not the things we didn’t know thathurt us; it’s the things we knew for sure that turned out to be wrong.”When it comes to air pollution, why do most Americans “know” so muchthat is not so? Americans consider environmental groups the most credi-ble sources of information on the environment, yet those activist groupsconsistently provide misleading information on air pollution levels,trends, risks, and prospects. Americans also trust information from regu-latory agencies, yet the agencies often paint a misleadingly pessimistic
The Threat Posed by Pollution Has Been Exaggerated 35
AI Air Pollution INT 8/17/04 9:19 AM Page 35

picture. At the same time, the media often provide extensive coverage ofair pollution reports and press releases from environmentalists and gov-ernment regulators, yet the press reports rarely include critical examina-tion or context on the claims those organizations make.
Inflating air pollution exposureIn its report “State of the Air 2003,” the American Lung Associationclaimed that between 1999 and 2001, Los Angeles County averaged 35days per year with ozone in excess of EPA’s eighth-our ozone benchmarkof 85 ppb. Yet . . . none of L.A. County’s 14 ozone monitors registeredanywhere near that many ozone exceedances. Indeed, the average L.A.County location averaged six exceedances per year—83 percent less thanthe report claims—while the most densely populated areas of the countynever exceeded the EPA benchmark at all.
The American Lung Association derived its inflated value by assign-ing an ozone violation to the entire county on any day in which at leastone location in the county exceeded 85 ppb. For example, if ozone washigh one day in Glendora and the next day in Santa Clarita, 50 milesaway, the report counted two high-ozone days for all 9.5 million peoplein L.A. County. The logical fallacy here is obvious—it is like failing an en-tire class when one student does poorly.
The American Lung Association method exaggerates ozone exposurefor tens of millions of people all across the country. . . . For each county,the dash at the top marks the report’s artificially inflated claim, while theother markers show the actual number of elevated ozone days per year atthe worst, average, and best location in each county, reading from top tobottom. The average location in a county typically has less than half asmany ozone exceedances as the report claims for the entire county.
Americans consider environmental groups the mostcredible sources of information on the environment,yet those activist groups consistently providemisleading information.
The Public Interest Research Group (PIRG) took the American LungAssociation’s techniques to the state level. In its 2002 report “Danger inthe Air,” PIRG claimed that California exceeded the eight-hour ozonebenchmark on 130 days in 2001. Yet almost half of the state’s monitor-ing locations had no exceedances, while the average location had seven.Even the worst location in California had only about half as many ozoneexceedances as PIRG claimed for the whole state. PIRG similarly claimedfictionally large ozone problems for every other state it scrutinized.
Regulatory agencies often take a similar tack in reporting ozone lev-els. For example, EPA recently downgraded California’s San Joaquin Val-ley air district—a multi-county region—from “serious” to “severe” for theone-hour ozone standard. The change gave the region more time to attainthe standard, but also required more stringent air pollution controls. Inits press release on the action, EPA stated, “Air quality data from 1997
36 At Issue
AI Air Pollution INT 8/17/04 9:19 AM Page 36

through 1999 indicates the San Joaquin Valley experienced 80 days of un-healthy levels of ozone air pollution.” Yet Clovis, a suburb of Fresno andthe most polluted location in the valley, had 40 days above the one-hourbenchmark, while nearly half of the valley’s monitoring locations actu-ally complied with the one-hour ozone standard.
One might argue that talking about the number of days smog is ele-vated somewhere in a region is not misleading and paints a fair picture ofthe nature of the regional pollution problem. But the health effects of smogdepend on how often a given person is exposed. Because no one is exposedto smog anywhere near as often as the activists’ reports claim, the public isbeing encouraged to vastly overestimate its risk from air pollution.
Though dozens of newspapers covered one or more of those reports,most did not include any critical analysis of the proponents’ assertions.Only about one in 10 papers flagged concerns regarding the fictionalozone exposure claims.
How widespread is air pollution?In the latest installment of its annual air pollution trends report, EPAclaimed that 133 million Americans breathe air that exceeds one or morefederal air pollution standards—mainly the tough new annual PM2.5 andeight-hour ozone standards. Yet EPA’s claim is a substantial exaggeration.
The agency classifies Clean Air Act compliance status at the countylevel. For example, if any air pollution monitor in a county registers ozonein excess of federal requirements, that county is classified as “non-attainment.” Regional classification often makes sense because pollutioncan be transported many miles from its source. The problem arises becauseEPA also uses county non-attainment status when counting the number ofpeople who breathe polluted air. Because only one location in a countyneed exceed an air standard for the entire county to be classified as non-attainment, many people in a non-attainment county might still breatheclean air. Indeed, this situation is the norm, rather than the exception. . . .
Most counties have at least some areas with clean air based on thefederal standards. For some counties, the vast majority of locations haveclean air based on either standard. The percentage of people breathingclean air is also often greater than the monitoring data suggest. For ex-ample, the San Diego County town of Alpine, which has a population ofabout 13,000, is the only location that violates the eight-hour ozone stan-dard. The county’s other 2.8 million people—99.6 percent of the popula-tion—breathe air that meets both of EPA’s ozone standards.
A detailed geographic analysis would be necessary for a precise esti-mate, but it is likely that EPA has overestimated by about a factor of twothe number of people exposed to ozone in excess of the eight-hour stan-dard. . . . The agency has confused a system for classifying non-attainmentareas based on convenient political boundaries with a measure of actualair pollution exposure. Although EPA’s trends report does highlight de-clines in emissions and pollution levels, it nevertheless greatly exagger-ates the number of Americans exposed to polluted air.
The American Lung Association and PIRG also exaggerate the geo-graphic extent of high air pollution levels through misleading countywide,or even statewide, summaries of air pollution data. Indeed, most areas given
The Threat Posed by Pollution Has Been Exaggerated 37
AI Air Pollution INT 8/17/04 9:19 AM Page 37

an “F” grade for air quality by the American Lung Association actually com-ply with EPA’s one-hour ozone standard, and many comply with the morestringent eight-hour standard.
Bucking the trendsAir pollution, as noted earlier, has been on the decline for decades, andemission trends from vehicles and industrial sources confirm that pollu-tion levels will continue to decline in the future. Yet activists have goneto great lengths to convince the public otherwise. One technique is to ig-nore long-term trends and instead highlight years in which air pollutionlevels rose when compared with the previous year.
For example, in “Danger in the Air,” PIRG reported a 23 percent in-crease in eight-hour ozone exceedances between 2001 and 2002, while arecent National Environment Trust press release proclaimed “new surveyfinds massive smog problem in 2002.” Ozone levels did indeed rise be-tween 2001 and 2002, mainly because mild weather in 2001 made it anunusually low-smog year. In fact, despite a substantial overall decline insmog between 1990 and 2002, there were actually five years during thisperiod in which ozone levels rose compared to the previous year in mostparts of the country. Ozone levels are strongly affected by weather, whichvaries from year to year much more than pollution emissions. As a result,single-year changes in either direction cannot be used to infer long-termtrends in air pollution. The national-average number of eight-hour ozoneexceedances actually declined almost 50 percent between 1999 and 2000because the weather in 1999 was unusually favorable to smog formation.This single-year change is as meaningless for inferring long-term trends asthe rise in ozone between 2001 and 2002 highlighted by PIRG. Neverthe-less, it is worth noting that large single-year decreases in air pollutionhave failed to inspire laudatory reports or press releases from environ-mental groups on the nation’s success in fighting pollution. . . .
Figures show [that] among areas with the worst ozone, most achievedsubstantial pollution reductions during the 1990s, as did many areas withmore modest pollution problems. The American Lung Association, PIRG,and other environmental groups simply omit air pollution trend datafrom their reports. . . . Regardless of annual fluctuations in smog levelscaused by weather, the long-term trend is downward because pollutionemissions from all sources continue to decline.
The future is clearAlthough often unacknowledged by environmentalists, America’s pastsuccess in combating air pollution actually occurred in spite of rapidgrowth in vehicle travel. For example, the substantial pollution reduc-tions achieved since 1980 occurred at the same time that total vehicle-miles increased 75 percent. But can improvements in vehicle pollutioncontrol keep pace with increased vehicle use?
Environmentalists seem to think that pollution from vehicles will in-evitably increase. They cite rising population, increased vehicle travel,and the popularity of sport-utility vehicles (SUVs), and conclude that airpollution will therefore increase in the future. For example, in “Clearing
38 At Issue
AI Air Pollution INT 8/17/04 9:19 AM Page 38

the Air with Transit Spending,” the Sierra Club asserts that past pollutionimprovements are now being “canceled out” by SUVs and suburban de-velopment. Environmentalists appear to be unaware that technologicalprogress is reducing automobile emissions far more rapidly than drivingis increasing.
On-road pollution measurements show that average emissions fromgasoline vehicles are declining by about 10 percent per year, even as SUVsmake up an increasing fraction of cars on the road. Because of techno-logical advances, newer cars continue to start out and stay cleaner as theyage, when compared with previous models. EPA regulations that take ef-fect with the 2004 model year require additional reductions of 70 percentfor hydrocarbons and 80 percent for NOx below current new car stan-dards, along with increased durability requirements. Similar regulationsfor diesel trucks require a 90 percent reduction in NOx and soot emissionsstarting in 2007, in addition to tougher NOx standards already imple-mented this year.
Although EPA’s trends report does highlight declinesin emissions and pollution levels, it . . . greatlyexaggerates the number of American exposed topolluted air.
As far as SUVs are concerned, data from vehicle inspection programsand on-road emission measurements show SUV emissions have been con-verging with those of cars since the late 1990s. EPA’s 2004 standards alsomake no distinction between SUVs and compacts; Chevy Suburbans mustmeet the same low emissions requirements as Geo Metros. Going forward,the growing popularity of SUVs will therefore make no difference for fu-ture air quality.
Based on observed emission trends and the requirements of new reg-ulations, per-mile emissions will decline about 90 percent during the next20 years, as twenty-first century vehicles make up an ever-larger portionof the fleet. Thus, even if Americans drive, say, 50 percent more miles 20years from now (a greater increase than most metro areas project), totalemissions would still decline by 85 percent from current levels.
Despite the evidence of substantial ongoing emission reductionsfrom all major pollution sources, the American Lung Association assertsin its “State of the Air: 2003” report that “much air pollution cleanup hasbeen stalled during the past five years” because of a lack of effort by EPA.
The dose makes the poisonBoth the number of people affected by air pollution and the severity ofthe effects decline with decreasing exposure. Exposure depends not onlyon ambient pollution levels, but also on time spent outdoors and level ofphysical activity.
Epidemiologic studies have found permanent reductions in lung func-tion in people exposed to several dozen days per year or more of ozone inexcess of the one-hour standard. Environmentalists use those studies to
The Threat Posed by Pollution Has Been Exaggerated 39
AI Air Pollution INT 8/17/04 9:19 AM Page 39

claim that ozone remains a threat to lung development and long-termhealth. However . . . even in the most polluted areas, the number of high-ozone days each year is now only a fraction of past levels, suggesting thatpast studies are not applicable to current pollution levels. Indeed . . .hardly any areas of the country have ever had the frequent high ozone lev-els associated with irreversible reductions in lung function.
Short-term exposure to high ozone levels can also harm health. Stud-ies with human volunteers have shown that ozone levels of about 120 ppband above, especially when combined with exercise, can cause both de-creases in objective measures of lung function and increases in subjectivesymptoms such as coughing and pain while breathing deeply. However, atmoderate ozone levels—80 to 100 ppb—people generally do not experi-ence measurable reductions in lung function or subjective respiratorysymptoms. Laboratory studies have only found measurable respiratory ef-fects at those ozone levels when subjects are exercising and exposed formore than two to three hours, even in people with pre-existing respiratorydisease. Even here, many people are unaffected and the effects that do oc-cur are transient and reversible, and do not harm long-term health. . . .
Environmental activists exaggerate the frequency and geographic ex-tent of harmful pollution levels and also blur the distinction in healthrisk between modest and severe pollution problems. That misleads Amer-icans to expect serious and permanent harm from current, relatively lowlevels of air pollution. For example, in “State of the Air,” the AmericanLung Association asserts that 40 percent of Americans are “at risk” fromozone and suffer serious health damage even when ozone barely exceedsthe eight-hour, 85 ppb benchmark just a few times per year, in spite ofhealth research suggesting that this is a vast exaggeration.
Emission trends from vehicles and industrial sourcesconfirm that pollution levels will continue to declinein the future.
PIRG’s “Danger in the Air” declares without qualification that “ourcities, suburbs and even our national parks are shrouded in smog formuch of the summer,” while the American Lung Association decries “thesmog that regularly blankets many urban areas during the summermonths,” implying that most people are frequently exposed to air pollu-tion at levels that could cause permanent harm. In reality, among areasexceeding federal ozone standards, the average location exceeds the one-hour benchmark about four times a year and the eight-hour benchmarkabout 11 times a year. Most areas of the United States now meet federalozone standards, and high ozone levels have become infrequent in mostareas that do exceed the standards. . . .
Getting real on air pollutionActivists and regulators do not produce reports and press releases on airquality for their own sake, but to influence public opinion. The reports. . . described above were accompanied by substantial public relations ef-
40 At Issue
AI Air Pollution INT 8/17/04 9:19 AM Page 40

forts, and often received coverage in many newspapers across the coun-try. In most of those articles, reporters did not compare regulators’ andactivists’ claims to actual pollution data and did not provide informationon past trends and future prospects that would put the claims in context.As a result, activists and regulators have likely contributed to Americans’misperceptions on the state of the nation’s air.
On-road pollution measurements show that averageemissions from gasoline vehicles are declining byabout 10 percent per year.
The battle against air pollution is actually a great success story in en-vironmental protection and public health. The worst air pollution prob-lems have been greatly reduced or eliminated, while parts of the greaterSan Bernardino and Fresno-Bakersfield areas in California are the onlyplaces that still frequently exceed the new eight-hour ozone benchmark.Rather than air pollution being a worsening national crisis, the vast ma-jority of the country has attained the original federal health standards,and only a few regions are still a substantial distance from meeting thetougher new standards. Recent trends in ozone and particulate levels andin pollutant emissions, along with already-adopted new requirements,show that air pollution will continue to decline.
Whom the public trustsMost Americans trust information from environmentalists and govern-ment agencies. A 1999 poll commissioned by the American Lung Associ-ation found that 90 percent of people trust environmental informationprovided by the association (59 percent of them a “great deal”) while 79percent trust EPA. A 2002 poll commissioned by the Sierra Club foundthat 57 percent of Americans trust environmental groups for informationon environmental issues. As we have seen, that trust is misplaced.
Exaggerating health risks from air pollution can be as bad as mini-mizing them. Either extreme results in wasted resources and diversion ofpeople’s attention from more serious risks. Unwarranted alarmism alsocauses unnecessary public fear. The public’s interest is in an accurate por-trayal of risk. People ultimately bear regulatory costs through reductionsin their disposable income because regulations increase the costs of pro-ducing useful goods and services. A large body of research shows that, onaverage, people use their disposable income to increase health and safetyfor themselves and their loved ones. A regulation will improve people’shealth only if the health benefits of the regulation exceed the harmcaused by the regulation’s income-reducing costs.
Regulators and environmentalists no doubt appear to be more credi-ble sources of objective information when compared with, say, politiciansor industry lobbyists. But, like other interest groups, the goals of regula-tors and activists often do not coincide with the interests of the vast ma-jority of Americans. Environmental groups want to increase support forever-more-stringent regulations and bring in the donations that support
The Threat Posed by Pollution Has Been Exaggerated 41
AI Air Pollution INT 8/17/04 9:19 AM Page 41

their activism. And while regulators want to show the success of their ef-forts to reduce air pollution, they also want to justify the need to preserveor expand their powers and budgets. Maintaining a climate of crisis andpessimism meets those institutional goals, but at the expense of encour-aging the public to exaggerate its risk.
Air pollution levels, trends, and health effects are complex issues, yetjournalists and editors face many constraints in trying to interpret envi-ronmental information for the public. Reporters often do not have spe-cific subject expertise, and may not feel comfortable trying to sort out thenuances and complexities that lie behind proponents’ portrayals of envi-ronmental data. Time and space limitations often prevent or discourageefforts to seek out experts who could critically evaluate particular claims.
Yet if the media are unable or unwilling to improve environmental re-porting, the public is likely to remain misinformed. At the very least, re-porters and editors must begin to treat claims by ostensible “do-gooders”—environmentalists, regulators, and even university researchers—with thesame skepticism appropriate for other interested parties in regulatorydebates.
42 At Issue
AI Air Pollution INT 8/17/04 9:19 AM Page 42

55Global Warming Caused
by Air Pollution Will Harm Human Health
Jonathan A. Patz and R. Sari Kovats
Jonathan A. Patz is director of the Programme on Health Effects of GlobalEnvironmental Change at the Johns Hopkins Bloomberg School of PublicHealth in Baltimore, Maryland. R. Sari Kovats is codirector of the Centreon Global Change and Health at the London School of Hygiene and Trop-ical Medicine.
Air pollution, produced primarily by wealthy, energy-consumingnations, is using worldwide climate change. Global warming isnow occurring at a faster rate than in any period over the pastthousand years, and will have a serious impact on human health.Problems relating to climate change include heat waves and airpollution, a serious threat to health in cities; rising sea level, whichwill displace large populations in low coastal areas; river flooding,which will increase the spread of many diseases; drought and mal-nutrition, expected to increase; El Niño effects, which may causeweather extremes and the spread of disease; and highland malaria,expected to increase in some areas. Regions that already suffer en-vironmental or socioeconomic stress are likely to face the greatesthealth threat; however, all countries will be affected.
Is climate change a serious threat to health? According to the most re-cent international assessments it unquestionably is, although its impact
depends on where you live, your age, access to health care, and your pub-lic health infrastructure. Arguably, climate change is one of the largest en-vironmental and health equity challenges of our times; wealthy energyconsuming nations are most responsible for the emissions that causeglobal warming, yet poor countries are most at risk. In a globalised world,however, the health of populations in rich countries is affected as a resultof international travel, trade, and human migration. Mapping “hotspots”of ecological risk has proved to be a useful construct for prioritising and
Jonathan A. Patz and R. Sari Kovats, “Hotspots in Climate Change and Human Health,” BritishMedical Journal, November 2002. Copyright © 2002 by BMJ Publishing Group, Ltd. Reproduced bypermission.
43
AI Air Pollution INT 8/17/04 9:19 AM Page 43

focusing resources to stem the threat of losing biodiversity. Similarly,identifying hotspots in climate change and human health may help pub-lic health practitioners in anticipating and preventing any additional bur-den of disease. . . .
Recent and projected climate changeAccording to the United Nations Intergovernmental Panel on ClimateChange, evidence of recent warming is building. Since the late 1950s, theglobal average surface temperature has increased by 0.6°C, snow coverand ice extent have diminished; during the past century, the sea level hasrisen on average by 10–20 cm and the temperature of the oceans has in-creased. Mid-range estimates for future climate change are 3°C globalmean warming and a rise in the sea level of 45 cm by 2100. Increased vari-ability in the hydrological cycle (more floods and droughts) is expectedto accompany global warming. The rate of change in climate is faster nowthan in any other period in the past thousand years.
Although climate warming and changes in precipitation are expectedto affect higher latitudes disproportionately, hotspots in health and cli-mate change will occur where human populations are already at risk fromclimate extremes (such as drought induced famine or flooding) and lackadequate health infrastructure. Such vulnerable hotspots may thereforenot necessarily coincide with areas that are experiencing the greatestchange in climate. For any given vulnerable region, adverse health effectswill generally occur in poor populations that have little capacity to adapt,predominantly in the tropics and subtropics.
Impacts of climate change will occur in the context of other envi-ronmental and socioeconomic pressures. For example, heavy precipita-tion can more readily cause dangerous flooding in areas denuded offorests. Localised warming can be intensified in sprawling cities throughthe “urban heat island” effect. The impact of increases in extreme rain-falls will be exacerbated by impervious road surfaces and inadequatedrainage, making cities more prone to flooding. Impacts on food re-sources will compound current overharvesting of fisheries and intensiveanimal production.
Hotspots of climate change and healthThe strategy of mapping hotspots has been used by conservationists tochoose locations to which to apply limited resources so that the world’sbiodiversity is best preserved. Impacts do, however, occur at the locallevel, and identifying vulnerable regions or countries does not accountfor diverse regional texture.
Hotspot 1—Heat Waves or Air PollutionThis kind of hotspot consists of geographically expanding or sprawl-
ing cities, replacing vegetation with surfaces retaining heat. Also citieswith poor quality housing that currently experience an urban heat islandeffect, and cities that have topography that gives rise to stagnant airmasses and summer pollution are at risk (for example, Santiago [Chile]and Mexico City [Mexico]).
Mortality generally increases at both high and low temperatures above
44 At Issue
AI Air Pollution INT 8/17/04 9:19 AM Page 44

and below an optimum temperature value. Populations in warmer re-gions tend to be sensitive to low temperatures, and populations in colderclimates are sensitive to heat. Vulnerability to heatwaves is driven by so-cioeconomic factors such as poor housing. Cities in developing countriesmay therefore be more vulnerable to heatwaves, although little researchhas been done in these countries. Elderly people and people with pre-ex-isting illnesses are disproportionately affected. Mortality is primarily dueto cardiovascular, cerebrovascular, and respiratory disease. A heatwave inChicago in 1995 caused 514 heat related deaths (12 per 100 000 popula-tion). The urban heat island effect, whereby urban areas experiencehigher and nocturnally sustained temperatures owing to the concentra-tion of heat retaining surfaces (for example, asphalt and tar roofs), canamplify general warming trends.
Increased ambient temperature and altered patterns of wind and airmass can affect chemistry in the atmosphere. Temperature and the forma-tion of ozone at ground level (photochemical urban smog) are related: astrong positive relation with temperatures above 32°C has been observedin some US cities. Ozone can heighten the sensitivity of people withasthma to allergens and contribute to the development of asthma in chil-dren. The impact of climate change on the future frequency of episodes ofair pollution during the summer in a given city remain highly uncertain.
Wealthy energy consuming nations are mostresponsible for the emissions that cause globalwarming, yet poor countries are most at risk.
Hotspot 2—Sea Level RiseThis type of hotspot consists of settlements on low lying deltas or
coral atolls and coastal megacities (such as Cairo, Egypt). After a rise in sealevel, widespread flooding, intrusion of salt water, and coastal erosion areexpected in low lying coastal settlements. The number of people at riskfrom flooding by coastal storm surges is projected to increase from the cur-rent 75 million to 200 million in a scenario of mid-range climate changes,in which a rise in the sea level of 40 cm is envisaged by the 2080s. Coun-tries such as Vietnam, Egypt, Bangladesh, and small island nations wouldbe especially vulnerable.
Coastal communities may experience forced migration of popula-tions. Thirteen of the world’s 20 current megacities are situated at sealevel. Rising seas could result in salination of coastal freshwater aquifersand disrupt stormwater drainage and sewage disposal. [Researchers R.]Nicholls and [S] Leatherman showed that the extreme case of a rise of onemetre in the sea level could inundate low lying areas, affecting 18.6 mil-lion people in China, 13 million in Bangladesh, 3.5 million in Egypt, and3.3 million in Indonesia. Considering the health burden experienced byrefugees and populations subjected to overcrowding, lack of shelter, andcompetition for resources, the problems presented by displaced popula-tions may turn out to be the largest public health challenge regarding theglobal health effects of climate change. Conflict may be one of the worstresults emerging from such forced migration.
Global Warming Caused by Pollution Harms Human Health 45
AI Air Pollution INT 8/17/04 9:19 AM Page 45

Hotspot 3—FloodingThis type of hotspot consists of regions prone to river flooding, such
as Central America, Europe, South Asia, and China. Specific watersheds inmany countries throughout the world would be affected. Climate changemay increase the risk of flooding of rivers. Immediate effects are largelydeath from drowning and injuries caused by being swept against hard ob-jects. Medium term effects include increases in communicable diseasescaused by ingestion of contaminated water (for example, cholera or he-patitis A) and contact with flood waters (for example, leptospirosis). Out-breaks of leptospirosis . . . occurred after floods in Nicaragua and Brazil. InBangladesh in 1988, watery diarrhoea in a population displaced by floodswas the most common cause of death for all age groups under 45, followedby respiratory infection. In Bangladesh, settlement of populations in highrisk areas such as floodplains and river deltas increases vulnerability.
Heavy rainfall and runoff influences the transport of other microbialand toxic agents from agricultural fields, human septic systems, and toxicdumps. Rainfall can alter the transport and dissemination of microbialpathogens (such as cryptosporidia and giardia), and temperature may af-fect their survival and growth.
Hotspot 4—Drought and MalnutritionThis kind of hotspot consists of areas currently experiencing food in-
security and risk of drought, together with a lack of resources to importfood (for example southern and eastern Africa, parts of Latin America,and central Asia). The UN Intergovernmental Panel on Climate Changeprojects a reduction in crop yields in most tropical and subtropical re-gions caused by mid-continental droughts. Some crops in tropical loca-tions would be decimated because many are already grown in climateconditions near their maximum temperature tolerance. Africa and partsof Latin America are considered to be the most vulnerable regions.
The rate of change in climate is faster now than inany other period in the past thousand years.
Decreased availability of water as a result of climate change could af-fect populations in the subtropics where water is already scarce. [In 2002]about a third of the world’s population (1.7 billion people) live in waterstressed countries, and that number is projected to increase to 5 billionpeople by 2025. Decreases in annual average streamflow are anticipatedin central Asia and southern Africa, and the food supply may be affected.Politically inflexible regimes can exacerbate climate crises, as may haveoccurred during the . . . severe drought in North Korea [in 2003].
Despite technological advances such as improved crop varieties andirrigation systems, agricultural productivity depends largely on weatherconditions. According to the UN Food and Agriculture Organization(FAO), 790 million people in developing countries are malnourished.Nearly half the populations of countries in central, southern, and easternAfrica are already undernourished, and these regions are highly vulnera-ble. In addition, diarrhoea and diseases such as scabies, conjunctivitis,and trachoma are associated with poor hygiene and result from a break-
46 At Issue
AI Air Pollution INT 8/17/04 9:19 AM Page 46

down in sanitation if water resources become depleted.Hotspot 5—El Niño EffectsThis hotspot consists of regions that experience weather extremes as-
sociated with the El Niño weather pattern1 (for example, Peru and Ecuadorfor floods; southern Africa, Indonesia, and Malaysia for drought; and someareas for epidemics of infectious disease, such as malaria in Punjab orcholera in Bangladesh). Some evidence shows that stronger or more fre-quent El Niño events may accompany global warming.
Climate change is likely to lead to greater extremes of drying andheavy rainfall and increases the risk of droughts and floods that occurwith El Niño in many regions. Studies have shown that the El Niño cyclein certain areas is associated with changes in the risk of diseases trans-mitted by mosquitoes, such as malaria and dengue fever, and diseasescaused by arboviruses, other than dengue virus. The risk of malaria in ar-eas in South America, Central Asia, and Africa has been shown to be sen-sitive to variability in climate driven by El Niño. In Peru, more childrendevelop diarrhoeal disease when temperatures are high, and admissionsduring the El Niño of 1997–8 increased appreciably. In Southeast Asia,episodes of hazardous air pollution from fires in Indonesia were related todrought conditions connected with El Niño.
Hotspot 6—Highland MalariaThis kind of hotspot consists of areas situated at the fringe of regions
where malaria is endemic (for example, East Africa). Vectorborne diseasesuch as malaria and dengue fever, are generally more influenced by am-bient conditions than are diseases passed directly from human to human.Arthropods—such as mosquitoes, ticks, and fleas—are cold blooded andtherefore sensitive to subtle changes in temperature and humidity. Popu-lations of non-human mammalian hosts, such as rodents, are affected byconditions of their habitat and the weather. . . .
Many of the highland regions in Africa that are surrounded by low-land areas where malaria is endemic are densely populated. Small changesin the distribution of malaria may therefore expose large numbers ofpeople to infection. Some malaria epidemics in the African highlandshave been associated with abnormally warm or wet weather conditions.The areas of the highlands of Africa that are currently free of malariatherefore represent an ecological zone of special concern, where the dis-tribution of malaria may potentially be affected by climate warming.
The way forwardMedical practitioners can consider these hotspots of climate change andhealth as a guidepost for understanding populations and people at mostrisk from climate change. Doctors’ awareness of current health needs intheir region is the key to identifying potential health problems that canbe exacerbated by more extreme climate variability and long term climatechange. Disease monitoring in such hotspots is a priority in order to pre-vent further health problems.
Global Warming Caused by Pollution Harms Human Health 47
1. “El Niño” refers to an unusually warm ocean current that sometimes occurs along the westerncoast of South America. It prevents upwelling of nutrient-rich cold, deep water, and disruptsregional and global weather patterns.
AI Air Pollution INT 8/17/04 9:19 AM Page 47

Many options for limiting greenhouse gas emissions are available inthe short and medium term. Policy makers can encourage energy effi-ciency and other climate friendly trends in the supply and consumptionof energy. Key consumers of energy include industries, homes, offices, ve-hicles, and farms. Efficiency can be improved in large part by providingan appropriate economic and regulatory framework for consumers andinvestors. . . .
Efficiency and equityThe United States contains 5% of the total population of the world yetproduces 25% of total annual emissions of greenhouse gas. This discrep-ancy exemplifies the ethical implications posed by climate change. Acountry’s ability to cope with the impacts of climate change depends onits wealth, technology, and general infrastructure. Impoverished popula-tions in the developing world do not have the industry, transportation,or intensive agriculture that cause global warming, yet they have limitedcapacity to protect themselves against the adverse consequences. In thisway, climate change is one of the largest challenges of our times for en-vironmental and health equity. If developing nations do not choose de-velopment pathways using more efficient energy technology, the imbal-ance of “equity” may be lessened—but the global warming problem willbe exacerbated greatly.
48 At Issue
AI Air Pollution INT 8/17/04 9:19 AM Page 48

66Global Warming Caused by Air Pollution Will Not
Harm Human HealthThomas Gale Moore
Thomas Gale Moore is a senior fellow at the Hoover Institution, an or-ganization dedicated to limiting government intrusion into the lives ofindividuals.
There is no evidence that future climate change, caused by theemission of greenhouse gases, will be harmful to human health.Claims that tropical and insect-spread diseases, heat-related deaths,and violent storms will dramatically increase are unfounded. Ac-cording to the World Health Organization, health levels have im-proved dramatically worldwide and will continue to improve inthe future. The historical record shows that the human populationis actually healthier during warm periods of time, so rather thanadversely affecting human health, global warming is likely to bebeneficial.
In promoting the Kyoto Protocol1, which would require a major cut ingreenhouse gas emissions, the White House claims that “scientists agree
that global warming and resulting climate disruptions could seriously harmhuman health (projections include 50 million more cases of malaria peryear)”. [Former] President [Bill] Clinton has asserted: “Disruptive weatherevents are increasing. Disease-bearing insects are moving to areas that usedto be too cold for them. Average temperatures are rising. Glacial formationsare receding.”
In his 1997 exhortation to the environmental ministers at Kyoto, [for-mer] Vice President Al Gore warned that “disease and pests [are, will be?]spreading to new areas.” The White House’s home page continues that
Thomas Gale Moore, In Sickness or in Health: The Kyoto Protocol Versus Global Warming. Stanford,CA: Hoover Institute, 2000. Copyright © 2000 by the Board of Trustees of the Leland StanfordJunior University. Reproduced by permission.
49
1. In 1997 more than 150 nations, including the United States, negotiated this treaty aimed atreducing worldwide carbon dioxide emissions. In 2001 the United States withdrew its support forthe treaty.
AI Air Pollution INT 8/17/04 9:19 AM Page 49

theme: Americans better watch out; global warming will make them sick.The Sierra Club has also weighed in, asserting that “doctors and sci-
entists around the world are becoming increasingly alarmed over globalwarming’s impact on human health. Abnormal and extreme weather,which scientists have long predicted would be an early effect of globalwarming, have claimed hundreds of lives across the US in recent years.Our warming climate is also creating the ideal conditions for the spreadof infectious disease, putting millions of people at risk.”
The Public Interest Research Group, a left-leaning environmental or-ganization, fears “Health Threats—Climate change is projected to havewide-spread impacts on human health resulting in significant loss of life.The projected impacts range from increased incidence of illness anddeath due to heat stress and deteriorating air quality, to the rise in trans-mission rates of deadly infectious diseases such as malaria, dengue fever,and hanta virus.” Other environmentalists and health experts have alsoforecast that global warming would bring death and disease.
Little cause for alarmNot only does my own research demonstrate that the claims of imminentdoom are unwarranted, but other studies have founded little cause foralarm. Knowledgeable organizations, such as the World Health Organiza-tion and the American Medical Association have ignored the subject, sug-gesting that, in their eyes, it is unimportant.
After examining the potential impact of global warming on poorcountries, the American Council on Science and Health (ACSH) took a re-alistic view and reported that
Nearly all of the potential adverse health effects of projectedclimate change are significant, real-life problems that havelong persisted under stable climatic conditions. Bolsteringefforts to eliminate or alleviate such problems would bothdecrease the current incidence of premature death and fa-cilitate dealing with the health risks of any climate changethat might occur.
Policies that weaken economies tend to weaken publichealth programs. Thus, it is likely that implementation ofsuch policies would (a) increase the risk of premature deathand (b) exacerbate any adverse health effects of future cli-mate change.
As the ACHS concludes:
From the standpoint of public health, stringently limitingsuch emissions [greenhouse gases] at present would not beprudent. Fossil-fuel combustion, the main source of humaninduced greenhouse-gas emissions, is vital to high-yieldagriculture and other practices that are fundamental to thewell-being of the human population. A significant short-term decline in such actions could have adverse healthrepercussions.
50 At Issue
AI Air Pollution INT 8/17/04 9:19 AM Page 50

The optimal approach to dealing with [the] prospect of cli-mate change would (a) include improvement of health in-frastructures (especially in developing countries) and (b) ex-clude any measures that would impair economies and limitpublic health resources.
The World Health Organization’s World Health Report 1998: Life in the21st Century, gave the globe an A for progress. The WHO showed that re-markable advances have been made in increasing life spans, decreasingdisease and suffering, and improving health for virtually all age groupsand that the future looks even rosier. To quote the Executive Summary:“As the new millennium approaches, the global population has never hada healthier outlook.”
How can this be? After all, the White House tells us the next centurypromises to be one of rising temperatures, spreading disease, and increas-ing mortality. Somehow, the WHO didn’t get the word. The World HealthReport 1999: Making a Difference again fails to address this problem thatthe White House believes is so worrisome.
According to the [World Health Organization], theonly significant and growing threat to human healthis HIV/AIDS, a disease that has nothing to do withclimate.
According to the WHO, the only significant and growing threat tohuman health is HIV/AIDS, a disease that has nothing to do with climate.Indeed, we have made substantial progress in controlling many major in-fectious diseases. By 1980, for example, smallpox had been eradicated;yaws had virtually disappeared (except to medical students, even thename of this tropical skin disease is unfamiliar). As a result of antibioticsand insecticides, the threat of plague has declined; improvements in san-itation and hygiene have made outbreaks of relapsing fever rare. Unbe-lievably, for those who remember summers of fear and polio insurance,poliomyelitis is scheduled for eradication. . . .
A look to the futureLooking to the future, the WHO report identifies three global trends af-fecting health—none is global warming. One is economic: the WHO re-ports (1998) on the “unparalleled prosperity” between 1950 and 1973,which resulted in marked improvements in health and life expectancies.The organization identifies the years since 1993 as another era of eco-nomic “recovery,” which has once again contributed to reduced mortal-ity. The other trends singled out as having significant health effects arepopulation growth and social developments, particularly urbanization.
Over the last forty years, the growth in the world’s economy hasbrought about a doubling of the world’s food supply, while the number ofhuman mouths has grown much more slowly. This has led to a decline inthe proportion of people who are undernourished. Since 1970, literacy rates
Global Warming Will Not Harm Human Health 51
AI Air Pollution INT 8/17/04 9:19 AM Page 51

have increased by more than 50 percent. Physical well-being has also grownapace. More people have access to clean water, sanitation facilities, andminimum health care than ever before. Like the 1999 review, prior WorldHealth Reports largely ignored global warming as a significant threat to thehealth and well-being of the globe’s population. And rightly so.
Of the 50 million plus deaths in 1997, about one-third stemmed frominfectious and parasitic diseases, most of which have nothing to do withclimate. The remaining deaths were from such killers as cancer, circula-tory diseases, and prenatal conditions, none of which would be aggra-vated by a warmer world. Most infectious and parasitic diseases are unre-lated to climate.
The WHO has identified AIDS, one of the most devastating afflictions,as a growing menace in Africa, but it bears no relationship to temperatureor rainfall. Only insect-spread diseases, such as malaria and dengue fever,and diseases like cholera and typhoid that are spread through contami-nated water, could be worsened by climate change (and then only ifswampy polluted areas were allowed to expand without thought to sani-tation, window screens, and other precautions that have all but eradicatedthose diseases in the northern latitudes).
But bear these statistics in mind: In the developed world, as recentlyas 1985, infectious and parasitic diseases accounted for 5 percent of alldeaths; in 1997, they caused only 1 percent of all deaths. In short, even forsuch insect-borne diseases as malaria, climate is much less important thanaffluence. Singapore, located two degrees from the equator, is free of thatdreadful malady, while the mosquito-carried scourge is endemic in ruralareas of Malaysia, only a few hundred miles away. Singapore’s healthystate stems from good sanitary practices that reduce exposure. The wealthof the island-state allows it to maintain an effective public health program.
The frightful forecasts of an upsurge in disease andearly mortality stemming from climate change areunfounded, exaggerated, or misleading.
Nor should we be overly concerned with the diseases spread by mos-quitoes in tropical areas. If climate change were to occur, according to theglobal warming models, the poles would warm more than the equatorwhile temperatures would increase more in the winter and at night thanduring the day. In consequence, the tropics, including Africa, wouldwarm less than the United States or Europe. Any increased burden onhealth in Africa or southern Asia would, therefore, be small.
With or without climate change, public sanitation should be empha-sized as the most effective means of attacking water- and insect-borne dis-eases everywhere. A warmer world will not add significantly to morbidityin Third World countries. A poorer world most certainly will.
Both the scientific community and the medical establishment assertthat the frightful forecasts of an upsurge in disease and early mortalitystemming from climate change are unfounded, exaggerated, or mislead-ing and do not require reducing greenhouse gas emissions. Science maga-zine reported [in 1997] that “predictions that global warming will spark
52 At Issue
AI Air Pollution INT 8/17/04 9:19 AM Page 52

epidemics have little basis, say infectious-disease specialists, who arguethat public health measures will inevitably outweigh effects of climate”.The article added: “Many of the researchers behind the dire predictionsconcede that the scenarios are speculative.”
Global warming as currently forecast by the International Panel onClimate Change (IPCC) would not bring tropical diseases to Americans orshorten their lives or inflict more violent storms bringing death and de-struction to the United States. Moreover, the warmer climate predictedfor the next century is unlikely to induce a rise in heat-related deaths. Asthe article in Science magazine points out, “people adapt. . . . One doesn’tsee large numbers of cases of heat stroke in New Orleans or Phoenix, eventhough they are much warmer than Chicago.”
Tropical diseasesConcern about tropical and insect-spread diseases is overblown. Inhabi-tants of Singapore, which lies almost on the equator, and of Hong Kongand Hawaii, which are also in the tropics, enjoy life spans as long as orlonger than those of people living in Western Europe, Japan, and NorthAmerica. Both Singapore and Hong Kong are free of malaria, but thatmosquito-spread disease ravages nearby regions. Modern sanitation in ad-vanced countries prevents the spread of many scourges found in hot cli-mates. Such low-tech and relatively cheap devices as window screens canslow the spread of insect vectors. The World Health Organization notes:
until recent times, endemic malaria was widespread in Eu-rope and parts of North America and . . . yellow fever occa-sionally caused epidemics in Portugal, Spain and the USA.Stringent control measures . . . and certain changes in life-style following economic progress, have led to the eradica-tion of malaria and yellow fever in these areas.
Under the stimulus of a warmer climate, insect-spread diseases mightor might not increase. Many of the hosts or the insects themselves flour-ish within a relatively small temperature or climatic range. Plague, for ex-ample, spreads when the temperature is between 66° and 79° with rela-tively high humidity but decreases during periods of high rainfall. Highertemperatures and more rainfall are conducive to an increase in en-cephalitis. Malaria-bearing mosquitoes flourish under humid conditionswith temperatures above 61° and below 95°. Relative humidity below 25percent causes either death or dormancy.
Parasitic diseases, such as AIDS, Lyme disease, yellow fever, malaria,and cholera, can usually be controlled through technology, good sanitarypractices, and education of the public. Even without warming, it is cer-tainly possible that dengue fever or malaria could invade North America.Unfortunately, some of the government’s well-meaning environmentalpolicies may make the vector more likely. The preservation of wetlands,although useful in conserving species diversity, also provides prime breed-ing grounds for mosquitoes that can carry these diseases. If the UnitedStates does in the future suffer from such insect-borne scourges, the in-festation may have less to do with global warming than with the restora-tion of swampy areas. . . .
Global Warming Will Not Harm Human Health 53
AI Air Pollution INT 8/17/04 9:19 AM Page 53

Deaths in winter versus summerRecent summers have sizzled. Newspapers have reported the tragic deathsof the poor and the aged on days when the mercury reached torrid levels.Prophets of doom forecast that rising temperatures in the next centuryportend a future of calamitous mortality. Scenes of men, women, andchildren collapsing on hot streets haunt our imaginations.
Heat stress does increase mortality, but it affects typically only the oldand the infirm, whose lives may be shortened by a few days or perhaps aweek. There is no evidence, however, that mortality rates rise significantly.The numbers of heat stress–related deaths are very small; in the UnitedStates; the number of deaths due to weather-related cold exceeds them.During a recent ten-year period, which includes the very hot summer of1988, the average number of weather-connected heat deaths was 132,compared with 385 who died from cold. Even during 1988, more thandouble the number of Americans died from the cold rather than from theheat of summer. A somewhat warmer climate would clearly reduce moredeaths in the winter than it would add in the summer.
A somewhat warmer climate would clearly reducemore deaths in the winter than it would add in thesummer.
Humans also seem to be able to adapt to hot weather. Adjusting fordemographic differences and economic factors, people in cities with hotclimates enjoy longer life spans than those in cold areas. A warm climatedoes not increase mortality. Moreover, the spread of air-conditioning re-duces the discomfort of extremely high temperatures. . . .
Hurricanes and tornadoesTypically, global-warming prophets claim that climate change will in-crease the threat from more frequent or violent storms. Their argument,which has some plausibility, is that a warmer climate means that moreheat energy will be trapped in the atmosphere, leading to bigger andstronger weather systems. On the other hand, warming is most likely tobe greatest near the poles and less at the equator. The strength of weathersystems is actually a factor of the differential in temperatures between thetwo regions. Since this differential will diminish, so too will the likeli-hood of more intense cyclones.
Major weather disasters do kill. The evidence, however, simply fails tosupport the proposition that weather is becoming more violent. In the At-lantic basin, the number of intense hurricanes, those scaled betweenthree to five (five being the most violent), has actually declined duringthe 1970s and 1980s. The four years from 1991 to 1994 enjoyed thefewest hurricanes of any four years over the last half century. Researchershave found that the average number of tropical storms and hurricaneshas not changed over the previous 52 years, while there has been a majordecrease in the number of intense hurricanes.
54 At Issue
AI Air Pollution INT 8/17/04 9:19 AM Page 54

For the Pacific around Australia, other researchers have found thatthe number of tropical cyclones has decreased sharply since 1969/70. Ofthe ten deadliest hurricanes to strike the continental United States, allraged prior to 1960, notwithstanding the huge expansion of populationin coastal areas vulnerable to such storms. . . .
History shows benefits of warm weatherHistory demonstrates that warmer is healthier. Since the end of the lastIce Age, the earth has enjoyed two periods that were warmer than thetwentieth century. Archaeological evidence shows that people livedlonger, enjoyed better nutrition, and multiplied more rapidly in warm pe-riods than during epochs of cold. . . .
Although it is impossible to measure the gains exactly, a moderatelywarmer climate would likely benefit Americans in many ways, especiallyin health. Contrary to many dire forecasts, however, the temperature in-crease predicted by the IPCC [Intergovernmental Panel on ClimateChange] under a doubling of greenhouse gases, which is now less than4.5°F, would yield health benefits for inhabitants of the United States.
In summary, If the IPCC is correct about a warmer climate over thenext hundred years, Americans and probably Europeans, the Japanese,and other people living in high latitudes should enjoy improved healthand extended lives. High death rates in the tropics appear to be more afunction of poverty than of climate. Thus global warming is likely to provepositive for human health.
Global Warming Will Not Harm Human Health 55
AI Air Pollution INT 8/17/04 9:19 AM Page 55

77Indoor Air Pollution Is a
Major Risk to Public HealthJohn Manuel
John Manuel is a freelance writer based in Durham, North Carolina,specializing in energy and environmental health topics.
Indoor air pollution is a serious health hazard in the United States.Carbon dioxide, the most dangerous indoor air pollutant, comesprimarily from improperly used heating appliances, particularly un-vented heaters. Studies have also shown adverse health effects froma number of volatile organic compounds, including formaldehyde,chlorination by-products, and polybrominated diphenyl ethers,that are frequently found at unhealthy levels in many buildings.Additional indoor health threats come from mites and molds, andfrom indoor dust, found to some extent in every home. Many olderhomes also contain lead and asbestos, which are hidden but serioushazards. While indoor air pollutants cannot be completely elimi-nated, there are a variety of measures that can be taken to detectand reduce them, including ventilating, eliminating moisture, andcleaning house regularly.
Over the past seven years, the Science Advisory Board of the U.S. En-vironmental Protection Agency (EPA) has consistently ranked indoor
air pollution among the top five risks to public health. This is a soberingthought, given that people in the United States spend an average of 90%of their time indoors and that many intrinsically associate home withsafety and comfort. Although stories about hazards such as lead paint andasbestos in older, deteriorating homes have become commonplace,people may be surprised to learn that environmental problems can plagueeven the most modern homes. “Environmental health hazards occur inhouses of all ages,” says John Bower, cofounder of The Healthy House In-stitute, an independent resource center for designers, architects, contrac-tors, and homeowners, and an editorial advisory board member for theIndoor Environment Review. “They just tend to be of a different nature.”
Building science specialists cite a number of trends that make the in-
John Manuel, “A Healthy Home Environment?” Environmental Health Perspectives, vol. 107, July1999.
56
AI Air Pollution INT 8/17/04 9:19 AM Page 56

door environment, particularly indoor air quality, a growing concern.Since the energy crisis of the 1970s, builders have concentrated on build-ing tighter homes as a way of minimizing heating and air-conditioningcosts. Tighter houses can be healthy houses, but more care must be takento avoid generating or trapping pollutants indoors, where they can accu-mulate to hazardous levels.
Another energy-conscious trend is the growing popularity of ventlessgas heaters. The trend started with freestanding kerosene heaters, whichwere purchased for millions of households during the energy crisis, andnow includes ventless natural gas space heaters, fireplaces, and gas logs.Aside from the combustion gases they produce, these devices release onegallon of moisture for every 100,000 British thermal units (BTUs) of en-ergy1 they consume each hour. Excess moisture in a home is a haven forthe growth of molds and fungi, which may cause a variety of allergic, in-fectious, and toxic reactions in humans.
Modern building materials, furnishings, and paintand other coatings can . . . be a source of indoor airpollution.
Modern building materials, furnishings, and paint and other coatingscan also be a source of indoor air pollution. Often these materials aremade with volatile organic compounds (VOCs) that outgas into thehome, sometimes causing respiratory problems. Wall-to-wall carpetingcan serve as a reservoir for pollutants, including pesticides, tracked infrom outdoors, as well as for dust mites, bacteria, and asthma-inducing al-lergens. Even household water may not be completely safe—radon gas, acause of lung cancer, can become aerosolized in water droplets in hotshowers, and water may contain chlorinated by-products associated withelevated rates of bladder cancer and adverse reproductive outcomes.
The carbon connectionThere are dozens of potential environmental health hazards in the homebut the most dangerous are combustion gases. Oil- and gas-fired furnaces,water heaters, ovens, wood stoves, charcoal grills, and fireplaces all pro-duce combustion gases. These gases may include carbon monoxide (CO),carbon dioxide, nitrogen dioxide, nitric oxide, sulfur dioxide, water va-por, hydrogen cyanide, formaldehyde, and various hydrocarbons.
By far the most hazardous of these is CO. In 1997, the American As-sociation of Poison Control Centers’ Toxic Exposure Surveillance Systemreported 20,930 cases of CO poisoning from all known sources, including191 life-threatening cases and 37 fatalities. CO is formed when a carbon-containing fuel such as kerosene, charcoal, wood, or gasoline, is incom-pletely burned. Natural gas in the United States does not contain carbon,but CO may form if the gas is burned without an adequate air supply.
CO is colorless, odorless, and tasteless, which makes its presence all
Indoor Air Pollution Is a Major Risk to Public Health 57
1. a standard measurement for energy
AI Air Pollution INT 8/17/04 9:19 AM Page 57

but undetectable to humans without the use of special equipment. Whenbreathed, CO combines with hemoglobin to form carboxyhemoglobin(COHb), which disrupts the flow of oxygen to the body and brain. CO’spotential to kill is well known, but the bigger story may be how manypeople suffer adverse health effects from chronic and often undetected ex-posure to low levels of the gas. Symptoms of CO poisoning, which includefatigue, headache, dizziness, nausea, and vomiting, so closely mimic thecommon cold that exposures may not be properly diagnosed. . . .
Symptoms of CO poisoning . . . so closely mimic thecommon cold that exposures may not be properlydiagnosed.
In addition to causing flu-like symptoms, studies show that chronicexposure to low-level CO may also cause poor vision, retinal hemorrhag-ing, and behavioral impairment. . . .
Anecdotal evidence and a number of studies point to faulty or im-properly used heating appliances as the primary source of CO in the home.A study of unintentional CO poisoning by Magdalena Cook and col-leagues at the Colorado Department of Health, published in the July 1995issue of the American Journal of Public Health, traced 478 of 981 poisoningsto faulty furnaces (363 cases), kerosene or space heaters (27 cases), gas ap-pliances (72 cases), and fireplaces (16 cases). (The other cases were relatedto inhalation of smoke from fire and auto exhaust.) Common causes offurnace-related CO exposure include cracked heat exchangers, backdraft-ing of the furnace flue caused by depressurization, or blockage of the chim-ney. The study did not determine whether the kerosene or other spaceheaters or gas appliances were faulty or not. The report did state, “With theonset of colder weather, malfunctioning furnaces may be turned on, andkerosene or space heaters may be inappropriately used in enclosed spaces.”
The problem with kerosene space heaters is that they are unvented;thus, they dump all their combustion by-products into the living space.A study by Ron Williams, a former senior research associate with Envi-ronmental Health Research and Testing in Research Triangle Park, NorthCarolina, published in the September/October 1992 issue of Indoor Envi-ronment (the former journal of the International Association for IndoorAir Quality), found that the use of unvented kerosene heaters in mobilehomes caused a significant rise in indoor CO concentrations, sometimesin excess of the U.S. air exposure standard of 9 parts per million (ppm)CO over an eight-hour period.
Unvented heatersHealth officials are also concerned about the rising popularity of unventednatural gas appliances intended for use as supplemental heaters. Accord-ing to the Vent-Free Gas Products Alliance, 1,250,000 ventless gas appli-ances were sold in the United States in 1998. Citing research performed bythe American Gas Association research division, the alliance claims thatproperly sized and installed vent-free products used for no more than four
58 At Issue
AI Air Pollution INT 8/17/04 9:19 AM Page 58

continuous hours conform to “reasonable” indoor air quality guidelinesset by various government agencies for CO, nitric oxide, carbon dioxide,and water vapor. However, critics say it is unreasonable to assume that allor even most of these appliances will be properly sized, used only for sup-plemental heating, and provided with sufficient makeup air. In a recentstudy by the Manufactured Housing Research Alliance, 7 of 12 manufac-tured homes using ventless kerosene heaters and 4 of 7 homes using liq-uid propane heaters were out of compliance with American National Stan-dards Institute emission rate standards for CO. The study, titledManufactured Housing Fuel Switching Field Test Study, also found that in fivehomes the owners operated their vented gas fireplace logs with thedamper closed in order to “get more heat” out of the gas logs.
Thomas Greiner, an extension engineer with Iowa State University inAmes, has performed hundreds of indoor air quality investigations in theUnited States and abroad. “I’ve been into too many homes that use theseunvented heaters as the primary source of heat,” Greiner says. “I also findthat as you get into colder climates, people use a larger-sized heater thanis called for in the specifications. There’s also a question as to whether theoccupants are letting in enough outside air to dilute the combustion by-products. My opinion is that these heaters are a real step backwards[from] the goal of improved air quality in the U.S.”
Anecdotal evidence and a number of studies point tofaulty or improperly used heating appliances as theprimary source of CO in the home.
Michael Calderera, associate director of technical services for the GasAppliance Manufacturers Association, based in Arlington, Virginia, coun-ters that a distinction should be made between an unvented keroseneheater and an unvented natural gas space heater. An unvented natural gasspace heater employs a device called an oxygen detection safety (ODS) pi-lot system, which monitors the level of oxygen in the room and auto-matically shuts off the supply of gas to the unit if the level of oxygendrops below a level set by the national product safety standard. ODS de-vices became a requirement of the national product safety standard in1980. Since that time, says Calderera, “Over seven million unventedspace heaters have been installed in the United States and, as far as weknow, there has not been a single documented death resulting from emis-sions from an ODS-equipped unit.”
Problems can occur in homes when gas ovens are used as supplemen-tal or primary heating sources. Examining a survey of customers of theCon Edison utility company in New York City who have natural gas stovesbut not natural gas heating systems, researchers observed that more thanhalf of the 340,000 customers were using more gas than was deemed nor-mal for cooking use. The researchers subsequently visited 120 of thesehomes and found that in 50% of them the occupants were using the gasrange as a supplemental source of heating. Only 12% of these stoves hadhoods with working exhaust fans that could eliminate stove-produced pol-lutants, and only 3% had working window fans. In an article published in
Indoor Air Pollution Is a Major Risk to Public Health 59
AI Air Pollution INT 8/17/04 9:19 AM Page 59
the February 1981 issue of the Journal of the Air Pollution Control Associa-tion, author T. D. Sterling and colleagues concluded that a large number ofurban dwellers may be chronically exposed to gas range-produced indoorpollutants, which may, in turn, result in ill health effects.
Volatile visitorsDozens of different VOCs have been measured in indoor air from a vari-ety of sources including building products, cleaning agents, paints andfinishes, fragrances and hair sprays, office equipment such as copiers andprinters, and infiltration of outdoor air. Concentrations of VOCs mea-sured indoors are usually far below occupational threshold limit values(TLVs), the point above which health effects may occur, but they may attimes, exceed human odor thresholds, or the point at which an odor be-comes offensive. A few compounds, principally aldehydes, are suspectedof causing adverse health effects, but because many VOCs haven’t beenstudied, no one knows what their effects might be.
One VOC that has been studied extensively and that is a cause ofgreat concern in the home is formaldehyde. Formaldehyde-based resinsare widely used in building materials (subflooring and paneling), furni-ture, and cabinets. Consumer products such as permanent-press fabric,wallpaper, and fingernail polish and hardeners can also emit formalde-hyde. “By far the worst nonwood-product emissions came from acid-cured floor finishes,” says Thomas J. Kelly, a senior research scientist atBattelle in Columbus, Ohio, who compared emission rates of formalde-hyde from materials and consumer products in California homes in anarticle published in the 1 January 1999 issue of Environmental Science andTechnology. “Even after 24 hours of drying,” wrote Kelly, “each coat emit-ted at a steady state that as 5–10 times higher than emissions from thevery worst wood product.”
Airborne formaldehyde can act as an irritant to the conjunctiva andupper and lower respiratory tract. Symptoms of short-term exposure aretemporary and, depending upon the intensity and length of exposure,may range from burning or tingling sensations in the eyes, nose, andthroat to chest tightening and wheezing. Acute severe reactions may beassociated with hypersensitivity, a condition of hyperreactive airwaysthat effects 10–20% of the U.S. population, according to the EPA. . . .
Another type of VOC, chlorination by-products, can result when pub-lic water supplies are treated with chlorine. Some of these by-products aresuspected carcinogens. Public health officials have calculated risk assess-ments based primarily upon exposure through ingestion of cold water.However, recent studies claim that humans are exposed to these chemi-cals through various means that include bathing and showering, and thatthe risks may have been underestimated. In a study published in the Jan-uary 1996 issue of EHP, Clifford Weisel, an associate professor at the En-vironmental and Occupational Health Sciences Institute at Robert WoodJohnson Medical School in Piscataway, New Jersey, and colleagues deter-mined that people are exposed to chloroform and trichloroethenethrough inhalation and dermal absorption [through the skin] as well asingestion during daily bathing and showering. Weisel’s studies showedthat exposure through showering is roughly equal to that from drinking
60 At Issue
AI Air Pollution INT 8/17/04 9:19 AM Page 60

water. However, as to how much the former route of exposure contributesto adverse health effects, Weisel says, “At the moment, we don’t under-stand the biological mechanisms of action well enough to establish riskestimates. The delivered dose of the metabolite varies by route of expo-sure, and that can affect the potential outcome.” Weisel’s article callsupon public health officials to raise their risk assessments to include theseroutes of exposure.
Biological pollutants are found to some degree inevery home, school, and workplace.
Concern has been expressed . . . about a possible threat to humanhealth from exposure to polybrominated diphenyl ethers (PBDEs) in thehome. PBDEs are . . . compounds that can accumulate in human tissue.Their metabolites have been shown to interfere with the thyroid system.PBDEs are used as flame retardants in high-impact polystyrene, flexiblepolyurethane foam, textile coatings, wire and cable insulation, and elec-trical connectors. In consumer products, PBDEs are typically used in in-terior parts and incorporated into the polymer matrix, which minimizesthe potential of exposure to the public. However, new evidence raisesconcerns that PBDE vapors might emanate from television sets and be ab-sorbed by human tissue.
In a paper published in volume 35 of Organohalogen Compounds andpresented at “The 18th Symposium on Halogenated Environmental Or-ganic Pollutants,” held in Stockholm in August 1998, Jacob de Boer, di-rector of the DLO-Netherlands Institute for Fisheries Research, and col-leagues examined the case of a male Israeli citizen who suffered fromheadaches, painful lesions, dizziness, and other symptoms after pro-longed television watching in a small, unventilated room. Blood samplestaken after the onset of these symptoms revealed chromosomal abnor-malities consistent with chemical exposure. Ten years after the exposure,sampling of both the subject’s adipose tissue [connective tissue where fatis stored] and the television set revealed the presence of PBDEs. Whileproof of a relationship could not be established, the authors hypothesizethat exposure to vapors from the television set may have played a role inthe observed health effects.
“I think PBDEs are the sleeper compounds of the future,” says LarryRobertson, a professor of toxicology at the University of Kentucky in Lex-ington and a coauthor of the article. “They are slowly but irrevocably ac-cumulating in human tissue.” Robertson says more research is needed todetermine how these compounds break down in the environment.
Of mites and moldsBiological pollutants are found to some degree in every home, school,and workplace. They come from outdoor air in the form of pollen andother allergens, from human occupants who expel viruses and bacteria,from pets that shed dander, from insect pests, and from moist surfacesthat allow mold and fungi to grow.
Indoor Air Pollution Is a Major Risk to Public Health 61
AI Air Pollution INT 8/17/04 9:19 AM Page 61

In the publication Indoor Air Pollution—An Introduction for Health Pro-fessionals, the EPA cites a number of factors that allow biological agentsto grow and be released into the air. High relative humidity (more than50%) encourages dust mite populations to increase and allows fungalgrowth on damp surfaces. Damp carpeting as well as moisture from inad-equate ventilation of bathrooms and kitchens can promote mite and fun-gus contamination. Appliances such as humidifiers, dehumidifiers, airconditioners, and drip pans under cooling coils can also support thegrowth of bacteria and fungi. Finally, components of heating, ventilating,and airconditioning (HVAC) systems may serve as reservoirs of microbialgrowth and distribution. The EPA states in its online publication Biologi-cal Pollutants in Your Home that 30–50% of all structures in the UnitedStates and Canada have damp conditions that may permit the growthand buildup of biological pollutants.
Biological agents in indoor air are known to cause infections, hyper-sensitivity, and toxic effects. The EPA indicates that allergic reactions maybe the most common health problem with indoor air quality in homes.Such reactions can range from mildly uncomfortable to life-threatening.Allergic reactions to dust mites are particularly problematic. Bower’s bookThe Healthy House states that dust mite allergy affects approximately 10%of the U.S. population. Several studies have shown that exposure to housedust mite allergens is associated with asthma in susceptible children. . . .
Dirty dustingThe expression “dusting the house” may conjure an image of a housewifewith a feather duster, whisking the lampshades and tables to give theman extra shine. But studies in recent years indicate that house dust is of-ten not so benign and that the health problems it can cause are nothingto sniff at.
House dust contains all manner of particles from such activities ascooking, other household processes, and smoking. It may also containpollutants brought in from outdoors such as pollen, pesticides, and heavymetals, some of which are known or suspected human carcinogens. Out-door pollutants are tracked in on shoes or brought in on clothing or thefur of household pets. In fact, concentrations of pesticides and other out-door organic pollutants may be higher inside the house than outside.
“We’ve found concentrations of pesticides . . . 10–100 times higher incarpet dust than in yard soils,” says Robert G. Lewis, a senior scientistwith the National Exposure Research Laboratory of the EPA in ResearchTriangle Park. “And these compounds last far longer indoors than they doout of doors. In a study we did in 1990, we found DDT [an insecticide thatis toxic to animals and humans] to be the highest in concentration of allparticles found in the dust of an old carpet. DDT use was banned in theUnited States in 1972.”
Lewis says young children who spend lots of time at floor level are atthe greatest risk for exposure to such chemicals by ingestion and inhala-tion of resuspended house dust, which exists at highest concentrationsclose to the floor. “We don’t have risk criteria on many of these com-pounds in dust and we don’t know what the bioavailability is once thedust is ingested or inhaled,” Lewis says. “But given that most pesticides
62 At Issue
AI Air Pollution INT 8/17/04 9:19 AM Page 62

are toxic to humans and some are potentially carcinogenic, we should tryto limit our exposures by whatever means.”
Hidden hazardsRadon. Radon, a colorless, odorless gas found to varying degrees in soiland subsurface water, is a pollutant that has received a great deal of at-tention in recent years. The EPA estimates that radon pollution is re-sponsible for up to 20,000 lung cancer deaths each year. The agency hasprepared a map of the United States showing the geologic potential forradon in different parts of the country; however, no region of the nationshould be considered entirely safe. Most of the time, radon gas leaves thesoil and dissipates into the atmosphere, but it can be drawn into the liv-ing space of a house through leaky floors or duct systems. As radon startsto decay, it gives off a series of radioactive particles that can damage lungtissue if inhaled. Radon is measured in units of picocuries per liter. TheEPA suggests that people exposed to more than 4 picocuries per liter inthe home should take remedial action to remove the source of radon.
Lead and asbestos. Two other materials, lead and asbestos, may be aproblem in older homes. Lead was commonly used in household paints upto the 1950s, when its use began to decline. In 1978, the CPSC banned themanufacture of house paint containing more than a trace amount (0.06%)of lead. Lead is highly toxic and has been linked to a variety of neurode-velopmental problems among children living in older homes with peelingor chipping lead paint. Exposure comes through children either eating thechips directly or crawling on carpets contaminated with lead dust andthen putting their hands in their mouths. According to Bower, when chil-dren eat paint chips, the majority of the lead is excreted because the chipsare fairly large. However, when children eat dust, the majority of the leadis absorbed, making lead dust a more dangerous hazard.
Asbestos is a mineral that was commonly used for insulating hot wa-ter pipes in homes built between 1920 and 1972. It was also used as acomponent in joint finishing and patching compounds, in the backing ofvinyl, asphalt, and rubber flooring, and in textured ceilings. If inhaled, as-bestos fibers can lodge in the lungs and lead to a variety of diseases in-cluding lung cancer and asbestosis, a chronic fibrotic lung disease. Rec-ognizing its dangers, manufacturers eliminated asbestos from mostbuilding products by the 1970s, and its use in household products wasbanned by the CPSC in 1977. Still, older homes may have asbestos insome locations and it can become hazardous if the materials begin to de-teriorate and become airborne.
Cleaning housePeople who have the luxury of building their own home can now employa wide variety of measures and materials to minimize their potential ex-posure to indoor environmental hazards. Such materials range from ven-tilation tubes that purge radon gas from the crawl space, to electricalheating and hot water systems that do not emit combustion gases, to steelkitchen cabinets that do not emit VOCs. However, the vast majority ofpeople in the United States live in homes that are not custom-built to
Indoor Air Pollution Is a Major Risk to Public Health 63
AI Air Pollution INT 8/17/04 9:19 AM Page 63

avoid such environmental health problems. A number of strategies canhelp people avoid adverse health effects within the home.
For homes that have gas- or oil-fired heating systems, experts recom-mend yearly servicing by a qualified heating technician. Gas stoves andranges should only be operated with the exhaust fan turned on. If the rangelacks an exhaust system, one should be installed. Many building science ex-perts recommend against using ventless gas-fired heating systems in thehome. If these are used, experts recommend they be operated in accordancewith manufacturer instructions and for only a few hours at a time. Expertsalso recommend that CO detectors be installed in every home.
The EPA recommends that every homeowner and every condo-minium owner living below the third floor have his or her home testedfor radon, either by a professional or using a radon kit (available in mosthardware stores). Long-term (90-day) testing kits are recommended, asradon concentrations can fluctuate at different times of the year. If highlevels of radon are found in the home, several strategies can be pursuedincluding ventilating the living space, sealing off the floor from the crawlspace or basement, and depressurizing the subfloor through the use ofvents and fans.
Concentrations of pesticides and other outdoororganic pollutants may be higher inside the housethan outside.
For people sensitive to VOCs, the EPA recommends limiting the useof personal items such as scents and hair sprays; household products suchas rug and oven cleaners; paints, lacquers, and finishes; dry-cleaning flu-ids; office equipment such as copiers and printers; office products such ascorrection fluids and graphics materials; and craft materials such as gluesand adhesives. If new carpeting, paints, or finishes containing formalde-hyde are installed or applied, the home should be well ventilated for sev-eral days afterward. Pesticides and biocides that emit VOCs should onlybe used outdoors and should be stored outside the living space.
Experts say the best strategy for avoiding the buildup of mold andmildew is to reduce moisture levels in the home. Exhaust fans should beused in bathrooms and kitchens, where high levels of moisture are pro-duced. Clothes dryers should be vented outside the house. Roof or plumb-ing leaks should be repaired immediately. Humidifiers and drip pans forHVAC [heating, ventilation, and air conditioning] systems should becleaned regularly. Flood-damaged carpets, draperies, or furniture shouldbe thrown out.
Dust mites require food, water, and moderate temperatures forgrowth. The EPA advises maintaining a low relative humidity (below 45%)in the home, vacuuming often and, if necessary, using EPA-approved pes-ticides. Mattresses are a prime haven for dust mites because they are madeof fluffy materials and they are a site of extended human exposure (dustmites feed off of skin flakes). Allergists recommend that both mattressesand box springs be covered with special covers made of tightly woven ma-terial or plastic. Bedding should be washed in water of at least 130°F.
64 At Issue
AI Air Pollution INT 8/17/04 9:19 AM Page 64

Airborne pollutants cannot be totally eliminated from the home, butthey can be kept to a minimum. Health officials warn against smoking in-doors. Air filters in HVAC systems should be changed monthly. If occupantscontinue to suffer allergic reactions to pollens and other allergens, expertssay a more sophisticated filtration system may need to be installed. High-efficiency particulate accumulator (HEPA) filters remove 99% of particleslarger than 0.3 microns, which includes pollens and household dust. . . .
While vacuuming is always recommended to reduce the biologicals,pesticides, and heavy metals that can build up in carpets, studies showthat standard housecleaning strategies are often not sufficient to signifi-cantly reduce these pollutants. In order to improve indoor air quality,cleaning must be thorough and well thought out. Deborah Franke, a se-nior research scientist with Research Triangle Institute, an independentresearch laboratory in Research Triangle Park, and colleagues analyzedthe effectiveness of routine and improved housecleaning methods againstdust, bacteria, fungi, and VOCs in an institutional building in North Car-olina. Their findings, published in the December 1997 issue of Indoor Air,include a list of procedures most effective in improving indoor air qual-ity. These include the use of HEPA vacuum cleaners with high-efficiencybags and filters, hot-water extraction cleaning methods in the deep clean-ing of carpets, the use of disposable damp cloths for dusting and mop-ping, low VOC-emitting cleaning agents, and interior doormats to trapand collect particles at entrances.
Unlike outdoor air quality, which is protected by the Clean Air Actand other legislation, the responsibility for clean indoor air falls primar-ily on the individual. Although information on hazardous indoor air ex-posures is often lacking (for example, manufacturers may not be requiredto list all of the chemicals that are contained in household products), thehomeowner is not without resources. Information is available on theWorld Wide Web and through many publications produced by the EPA,the CPSC, and private organizations such as The Healthy House Institute.Given the amount of time spent indoors, ensuring a healthy home envi-ronment may soon become a quest for everyone—not just homeowners—to consider.
Indoor Air Pollution Is a Major Risk to Public Health 65
AI Air Pollution INT 8/17/04 9:19 AM Page 65
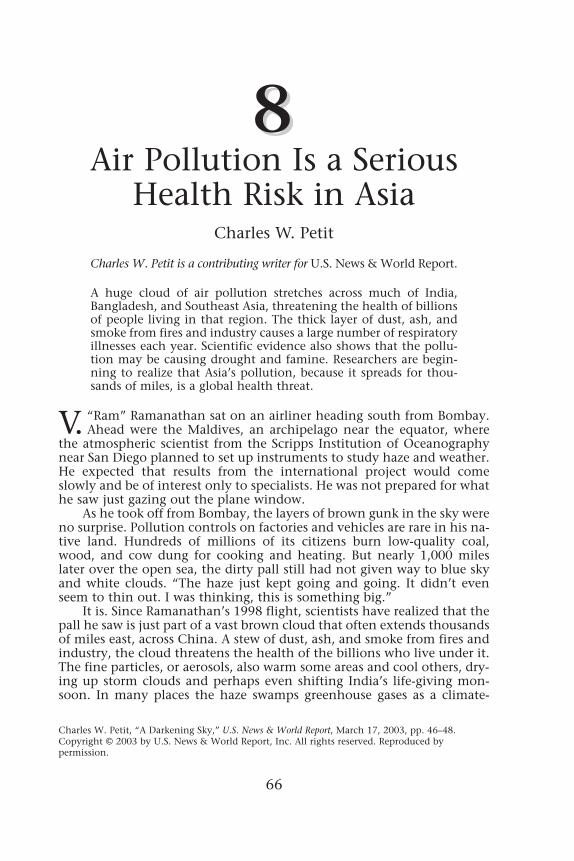
88Air Pollution Is a Serious
Health Risk in AsiaCharles W. Petit
Charles W. Petit is a contributing writer for U.S. News & World Report.
A huge cloud of air pollution stretches across much of India,Bangladesh, and Southeast Asia, threatening the health of billionsof people living in that region. The thick layer of dust, ash, andsmoke from fires and industry causes a large number of respiratoryillnesses each year. Scientific evidence also shows that the pollu-tion may be causing drought and famine. Researchers are begin-ning to realize that Asia’s pollution, because it spreads for thou-sands of miles, is a global health threat.
V. “Ram” Ramanathan sat on an airliner heading south from Bombay.Ahead were the Maldives, an archipelago near the equator, where
the atmospheric scientist from the Scripps Institution of Oceanographynear San Diego planned to set up instruments to study haze and weather.He expected that results from the international project would comeslowly and be of interest only to specialists. He was not prepared for whathe saw just gazing out the plane window.
As he took off from Bombay, the layers of brown gunk in the sky wereno surprise. Pollution controls on factories and vehicles are rare in his na-tive land. Hundreds of millions of its citizens burn low-quality coal,wood, and cow dung for cooking and heating. But nearly 1,000 mileslater over the open sea, the dirty pall still had not given way to blue skyand white clouds. “The haze just kept going and going. It didn’t evenseem to thin out. I was thinking, this is something big.”
It is. Since Ramanathan’s 1998 flight, scientists have realized that thepall he saw is just part of a vast brown cloud that often extends thousandsof miles east, across China. A stew of dust, ash, and smoke from fires andindustry, the cloud threatens the health of the billions who live under it.The fine particles, or aerosols, also warm some areas and cool others, dry-ing up storm clouds and perhaps even shifting India’s life-giving mon-soon. In many places the haze swamps greenhouse gases as a climate-
Charles W. Petit, “A Darkening Sky,” U.S. News & World Report, March 17, 2003, pp. 46–48.Copyright © 2003 by U.S. News & World Report, Inc. All rights reserved. Reproduced bypermission.
66
AI Air Pollution INT 8/17/04 9:19 AM Page 66

changing force, say scientists. The atmospheric havoc in Asia may evenplay a role in El Niño, the climate cycle now [in 2003] drenching thesouthern United States.
Brown cloud over AsiaMuch of this picture is still fuzzy, but scientists are working to sharpen it.Ramanathan and his Scripps colleague Paul Crutzen, a chemist and No-bel laureate, made a start with their Indian Ocean Experiment in the late1990s, which studied haze from a score of ground stations and from air-craft. Their glimpses of the cloud’s extent and impacts helped set off anexplosion of similar studies across India, off Japan and Korea, and inChina, which has launched the largest single scientific project in thecountry’s history to analyze aerosols and climate. And it has spawned anew United Nations effort called Project Asian Brown Cloud. Led by Ra-manathan and Crutzen, it is organizing a massive study of the pollution’ssources and effects, and what to do about it.
In a way, Asia with its dirty, fast-growing industry is repeating on afar vaster scale the smoky evolution of European and U.S. industry in the19th and early 20th centuries. Coal consumption in China, for example,was 50 percent higher than in the United States in 1999 and could betwice as high by 2010. Across Asia, coal heats houses and cooks meals.Smoke from agricultural burning and wildfires adds to the brew. InChina, the haze sometimes starts as dust blowing off western deserts, “butit picks up all kinds of toxic pollutants as it travels,” says F. SherwoodRowland, a University of California–Irvine chemist who received a NobelPrize for work on ozone. “We can detect Asian aerosols blowing all theway across the U.S.”
A stew of dust, ash, and smoke from fires andindustry, the cloud threatens the health of thebillions who live under it.
Yet just five years ago, Ramanathan could be startled by the pall hesaw from the plane window because experts still thought of smog out-breaks as local, covering a city or filling a river valley. Until recently no-body had seen the goop all in one glance. Cameras on early weather satel-lites were calibrated for clouds but not hazes. But new full-color satellitecamera systems now send images of a nearly continuous, 2-mile-thickblanket of sulfates, soot, organic compounds, dust, fly ash, and other cruddraped across much of India, Bangladesh, and Southeast Asia, includingthe industrial heart of China.
The sand-colored air of Los Angeles is pristine by comparison. WhenChinese scientists told U.S. colleagues about foul air back home, “we’dsay we have smog here too,” says Lorraine Remer, who analyzes satellitedata at NASA’s Goddard Space Flight Center. “Then we saw the extinctionnumbers”—satellite data on how much the brown cloud dims light.Across much of Asia, they were several times higher than anything everseen in American smog. “We were standing there not believing it,” she
Air Pollution Is a Serious Health Risk in Asia 67
AI Air Pollution INT 8/17/04 9:19 AM Page 67

says. In and around India, the researchers found sunlight was reduced by10 percent. Crop scientists say this is enough to reduce rice yields by 3percent to 10 percent across much of the country.
Ground data in China show the same thing. In Beijing, airborne par-ticulates are routinely five times as high as in Los Angeles. Donald Blake,an atmospheric chemist at the University of California-Irvine, says that acolleague on a visit asked a group of kindergartners to draw the sky. Theyall reached for the gray crayon.
It’s worse than unsightly. India has 23 cities of more than 1 millionpeople; not one meets World Health Organization pollution standards.Indoor smoke from poorly vented fires is blamed for half a million pre-mature deaths annually in India alone, mostly women and children. Insouthern China and Southeast Asia, as many as 1.4 million people die an-nually from pollution-related respiratory ills.
Disturbing effectResearchers are coming to realize that, through a long chain of effects, thebrown cloud may also be to blame for drought and flooding. Scientists’understanding of how aerosols shape climate is not nearly as well devel-oped as it is for greenhouse gases like carbon dioxide, still No. 1 on anylist of human impacts on climate. “But one common aspect,” says Ra-manathan, “is that the haze and its heating of the atmosphere is suffi-cient to disturb climate a lot.”
Unlike the whiteish sulfate particles from cleaner-burning powerplants in the United States and Europe, the Asian hazes are dark with soot.As a result, they absorb sunlight and can double the rate at which it warmsthe atmosphere several thousand feet up, while shading and cooling theground below. Some scientists think that the net effect is to boost globalwarming. But the more certain impact of the hazes is on rainfall, says JeffKiehl of the National Center for Atmospheric Research in Boulder, Colo.“They are radically changing the temperature profile of the atmosphere inmany areas, with a big impact on where rain falls and how much.”
India has 23 cities of more than 1 million people;not one meets World Health Organization pollutionstandards.
By cooling the northern Indian Ocean, the haze reduces evaporation,cutting the water supply for rainfall. On land, the warm air aloft acts as alid on cloud formation, quashing the convection that feeds thunder-storms. And the aerosols themselves seed the formation of tiny mistparticles—so many that they suck water out of the air and choke off thegrowth of larger drops that would fall as rain. While the haze particles dryout the land, the rain does fall over the sea, where larger, natural sea-saltparticles promote droplet growth. “We’re shifting rain from the land tothe ocean,” says Daniel Rosenfeld of the Hebrew University of Jerusalem.
At least that’s the theory, and there are signs it may be happening.Some computer climate models predict that the hazes over India should
68 At Issue
AI Air Pollution INT 8/17/04 9:19 AM Page 68

displace the annual monsoon rains, leading to floods in the south andeast of the country while drying the north and shrinking the vital Hi-malayan snowpack. “That’s just the pattern we are starting to seeemerge,” says Surabi Menon of the Goddard Institute for Space Studies inNew York City.
Changing weather patternsIn southeastern China, where haze has cut sunlight by 2 percent to 3 per-cent every 10 years since the 1950s, temperatures are dropping, while ris-ing elsewhere in the country, presumably because of greenhouse gases.The changed temperature patterns have rerouted storm tracks, one recentChinese study said. The study blamed the shift for severe floods in the na-tion’s south in recent years, coupled with drought in the north. It rankedthe new weather pattern as the greatest sustained change in China’s cli-mate in more than 1,000 years. Some scientists also suspect that the pol-lution cloud could be cooling the sea surface and slowing evaporation inthe far western Pacific, off Asia. The effects could ripple across half theglobe to the United States, because the western Pacific is the breedingground for El Niños, the bouts of Pacific warming that change rainfallacross the Americas and beyond.
All of this is enough to make Asia’s brown cloud, and the sparserhazes elsewhere, into a global climate threat. Fortunately, hazes are fareasier to counter than greenhouse gases like carbon dioxide. Clean up in-dustry and smother the fires, and in a few weeks rain would wash theskies clean. Carbon dioxide, in contrast, lingers for centuries, and ordi-nary pollution controls can’t touch it.
Some scientists, distressed at the reluctance of the U.S. governmentand many developing nations to tackle greenhouse gases, hope that therelatively easier task of curbing fine particles could kickstart internationalefforts to address climate change. Going after hazes, particularly thoseheavy with soot, is “a no-lose situation as far as I’m concerned,” says Stan-ford University atmospheric researcher Mark Jacobson.
The Chinese government, rattled by the data on the country’s pol-luted air, is doing just that. For both health and weather reasons, it haslargely replaced home use of coal with cleaner-burning natural gas in bigcities and is starting to require catalytic converters on vehicles. China alsohopes to restore blue skies to Beijing in time for the 2008 Olympics.
Air Pollution Is a Serious Health Risk in Asia 69
AI Air Pollution INT 8/17/04 9:19 AM Page 69

99Pollution Regulation Reforms
Will Worsen Air QualityJohn Edwards
John Edwards, elected to the U.S. Senate in 1998, serves on the Com-mittee on Health, Education, Labor, and Pensions; the Committee onSmall Business; and the Select Committee on Intelligence.
Changes to the New Source Review provisions of the Clean Air Actwill increase air pollution in the United States. Poor air quality isalready a serious problem affecting the health of Americans. Thesechanges will alter the way pollution levels are calculated, allowingincreased air pollution by industries. Before any changes are im-plemented, additional studies should he conducted to assess theirpotential effect. Protecting human health through clean air shouldbe a top priority for the administration.
Editor’s Note: The Clean Air Act’s New Source Review provisions regulate theconstruction and maintenance of major emitting industrial facilities. In 2003the Environmental Protection Agency made several controversial changes tothese rules, which will allow modifications of some existing sources of air pol-lution without subjecting them to new emission standards.
For months the Administration has talked about massive changes inclean air protections and for months senators on both sides of the aisle
have said to the Administration: Before you go through with thesechanges, would you please tell us in detail how these changes are going toaffect our families? In other words, would you please look before you leap?
We have been asking that question for months, and for months theAdministration has refused to answer. On November 22 [2003], they wentahead with their massive changes without telling us how it was going toaffect the health of the American people.
I believe the Administration does not want to share these facts becausethey are afraid of what the facts will show. They are afraid people will seewhat their rule changes will do. When you study these rules, when you lis-
John Edwards, address before the U.S. Senate, Washington, DC, January 21, 2003.
70
AI Air Pollution INT 8/17/04 9:19 AM Page 70

ten to the experts, you will see that they will make our air dirtier. Theserules will add more soot to our cities and more smog to our national parks.At the end of the day, these rules will allow more kids to get asthma at-tacks, more seniors to have heart problems which land them in the emer-gency room, and more people will lose their lives prematurely.
This amendment1 is a very modest response to these proposedchanges. It does not block the rules forever. It does not put them off foryears. It just says, let’s put these rules off for about six months and usethat time to determine how these changes will affect human health, howthey will affect kids with asthma, senior citizens with cardiorespiratoryproblems. It seems to be a perfectly reasonable thing to do. I hope my col-leagues will support the amendment.
These [new] rules will allow more kids to get asthmaattacks, more seniors to have heart problems whichland them in the emergency room, and more peoplewill lose their lives prematurely.
We are saying, let’s get a study from the nonpartisan, completely re-spected National Academy of Sciences. That is all we are talking about—a six-month delay to look at these changes to see, before they go into ef-fect, what effect they will have on the health of the American people.
The science of pollution is completely clear. Pollution causes heartand lung problems. It aggravates asthma. It causes the smog that ruins theview in our Nation’s parks. It causes premature deaths.
According to Abt Associates, a nonpartisan research group, just 51powerplants are responsible for more than 5,500 deaths every year, forover 106,000 asthma attacks, and for costs to our economy of between$31 billion and $49 billion. That is only 51 powerplants. If you did thesame study of other industries, the numbers would go up dramatically.
North Carolina has some of the worst pollution in the country. Ac-cording to Dr. Clay Ballantine, a physician in Asheville in western NorthCarolina, just living and breathing in western North Carolina costs oneto three years off the average life of a person. The University of NorthCarolina School of Public Health found that in many of our countiesthree in 10 kids have asthma, which is three times the national average.
Just walking in the Great Smoky Mountains is as bad for your lungsas breathing in many big cities. When the head of the EPA [Environmen-tal Protection Agency], Christie Todd Whitman, visited the Great Smok-ies last Fourth of July [2002], she could barely see 15 miles at a placewhere you used to be able to see 75 to 100 miles. So clean air is a hugepriority. It is important for our kids, for seniors, and for our parks.
This Administration has made radical changes in the regulations un-der the Clean Air Act. This is about a program called New Source Review
Pollution Regulation Reforms Will Worsen Air Quality 71
1. This amendment would have placed a six-month delay on implementation of changes to the NewSource Review, a program that regulates the construction and maintenance of major emittingindustrial facilities. The amendment was defeated and changes to the New Source Review wereimplemented in 2003.
AI Air Pollution INT 8/17/04 9:19 AM Page 71

or NSR. The basic idea of NSR is simple. Under the Clean Air Act, if some-one builds a new factory, the new factory has to have state-of-the-artequipment to prevent pollution, but there is a special deal for factoriesthat were built before 1977. Those factories don’t need to install new pol-lution controls unless and until their toxic emissions go up by a signifi-cant amount. Only when that happens does the plant have to installthese new controls that others have to meet instantly. This is what theNew Source Review is all about.
There is no question—all of us believe—reforming NSR is a good idea.We ought to do two things: One, we ought to cut red tape, which is aproblem; two, we ought to cut pollution.
Under Carol Browner, EPA Administrator in the Clinton Administra-tion, positive work was done in that direction. But the debate today is notabout those kinds of reasonable and sensible reforms that are in the bestinterest of the American people. This debate is about this Administra-tion’s package.
There are several glaring problems with that package. First, the Ad-ministration developed these rules through a series of secret consultationswith executives from power and oil companies. It would not have beenso bad if the Administration had also been talking secretly to regular pa-tients and kids and doctors about what effect these changes in the ruleswould have on their lives and their health. But there is no evidence theydid that. Instead, the Administration focused on one side and favoredthat side in the changes they made in the rules.
Premature deaths and asthma attacks cost ourcountry over $30 billion each year. The costs ofcleaning the air are a small fraction of that amount.
The second problem is this Administration has never explained inany serious way whether these changes will in fact harm human health,whether they will cause more pollution, more asthma, or more prematuredeaths. For months we have asked for a serious qualitative study, and formonths we have not received that study. . . .
On November 22, 2002, the Administration just went ahead, final-ized the rules without giving any credible evidence on what impact thiswould have on human health.
Let me give two examples of what these rules will do:First, the rules change the way pollution levels are calculated. Under
the New Source Review, a factory has to clean up only if it increases itspollution level. It matters a lot how we measure the factory’s initial pol-lution level, what’s called the “baseline.” Up to now, the rule has beenthat the baseline is the average for the last two years—that is the basis onwhich we determine whether there has been an increase in pollution, un-less the company can prove another period is more representative of re-cent emissions. But the basic rule has been that you establish the baselineby looking at the last two years. That makes sense.
What this Administration proposes doing makes no sense. What theyare saying is, instead of using the last two years we let the factory choose
72 At Issue
AI Air Pollution INT 8/17/04 9:19 AM Page 72

any two years out of the last 10. So instead of looking at the last two yearsas a baseline to determine whether emissions have gone up, what they aresaying is we are going to let the factory choose any two years in the pre-vious 10 in order to determine whether emissions have gone up.
So even if the reality is that their pollution level is quite low rightnow, they get to go back a decade and say that pollution is high.
They can even take emissions from accidents and malfunctions anduse those to inflate their baseline. And because they can make pollution10 years ago look like pollution today, they can pollute even more with-out cleaning up.
You don’t have to take my word for it. According to internal docu-ments, career staff at the EPA said that this change would “significantlydiminish the scope” of the New Source Review. A study by the Environ-mental Integrity Project found that at just two facilities, the new ruleswould allow over 120 tons of the pollution into the air. The National As-sociation of State and Local Air Regulators says that this change “providesyet another opportunity for new emissions to avoid NSR.” So the bottomline is more pollution.
Here is a second example. The new rules contain something called a“clean unit” exemption. In theory, the exemption should give companiesan incentive to clean up by giving them benefits if they install state-of-the-art technology. It is a perfectly good idea. But this Administration hasprovided an exemption as long as the company installed new equipmentanytime during the last 10 years. In other words, if a company did some-thing good in 1994, they get a free pass to increase pollution in 2003,nine years later.
Again, this makes no sense. Again, it will increase pollution. Again,here is what the State and local air commissioners said. This rule “wouldsubstantially weaken the environmental protections offered by the NSRprogram.”
Now, when it comes to the effects of these rules, it is true that theState administrators could be wrong. The career officials at EPA could bewrong. I could be wrong. We could all be wrong. The rules could be okay.
But even if we are all wrong—and I do not believe we are—shouldn’twe get the whole story and get a real answer to the question beforeputting our kids and our seniors at risk?
Six months is not a long time to wait in order to get the whole story.It is far better to wait six months than to say to this Administration, goahead, roll the dice. It is okay. We are willing to put the lives of our chil-dren and seniors at risk, and we are willing to let this rule go into effecteven though we do not know what effect it is going to have on the healthof our seniors and children.
Opposition to reformLet me talk for a minute about the broad opposition to these rules.
This Administration likes to talk about State flexibility, but these reg-ulations take flexibility away from the States and force some States tolower their protections. Again, this is the view of the State experts: “Therevised requirements go beyond even what industry requested. . . . Be-cause the reforms are mandatory, they will impede, or even preclude, the
Pollution Regulation Reforms Will Worsen Air Quality 73
AI Air Pollution INT 8/17/04 9:19 AM Page 73

ability of States and localities all across the country to protect the air. Al-though our associations believe NSR can be improved . . . [w]e firmly be-lieve the controversial reforms EPA is putting in place . . . will result inunchecked emission increases that will degrade our air quality and en-danger public health.”
That is the States. Now listen to the doctors. Over a thousand doctorsfrom all across the country have urged this Administration not to goahead with these final rules. These doctors see the effects of air pollutionevery day in their practices and in the emergency rooms, and theywarned that “it is irresponsible for the EPA to move forward in finalizingnew regulations that could have a negative impact on human health.”
This is not a partisan issue. The State air quality folks are not parti-sans. The local air quality folks are not partisans. And then there’s Re-publicans for Environmental Protection, a group to which 12 past or pre-sent former Republican Members of Congress are connected. Republicansfor Environmental Protection recently wrote a letter supporting myamendment.
They wrote that “a reasonable delay (of the rules) is necessary in or-der to allow independent researchers to investigate how the New SourceReview revisions would affect emissions and the resulting impacts onpublic health.” So Republicans support this amendment as well.
We will hear people say that protecting the air is too expensive. Butat the 51 powerplants I mentioned earlier, premature deaths and asthmaattacks cost our country over $30 billion each year. The costs of cleaningthe air are a small fraction of that amount. So clean air not only saveslives; it also saves money. . . .
This amendment is about final rules. It is a very modest amendment.It will protect our kids from asthma, our seniors from heart problems, ourparks from smog. This amendment will make sure we look before we leap.I urge my colleagues on both sides of the aisle to support this amendment.
74 At Issue
AI Air Pollution INT 8/17/04 9:19 AM Page 74

1100Pollution Regulation
Reforms Will Improve Air Quality
Christopher Bond
Christopher Bond, the governor of Missouri from 1972 to 1976 andfrom 1980 to 1984, was first elected to the U.S. Senate in 1986. Heserves on a number of committees, including the Committee on Appro-priations and the Committee on Environment and Public Works.
Changes to the New Source Review provisions of the Clean Air Actwill reduce air pollution in the United States. The New Source Re-view has hindered industry and needs to be reformed. Thechanges will allow companies the flexibility they need to upgradetheir facilities, and will cause reductions in ozone, smog, and otherhazardous pollutants. In addition to environmental progress, eco-nomic performance and energy conservation will be improved.
Editor’s Note: The Clean Air Act’s New Source Review provisions regulate theconstruction and maintenance of major emitting industrial facilities. In 2003the Environmental Protection Agency made several controversial changes tothese rules, which will allow modifications of some existing sources of air pol-lution without subjecting them to new emission standards.
I believe the Administration’s New Source Review reforms1 are good forthe environment, good for energy security, and good for the economy.
I think it is important for my colleagues to understand that the EPA’s [En-vironmental Protection Agency] New Source Review reforms will improveair quality and benefit the environment. EPA has already done the envi-ronmental analysis. It shows that four of the five provisions in the finalrule will reduce air pollution. That is correct. I said “will reduce air pollu-
Christopher Bond, address before the U.S. Senate, Washington, DC, January 21, 2003.
75
1. The New Source Review is a program that regulates the construction and maintenance of majoremitting industrial facilities. The proposed reforms to the program were passed in 2003.
AI Air Pollution INT 8/17/04 9:19 AM Page 75

tion.” The other provision will have no significant effect on air quality.NSR will no longer stand as a barrier to facilities installing state-of-the-
art pollution control technology. Anybody who has been around Wash-ington very long knows the law of unintended consequences. We dothings we think are going to help, and they turn out to be a hindrance.
The New Source Review, as it has worked, has been a hindrance be-cause companies cannot make routine improvements and upgrades totheir facilities to make them operate more efficiently, take less energy,burn less fuel, emit less pollution or polluting substances, anywhere fromvolatile organic compounds to the other emissions from powerplants.They do that because the New Source Review says that anytime you wantto do anything significant on a major plant, you have to go through thewhole process. It takes a very long time, and you are required to makevery significant upgrades beyond what the available dollars in the com-pany would sustain.
The NSR [New Source Review] reforms will . . . cuthazardous air pollutants and ozone-depletingsubstances. Our families will suffer fewer cases ofpremature mortality, asthma, and other respiratorydiseases.
The incremental continuing improvements, day by day or actuallymonth by month or even year by year, cannot be made because of NSR.If you change it the way the EPA administrator has proposed, NSR will nolonger stand as a barrier to facilities installing state-of-the-art pollutioncontrol technology.
Pollution reductionThe NSR reforms that EPA has proposed will actually cut emissions of tensof thousands of tons per year of volatile organic compounds. NSR reformswill reduce ground-level ozone and smog. The NSR reforms will also cuthazardous air pollutants and ozone-depleting substances. Our familieswill suffer fewer cases of premature mortality, asthma, and other respira-tory diseases.
I would say further that EPA’s NSR reforms are good for the Nation’senergy security. Why? Simply because they will allow facilities to installmodern technologies which use energy more efficiently. We all ought tobe able to agree on that. Using energy efficiently conserves energy, andreduces the polluting byproducts of energy production. The facilities willbe able to reduce their energy consumption, reduce their dependence onforeign energy sources, and reduce our Nation’s dependence on foreignenergy supplies.
What is wrong with that? In our current troubled times, we shouldnot stand in the way of any proposal which reduces our dependence onforeign and Middle Eastern oil. I would also say that the EPA NSR reformsare good for the economy. Companies would now be able to make rapid
76 At Issue
AI Air Pollution INT 8/17/04 9:19 AM Page 76

changes to meet their changing business climates without getting boggeddown in time-consuming government red tape.
Company flexibilityThe reforms will continue to protect the environment while giving com-panies the flexibility they need to get new products to the market quickly.We have all of the elements that should go into a forward-looking envi-ronmental program. We have made great progress, but we have also de-veloped glitches in our system, and anybody who has thought about thesystem knows that we need to make it more efficient. We need to ratio-nalize it. We need to give it flexibility so environmental improvementscan be made with the least hassle.
I am talking about environmental improvements. That is what thisNSR proposal does. It allows not only energy conservation, improved eco-nomic performance, but environmental progress as well. What is wrongwith that?
I have yet to hear what is the objection to providing better environ-mental performance in a way that is flexible, that encourages companiesto move forward. This is such a good idea that the last administrationsupported it. You heard me right. This was one of their proposals.
The reforms EPA finalized this winter were actually proposed in 1996during the Clinton Administration by EPA Administrator Carol Browner. Ithought it was a good idea then; I think it is a good idea now. The onlychange is there is a new administration, with a different President [GeorgeW. Bush].
I hope this is not the reason behind some of my colleagues seeking toraise the issue and challenge it. If it was a good idea in the Clinton Ad-ministration, does it become a bad idea in the Bush Administration? Idon’t think so.
I think we are on the right track with what the Clinton Administra-tion started. The NSR reforms are good for the environment, they aregood for energy security, and they are good for the economy.
Pollution Regulation Reforms Will Improve Air Quality 77
AI Air Pollution INT 8/17/04 9:19 AM Page 77
Christopher G. Reuther, “Winds of Change,” Environmental Health Perspectives, vol. 108, April 2000.
78
1111A Global Approach
to Pollution Regulation Is NecessaryChristopher G. Reuther
Christopher G. Reuther is a contributing writer for EnvironmentalHealth Perspectives.
Around the world there is a growing recognition that air pollutionproblems cannot be solved locally. Instead, because of the waypollution flows across international borders, many countries areacknowledging that prevention efforts need to be coordinatedglobally. There have been a number of international agreementson limiting transported air pollutants, and many other discus-sions and agreements on limiting transported air pollutants aretaking place around the world, as international governments in-creasingly approach air pollution in a borderless context.
The acid rain in Lorraine comes partially from Spain. Similarly, abouthalf the acid rain that falls on Canada originates in the United States,
as does a large portion of the ground-level ozone found there. Air pollu-tion never respects international boundaries, but in [2000] a spate ofmeetings and agreements has shown international governments to bemore willing than ever to try to limit the amount of their air pollutionthat drifts into other countries. Recently, nations have begun workingharder to identify who exports and who imports the air pollutants thatflow across international borders—and who should bear the burden ofcleaning the global atmosphere.
In February 2000, the United States and Canada began discussinghow to expand their existing bilateral air pollution agreement to includeozone. At a March 20–25 meeting of the United Nations EnvironmentProgramme (UNEP) in Bonn, Germany, an agreement on persistent or-ganic pollutants (POPs) was discussed. The goal is to sign a POPs conven-tion in May 2001, which would effectively result in the first-ever global
AI Air Pollution INT 8/17/04 9:19 AM Page 78

convention on transboundary air pollution.1 Perhaps even more signifi-cant, last December [1999] the nations of the United Nations EconomicCommission for Europe (UNECE) signed a comprehensive agreement tolimit the export of pollutants that cause several environmental prob-lems—acid rain, ground-level ozone, and the eutrophication of waters. . . .
Sulfur dioxide (SO2), nitrogen oxides (NOx), volatile organic com-pounds (VOCs), POPs, particulate matter, and heavy metals are all now be-ing discussed in international forums. Unlike greenhouse gases and ozone-depleting substance—for which global agreements exist—many of theseair pollutants were once thought to be problems that could be solved lo-cally, where the effects occur. Behind this policy shift are increasing emis-sions in some parts of the world, better monitoring, and an improved un-derstanding of air pollution transport. “There is a growing recognition thatfor these air issues, any national government that attempts to deal withthe problem alone will meet with only limited success because they are thekinds of problems that require collective action,” says John Buccini, direc-tor of the Commercial Chemicals Evaluation Branch of EnvironmentCanada and chairman of the UNEP POPs convention negotiations.
“There is a growing recognition that for these airissues, any national government that attempts todeal with the problem alone will meet with onlylimited success.”
“The problems that we are facing are becoming less of a regional char-acter . . . and more and more of a northern hemispheric or global charac-ter,” says Henning Wuester, a UNECE official and member of that group’ssecretariat for its Convention on Long-Range Transboundary Air Pollu-tion. “There is now science showing that pollution travels much furtherthan previously anticipated.” Some models have suggested, for example,that POPs released into the air in China will show up in Canada three tofive days later.
According to the World Health Organization (WHO), air pollutioncauses 2.7 million deaths per year. While many of these are caused by in-door air pollution, the WHO estimates that just eliminating ground-levelozone could save 180,000 lives annually (including 5,000 in the UnitedSates) and reduce suffering for millions of people with asthma and otherrespiratory ailments. Reductions in emissions of sulfur oxides and partic-ulate matter could save 500,000 lives, according to the WHO. These com-mon air pollutants can also cause defoliation of trees and acidification ofsoil, as well as other detrimental ecosystem effects. The Ozone TransportAssessment Group of the U.S. Environmental Protection Agency (EPA) es-timates on their Frequently Asked Questions site that ground-level ozonecauses damage to U.S. crops totaling $2–3 billion each year.
A Global Approach to Pollution Regulation Is Necessary 79
1. The Stockholm Agreement on Persistent Organic Pollutants (POPs) was signed by 150 nations,including the United States, in May 2001, and a number of these nations have begun to implementthe agreement.
AI Air Pollution INT 8/17/04 9:19 AM Page 79

The Gothenburg ProtocolSuch problems were the target of the UNECE when it met in December1999 in Gothenburg, Sweden, to sign its new agreement for controllingemissions of SO2, NOx, ammonia, and VOCs. Under the Gothenburg Pro-tocol to Abate Acidification, Eutrophication, and Ground-Level Ozone,27 nations (including the United States and Canada) agreed that interna-tional transport of these pollutants is significant enough to warrant in-ternational action. The European parties to this accord went a step furtherby agreeing that new emissions reductions should be mandated in theagreement based on the levels necessary to protect human health andecosystems in specific downwind areas. That presents a departure fromother international agreements, which have been based on countries’ re-ducing emissions by a percentage that they deem economically or tech-nically feasible.
But the accord is unique in other ways, too. “It’s really a very importantagreement in the field of international environmental policy making forseveral reasons,” says Wuester. One reason is that the agreement involvesmany nations and covers a very wide geographic area including—despitethe UNECE’s name—Canada and the United States. Since Russia is also oneof the 55 UNECE member states, agreements formed within this body havethe potential to effect the vast majority of the Northern Hemisphere.
The Gothenburg Protocol—which [as of November 2003] has notbeen signed by Russia, Ukraine . . . or several other important polluters—is the eighth addition to the UNECE’s Convention on Long-Range Trans-boundary Air Pollution, which was originally signed in 1979. Together,these protocols represent the world’s largest international set of agree-ments on transported air pollutants to date. UNECE nations have agreedto limits on SO2 (1987, 1994, 1999), NOx (1991, 1999), VOCs (1997,1999), heavy metals (1998), POPs (1998), and ammonia (1999). Theframework convention to these agreements was signed by 44 nations.
According to the World Health Organization (WHO),air pollution causes 2.7 million deaths per year.
The Gothenburg Protocol is unique among these and other agree-ments also because it includes limits on multiple pollutants that havemultiple effects. It recognizes that different environmental problems canbe interconnected. “There was a common feature to the issues treated inthe modeling work for this protocol,” says Wuester. “Either the pollutantswere common to a problem or the effects were common to a pollutant.”
Addressing ground-level ozone in the protocol meant limiting emis-sions of NOx and VOCs, which react to form ozone in sunlight. But NOxalso contributes to eutrophication (uncontrolled growth of plankton oralgae), so that problem is included as well. Including eutrophication inthe agreement also meant limiting SO2 emissions, which along with NOxlead to acidification of soil and water. Ammonia is also included becauseit too can raise the pH of soil and water.
For each of these problems, critical load maps were drawn for the
80 At Issue
AI Air Pollution INT 8/17/04 9:19 AM Page 80

whole of Europe showing the maximum pollutant concentration thateach area could tolerate before detrimental environmental effects wouldbe seen. These were coupled with deposition maps showing how muchpollution flows into each area and where it originates. Finally, the costsof abatement were included so that the least expensive solution could befound. . . .
The Gothenburg Protocol is unique among these andother agreements . . . because it includes limits onmultiple pollutants that have multiple effects.
While the modeling work used in the Gothenburg Protocol has beenpraised for its completeness, it only applies to Europe. For other parties tothe protocol, namely the United States and Canada, no single model hasemerged for finding the most cost-effective way to protect ecosystemsand human health. “There are similar models for North America, thoughI guess it’s fair to say that Canadian and U.S. scientists have not come upwith one single model that they agree on,” says Wuester.
Across the pondSince North American emissions reductions were not dictated by themodel used for European countries, Canada and the United States havebeen left to decide for themselves what levels of reduction should be in-cluded for them in the Gothenburg Protocol. According to Draper, forCanada and the United States, the commitments in the latest protocol de-fer to ongoing negotiations between the two nations. These negotiationsare called for by the Canada-U.S. Air Quality Agreement, which the twonations signed in 1991. While that agreement was conceived to controlacid rain, it created a framework for addressing other air pollution prob-lems as well. In April of 1997, President Bill Clinton and Canadian PrimeMinister Jean Chrétien decided the scope of the agreement should bebroadened to include tropospheric ozone and particulate matter. First onthe agenda is ozone. Negotiations to control this pollutant are ongoing,and any agreement resulting from those talks will also be integrated intothe Gothenburg Protocol. . . .
In stark contrast to the situation in Europe where Spain, for example,will actually be making emissions reductions to protect other nationssuch as France, neither the United States nor Canada will make reduc-tions specifically to protect the other. “We are not going to claim thatwe’ll do more in the United States to help Canada than we would be do-ing anyway to help ourselves,” says John Bachmann, the associate direc-tor for science/policy and new programs in the EPA’s Office of Air Qual-ity Planning and Standards, “but hopefully with this agreement we’llachieve some harmonization in the transboundary region.”
So, while the Gothenburg Protocol will be a legally binding treatywith new emissions reductions for the nations of Europe, it will not be forthe United States. “For us, this is an executive agreement,” Bachmannsays. “We can go up to and including things that are already mandated
A Global Approach to Pollution Regulation Is Necessary 81
AI Air Pollution INT 8/17/04 9:19 AM Page 81

by our law. We can’t go beyond that. Otherwise, we’d have to go to Con-gress to get it approved, and then it’s no longer an executive agreement,it’s a treaty. We’re not doing a treaty here.”. . .
But that does not mean that the North American countries have re-jected the European loads-based approach outright. Bachmann says thatsome elements of a critical loads approach are integrated in the U.S. re-gional haze program as well as some water quality initiatives. “InCanada,” says Draper, “we’re homing in on the geographic source regionthat really needs to be controlled to move us most effectively towardlooking at critical loads. I think there’s a movement in both the UnitedStates and Canada to start to look at a much more integrated, compre-hensive approach on air quality management, with a multipollutants andmultieffects strategy.”
The world versus POPsNew research is showing that some pollutants, including POPs, are carriedmuch farther than previously thought. “There’s been a fair amount ofwork done in North America, for example,” says Buccini, “that showswhen they’re tilling the fields in the cotton-growing region of the south-ern United States—[in places] where they used toxaphene [a pesticidenow classified as a POP] for many years—within three or four days you’llget spikes of toxaphene in rather predictable areas of the northern UnitedStates and Canada.”
Also, POPs can be deposited in one country and then taken into an-other by air, water, or animals that ingest them. Wuester says this“grasshopper effect” makes it difficult to integrate POPs transport into thetype of model on which the Gothenburg Protocol was based.
In North America, the U.S.-Canadian Great Lakes Water Quality Agree-ment has addressed POPs on a small regional level for over 25 years, whileUNECE nations signed an agreement on them in 1998 that has not yet goneinto force. Other bilateral and regional conventions exist as well. However,many feel an even broader agreement on POPs is needed. At a January–February 1997 meeting in Nairobi, Kenya, the UNEP Governing Councilconcluded that “a global, legally binding instrument is required to reducethe risks to human health and the environment [posed by POPs].”2. . .
“People are saying the nature of the problem mayvary from country to country or region to region, butthere is a basis here for taking global action.”
“People are saying the nature of the problem may vary from countryto country or region to region, but there is a basis here for taking globalaction,” says Buccini. “There are 36 countries that are part of the [UN]ECE[protocol on POPs], but there’s somewhere around 115 or 120 countriesthat are participating in the [UNEP] negotiations. For a lot of countries
82 At Issue
2. In May 2001 the Stockholm Agreement on Persistent Organic Pollutants was signed.
AI Air Pollution INT 8/17/04 9:19 AM Page 82

there is no existing agreement.” Thus, says Buccini, UNEP has an oppor-tunity to drastically reduce worldwide emissions of POPs into the envi-ronment. If most of the countries involved in the negotiations ratify theagreement, the UNEP POPs convention could become the first truly globalaccord to address air pollutants that are deposited across boundaries.
The ultimate goal, says UNEP, is to eliminate all discharges, emis-sions, and losses of POPs around the world. On its “most wanted” list sofar are 10 intentionally manufactured chemicals plus dioxins and furans,which are released chiefly as by-products of waste incineration. The 10manufactured POPs, for the most part pesticides, include DDT and poly-chlorinated biphenyls. “With the exception of DDT, I think we are goingto see . . . cessation of production,” says Buccini. Countries that dependon DDT for controlling disease vectors such as mosquitoes that carrymalaria will likely be allowed to continue limited use under the conven-tion, he says.
The 1998 UNECE POPs agreement, which covers 16 substances, willbe used as a stepping stone to the UNEP agreement. “Those countrieswithin the UNECE that are parties to the POPs protocol will be trying toreflect their commitments under that protocol in the global instrument,”says Buccini.
Emulating EuropeThe European lead is being followed elsewhere as well. The World Bankis funding modeling work for air pollution transport in Asia that emulatesthe RAINS model used for the Gothenburg Protocol. Simultaneously,UNEP is collaborating with the Association of South East Asian Nations tofight the transport of haze from forest fires to nearby nations.
There are other efforts under way to protect nations from each oth-er’s air pollution. In North America, a trilateral agreement on air pollu-tion is being formed under the auspices of the North American Free TradeAgreement. Regional agreements that protect the Great Lakes and theGeorgia Basin ecosystem of southwest British Columbia and northwestWashington State have also been signed. In Europe, there are agreementsto protect the Mediterranean and North Seas.
In addition to these are a smattering of local initiatives—agreementsformed between towns or regions across the border from one another. Forexample, residents of Sault Sainte Marie, Michigan, were assisted by theEPA [Environmental Protection Agency] in reducing the emissions from asteel mill across the Canadian border. “We’ve had some real success withthese initiatives at the city and county level,” says Stephen Rothblatt,chief of the Air Programs Branch for EPA Region 5.
“In some locations we’ve got a whole bunch of different programsworking at once,” says Coronado. “The problem with this system is thatyou have all these pieces, and the question becomes where do they all fit.It’s really hard to know. . . . People don’t really know where to look whenthey are facing these issues.” And besides creating unnecessary confusion,redundancy and waste in these programs is likely as well, he says.
“What we’re working toward is to be able to look at transboundary airproblems in a borderless context,” says Draper. Research is constantlysuggesting that such an approach is necessary. For example, metals trans-
A Global Approach to Pollution Regulation Is Necessary 83
AI Air Pollution INT 8/17/04 9:19 AM Page 83

port from warm to cool climates is suggested as an explanation for why83% of Inuit men and 73% of Inuit women in the eastern Canadian Arc-tic were found to have daily intakes of mercury above WHO guidelines,according to research by scientists from McGill University in Québec,Canada, published in the March 1997 issue of EHP. The UNECE adopteda protocol on heavy metals at the same time it adopted its POPs protocol,and Buccini sees it as likely that UNEP may follow suit.
Although recent UNECE protocols are being lauded and imitated,Wuester cautions that they are still largely untested. “Only the imple-mentation itself will show us how important the agreements are for theenvironment,” he says.
84 At Issue
AI Air Pollution INT 8/17/04 9:19 AM Page 84

85
Organizations to Contact
The editors have compiled the following list of organizations concerned withthe issues debated in this book. The descriptions are derived from materialsprovided by the organizations. All have publications or information availablefor interested readers. The list was compiled on the date of publication of thepresent volume; names, addresses, phone and fax numbers, and e-mail ad-dresses may change. Be aware that many organizations take several weeks orlonger to respond to inquiries, so allow as much time as possible.
American Council on Science and Health (ACSH)1995 Broadway, 2nd Floor, New York, NY 10023-5860(212) 362-7044 • fax: (212) 362-4919e-mail: [email protected] • Web site: www.acsh.org
ACSH is a consumer education consortium concerned with, among other top-ics, issues related to the environment and health. The council publishes thequarterly Priorities magazine and position papers such as “Global ClimateChange and Human Health” and “Corporate Greed or Children’s Health?”
American Lung Association61 Broadway, 6th Floor, New York 10006(212) 315-8700Web site: www.lungusa.org
The American Lung Association is a voluntary health organization dedicatedto fighting lung disease in all its forms. It publishes numerous newsletters andpapers dealing with lung health, including “The Weekly Breather” andAsthma Magazine.
Canadian Centre for Pollution Prevention (C2P2)100 Charlotte St., Sarnia, ON N7T 4R2 Canada(800) 667-9790 • fax: (519) 337-3486e-mail: [email protected] • Web site: www.c2p2online.com
The Canadian Centre for Pollution Prevention is a nonprofit pollution pre-vention resource. It offers easy access to national and international informa-tion on air pollution and prevention through a search service, hard copy dis-tribution, an extensive Web site, online forums, publications, and customizedtraining. Among its publications are the Practical Pollution Training Guide andAt the Source, C2P2’s newsletter published three times a year.
Cato Institute1000 Massachusetts Ave. NW, Washington, DC 20001-5403(202) 842-0200 • fax (202) 842-3490e-mail: [email protected] • Web site: www.cato.org
The Cato Institute is a libertarian public policy research foundation dedicatedto limiting the role of government and protecting civil liberties. It disapprovesof Environmental Protection Agency regulations, considering them too strin-gent. The institute publishes the quarterly magazine Regulation, the bimonthly
AI Air Pollution INT 8/17/04 9:19 AM Page 85

Cato Policy Report, and numerous papers dealing with air pollution, including“Why States, Not EPA, Should Set Pollution Standards” and “The EPA’s CleanAir-ogance.”
Clean Air Task Force (CATF)77 Summer St., 8th Floor, Boston, MA 02110(617) 292-0234e-mail: [email protected] • Web site: www.catf.us
CATF is a nonprofit organization dedicated to restoring clean air and ahealthy environment through scientific research, public education, and legaladvocacy. It publishes fact sheets and reports about air pollution, including“Children at Risk” and “Death, Disease, and Dirty Power.”
Environmental Defense Fund (EDF)257 Park Ave. S., New York 10010(800) 684-3322 • fax: (212) 505-2375e-mail: [email protected] • Web site: www.edf.org
EDF is a leading national nonprofit organization representing more thanthree hundred thousand members. It attempts to link science, economics,and law to cost-effective solutions to environmental problems. The organiza-tion is dedicated to protecting the environmental rights of all people, includ-ing access to clean air.
Environmental Protection Agency (EPA)Ariel Ross Building, 1200 Pennsylvania Ave. NW, Washington, DC 20460(202) 272-0167e-mail: [email protected] • Web site: www.epa.gov
The EPA is the federal agency in charge of protecting the environment andcontrolling pollution. The agency works toward these goals by assisting busi-nesses and local environmental agencies, enacting and enforcing regulations,identifying and fining polluters, and cleaning up polluted sites. It publishesthe monthly EPA Activities Update and numerous periodic reports.
Environment Canada351 St. Joseph Blvd., Gatineau, QC K1A 0H3 Canada(819) 997-2800 • fax: (819) 953-2225e-mail: [email protected] • Web site: www.ec.gc.ca
Environment Canada is a department of the Canadian government dedicatedto achieving sustainable development in Canada through environmental pro-tection and conservation. It publishes reports and fact sheets on a variety ofenvironmental issues, including air pollution and climate change.
Foundation for Clean Air Progress (FCAP)1801 K St. NW, Suite 1000L, Washington, DC 20036(800) 272-1604e-mail: [email protected] • Web site: www.cleanairprogress.org
FCAP is a nonprofit organization that believes that the public remains un-aware of the substantial progress that has been made in reducing air pollu-tion. It represents various sectors of business and industry in providing infor-mation to the public about improving air quality trends. In support of its callfor less government regulation, FCAP publishes numerous studies and reportsdemonstrating that air pollution is on the decline.
86 At Issue
AI Air Pollution INT 8/17/04 9:19 AM Page 86

Friends of the Earth1025 Vermont Ave. NW, Washington, DC 20005-6303(202) 783-7400 • fax: (202) 783-0444e-mail: [email protected] • Web site: www.foe.org
Friends of the Earth is a national advocacy organization dedicated to the pro-tection of the planet for future generations. It publishes the quarterly Friendsof the Earth newsmagazine and Atmosphere, a report focusing on actions takento preserve the ozone layer.
Heritage Foundation214 Massachusetts Ave. NE, Washington, DC 20002-4999(800) 546-2843 • fax: (202) 546-8328e-mail: [email protected] • Web site: www.heritage.org
The Heritage Foundation is a conservative think tank that supports free en-terprise and limited government. Its researchers criticize EPA overregulation.The foundation’s publications, such as the quarterly Policy Review, includestudies on the effectiveness of air pollution regulation.
INFORM120 Wall St., New York, NY 10005-4001(212) 361-2400 • fax: (212) 361-2412e-mail: [email protected] • Web site: www.informinc.org
INFORM is an independent research organization that examines the effects ofbusiness practices on the environment and on human health. The collectivegoal of its members is to identify ways of doing business that ensure envi-ronmentally sustainable economic growth. It publishes the quarterly news-letter INFORM Reports and fact sheets and reports on how to protect our nat-ural resources and safeguard public health.
Reason Foundation3415 S. Sepulveda Blvd., Suite 400, Los Angeles, CA 90034(310) 391-2245 • fax: (310) 391-4395e-mail: [email protected] • Web site: www.reason.org
The foundation promotes individual freedoms and free-market principles. Itsresearchers believe that air quality is improving, and that the dangers ofozone depletion and global warming are myths. It publishes the monthlymagazine Reason.
Sierra Club85 Second St., 2nd Floor, San Francisco, CA 94105-3441(415) 977-5500 • fax: (415) 977-5799e-mail: [email protected] • Web site: www.sierraclub.org
The Sierra Club is a grassroots organization with chapters in every state. Itpromotes the protection and conservation of natural resources. In addition tobooks and fact sheets, it publishes the bimonthly magazine Sierra and thePlanet newsletter, which appears several times a year.
World Resources Institute (WRI)10 G St. NE, Suite 800, Washington, DC 20002(202) 729-7600 • fax: (202) 729-7610e-mail: [email protected] • Web site: www.wri.org
Organizations to Contact 87
AI Air Pollution INT 8/17/04 9:19 AM Page 87

WRI provides information, ideas, and solutions to global environmentalproblems. Its mission is to encourage society to live in ways that protectEarth’s environment for current and future generations. The institute’s pro-gram attempts to meet global challenges by using knowledge to catalyze pub-lic and private action. WRI publishes the reports Climate, Biodiversity, andForests: Issues and Opportunities Emerging from the Kyoto Protocol and ClimateProtection Policies: Can We Afford to Delay?
Worldwatch Institute1766 Massachusetts Ave. NW, Washington, DC 20036-1904(202) 452-1999 • fax: (202) 296-7365e-mail: [email protected] • Web site: www.worldwatch.org
Worldwatch is a nonprofit public policy research organization dedicated toinforming policy makers and the public about emerging global problems andtrends. It publishes the bimonthly World Watch magazine and several policypapers.
Web Site
Clean Air NowWeb site: www.cleanairnow.org
Clean Air Now is an alliance of citizen-funded public interest advocacy orga-nizations that aims to protect public health from air pollution through in-formed action. It publishes numerous reports on air pollution, including Dan-ger in the Air: Unhealthy Levels of Smog in 2003, and Darkening Skies: TrendsToward Increasing Power Plant Emissions.
88 At Issue
AI Air Pollution INT 8/17/04 9:19 AM Page 88

Bibliography
BooksPamela S. Chasek, ed. The Global Environment in the Twenty-First Century:
Prospects for International Cooperation. Tokyo: United Na-tions University Press, 2000.
Judith A. Cherni Economic Growth Versus the Environment: The Politics ofWealth, Health, and Air Pollution. New York: Palgrave, 2002.
Robert G. Darst Smokestack Diplomacy: Cooperation and Conflict in East-West Environmental Politics. Cambridge, MA: MIT, 2001.
Terry Dinan and An Evaluation of Cap-and-Trade Programs for Reducing U.S. Christian Spoor Carbon Emissions. Washington, DC: Congress of the
United States, Congressional Budget Office, 2001.
Francis Drake Global Warming: The Science of Climate Change. NewYork: Oxford University Press, 2000.
Indur Goklany Clearing the Air: The Real Story of the War on Air Pollution.Washington, DC: Cato Institute, 1999.
Hugh S. Gorman Redefining Efficiency: Pollution Concerns, Regulatory Mecha-nisms, and Technological Changes in the U.S. Petroleum In-dustry. Akron, OH: University of Akron Press, 2001.
Wyn Grant, The Politics of Improving Urban Air Quality. Northampton, Anthony Perl, and MA: Edward Elgar, 1999.Peter Knoepfel, eds.
S.T. Holgate et al., eds. Air Pollution and Health. London: Academic Press, 1999.
Jane Q. Koenig Health Effects of Ambient Air Pollution: How Safe Is the AirWe Breathe? Boston: Kluwer Academic, 2000.
Gordon McGranahan Air Pollution and Health in Rapidly Developing Countries.and Frank Murray, eds. Sterling, VA: Earthscan, 2003.
Patrick J. Michaels The Satanic Gases: Clearing the Air About Global Warming.and Robert Balling Jr. Washington, DC: Cato Institute, 2000.
National Assessment Climate Change Impacts on the United States: The Potential Synthesis Team Consequences of CIimate Variability and Change. Washing-
ton, DC: U.S. Global Change Research Program, 2000.
Gunter Pauli Upsizing: The Road to Zero Emissions, More Jobs, More Income, and No Pollution. Sheffield, England: Greenleaf, 2000.
David Wheeler Racing to the Bottom? Foreign Investment and Air Pollutionin Developing Countries. Washington, DC: World Bank,Development Research Group, Infrastructure and Envi-ronment, 2001.
89
AI Air Pollution INT 8/17/04 9:19 AM Page 89

PeriodicalsMartin Beniston “Climactic Change: Possible Impacts on Human Health,”
Swiss Medical Weekly, 2002.
Katherine Bolt et al. “Minute Particles, Major Problems: New Policies ShowPromise for Saving Millions of Lives by Clearing the Airin the Developing World,” Forum for Applied Research andPublic Policy, Fall 2001.
Bert Brunekreef and “Air Pollution and Health,” Lancet, October 2002.Stephen T. Hotgate
Peter Burney “Air Pollution and Asthma: The Dog That Doesn’t Al-ways Bark,” Lancet, March 1999.
Marla Cone “Vehicles Blamed for a Greater Share of Smog,” Los Ange-les Times, October 30, 1999.
Paula Court “Do You Jog in Smog? Air Pollution Is Another Factor toConsider in Your Fitness Program,” American Fitness,May/June 2002.
Jane K. Dixon “Kids Need Clean Air: Air Pollution and Children’sHealth,” Family Community Health, January 2002.
Gregg Easterbrook “Environmental Doomsday: Bad News Good, GoodNews Bad,” Brookings Review, Spring 2002.
A. Denny Ellerman “Clearing the Polluted Sky,” New York Times, May 1, and Paul L. Joskow 2001.
Foundation for “Air Pollution Plummets as Energy Use Climbs,” January Clean Air Progress 2002. www.cleanairprogress.org.
Issues and “Air Pollution,” March 1999.Controversies On File
Matthew E. Kahn “The Beneficiaries of Clean Air Act Regulation,” Regula-tion, Spring 2003.
Ben Lieberman “The Counterproductive Clean Air Act,” CEI Update,March 2000.
Randall Lutter “Clean Air and Dirty Science,” Washington Times, March25, 2002.
Atrick J. Michaels “Global Warming Warnings: A Lot of Hot Air,” USA To-day Magazine, January 2001.
Benoit Nemery, “The Meuse Valley Fog of 1930: An Air Pollution Peter H.M. Hoet, and Disaster,” Lancet, March 2001.Abderrahim Nemmar
Charles W. Petit “A Darkening Sky (Effects of Pollution over Asia),” U.S.News & World Report, March 17, 2003.
Eric Pianin “Study Ties Pollution, Risk of Lung Cancer Effects Simi-lar to Secondhand Smoke,” Washington Post, March 6,2002.
Gary Polakovic “Smog Feared in Power Buildup,” Los Angeles Times, July16, 2001.
90 At Issue
AI Air Pollution INT 8/17/04 9:19 AM Page 90

Janet Raloff “Air Sickness: How Microscopic Dust Particles Cause Sub-tle but Serious Harm,” Science News, August 2003.
Jonathan Rauch “America Celebrates Earth Day 1970—for the 31stTime,” Reason Online, April 29, 2000. www.reason.com.
Andrew C. Revkin “Record Ozone Hole Fuels Debate on Climate,” New YorkTimes, October 10, 2000.
Joel Schwartz “Air Scare: Does Air Pollution Cause Asthma?” February20, 2002. www.rppi.org.
Joel Schwartz “Grading the Graders: How Advocacy Groups’ ‘ReportCards’ Mislead the Public on Air Pollution and UrbanTransport,” December 2001. www.rppi.org.
Katharine Q. Seelye “Study Sees 6,000 Deaths from Power Plants,” New YorkTimes, April 18, 2002.
UC Berkeley “The Great Indoors,” February 1999.Wellness Letter
U.S. Environmental “Smog: Who Does It Hurt?: What You Need to Know Protection Agency About Ozone and Your Health,” July 1999.
www.epa.gov.
Christina Ward “U.S. Unprepared for Global Warming’s Health Effects,”June 2001. www.disasterrelief.org.
Bibliography 91
AI Air Pollution INT 8/17/04 9:19 AM Page 91

acid rain, 30Acid Rain Program, 30air pollutants
asbestos, 17–18, 63biological, 18, 61–62carbon monoxide, 14, 29, 34, 57–58combustion by-products, 17house dust, 62–63lead, 13, 15, 29–30, 63major, 7, 13motor vehicle emissions, 14, 23, 29nitrogen oxides, 14, 15, 26–27, 34ozone, 13, 21, 22, 27–28, 34, 39–40particulate matter, 13–14, 21, 22,
28–29, 34programs to reduce, 31–32radon, 18, 63, 64reductions in, 34–35sulfur dioxide, 14, 28, 34tobacco smoke, 16–18volatile organic compounds, 17, 57,
60–61, 64air pollution
in Asia, 66–69death toll from, 7–8from diesel engines, 22global approach to, is necessary, 78global warming caused by
will harm human health, 43–48con, 49–55
international agreements to control,15–16
is declining, 38–39misperceptions about, 35–36perception vs. reality of, 34–35from power plants, 21–22prevalence of, 37–38regional, 15threatens human health, 20–24threat from, is exaggerated, 33–42see also indoor air pollution;
outdoor air pollutionAir Pollution Control Act (1955), 12air quality
Americans’ perceptions about, 35–36has improved, 7–8, 19, 25–32, 41is not up to standards, 23–24monitoring of, 7
regulation reformswill improve, 75–77will worsen, 70–74
air toxins, 30–32see also air pollutants
American Council on Science andHealth (ACSH), 50–51
American Lung Association, 7, 9, 36,37–39, 40
asbestos, 17–18, 63Asia, 66–69automobile emissions, 14, 23, 29,
38–39
Bachmann, John, 81–82benzene, 31Bond, Christopher, 75Bower, John, 56Brookings Institution, 8Buccini, John, 79, 82, 84Bush, George W., 9
Calderera, Michael, 59Canada-U.S. Air Quality Agreement
(1991), 81cancer, 23carbon monoxide, 14, 29, 34, 57–58children, 19China
air quality in, 8, 67–68changing weather patterns in, 69
chlorination by-products, 60–61Clean Air Act (1970), 7, 12
criticisms of, 8–9EPA responsibilities under, 26New Source Review provisions, 9,
70–77reforms of
will improve air quality, 75–77will worsen air quality, 70–74
Clean Air Act Amendments (1990), 15climate change. See global warmingClinton, Bill, 49combustion by-products, 17
deathsfrom air pollution, 7–8, 79heat-related, 44–45
Index
92
AI Air Pollution INT 8/17/04 9:19 AM Page 92

in winter vs. summer, 54diesel engines, 22, 35diseases, 52–53Donora catastrophe, 7, 12drought, 46dust, 62–63dust mites, 61–62, 64
Earth Policy Institute, 7Easterbrook, Gregg, 8Edwards, John, 70El Niño, 47, 67, 69environmentalists, exaggerated claims
by, 33, 36–42Environmental Protection Agency
(EPA), 7air quality standards set by, 25critics of, 8–9emissions standards of, 31–32ozone monitoring by, 34responsibilities of, under Clean Air
Act, 26role of, 12–13
Fischlowitz-Roberts, Bernie, 7–8flooding, 46formaldehyde, 17, 60fossil fuels, 12, 17Franke, Deborah, 65
gas heaters, 57, 58–60, 64gas stoves, 59–60, 64global warming
benefits of, 55hotspots, 44–47recent and projected, 44will harm human health, 43–48
con, 49–55Gore, Al, 49–50Gothenburg Protocol, 80–81greenhouse gases, 48
see also global warmingGreiner, Thomas, 59
hazardous air pollutants (HAPs),22–23
health effectsof air pollution, 7–8, 11–24of asbestos, 17–18of biologic contaminants, 18of carbon monoxide, 14, 57–58of combustion by-products, 17of global warming
will be harmful, 43–48con, 49–55
of indoor air pollution, 56–65
of nitrogen dioxide, 14of ozone, 13, 21, 39–40of particulate matter, 13–14, 21of population growth, 51of radon, 18of sulfur dioxide, 14of tobacco smoke, 17of volatile organic compounds, 17
Healthy People 2000, 19heart disease, 12heat waves, 44–45Homa, David, 11housecleaning methods, 65hurricanes, 54–55hydrochloric acid, 21–22
India, 68indoor air pollution
is major health risk, 56–65reducing, 18, 63–65sources of, 16–18, 57–65
infectious diseases, 52–53international pollution agreements,
78–84
Jacobson, Mark, 69
Kiehl, Jeff, 68Kirkwood, John, 9Kovats, R. Sari, 43Kyoto protocol, 49
lead, 13, 15, 29–30, 63Lewis, Robert G., 62–63London, England, 12lung disease, 12, 13, 17–18
malaria, 47, 52, 53malnutrition, 46, 51–52Mannino, David, 11Manuel, John, 56Marksen, Craig S., 8–9Maximum Achievable Control
Technology (MACT), 23Menon, Surabi, 69mercury, 22molds, 61–62, 64Moore, Thomas Gale, 49Motor Vehicle Air Pollution Act
(1965), 12motor vehicle emissions, 14, 23, 29,
38–39Myer, Pamela, 11
Naeher, Luke, 11National Ambient Air Quality
Index 93
AI Air Pollution INT 8/17/04 9:19 AM Page 93

Standards (NAAQS), 7, 20National-Scale Air Toxins Assessment
(NATA), 23New Source Review (NSR) provisions, 9
will improve air quality, 75–77will worsen air quality, 70–74
nitrogen oxides, 14, 15, 26–27, 34nonroad heavy-duty diesel engines
(HDDEs), 22North American Free Trade
Agreement (NAFTA), 16Northeast Ozone Transport Region, 15
outdoor air pollutioncauses of, 12–14controlling, 14–16spread of, 15
ozone, 13, 21, 22, 27–28, 34, 36–40Ozone Transport Assessment Group
(OTAG), 15
parasitic diseases, 52–53particulate matter (PM), 13–14, 21,
22, 28–29, 34Patz, Jonathan A., 43Petit, Charles W., 66polybrominated duphenyl ethers
(PBDEs), 61power plants, 21–22Public Interest Research Group
(PIRG), 36, 38, 40, 50
radon, 18, 63, 64Raloff, Janet, 8Redd, Stephen, 11regulations
changes in, under Bushadministration, 9, 70–77
criticisms of, 8–9debate over, 7global approach to, is necessary,
78–84international agreements, 15–16,
78–84
Motor Vehicle Air Pollution Act, 12reforms of
will improve air quality, 75–77will worsen air quality, 70–74
see also Clean Air ActReuther, Christopher G., 78Rosenfeld, Daniel, 68
Schwartz, Joel, 33sea level rise, 45Sierra Club, 39, 50Southern Appalachian Mountains
Initiative, 15sport-utility vehicles (SUVs), 38–39sulfur dioxide, 14, 28, 34
tetraethyl lead, 13tobacco smoke, 16, 17, 18tornadoes, 54–55tropical diseases, 52–53
United Nations EconomicCommission for Europe (UNECE),79–80
United Nations EnvironmentProgramme (UNEP), 78–84
United Statesglobal regulations on air pollution
and, 78–84pollution-associated health
problems in, 8production of greenhouse gases by,
48utilities, electric, 21–22
volatile organic compounds (VOCs),17, 57, 60–61, 64
Weisel, Clifford, 60–61Williams, Arthur L., 20World Health Organization (WHO),
51, 79Wuester, Henning, 79–81
94 At Issue
AI Air Pollution INT 8/17/04 9:19 AM Page 94