Embed Size (px)
Citation preview
1757
Is or a Preload-Independent Measure ofIsovolumetric Relaxation?Shalendra K. Varma, MD, Robert M. Owen, BA,Mark L. Smucker, MD, and Marc D. Feldman, MD
Several studies have been performed in patients with a variety of myocardial diseases that haveidentified a prolongation of r. However, it is not clear whether prolongation of representsabnormal myocardial physiology or the effect of excessive load associated with a particulardisease process. Accordingly, we evaluated the effect on r of an isolated decrease in preloadinduced by inferior vena cava occlusion before the appearance of reflex changes in six patientsdesignated as normal by catheterization criteria. A computer-based digitization routineidentified cardiac contractions in all patients early after inferior vena cava occlusion where leftventricular end-diastolic pressure decreased (18.3±6.3 to 9.3±5.8, p<0.05) while left ventric-ular systolic pressure (113.3±13.8 to 111.8+14.0, p=NS) and heart rate (66.0±10.0 to65.9±10.3, p=NS) did not change. After this alteration in preload, no change in frombaseline, as calculated by the logarithmic (TL), derivative (TD), or method of Mirsky (T1/2), wasnoted: TLS 47.4±6.5 to 44.6±7.6; TD, 39.3±8.1 to 39.8±8.4; T112, 33.0±+4.0 to 31.8+4.6; allp=NS. The baseline pressure extrapolated from isovolumetric relaxation did not change in thesepreload beats compared with baseline (+4.26±6.20 to -0.80±4.87, p=NS). Subsequent beatswere identified where left ventricular systolic pressure showed a numeric decrease comparedwith baseline (113.3±13.8 to 100.8±14.3,p=NS) despite no change in heart rate (66.0±10.0 to66.8±10.5, p=NS). The extrapolated baseline pressure decreased in these subsequent beatscompared with baseline (+4.26±6.20 to -3.90±4.26, p<0.05) despite no change in r (TL,47.4±6.5 to 41.6±8.4; TD, 39.3±8.1 to 40.8±11.1; TI,2, 33.0±4.0 to 31.7±4.2; all p=NS).Visual display of the individual natural log of left ventricular pressure versus time values usedto calculate TL were consistent with exponential pressure decay as an appropriate model forisovolumetric relaxation. This study demonstrates that r is a preload independent measure ofisovolumetric relaxation. (Circulation 1989;80:1757-1765)
T he relaxation of isolated papillary muscle isdependent on the total load imposed on themuscle. This concept was first demon-
strated by Parmley and Sonnenblickt and morerecently expanded by Brutsaert et al.2 The musclepreparations used in these studies included bothisometric and afterloaded isotonic contractions.Because of the nonphysiologic sequence of relax-ation during an afterloaded isotonic contraction(isotonic before isometric relaxation), the load depen-dence of relaxation has been examined by "physi-ologically sequenced" relaxation. With this methodthe load dependence of relaxation was reconfirmedalthough at a temperature of 280 C.34 More recently,
From the Division of Cardiology, Department of InternalMedicine, University of Virginia School of Medicine, Charlottes-ville, Virginia.Address for correspondence: Marc D. Feldman, MD, Division
of Cardiology, Box 158, Department of Internal Medicine, Schoolof Medicine, University of Virginia, Charlottesville, VA 22908.
Received September 2, 1988; revision accepted July 27, 1989.
Gaasch et al demonstrated that variable preload,with constant total load, did not produce a changein isometric relaxation.5 Relaxation of isolated pap-illary muscle is, therefore, independent of preloadbut dependent on total load.
Similar observations have been extended to theintact animal heart. Karliner et al found that pri-mary changes in afterload produced changes in thetime constant of isovolumetric left ventricular pres-sure (LVP) decline (X-), but volume infusion did notproduce such changes.6 Gaasch et al also found thatmodest changes in left ventricular preload did notinfluence i, but when volume loading was sufficientto produce an increase in aortic pressure, r in-creased.7 Gaasch et al recently extended this obser-vation to an isolated increase in left ventricularpreload, finding no associated change in r.5 Incontrast, Raft and Glantz found that volume loadingslowed r, and they concluded that this effect was areflection of both preload and afterload.8 However,these conclusions were reached on the basis of
by guest on July 12, 2018http://circ.ahajournals.org/
Dow
nloaded from
1758 Circulation Vol 80, No 6, December 1989
multiple linear regression analysis and not purepreload changes. Most data in the intact animalheart favor r being independent of preload butdependent on afterload.The present study was designed to determine
whether r is a preload-independent measure ofisovolumetric relaxation in patients undergoingcardiac catheterization. Several studies have beenperformed in patients with a variety of myocardialdiseases and have identified a prolongation of7.9-13 However, it is not clear whether prolonga-tion of r represents abnormal myocardial physiol-ogy or the effect of excessive load associated witha particular disease process. Accordingly, we eval-uated the effect on r of an isolated decrease inpreload induced by inferior vena cava occlusionbefore the appearance of reflex changes in sixpatients without documentable cardiac disease bycatheterization criteria.
MethodsStudy Group
Inferior vena cava occlusion with simultaneoushemodynamic monitoring was performed at thetime of cardiac catheterization in eight patients.One patient developed transient atrial fibrillation,and a second had simultaneous falls in preload andafterload. These two patients were excluded fromdata analysis. Among the remaining six patientsthere were five men and one woman with an agerange of 29-52 years. All medications were with-held for at least 18 hours prior to catheterization.These patients all had atypical chest pain syn-dromes and normal physical examinations, electro-cardiograms, right and left-heart pressures, cardiacoutputs, coronary arteriography, and biplane leftventriculography. All patients gave written consentto a protocol approved by the Human InvestigationCommittee of the University of Virginia. Therewere no complications as a result of this study.
Cardiac Catheterization and AngiographyRoutine left-heart catheterization was performed
from the left groin and right-heart catheterizationfrom the right groin, leaving the latter for theinferior vena cava balloon. Right-heart catheteriza-tion was performed with a 7F flow-directed, balloon-tipped catheter (Critikon, Tampa, Florida). Coro-nary angiography was performed by the Judkinstechnique. Left ventriculography was performedthrough a pigtail catheter with biplane cine record-ings. Nonionic contrast (lopamidol, Squibb, NewBrunswick, New Jersey) was used to minimize themyocardial depressant effects of contrast. Pres-sures were measured with thoroughly flushed dis-posable air reference transducers (Spectramed,Oxnard, California). Recordings were inscribed bymeans of a Honeywell Electronics-for-MedicineVR-16 Recorder.
Inferior Vena Cava Occlusion ProtocolAfter completion of coronary angiography and
left ventriculography, the deflated 8F 40-mm occlu-sion balloon catheter (OBW 40/8/2/100, MansfieldScientific, Mansfield, Massachusetts) was intro-duced percutaneously into the right femoral vein,positioned in the right atrium over an 0.035-in.guidewire, and inflated. A 7F micromanometer pig-tail catheter was subsequently introduced into theleft ventricle and balanced. Analog data from theelectrocardiogram (ECG), micromanometer LVP,and on-line dP/dt were stored on a nine-channelcassette FM recorder (MR-40, TEAC, Montebello,California).
Thirty minutes passed between the last injectionof nonionic contrast and data collection. All patientswere instructed on breath-holding before the cath-eterization, and all data were collected at midexpi-ration. Analog recordings of ECG, LVP, and on-line dP/dt were continuously made throughout theresearch portion of the catheterization. The 40-mmballoon was pulled to the right atrial-inferior venacava junction. The occlusion was maintained untilleft ventricular systolic pressure fell no lower than80 mm Hg, at which point the balloon was read-vanced into the right atrium. The baseline systolicLVP for these six patients was 113 + 14 mm Hg, andthe nadir pressure in response to inferior vena cavaocclusion was 95 + 17 mm Hg. The goal of this studywas to obtain a decrease in preload and not after-load; therefore, the occlusions were often releasedbefore obtaining a true maximal fall in pressure. Sixocclusions were performed in each patient, of whichonly one was used for data analysis. The occlusionsnot analyzed had either ectopy, inability of thepatient to hold his or her breath at midexpiration, orno preload beats.
Data AnalysisThe analog data recorded during the inferior vena
cava occlusion were played back to the computer-based digitization routine we developed. This routinedigitized each waveform and stored the data to beanalyzed. By handling the analog data in this man-ner, we eliminated the errors for off-line hand digiti-zation of the analog signal traces. The sampling ratefor digitizing the analog signals was 1-msec intervals(1 kHz), thus providing greater accuracy than the5 -msec (200 Hz) digitization rates previouslyreported.5 -8,10-11,14-16 The computer-based digitiza-tion hardware consisted of an LSI 11/23+ computerwith an on-board 12-bit analog-to-digital converter(Andromeda Systems ADC1 1, Orange, California), avideo display, and our software.
X was calculated by three methods. The first useda plot of ln(LVP) versus time, as derived by Weisset al (TL) 17 This approach assumed that LVP duringisovolumetric relaxation decays in a monoexponen-tial manner to zero. The second method assumed avariable asymptote to LVP decay, taking into
by guest on July 12, 2018http://circ.ahajournals.org/
Dow
nloaded from
Varma et al Preload Independence of i 1759
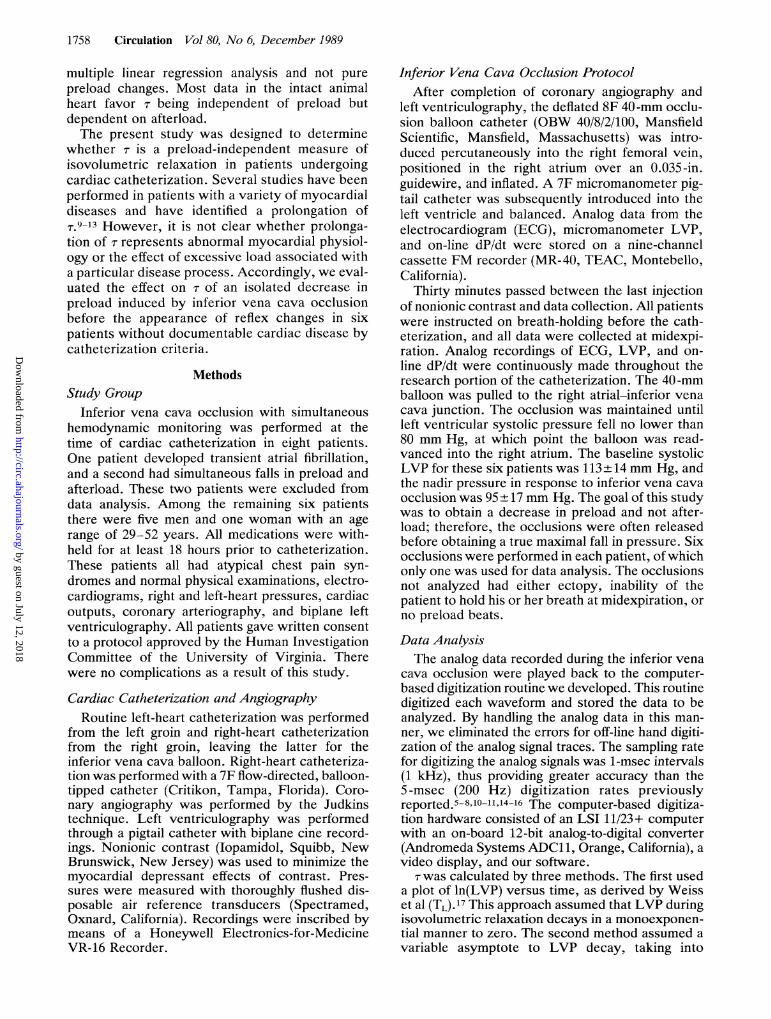
TABLE 1. Mean Patient Data
Baseline Preload Total load
HR (beats/min) 66.0±10.0 65.9±10.3 66.8±10.5LVSP (mm Hg) 113.3±13.8 111.8±14.0 100.8±14.3LVEDP (mm Hg), visual 14+2 8±2* 3±3*tLVEDP (mm Hg), computer derived 18.3±6.3 9.3+5.8* 6.3±6.4*t+dP/dt (mm Hg/sec) +1,576+129 +1,462±80* +1,399+126*-dP/dt (mm Hg/sec) -2,027+160 -1,943± 196 -1,808+264*tn 46.7±6.2 54.2+5.5* 60.4±2.0*t
TL (msec) 47.4±6.5 44.6±7.6 41.6±8.4
R-TL -0.996±0.004 -0.99 ±0.005 -0.996±0.005
TD (msec) 39.3±8.1 39.8+±8.4 40.8±+11.1R TD -0.862±0.038 -0.861±+0.041 -0.857±0.042T1J2 (msec) 33.0±4.0 31.8+4.6 31.7+4.2PB (mm Hg) +4.26±6.20 -0.80±4.87 -3.90+4.26*
*p<0.05 vs. control, tp<0.05 vs. preload.HR, heart rate; LVSP, left ventricular systolic pressure; LVEDP, left ventricular end-diastolic pressure; n, number of points used to
calculate r; TL, r logarithmic; TD, 1 derivative; T112, r method of Mirsky; R, correlation coefficient; PB, pressure baseline.
account the effects of pleural and pericardial pres-sure. This method, developed by Raff and Glantz,used a plot of negative dP/dt versus LVP (TD)8 andallowed calculation of extrapolated, residual LVP,assuming diastole to be infinite in duration (PB). Thepreload dependence of PB was therefore also deter-mined in this study. The third method computed thetime needed for LVP to fall to one half of its valuefrom peak negative dP/dt, using the method ofMirsky (T1/2).18 T112 is similar to TL in that the latteris the time it takes for pressure to fall from maxi-mum negative dP/dt to 1 eth that pressure, and T1,2uses one half instead of 1 eth. The use of T1/2advocates not going through the exercise of theexponential fit but simply determining r from thepressure fall itself.
Statistical AnalysisMean values and SDs were calculated at base-
line, after preload reduction, and after total loadreduction. The three groups of data were com-pared by analysis of variance (ANOVA). Dun-can's multiple-range test was used to directlycompare data at baseline versus preload reduc-tion, baseline versus total load reduction, andpreload versus total load reduction. Ap value lessthan 0.05 was considered significant.
ResultsHemodynamicsThe mean hemodynamic data at baseline, after
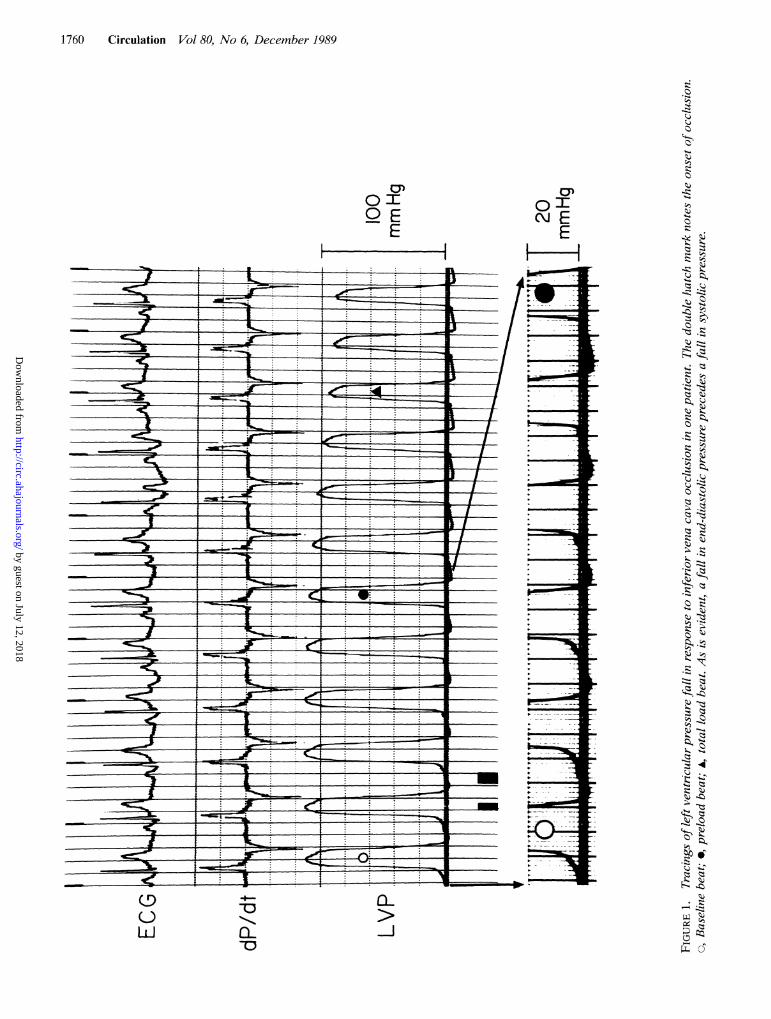
reduction of only preload, and after a subsequentreduction in total load (preload and afterload) withinferior vena cava occlusion are shown in Table 1.An example of hemodynamic data from a patient isshown in Figure 1. The heart rate was not alteredafter a reduction in preload or after a reduction intotal load (66.0+10.0 to 65.9+10.3 to 66.8+10.5beats/min, respectively; p=NS). The systolic LVPwas not altered after a reduction in preload
(113.3± 13.8 to 111.8±14.0 mm Hg; p=NS). Al-though there was a numeric decrease in systolic LVPin the total load beats from 113.3± 13.8 to 100.8± 14.3mm Hg, statistical significance was not achieved.The left ventricular end-diastolic pressure (LVEDP)decreased after a reduction in preload and decreasedfurther with a reduction in total load (18.3±6.3 to9.3 + 5.8 to 6.3± 6.4 mm Hg, respectively; p< 0.05).Peak positive dP/dt decreased with a reduction inpreload (+1,576±129 to 1,462±80 mm Hg/sec;p<0.05). With a reduction in total load, there was anumeric decrease that did not achieve statisticalsignificance from preload (+ 1,462± 80 to 1,399+ 126mm Hg/sec, p=NS). Peak negative dP/dt was notaltered with a reduction in preload (-2,027±160 to-1,943±196 mm Hg/sec;p=NS) but decreased witha reduction in total load (-1,808±264 mm Hg/sec;p<0.05 vs. baseline and preload).
Effect of Preload and Total Load Changes on r
TL, TD, and T1/2 are presented in Table 1 atbaseline, after a reduction of only preload, and aftera subsequent reduction in total load with inferiorvena cava occlusion. There were 46.7±6.2 pointsused to calculate r at baseline. The number ofpoints increased in the preload and total load beats(54.2±5 .5, 60.4±2.0, respectively; p<0.05). Therewas no change in TL with a reduction in preload ortotal load (47.4±6.5 to 44.6±7.6 to 41.6±8.4 msec;respectively, p=NS). The correlation coefficient(R) for TL was similar at baseline, after a reductionin preload, and after a reduction in total load(-0.996±0.004 to -0.995±0.005 to -0.996±0.005,respectively; p= NS).There was no change in TD from baseline with a
reduction of only preload and after a subsequentreduction in total load (39.3±8.1 to 39.8±8.4 to40.8± 11.1 msec, respectively;p=NS). R for TD wassimilar at baseline, after a reduction in preload, andafter a reduction in total load (-0.862±0.038 to
by guest on July 12, 2018http://circ.ahajournals.org/
Dow
nloaded from
1760 Circulation Vol 80, No 6, December 1989
oJ~~~~~~~~~~~~~~~~~,
OE 0~O:E E
F-]
HO _
~~~~~~~~~~~~~~~~__S I I ' /__'_r_ 4
7 I I ., .,____
E'A I - 1. --P / _E- -~~~~~~~~~~~~~~~~~~~~~~~~~~~~~~~~~~~~~~IXfi/[Z>
LLJ CL 10 -o0
by guest on July 12, 2018http://circ.ahajournals.org/
Dow
nloaded from
Varna et al Preload Independence of r 1761
-0.861±0.041 to -0.857±0.042, respectively,p=NS), although it was less than R for TL. Therewas no change in T1,, from baseline with a reductionof only preload or after a subsequent reduction intotal load (33.0±4.0 to 31.8+4.6 to 31.7+4.2 msec,respectively; p=NS).
Effect ofPreload and Total Load Changes on PBDetermination of TD provided a calculation of the
extrapolated residual LVP (PB). At baseline PB was+4.26±6.20 mm Hg. After a reduction in preloadwith inferior vena cava occlusion, there was anumeric decrease in PB that did not achieve statis-tical significance (-0.80±4.87 mm Hg; p==0.20 vs.baseline). With a reduction in total load, PB diddecline to -3.9±4.26 (p<0.05 vs. baseline).
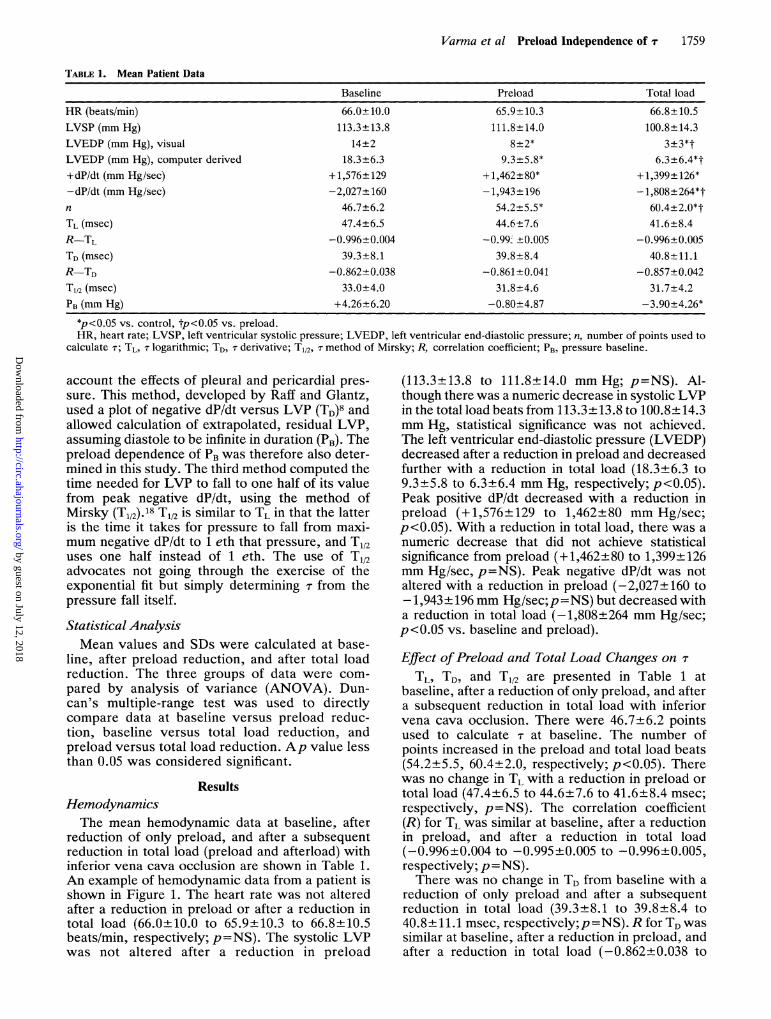
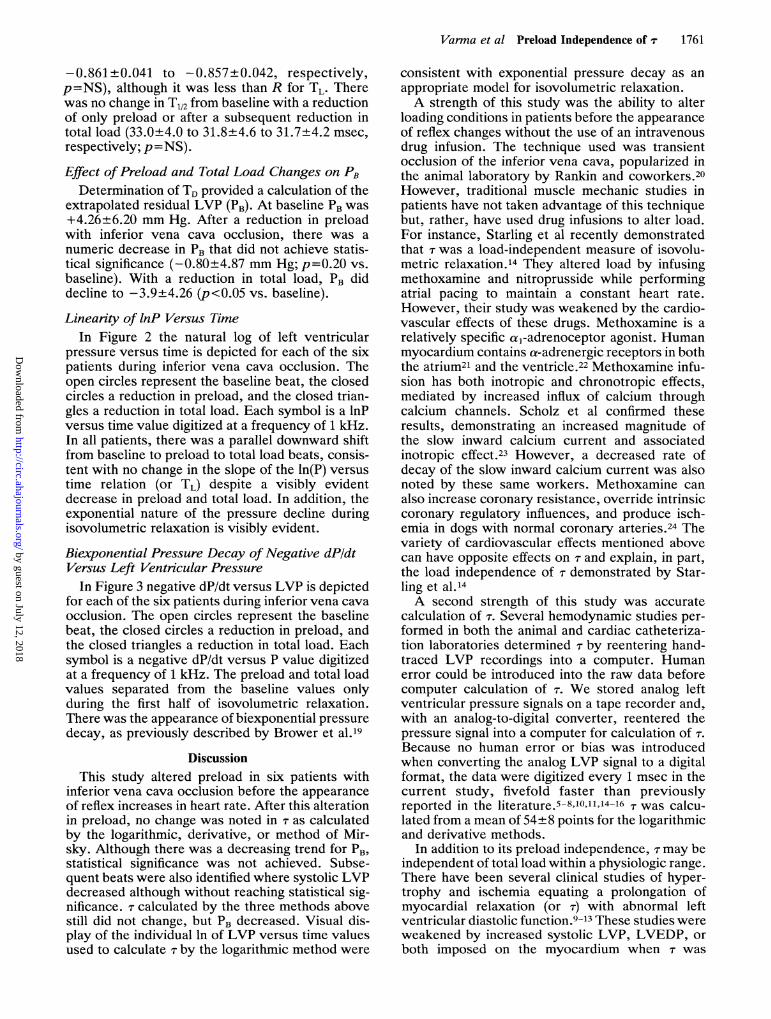
Linearity of lnP Versus TimeIn Figure 2 the natural log of left ventricular
pressure versus time is depicted for each of the sixpatients during inferior vena cava occlusion. Theopen circles represent the baseline beat, the closedcircles a reduction in preload, and the closed trian-gles a reduction in total load. Each symbol is a lnPversus time value digitized at a frequency of 1 kHz.In all patients, there was a parallel downward shiftfrom baseline to preload to total load beats, consis-tent with no change in the slope of the ln(P) versustime relation (or TL) despite a visibly evidentdecrease in preload and total load. In addition, theexponential nature of the pressure decline duringisovolumetric relaxation is visibly evident.
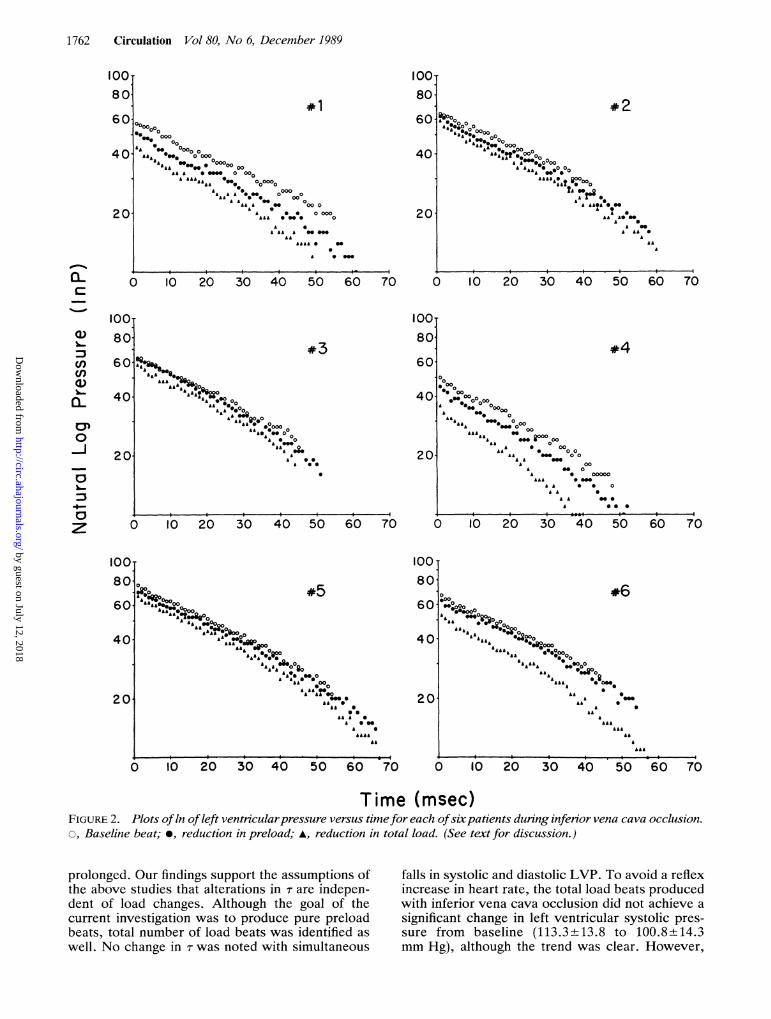
Bie,xponential Pressure Decay of Negative dP/dtVersus Left Ventricular Pressure
In Figure 3 negative dP/dt versus LVP is depictedfor each of the six patients during inferior vena cavaocclusion. The open circles represent the baselinebeat, the closed circles a reduction in preload, andthe closed triangles a reduction in total load. Eachsymbol is a negative dP/dt versus P value digitizedat a frequency of 1 kHz. The preload and total loadvalues separated from the baseline values onlyduring the first half of isovolumetric relaxation.There was the appearance of biexponential pressuredecay, as previously described by Brower et al.19
DiscussionThis study altered preload in six patients with
inferior vena cava occlusion before the appearanceof reflex increases in heart rate. After this alterationin preload, no change was noted in r as calculatedby the logarithmic, derivative, or method of Mir-sky. Although there was a decreasing trend for PB,statistical significance was not achieved. Subse-quent beats were also identified where systolic LVPdecreased although without reaching statistical sig-nificance. r calculated by the three methods abovestill did not change, but PB decreased. Visual dis-play of the individual ln of LVP versus time valuesused to calculate r by the logarithmic method were
consistent with exponential pressure decay as anappropriate model for isovolumetric relaxation.A strength of this study was the ability to alter
loading conditions in patients before the appearanceof reflex changes without the use of an intravenousdrug infusion. The technique used was transientocclusion of the inferior vena cava, popularized inthe animal laboratory by Rankin and coworkers.20However, traditional muscle mechanic studies inpatients have not taken advantage of this techniquebut, rather, have used drug infusions to alter load.For instance, Starling et al recently demonstratedthat r was a load-independent measure of isovolu-metric relaxation.14 They altered load by infusingmethoxamine and nitroprusside while performingatrial pacing to maintain a constant heart rate.However, their study was weakened by the cardio-vascular effects of these drugs. Methoxamine is arelatively specific a,-adrenoceptor agonist. Humanmyocardium contains a-adrenergic receptors in boththe atrium21 and the ventricle.22 Methoxamine infu-sion has both inotropic and chronotropic effects,mediated by increased influx of calcium throughcalcium channels. Scholz et al confirmed theseresults, demonstrating an increased magnitude ofthe slow inward calcium current and associatedinotropic effect.23 However, a decreased rate ofdecay of the slow inward calcium current was alsonoted by these same workers. Methoxamine canalso increase coronary resistance, override intrinsiccoronary regulatory influences, and produce isch-emia in dogs with normal coronary arteries.24 Thevariety of cardiovascular effects mentioned abovecan have opposite effects on r and explain, in part,the load independence of r demonstrated by Star-ling et al.14A second strength of this study was accurate
calculation of r. Several hemodynamic studies per-formed in both the animal and cardiac catheteriza-tion laboratories determined r by reentering hand-traced LVP recordings into a computer. Humanerror could be introduced into the raw data beforecomputer calculation of r. We stored analog leftventricular pressure signals on a tape recorder and,with an analog-to-digital converter, reentered thepressure signal into a computer for calculation of r.Because no human error or bias was introducedwhen converting the analog LVP signal to a digitalformat, the data were digitized every 1 msec in thecurrent study, fivefold faster than previouslyreported in the literature.5-8,10,11,14-16 r was calcu-lated from a mean of 54+8 points for the logarithmicand derivative methods.
In addition to its preload independence, r may beindependent of total load within a physiologic range.There have been several clinical studies of hyper-trophy and ischemia equating a prolongation ofmyocardial relaxation (or r) with abnormal leftventricular diastolic function.9-13These studies wereweakened by increased systolic LVP, LVEDP, orboth imposed on the myocardium when r was
by guest on July 12, 2018http://circ.ahajournals.org/
Dow
nloaded from
1762 Circulation Vol 80, No 6, December 1989
100O80
#12s..0
*.* 00A* 000
A& *0 000000L SA* 00 00
.,A .0@ .
00
000aAA *0 0 0 000A A&&AA %. o o
LA 0000A0
00
AA .@0*... 000o
A * 0 0000
AA A@0 @a, .A a O0
.&&A.
i i~~~~~~
60
40
20
10 20 30 40 50 60 70
IOOT80
#3
A&A
LAM& 00 , 00AL 0.0
A& AL 9000A& @00
Ai0
0
&ALA *SA^ .a ..0
60
40
20
10 20 30 40 50 60 70
#2AAOO *00o0
ALAs. 000000AAAa000LA00A, ,,, ..0 00
A A~ CA S
2, A0,_0
a 0
L
10 20 30 40 50 60 70
#4
* 000. . 00 00
0*0
A . 00000
A~ ~ ~ ..0 _ALA 0 00~ ~~~~0
A 0 00~~~~~AL 0 00 O
AL. -.
A . 0000
LA @00
0 lO 20 30 40 50 60 70
0?:.5o#
A&*A 0AAAL*800
ALAso0090
A IL 00000
a . ..AS~~@0LASS~~~~,.AL 00~~~~.
10080
60
40
20
10 20 30 40 50 60 70 0
00 #6*000ALA. .S000
AA ALA* 0o 0
aALA oft 0OA ^ ..ooo"^ *0000A LALA0 00
A ._A 0AL
0
A.
.
lO 20 30 40 SO 60
Time (msec)FIGURE 2. Plots of In ofleft ventricularpressure versus timefor each ofsxpatients during inferior vena cava occlusion.
o, Baseline beat; *, reduction in preload; A, reduction in total load. (See text for discuission.)
prolonged. Our findings support the assumptions ofthe above studies that alterations in r are indepen-dent of load changes. Although the goal of thecurrent investigation was to produce pure preloadbeats, total number of load beats was identified as
well. No change in r was noted with simultaneous
falls in systolic and diastolic LVP. To avoid a reflexincrease in heart rate, the total load beats producedwith inferior vena cava occlusion did not achieve a
significant change in left ventricular systolic pres-sure from baseline (113.3±13.8 to 100.8±14.3mm Hg), although the trend was clear. However,
10080
60]
40.
20
CE0-1
0-
cn
CD)
CL0Y)
00
z
0
IOOT80'
60
40.
20
0
100T80
60
40
20
0 70
i 0
by guest on July 12, 2018http://circ.ahajournals.org/
Dow
nloaded from
Varma et al Preload Independence of r 1763
OT
*1A &hi a&*
8
a * 0
a0
£ *
-500o- Io000
- 1500.
a A oc2A 00
A 0 Q
A9 0oJ:'0A*.
-20001
-2500.
10 20 30 40 50 60 70 80
$3
-3000
0.
-500.
- 1000-
- 1500.
-2000.
-2500-
_Xnnn
A%.,
10 20 30 40 50 60 70 80
lO 20 30 40 50 60
A is -..'Aus. a
A A 0
70 80
.4
10 20 30 40 50 60 70 80
"%,~~ O5o
A*O
: .
-500
- 1000
- 1500
-2000
-2500
10 20 30 40 50 60 70 80-3000
AA
a 8
*0
0 10 20 30 40 50 60 70
Left Ventricular Pressure (mmHg)FIGURE 3. Plots of negative dP/dt versus left ventricular pressure for each of six patients during inferior vena cava
occlusion. o, Baseline beat; 0, reduction in preload; *, reduction in total load. (See text for discussion.)
Starling et al produced greater alterations in loadwith drug infusions and confirmed the load indepen-dence of r in humans over a physiologic range in thecardiac catheterization laboratory.'4 The presentinvestigation, in conjunction with the work of Star-ling et al, argues that given the physiologic con-straints of hemodynamic studies performed inpatients, r is a load-independent measure of isovol-umetric relaxation.
To determine the preload dependence of r, thecurrent study decreased filling of the left ventricle,while work by Gaasch et a15 and Karliner et a16 usedvolume infusion. Occlusion of the inferior venacava to alter preload was the opposite of thesecanine studies using volume infusion. In all of thesestudies, r was found to be independent of preload.However, increasing preload enough to raise sys-tolic LVP in the studies of Gaasch and Karliner did
0.
-5002
- 10002
- 1500
-2000
-2500
-3000
OT
C)U)N.
EE
10
'I"
a-a)
z
0-Rgjo,-£ A
-500t
-10001
- 1500-
- 2000.
-2500,
-3000 A 4 '0
0
-500
- 1000
- 1500
-2000
-2500+
-3000J0
*6
01 * 0A O
Aa .,
80
, , , , , , I i -- -
_, *. %gi..O MMxi -
. 4
c
01
by guest on July 12, 2018http://circ.ahajournals.org/
Dow
nloaded from
1764 Circulation Vol 80, No 6, December 1989
produce an increase in n. These studies imply that rmay be dependent on preload only to the extent thatchanges in preload affect systolic loading. In thepresent study and the work of Starling et al,14decreases in load sufficient to decrease systolicLVP did not change r. Thus, increasing as opposedto decreasing load may change the rate of isovolu-metric relaxation. For instance, when load isincreased, isovolumetric relaxation may be pro-longed. Conversely, a decrease in load may have noeffect. However, in the study of Starling, an increasein load did not prolong isovolumetric relaxation.These data must temper the notions of the type ofsystolic load (i.e., increasing load and prolonging rversus decreasing load and not affecting j).
Unlike r, the baseline pressure (PB) extrapolatedfrom isovolumetric relaxation, which represents abaseline to which pressure would fall if decaycontinued infinitely, was found to be load depen-dent in the present study. PB may reflect a basallevel of diastolic myocardial tone, but its physio-logic meaning has been unclear. Carroll et al, forinstance, attached important physiologic signifi-cance to PB and believed that exercise-inducedischemic increases in PB represented an importantinfluence of slowed isovolumetric relaxation onelevated pressures late in diastole.25 In contrast,Thompson et al did not demonstrate pacing-inducedischemic alterations in PB despite prolongation ofisovolumetric relaxation and elevation of LVEDP. 15The present study demonstrated a downward trendin PB with decreasing preload and a significant fall inPB with a fall in both preload and afterload (Table 1).Future studies in patients designed to examinephysiology with PB in the cardiac catheterizationlaboratory will have to be tempered by the loaddependence demonstrated in this study.
In their original description Weiss et al believed rwas a reflection of the "active cardiac relaxationsystem.'"17 Several investigators have since identi-fied a prolongation in r in several disease states,including myocardial ischemia, cardiac hypertro-phy secondary to essential hypertension and valvu-lar heart disease, hypertrophic cardiomyopathy,and congestive cardiomyopathy. Grossman andcoworkers, in particular, have related this prolon-gation in isovolumetric relaxation in part to abnor-mal calcium handling.9-11 The present study sup-ports using r as a reflection of calcium handling bythe myofilaments. As is visually evident in Figure 2,the plot of the ln of LVP versus time was linear forall baseline, preload, and total load beats. Thisexponential decay of pressure was consistent withmathematic models of calcium release from themyofilaments. Potter et al, for instance, used anumeric computer solution to display the exponen-tial time course of calcium release from troponinand calmodulin.26There were several limitations to this study. The
absence of a change in r with a decrease in preloadmay be due to opposite physiologic effects pro-
duced by the method chosen to alter load. Inferiorvena cava occlusion, by unloading the right ventri-cle, may change the radius of curvature of theintraventricular septum. Resultant asynchronousrelaxation of the left ventricle would prolong T.27 Asimultaneous decrease in left ventricular preload,however, would be expected to decrease r accord-ing to isolated cardiac muscle studies.2 These twoopposite effects might cancel one another and pro-duce no change in r with alterations in preload, asseen in this study. A second limitation of this studywas the inability of inferior vena cava occlusion toproduce a statistically significant decrease in sys-tolic LVP before the appearance of a reflex increasein heart rate. It is difficult, therefore, to reach firmconclusions regarding the total load dependence ofr on the basis of this study. Third, although thepatients chosen to participate in this study werenormal by cardiac catheterization criteria, theirbaseline LVEDPs were elevated. This finding wasan artifact of the computer digitization routine. Thecomputer software was written to locate LVEDP atthe peak of the R wave of the electrocardiogram.Reanalysis of LVEDP "by hand" defined by theatrial systolic deflection on the upstroke of LVPgave a mean LVEDP of 14±2 mm Hg. Finally, ourresults were not in conflict with the known loaddependence of relaxation in isolated papillary mus-cle. It is an intrinsic property of cardiac muscle thatthe rate of relaxation is load dependent.1-4 Rather,in the intact human heart, when isolated reductionsin preload are evaluated, - is found to be loadindependent over a relatively narrow physiologicrange. Although we produced statistically signifi-cant reductions in preload, the magnitude of decreasein LVEDP was only over an approximately 6-9mm Hg range. Therefore, when isolated reductionsin preload are performed in patients, this method ofassessment of isovolumetric relaxation as a variableof active muscle relaxation is not affected.
In conclusion, this study has demonstrated that ris a preload-independent measure of isovolumetricrelaxation. This conclusion is strengthened by themethod used: altering load with inferior vena cavaocclusion before the onset of reflex changes andrecording pertinent analog signals on cassette tapefor later "on-line" computer digitization. Unlike rthe baseline pressure (PB) extrapolated from isovol-umetric relaxation is load dependent. Because ofthe frequency of computer digitization used, thisstudy lends support to exponential pressure decayas an appropriate mathematic model for isovolumet-ric relaxation. Finally, this study supports the useof i as a reflection of myocardial physiology becauseof its load independence.
AcknowledgmentsThis study could not have been completed with-
out the support of the cardiac catheterization staffat the University of Virginia and the secretarialexpertise of Jerry Curtis.
by guest on July 12, 2018http://circ.ahajournals.org/
Dow
nloaded from
Varma et al Preload Independence of r 1765
References
1. Parmley WW, Sonnenblick EH: Relation between mechan-ics of contraction and relaxation in mammalian cardiacmuscle. Am J Physiol 1969;216:1084
2. Brutsaert DL, Rademakers FE, Sys SU: Triple control ofrelaxation: Implications in cardiac disease. Circulation 1984;69:190
3. Sulman DL, Bing OHL, Mark RG, Burns SK: Physiologicloading of isolated heart muscle. Biochem Biophys ResCommun 1974;56:947
4. Wiegner AW, Bing OHL: Isometric relaxation of rat myo-cardium at end-systolic fiber length. Circ Res 1978;43:865
5. Gaasch WH, Carroll JD, Blaustein AS, Bing OHL: Myocar-dial relaxation: Effects of preload on the time course ofisovolumetric relaxation. Circulation 1986;73:1037
6. Karliner JS, LeWinter MM, Mahler F, Engler R, O'RourkeRA: Pharmacologic and hemodynamic influences on the rateof isovolumetric left ventricle relaxation in the normal con-scious dog. J Clin Invest 1977;60:511
7. Gaasch WH, Blaustein AS, Andrias CW, Donahue RP,Avitall B: Myocardial relaxation: II. Hemodynamic deter-minants of rate of left ventricular isovolumic pressure decline.Am J Physiol 1980;239(Heart Circ Physiol 8):H1
8. Raff GL, Glantz SA: Volume loading slows left ventricularisovolumic relaxation rate: Evidence of load-dependent relax-ation in the intact dog heart. Circ Res 1981;48:813
9. Mann T, Goldberg S, Mudge GH Jr, Grossman W: Factorscontributing to altered left ventricular diastolic propertiesduring angina pectoris. Circulation 1979;59:14
10. Paulus WJ, Lorell BH, Craig WE, Wynne J, Murgo JP,Grossman W: Comparison of the effects of nitroprusside andnifedipine on diastolic properties in patients with hyper-trophic cardiomyopathy: Altered left ventricular loading orimproved muscle inactivation?JAm Coil Cardiol 1983;2:879
11. Feldman MD, Alderman JD, Aroesty JM, Royal HD, Fer-guson JJ, Owen RM, Grossman W, McKay RG: Depressionof systolic and diastolic myocardial reserve during atrialpacing tachycardia in patients with dilated cardiomyopathy.J Clin Invest 1988;82:1661
12. Eichhorn P, Grimm J, Koch R, Hess 0, Carroll J, Krayen-buehi HP: Left ventricular relaxation in patients with leftventricular hypertrophy secondary to aortic valve disease.Circulation 1982;65:1395
13. Shapiro LM, McKenna WJ: Left ventricular hypertrophy:Relation of structure to diastolic function in hypertension. BrHeart J 1984;51:637
14. Starling MR, Montgomery DG, Mancini GBJ, Walsh RA:Load independence of the rate of isovolumic relaxation inman. Circulation 1987;76:1274
15. Thompson DS, Waldron CB, Juul SM, Naqvi N, SwantonRH, Coltart DJ, Jenkins BS, Webb-Peploe MM: Analysis ofleft ventricular pressure during isovolumic relaxation incoronary artery disease. Circulation 1982;65:690
16. Walsh RA, O'Rourke RA: Direct and indirect effects ofcalcium entry blocking agents on isovolumic left ventricularrelaxation in conscious dogs. J Clin Invest 1985;75:1426
17. Weiss JL, Frederiksen JW, Weisfeldt ML: Hemodynamicdeterminants of the time-course of fall in canine left ventric-ular pressure. J Clin Invest 1976;58:751
18. Mirsky I: Assessment of diastolic function: Suggested meth-ods and future considerations. Circulation 1984;69:836
19. Brower RW, Meij S, Serruys PW: A model of asynchronousleft ventricular relaxation predicting the bi-exponential pres-sure decay. Cardiovasc Res 1983;17:482
20. Rankin JS, Arentzen CE, McHale PA, Ling D, AndersonRW: Viscoelastic properties of the diastolic left ventricle inthe conscious dog. Circ Res 1977;41:37
21. Schumann HJ, Wagner J, Knorr A, Reidemeister JC, SadonyV, Schramm G: Demonstration in human atrial preparationsof alpha-adrenoceptors mediating positive inotropic effects.Naunyn Schmiedebergs Arch Pharnacol 1978;302:333
22. Bruckner R, Meyer W, Mugge A, Schmitz W, Scholz H:a-adrenoceptor-mediated positive inotropic effect of phenyl-ephrine in isolated human ventricular myocardium. Eur JPharmacol 1984;99:345
23. Scholz H, Bruckner R, Mugge A, Reupcke C: Myocardialalpha-adrenoceptors and positive inotropy. J Mol Cell Car-diol 1986;18(suppl 5):79
24. Maturi MF, Green R, Donohue B, Dorsey LMA, Green MV,Bacharach SL, Vitale D, Patterson RE: Functional conse-quences and intracoronary localization of alpha-adrenergicstimulation of the canine coronary circulation. J Am CollCardiol 1986;8:885
25. Carroll JD, Hess OM, Hirzel HO, Krayenbuehl HP: Exercise-induced ischemia: The influence of altered relaxation on
early diastolic pressures. Circulation 1983;67:52126. Potter JD, Robertson SP, Johnson JD: Magnesium and the
regulation of muscle contraction. Fed Proc 1981;40:265327. Blaustein AS, Gaasch WH: Myocardial relaxation: VI. Effects
of 3-adrenergic tone and asynchrony on LV relaxation rate.Am J Physiol 1983;244(Heart Circ Physiol 13):H417
KEY WORDS * * vena cava * occlusion
by guest on July 12, 2018http://circ.ahajournals.org/
Dow
nloaded from
S K Varma, R M Owen, M L Smucker and M D FeldmanIs tau a preload-independent measure of isovolumetric relaxation?
Print ISSN: 0009-7322. Online ISSN: 1524-4539 Copyright © 1989 American Heart Association, Inc. All rights reserved.
is published by the American Heart Association, 7272 Greenville Avenue, Dallas, TX 75231Circulation doi: 10.1161/01.CIR.80.6.1757
1989;80:1757-1765Circulation.
http://circ.ahajournals.org/content/80/6/1757the World Wide Web at:
The online version of this article, along with updated information and services, is located on
http://circ.ahajournals.org//subscriptions/
is online at: Circulation Information about subscribing to Subscriptions:
http://www.lww.com/reprints Information about reprints can be found online at: Reprints:
document. Permissions and Rights Question and Answer information about this process is available in the
located, click Request Permissions in the middle column of the Web page under Services. FurtherEditorial Office. Once the online version of the published article for which permission is being requested is
can be obtained via RightsLink, a service of the Copyright Clearance Center, not theCirculationpublished in Requests for permissions to reproduce figures, tables, or portions of articles originallyPermissions:
by guest on July 12, 2018http://circ.ahajournals.org/
Dow
nloaded from


![no Cardiac Physiology Pump Function[1] Preload Afterload](https://img.pdfslide.us/doc/110x75/577d246e1a28ab4e1e9c78a0/no-cardiac-physiology-pump-function1-preload-afterload.jpg)