Embed Size (px)
Citation preview

Disclosure to Promote the Right To Information
Whereas the Parliament of India has set out to provide a practical regime of right to information for citizens to secure access to information under the control of public authorities, in order to promote transparency and accountability in the working of every public authority, and whereas the attached publication of the Bureau of Indian Standards is of particular interest to the public, particularly disadvantaged communities and those engaged in the pursuit of education and knowledge, the attached public safety standard is made available to promote the timely dissemination of this information in an accurate manner to the public.
इंटरनेट मानक
“!ान $ एक न' भारत का +नम-ण”Satyanarayan Gangaram Pitroda
“Invent a New India Using Knowledge”
“प0रा1 को छोड न' 5 तरफ”Jawaharlal Nehru
“Step Out From the Old to the New”
“जान1 का अ+धकार, जी1 का अ+धकार”Mazdoor Kisan Shakti Sangathan
“The Right to Information, The Right to Live”
“!ान एक ऐसा खजाना > जो कभी च0राया नहB जा सकता है”Bhartṛhari—Nītiśatakam
“Knowledge is such a treasure which cannot be stolen”
“Invent a New India Using Knowledge”
है”ह”ह
IS 10467 (1983): Listening test on loudspeakers [LITD 7:Audio, Video and Multimedia Systems and Equipment]


Indian
LISTENING TEST
IS : 10467 - 1983
Standard
ON LOUDSPEAKERS
Acoustics Sectional Committee, LTDC 5
Chairman
DR M. PANCH~LY Emeritus Scientist
National Physical Laboratory ( CSIR ) New Delhi
Members Representing
SHRI SANDEEP AHUJA Ahuja Radios, New Delhi SHRI K. R. GURUMURTHY ( Alternate )
COL T. R. BHALOTRA Ministry of Defence ( DGI ) LT COL KISHAN LAL ( Alteraafe )
SHRI K. C~~.~ND~A~~UDAN Directorate General of Civil Aviation, New Delhi SHRI M. P. SAMA ( Alternate )
DR A. F. CHHAPQAR National Physical Laboratory ( CSIR), New Delhi SHRI V. V. GHATE Peico Electronics & Electricals Ltd, Bombay; and
The Radio Electronics & Television Manu- facturers’ Association, Bombay
SHRI K. D’SA ( Alternatr ) The Radio Electronic & Television Manufacturers’ Association, Bombay
DR P. N. GUPTA Department of Electronics, New Delhi SHRI TEK CHANDANI ( .Ilternnte )
SHRI K. S. KALIDA~ Railway Board, New Delhi SHRI V. JAYARAMAN ( AIternate )
SHRI J. S. MONGA Bolton Industrial Corporation, New Delhi SHRI M. S. MONGA ( Alternate )
SHRI B. C. MUKHERJEE National Test House, Calcutta SHRI J. K. BHATTACHARYA ( Alternate )
DR ( KUMARI ) SHAILAJA NCKAM All India Institute of Speech & Hearing, Mysore SHRI K. D. PAVATE Central Electronics Engineering Research Institute
( CSIR ), Pilani SHRI M. R. KAPO~R ( Alternate )
SHRI A. V. RAMAN Films Division, Bombay DR C. S. R. RAO Directorate General of All India Radio, New Delhi SHRI M. SANKARALIN~AM Directorate General of Supplies & Disposals ( Ins-
pection Wing ), New Delhi SHRI R. S. AR~RA ( Alternate )
SHRI M. N. SHUKLA Posts & Telegraphs Board, New Delhi SHRI S. K. TANDON ( Alternate )
( Continued on page 2 )
0 Copyright 1983
INDIAN STANDARDS INSTITUTION
This publication is protected under the Indian Copyright Act ( XIV of 1957 ) and
reproduction in whole or in part by any means except with written permission of the
publisher shall be deemed to be an infringement of copyright under the said Act.
L

IS : lo467 - 1983
( Continuud from fiage 1 )
Members Representing
CDR P. K. SINHA LT R. S. DUTTA ( Alternate )
SUPERINTENDENT SURVEYOROF WORKS (FOOD)
SHRI R. C. JAIN, Head ( Electronics )
Ministry of Defence ( R & D )
Central Public Works Department, New Delhi
Directorate General, ISI. ( Ex-o#cio Member )
SHRI PAVANKUMAR Assistant Director ( Electronics ), ISI
2

Indian
16~:10467-1983
Standard
LISTENING TEST ON LOUDSPEAKERS
0. FOREWORD
0.1 This Indian Standard was adopted by the Indian Standards Institution on 27 January 1983, after the draft finalized by the Acoustics Sectional Committee had been approved by the Electronics and Telecommunication Division Council.
0.2 This standard gives recommendations for the setting up, performance and evaluation of listening tests on loudspeakers.
0.3 The tests described in this standard are to be performed in a room having acoustical characteristics similar to those of an ‘ average ’ living room. Recommendations about the room, size, acoustical treatment and measurements, arrangement of loudspeakers and listeners, and environ- mental conditions are given.
0.4 Experimental procedures are described, including recommendations on the choice of music and speech programme material and the processing and presentation of the final data.
0.5 While preparing this standard assistance has been derived from IEC Dot: 29 B ( Secretariat ) 189 ‘ Sound system equipment: Part XIII Listen- ing test on loudspeakers ‘, issued by the International Electrotechnical Commission ( IEC ).
0.6 For the purpose of deciding whether a particular requirement of this standard is complied with, the final value, observed or calculated, expressing the result of a test, shall be rounded off in accordance with IS : 2-1960*. The number of significant places retained in the rounded off value, should be the same as that of the specified value in this standard.
1. SCOPE
1.1 This standard specifies the recommendations for listening tests on loudspeakers. The recommendations apply to loudspeakers intended for domestic systems and -environments. Although specifically designed for
*Rules for rounding off numerical values ( revised ).
L
3

IS : 10467 - 1983
loudspeakers that are separate sound system components the procedures, with minor changes, are applicable also to other devices such as radio receivers and television sets.
2. TERMINOLOGY
2.0 For the purpose of this standard the terms and definitions given in IS : 1885 ( Part III )* shall apply in addition to the following.
2.1 Stimulus -Reproduction of a certain programme section over certain loudspeaker.
2.2 Programme Section - Shortest piece of music or speech ( approx 30s duration ) that is presented without interruption over one loudspeaker at a time in a listening test.
2.3 Replication - Repeated application of the same stimulus in the test in order to increase the reliability of the ratings.
2.4 Reliability
2.4.1 Intra-individual ( ‘ within subject ’ ) reliability refers to the agreement between a certain subject’s repeated ratings of the same stimulus.
2.4.2 Inter-individual ( ‘ between subjects ’ ) reliability refers to the agreement between different subjects’ ratings of the same stimulus.
2.5 Interaction -An interaction between two variables means that the effects of one variable are different at ( or are dependent upon ) different levels of the other variable. Applied to the ratings in a listening test, an interaction between loudspeakers and programmes may mean that the differences in the ratings between any two ( or more ) loudspeakers are different for different programmes.
3. PHYSICAL CONDITIONS *
3.1 Listening Room - IdeaIly, the listening room should simulate a typical domestic listening environment in the geographical region where the test results apply. This document describes known principles of good listening room design to assist the user in approaching an optimum listening environment as closely as possible within the constraints of his situation and local context. Some more specific recommendations are given to describe an ‘ international standard ’ listening room for use when test results are to have the widest possible application.
*Electrotechnical vocabulary: Part III Acoustics.
4

IS : 10467 - 1983
3.1.1 Room Dimensions
3.1.1.1 In rooms of domestic size, sound quality at low frequencies by the frequency distribution of room eigentones is significantly influenced
and by the placement of loudspeakers and listeners in the pattern ofstanding- waves.
3.1.1.2 Because the distribution of eigentoaes in a rectangular room with flat perfectly-reflecting walls is described by the ratio of room dimen- sions ( height : length : breadth ), the choice of optimum proportions is a natural consideration. In practice, however, such considerations must be modified by the fact that most room boundaries are neither perfectly flat nor perfectly reflecting at low frequencies.
3.1.1.3 The fact that the positioning of loudspeaker and listener affects the acoustical coupling into individual room modes means that audible colourations can be caused by the fortuitous enhancement of a small number of resonant modes in an otherwise acceptable room. There is even some evidence to suggest that axial modes may be of particular importance in this respect. As a result the frequency response of the trans- mission path through the listening room will be dependent upon several factors, not all of which are predictable.
3.1.1.4 It is, therefore, recommended that the final qualification of the listening room include an inspection of the acoustical transmission paths by means of swept-tone frequency-response measurements. ( Measure- ments with poorer resolution may be made using pink noise filtered in l/3-octave bands ). A good, broad-band, loudspeaker should be positioned, in turn, at all loudspeaker test locations with a measuring microphone placed, in turn, at all listener head locations. All combinations should be explored and positional adjustments made to avoid those situations that are clearly problematic. Large aberrations in frequency response tend to occur at frequencies below about 250 Hz.
L
The size of the room dictates both the specific eigentone frequencies and their density in the frequency domain. Large rooms offer greater potential for uniform frequency response but there is a practical upper limit on size. It is, therefore, suggested that the room volume should fall within the range 60 - 11 Om3.
5

IS : 10467 - 1983
3.1.1.5 Specifically, the following values and ranges of room dimensions are recommended :
+ 30 Volume 80 m3
- 20
+ 0.55 Height 2.45 m
- 0.15
Length L > 6*0m
Breadth B > 3 * 5 m for monophonic listening
B > 4.0 m for stereophonic listening
3.1.2 Reverberation ‘Tirw
3.1.2.1 Reflected and reverberant sounds in the listening room have a major influence on overall sound quality and stereo perception. The amount and type of acoustical absorbing materials and the placement of the material dictate the reverberation time, the uniformity of the reverberant sound field ( degree of diffusion ) and the interaction of the loudspeaker with adjacent room boundaries. In domestic environments, regional and eco- nomic factors in structure and decor are significant factors in defining what is ‘ typical ’ in these respects.
3.1.2.2 Technically, both the reverberation time, 1; and its uniformity with respect to frequency are important. Reverberation time should be measured according to IS : 8146-1976* preferably at l/3-octave intervals but certainly not less than at l-octave intervals.
3.1.2.3 Between 250 and 4 000 Hz the average value of ‘r shall be within the range 0.4 to 0.8 seconds. In that frequency range individual measurements of IT should not deviate by more than 25 percent from the average value. Below 250 Hz and above 4 000 Hz, I is permitted to deviate by 100 percent from the middle-frequency average value. c
3.1.2.4 Where the results of the listening tests are of more than regional or other specific interest, it is recommended that the middle-frequency average T be within the range 0.45 to 0.55 seconds.
3.1.2.5 In physical arrangement the room should have a ceiling that is mostly sound reflecting and a floor that is mostly carpeted. The walls behind and immediately to the sides of the loudspeakers and the ceiling for approximately l/3 of the room length should be mostly sound reflecting.
*Method of measurement of reverberation time in auditoria.
6
IS :10467-1983
Flutter echoes should be suppressed by means of sound absorbing and scattering objects arranged randomly on opposing parallel surfaces. The wall behind the listeners should be treated to prevent strong coherent reflections, particularly at middle and high frequencies.
NOTE -It should be especially noted that the quantity and arrangement of sound absorbing and scattering materials in the room are likely to influence the results of stereophonic tests. The listeners’ perceptions of sound-image localization and their impressions of space may be differently affected by the strength and direction of reflected and reverberant sounds in the listening room.
3.1.3 Environmental Conditions
3.1.3.1 The atmospheric conditions for test purposes shall meet the following requirements :
Ambient temperature 15” to 35”C, preferably 20°C.
Relative humidit) 25 to 75 percent
Air pressure 86 to 106 kPa ( 860 to 1060 m bar ).
3.1.3.2 The background noise level measured in the listening area of the room shall be below 35 dB ( A-weighted, slow ).
3.2 Loudspeaker Position and Orientation -- The location of a loudspeaker with respect to the immediately adjacent room boundaries ( floor, walls and ceiling ) affects both the spectral and temporal aspects of sound propagated into the listening room. The choice of loudspeaker location, therefore, can significantly affect the results of a listening test. For this reason, it is usually advisable to separate monophonic tests ( tests for sound quality, accuracy of reproduction, etc ) from stereophonic tests ( tests that also involve judgements of spatial attributes of the reproduced sound ).
3.2.1 Monophonic Tests
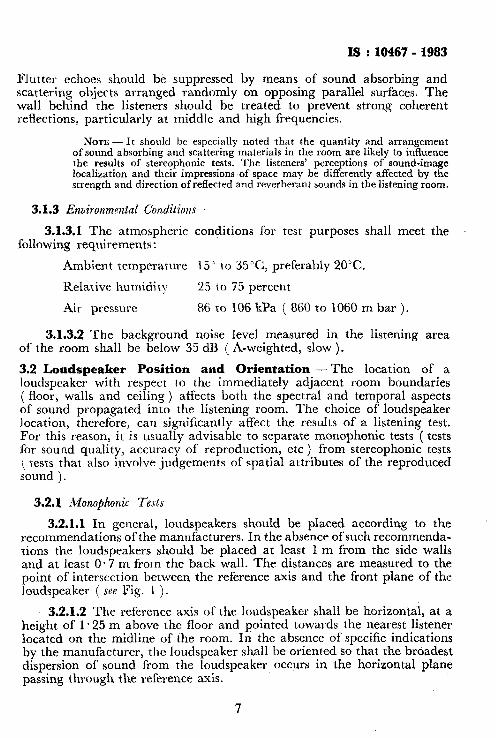
3.2.1.1 In general, loudspeakers should be placed according to the recommendations of the manufacturers. In the absence of such recommenda- tions the loudspeakers should be placed at least 1 m from the side walls and at least 0.7 m from the back wall. The distances are measured to the point of intersection between the reference axis and the front plane of the loudspeaker ( see Fig. 1 ).
3.2.1.2 The reference axis of the loudspeaker shall be horizontal, at a height of 1.25 m above the floor and pointed towards the nearest listener located on the midline of the room. In the absence of specific indications by the manufacturer, the loudspeaker shall be oriented so that the broadest dispersion of sound from the loudspeaker occurs in the horizontal plane passing through the reference axis.
7

IS : 10467 - 1983
fWE;;NCE
LOUDSPEAKE
/ SEATING LISTENING ’
: AREA
I
AXIS
‘\ ____ ___-_-_,--,,,w.J
f >I
I B 3 3.5 t MONOPHONIC)
Bb 1.0 ( STEREOPHONIC)
SCHEMATIC PLAN CEILING
I--’
v= 80::; In3
fo I roe.5 + H=Z*LS-O.15
1.25 I
FLOOR I +
SCHEMATIC ELEVATION
All dimensions in millimetres.
*As low as 0.5 m for stereophonic tests.
FIG. 1 LISTENING Roow
3.2.1.3 In most cases it is not necessary to modify the position of the loudspeakers to check the effects of directivity, owing to the variety of listener locations with respect to the reference axis. If for some special reas~on the directional properties of a loudspeaker are to be assessed by a listening test, the loudspeaker may be turned through certain angles that should be specified in the test report.
L
8

IS : 10467 - 1983
3.2.1.4 Different loudspeakers under monophonic comparison should be separated by at least 0.5 m. The actual positions used should be stated in the test report. Where possible, loudspeaker positions should be inter- changed during the tests so as to avoid biasing the overall results by con- necting particular loudspeakers with particular room positions.
NOTE - Mechanical devices that substitute the different loudspeakers in the same room location suffer through a lack of flexibility in loudspeaker place- ment, but may be useftd in some applications.
3.2.1.5 The loudspeakers under test shall be rendered invisible to the listeners by an acoustically transparent screen separating the speaker and listener areas ( see Fig. 1 ). The effect of the screen on the frequency response of the loudspeakers shall be less than 1 dB at any audio frequency ( measured anechoically with the screen midway between a loudspeaker and microphone spaced at 2 m ).
3.2.2 Stereophonic Tests
~3.2.2.1 The main purpose of stereophonic listening tests is to judge the ability of loudspeakers to reproduce the illusion of sound images localized in azimuth, elevation and depth, as well as the acoustical ambiance of an original performance. Since more than one pair of loudspeakers cannot, at one time, occupy the same room positions, judgements of this type tend to be confounded by the switching of source locations. A mechanical substitution device may be a satisfactory solution for use with many popular loudspeaker configurations.
3.2.2.2 Under normal circumstances, therefore, it is recommended that stereophonic listening tests be conducted using one pair of loudspeakers at a time. Comparative tests that do not involve positional substitution of loudspeakers must be treated with caution.
3.2.2.3 In listening rooms of typical dimensions it may be necessary to move the loudspeakers to within 0.5 m of the sidewalls in order to achieve the separation necessary for satisfactory stereo perspective. The final arrangement shall be such that the loudspeakers subtend an angle of 55” to 65” at the nearest listener position, that is a listening distance that is in the region of 1 .O to 0.8 times the loudspeaker spacing. For good stereo the arrangement of loudspeakers and listeners should be symmetrical about the major axis of the room.
3.3 Listener Position
3.3.1 Listeners shall be seated in the area of the room specified in Fig. 1. For the purpose of averaging over the directional properties of the loud- speakers and the acoustical coupling properties of the room it is advanta- geous to use several listening positions in the course of a test. In stereophonic
9

Is- : 10467, - 1983
tests it is essential that listeners be arranged in a line on the axis of symmetry of the loudspeaker array. Listeners from front-to-rear of the line arrange- ment should be progressively elevated to give each head a clear view of the loudspeakers. In monophonic tests only one listener position need be on the room~axis; the others can be placed at random within the suggested area. Each listener position should offer a clear acoustical ‘ view ’ of all loudspeakers under test.
NOTE - Listeners position may be interchanged to judge the dispersion character- istics of the speakers.
3.3.2 Each listener should be placed at least 0.4 m from the side walls and at least 1 m from the back wall. The distance between listeners should be at least 0.6 m.
3.3.3 Although there can be any number of listener positions the number of listeners at any session should be limited. The most critical tests may involve only single listeners, occupying the different positions at different times. In large rooms a maximum of 5 listeners may be used simultaneously.
3.3.4 With multiple listeners it is difficult to avoid mutual influences that encourage group rather than individual responses. Possible remedies include a visual separation of listeners by means of acoustically transparent screens, randomization of listener tasks so that no two persons are responding to the same question at the same time or, simply, instructions emphasizing the importance of independent responses.
3.4 Programme Material
3.4.1 The selection of music or speech passages for programme material in a listening test can have a very strong effect on the results of the test. Often there are interactions between specific loudspeakers and particular types of programme to such an extent that the ratings of the various systems will depend on the passages of music or speech preseoted. The programme material should therefore be treated as a separate independent variable.
L
3.4.2 The programme sections should differ from each other in a way that brings out different aspects ( dimensions ) of the perceived sound quality of the loudspeakers.
NOTE - If it should prove feasible to isolate specific dimensions of perceived sound quality, each section of programme material could be selected to measure that dimension alone. Arbitrarily collected programme material is likely to be partly redundant, which means that several programme sections can indicate the same perceptual factors and therefore increase the test length without adding any new information. Such redundancy can be reduced by examining the test results from a variety of programmes and eliminating some of the sections that yield essentially identical results. By this procedure the listening test is made more efficient.
10

IS : 10467 - 1983
There is also a risk that the programme material is incomplete, which means that certain aspects of sound quality are not covered by any of the programmes. Inspection of the perceptual dimensions given in 4.3 may give certain clues for selecting pro- grammes which together will extend over most dimensions of perceived sound quality.
3.4.3 At least five different programme sections should be included. It is recommended that one section consists of speech, preferably a male voice at normal conversation level. Part of the recorded test instruction can be used for this purpose. The speech shall be recorded in an anechoic room with no perceptible source of sound other than the speaker. The microphone shall be of the omnidirectional type. It is placed in the same horizontal plane as the speaker’s mouth at a distance of 0.5 m from the latter and to one side, the line joining microphone and mouth forming an angle of 30 with the sagittal plane of the speaker’s head.
3.4.4 Another section should be a full symphony orchestra playing fortissimo, which is known to differentiate strongly between loudspeakers. Other music sections should contain combinations of small numbers of the following instruments :
a) Piano, violin and cello,
bj Woodwind and strings,
c) Brass instruments,
d) Percussion instruments,
e) Solo voice and instrumental accompaniment, and
f) Chorus of voices.
The preceding music sections are intended to test the accuracy of sound reproduction and, therefore, they rely on music of the classical or jazz repertoire which can be compared with an acoustical ’ original ‘, for example in the concert hall. Recordings of popular music tend to be studio creations, incorporating artificial compression, colourations and spatial effects. Certain types of popular music such as rock and disco, reproduced at high levels stress speakers in ways classical music cannot. In evaluating products for the general public it is important to include some tests of their ability to satisfactorily reproduce this kind of musical material.
L
3.4.5 The music sections should demonstrate a variety of musical types a.nd sound levels, but the variations of timbre and loudness within each section should .be as small as possible.
3.4.6 The recorded programme material must be of high technical quality. Ideally there should be no frequency or amplitude distortions in the recording and reproduction chain, and background noises should be inaudible. Original recordings made under strict control are desirable
11
IS : 10467 - 1983
but carefully-selected commercial recordings. are acceptable. Furthermore, no manual or automatic amplitude compression shall be used at one end of the chain without the corresponding expansion at the other end.
NOTE - Because uncontrolled variations exist in commercial recordings ( the number of microphones used, their types and placement, equalization, added rever- beration, etc ) it is sometimes advisable to use musically redundant sections from a variety of sources ( different recording companies, studios, engineers, etc ). The music and its sources shall be quoted in the test report.
The preparations of an internationally recognized standard programme tape is under consideration. Such a tape would facilitate the comparison of listening tests done at different places.
3.4.7 Where the musical programme is to be used to test other than high fidelity system components ( for example, A. M. receivers ) band limiting is permitted. The precise frequency weighting function must be specified in these instances.
Programine sections should be of approximately equal durations, in the range 20 to 40 seconds. For pair-wise comparisons identical sections are used in a pair. Sections of music should as far as possible form complete musical phrases.
3.4.8 It is often convenient to record the programme sections on magnetic tape in an order suited to the test procedure. The length of silent periods between sections will also depend on the test procedure and must be long enough to permit the writing down of the test score. 5 to 15 seconds is normally sufficient for the scoring, but a longer interval may be necessary for the experimenter to rewind the tape. The pause between repeated sections in a paired comparison should be about 1 second and not longer than 2 seconds.
NOTE - The tape recorders used shall be conforming to that specified in IS : 8655 ( Part III )-1977* and IS : 9551 ( Part V)-1980t.
3.4.9 The programme tape shall also contain necessary frequency- response and sound-level calibration signals.
3.5 Level Setting
3.5.1 Listening Levels for Programmes
3.5.1.1 For each programme section, the reproduced sound leve should, in principle, be the preferred listening level for the average listener. There is some experimental evidence that the preferred sound level is often
*Magnetic sound tape recording and reproducing equipment (reel-to-reel i : Part III Professional type.
tHigh-fidelity audio equipment and systems : Part V Magnetic sound tape recording and reproducing equipment.
12

IS : 10467 - -1983
fairly close to the level of the original speech or music at a typical listener’s position during the live performance. The task of making ’ true-to-nature ’ ratings ( see 4.4 and Appendix A ) of reproduced sounds can be done only at sound levels close to the original.
3.5.1.2 It is, therefore, recommended that the test level be approxi- mately matched to the original sound level. Alternatively, the preferred average listening level may be assessed by listening tests on each programme section, carried out in the listening room using a high quality loudspeaker.
It is often desirable to include more than one listening level in a test. One reason is that there are large differences between the preferred listening levels of the individual subjects, and some listeners may prefer considerably lower levels than the average. Another reason is that some small loudspeakers may be overloaded by levels which are preferred for bigger loudspeakers. If additional listening levels are used, they should be chosen in steps of 10 dB below the primary level. However, in order to limit the total test length, it is not generally necessary to repeat all programme sections at each listening level. Instead, only those one or two programme sections having the highest level in the test might be reproduced at 10 or 20 dB lower levels.
3.5.2 Relative Levels fir Loudspeakers
3.5.2.1 Ideally, the reproduction of one and the same programme section should sound equally loud over all loudspeakers. This can be, achieved for very similar loudspeakers but may not be possible for loud- speakers with very different frequency responses. Adjustment for the same loudness can be made by subjective or objective methods.
3.5.2.2 Since the subjective method is impractical for loudspeakers of dissimilar frequency ~response, balancing by an objective method is preferred in this case. For loudspeakers of similar response a subjective comparison of each pair of loudspeakers for every programme section should be made ( in this case the method of pair-wise comparison is anyway indicated for the actual listening test, see 4.4 ).
L
3.5.2.3 The following objective method is recommended:
a) Test Signal --Continuous noise with a spectrum representing properties of the average of all types of programme material according to IS : 9302 ( Part I )-1979”.
*Characteristics and methods of’ measurements for sound system equipment : Parr I General.
13

IS : 10467 - 1983
b) Measuring instrument - Sound level meter with weighting curve A, slow characteristics according to IS : 9779-1981*.
3.5.2.4 The sound level is measured in the listening room at ear level in the middle of the seating area when the loudspeakers are fed with the test signal, and the gain is adjusted until the meter reads the same for all loudspeakers.
3.6 Electrical Requirements - If the listening test is to be a valid indicator of differences between loudspeakers it is essential that careful consideration be given to certain electrical requirements.
3.6.1 Power Amfilifet
3.6.1.1 The power amplifier must be capable of driving all test loud- speakers at the highest sound level without clipping, instability or triggering of protective circuitry. It is good practice to monitor the amplifier output, during at least preliminary tests, using an oscilloscope or peak power indicator. The complex impedance of some loudspeaker and connecting wire combinations can cause problems with certain power amplifiers.
3.6.2 Switching System
3.6.2.1 It is common place in listening tests to use a switching system to select the different loudspeakers under test. Such a system must not compromise the performance of either the loudspeakers or the power amplifier. Switch contact resistance, especially in the amplifier output circuit, must be very low and must be checked periodically for deterioration ( see 3.6.3 ). Level settings ( see 3.5 ) shall be accomplished by means of potentiometers positioned before the input to the power amplifier. It shall be confirmed by measurement that these are no frequency-response changes, within the audible bandwidth, due to improper impedance matches at either the pre-amplifier output or the power amplifier input. It is essential with some amplifiers that the input and output common ( negative or earth ) lines not be connected through the switching system. Failure to achieve this isolation can result in frequency-response modifications related to loudspeaker impedance characteristics.
3.6.3 Connecting Wires
3.6.3.1 Wires from the power amplifier output to the loudspcakerb should be as short as possible and in any event shall be of sulhcient gauge that the total resistance of any loudspeaker circuit ( measured from the power amplifier output, through all selector switch contacts to the short- circuited loudspeaker terminals ) does llot exceed 0‘ 2 ohms.
*Specification for sound level meters.
14

IS : 10467 - 1983
4. EXPERIMENTAL PROCEDURE AND EVALUATION
4.1 Subjects
4.1.1 The choice of subjects depends on the population of listeners for which the test results are supposed to be valid. It is known that there are differences in the judgements of listener groups having different experi- ence of ’ high-fidelity ’ listening, musical training, etc. Within a group of similar experience the inter-individual reliability is normally quite high and therefore, the number of subjects in such a group can be rather small ( however, 4 subjects should he considered as a minimum, see Appendix C ).
4.1.2 The number of groups, on the other hand, depends on the desired generality of the test. For tests in research and development one group of experienced listeners may be sufficient ( experienced in ‘ hi-fi ’ listening and preferably also in listening to live music ). If the results are to be generalized to a specified population of people, the subjects should be selected in such a way as to ensure that they are representative of the population in question ( see also Appendix C ).
4.1.3 The reliability of the ratings should be checked during the statistical treatment of the data ( see Appendix C ) and ought to be considered as an important part of the information contained in the last results. If the reliability is judged not to be satisfactory it may be preferable to include more subjects in the test.
4.1.4 The listeners should be checked for normal hearing ( hearing threshold levels less than 20 dB h 1 in the frequency range of 125 - 8000 Hz ). Hearing impaired people need not necessarily be excluded as subjects, but their test results should be analyzed separately to see whether it is reasonable or not to pool their data with data from normal-hearing subjects.
4.2 Test Duration
4.2.1 For practical reasons the length of a single test session should be limited to about one hour, with one or two breaks. The total duration depends on such factors as the test procedure, the number of systems in- cluded in the test, the desired number of subjects and replications presented to each subject. Examples of how the test duration can be estimated are given in Appendix B. For comprehensive listening tests it may be necessary to use more than one test session for each subject.
4.25 No subject should be engaged ‘in more than 2 hours of listening per day.
15

IS : 10467 - 1983
4.3 Rating Scales
4.3.1 In the standardized listening test, the subjects are asked to rate the quality of the sound reproduction on an interval scale marked from 0 to 10 and with certain verbal definitions. It is expected that scores from 1 to 9 are actually used, while the scale values of 0 and 10 may be regarded as ‘ anchors ’ defining the end points of the scale.
4.3.2 For the assessment of the overall sound quality two cases may be distinguished :
a) For music and speech using conventional acoustical instruments and natural voices, it is recommended to judge the fidelity or accuracy of the sound reproduction of a ’ true-to-nature ’ scale. The subjects’ more or less extensive knowledge about the nature of the original sound will then serve as an ‘ internal reference ‘. A ‘ true-to-nature ’ criterion is in line with the ‘ high-fidelity principle in modern sound reproduction.
b) For music and speech using electronic or electro-acoustic devices for sound generation ( as in electronic music, much pop music etc ) it is hard to apply the ‘ true-to-nature ’ criterion. In these cases it is likewise recommended to judge the fidelity or accuracy of the sound reproduction, but now in relation to the ‘ intended ’ sound. The subject’s more or less extensive knowledge about the normal ‘ sound ’ in these kinds of music will then serve as his ’ internal reference ’ for the judgementx.
4.3.3 In both cases the same 10-O rating scale is recommended to be used with the verbal definitions ‘ Excellent - Good - Fair - Poor - Bad ’ ( or their translations into other languages ) inserted as shown in the figure below. A more detailed description of the rating scale appears in connection with the instruction given in Appendix A.
16

IS : 10467 - 1983
4.3.4 The overall sound quality can be considered as a multidimensional attribute, that is, it is constituted by some combination of separate per- ceptual dimensions. It may therefore, be useful to supplement the judge- ments on overall quality with judgements on specific perceptual dimensions. Presently there is not sufficient knowledge available to justify definite recommendations about which and how many supplementary scales should be included. Awaiting further results on this topic the selection of supple- mentary scales is therefore, left to the user’s consideration.
NOTE -A survey of present research suggests the following dilnensions to be constituents of the overall sound quality:
Clearness / Distinctness Sharpness 1 Hardness T’ersm Softness Brightness Versus Darkness Fullness / Voluminosity Vmus Thinness Feeling of space Nearness / Distance Disturbing-sounds Loudness
The relative importance of these dimensions is probably different in different contexts and for different subjects. It is expected that future research will provide more detailed information that can be used in practical listening tests.
4.4 Choice of Test Procedure
4.4.1 A basic requirement on a listening test is that it should be designed as a controlled experiment. The dependent variable in the test is the subject’s judgements. The independent variables to be manipulated by the investi- gator are primarily the loudspeakers under test and secondarily the pro- gramme sections. Extraneous variables should be eliminated or held under due control to avoid that they influence on the judgements.
4.4.2 Two different test procedures are recommended:
a) Single stimulus ratings ( SSR )
b) Paired comparisons ( PC: )
4.4.3 The method of single stimulus rating implies that each ‘ stimulus ’ is presented separately and a rating is made by the listener before the next stimulus is presented. A stimulus means the reproduction of a certain programme section over a certain loudspeaker.
4.4.4 The method of paired comparisons, on the other hand, means that all stimuli are presented in paired sequences, each pair consisting of a certain programme section reproduced first over one loudspeaker and immediately afterwards over another loudspeaker. The time patterns for the stimulus presentation in both procedures are illustrated in Appendix B.
17

IS : 10467 - I983
NOTE -While comparing the loudspeakers the listening should also be carried out by interchanging the position of the two speakers, since the position changes the response.
4.4.5 The rating scale as recommended under 4.3 is applicable for both methods.
4.4.6 Which of the procedures, SSR or PC, that should be applied depends on the number of loudspeakers, the desired number of replications ( that is, repeated applications of each stimulus in order to increase the reliability of the ratings ) and the time available for doing the test. A comparison between SSR and PC taking these factors into account is given in Appendix B.
4.4.7 It may be noted that for up to six loudspeakers included in the same test the PC procedure does not lead to noticeably longer test times than the SSR, because of the shorter pause between the presentations in a pair and also because some or all of the desired replications are obtained by the necessary number of pairwise comparisons ( see 4.6 ). The PC proce- dure is preferred by most subjects and in particular when several of the systems under test are of about equal quality, so that finer discriminations have to be made. A combination of both procedures is possible, starting with SSR for a large group of loudspeakers and then proceeding with PC solely on those systems which have received about the same rating.
NOTE 1 - Independently of the test procedure, a reference loudspeaker may be included in some or all tests in order to facilitate the comparison of results between different tests.
NOTE 2 - A modification of the recommended PC procedure is to refrain from numerical judgements, asking the listener(s) merely to state which reproduction ( loudspeaker ) in the pair they prefer with regard to the fidelity ( accuracy ) of the reproduction. The resulting data will thus not be direct numerical judgements of the loudspeakers, but only give the frequency with~which each loudspeaker is pre- ferred to any other loudspeaker. This can be used for a ranking of the loudspeakers. If wanted, these rank order data may possibly be transformed into an interval scale by use of models like the law of comparative judgements or models for so-called nonmetric scaling. The simplified preference procedure will usually give less infor- mation than the recommended PC procedure with regard to the size of the differences between the loudspeakers. The recommended procedure also gives more freedom in the data treatment in the sense that either the numerical judgements are treated directly as described in 4.7 and Appendix C, or they can also be used to compute the freauencv with which each loudsneaker is oreferred to anv other loudsneaker as discussed in this note.
4.4.8 To counteract the influence on the judgements due to practice, fatigue, or other variations with time, a random presentation order of the stimuli ( that is combinations of programmes and loudspeakers ) should be used. A different random order should be used for each test session run.
18
IS :10467 - 1983
4.4.9 In the PC procedure the requirement for random presentation order refers to the order of the stimulus pairs ( see figure in Appendix B. ) Within each such pair the order of the respective two loudspeakers should be balanced ( that is, the order d - 11’ and A’ - B should occur equally often ) .
4.4.10 If necessary for practical reasons, some kind of systematic pre- sentation order may be used instead of a completely random one, provided that the possible progressive effects ( due to such factors as practice, adapta- tion, fatigue, etc ) are distributed equally over the stimulus conditions in the test. However, it should be noted that the application of analysis of variance as outlined in Appendix C presupposes completely random order of presentation.
4.4.11 The actual implementation of a listening test according to either of the two recommended procedures should be clear from Appendices A and B.
4.5 Instruction and Preliminary Trials
4.5.1 The instructions given to the subjects in a listening test have a noticeable effect on their behaviour and judgement. The crucial part is the definition of the judgement scale as well as indications of how it is to be used. Therefore, a specific wording of this part of the instruction should be included with each standardized test procedure and should be used word for word ( see Appendix A ).
4.5.2 It is desirable to include some comment upon the listeners’ possibility of knowing how the music ( or speech ) actually sounded in its original form or how it is intended to sound. The importance of this will, however, depend on the programme~sections and subjects chosen for the test.
4.5.3 The instruction should be given both orally ( preferably from a tape-recording ) and in written form at the same time.
4.5.4 After the presentation of the instruction a number of preliminary trials should be made to facilitate adaptation to the judgement situation. The stimuli in these trials should be representative of those in the real test. If the duration of the complete test is about one hour, the training session should last at least 7-8 minutes. For continued test sessions the number of preliminary trials may be successively decreased, but it is recommended to have a few ’ warming-up ’ trials directly after the break in the middle of a session.
4.6 Number of Judgemrntr
4.6.1 A minimum requirement is that each subject shall judge each stimulus ( equal to the reproduction of a certain programme section over a
19

IS : 10467 - 1983
certain loudspeaker ) at least once. To make possible a calculation of the reliability of a subject’s judgement, however, two replications for every stimulus are necessary, and three of four replications are often desirable.
4.6.2 With the single stimulus rating procedure, the number of repli- cations may be chosen together with the total test length and the number of subjects so as to yield the desired reliability.
4.6.3 In the PC procedure with IZ loudspeakers the number of repli- cations for each stimulus will automatically be n - 1, since each loudspeaker is paired with each of the other a - 1 loudspeakers for each of the programme sections. [ The total number of paired presentations of loudspeakers for each programme is n ( n-l )/2 1. If the number of loudspeakers is sufficiently large, the desired reliability will probably be reached without still further replications.
4.6.4 For both methods, see Appendices A and B for further details.
4.7 Statistical Treatment of the Data
4.7.1 A description of the statistical analysis is given in Appendix C. Only the main principles are given here.
4.7.2 The subjects’ iudgement data are entered into appropriate pro- gramme x loudspeaker matrices for each single subject and/or for all subjects together. Arithmetic means are computed for all programme x loudspeaker combinations, for loudspeakers in average over the programmes, and for programmes in average over the loudspeakers. Visual inspection of these matrices and of possible corresponding graphical displays is made to reach conclusions about the judged properties of the loudspeakers in general and in combination with various programme sections. ,
4.7.3 If a more detailed statistical analysis is required, this can be done by means of analysis of variance and other related statistical tests. This makes it possible to evaluate the dependency of the judgements on the loudspeakers, the programmes, the subjects, and on various interactions between these factors. The analyses of variance may also be used to estimate the reliability of the judgement data, both within each single subject ( intra- individual reliability ) and over all subjects together ( inter-individual reliability ). c
4.8 Contents of Test Repert
4.8.1 The report of a listening test should in principle include relevant information on all items explained in 3 and 4.
4.8.2 Especially, accurate specification should be given on the following items :
a) Listening room and its characteristics ( dimensions, reverberation time, atmospheric conditions, etc ) ;
b) Loudspeakers and their position in the room;
20

IS : 10467 - 1983
Programme material ( descriptions and references to available gramophone records or tapes ) and the sound levels used for pre- sentation;
Number and type of listeners and their position
Test procedure in detail ( stimulus presentation, instruction, number of judgements, etc ) ; and
Statistical treatment of the data ( see Appendix
APPENDIX A
in the room;
judgement scales,
c: ).
(Clames 3.5.1.1, 4.3.3, 4.4.11, 4.5.1, and 4.6.4)
INSTRUCTIONS FOR LISTENING TESTS
A-l. SINGLE STIMULUS RATINGS
A-l.1 In this experiment the testing shall listen to some different sections of music and speech, which are presented ( played ) over different loud- speakers. The listeners shall listen to one section at a time presented over one of the loudspeakers. For every such case the listener shall judge the ‘ fidelity ’ of the sound reproduction, that is, how true to nature the original sounding music ( speech ) is reproduced.
A-l.2 The judgement shall be made on a scale from 0 to 10 as represented in the following figure:
X~mber 10 denotes a reproduction which is perfectly true to nature. The listeners would not be able to hear any difference between this reproduction and the origi- nal ( ‘ live’ ) performance of the music ( speech ).
.Number 0, on the other hand, denotes a reproduction so bad that it has practically no simi- larity at all with the original ( ‘ live ’ ) pel~formance. A still worse reprodllction cou!d hardly be imagined.
1
t BAD
21

IS : 10467‘- 1983
A-1.3 As the scale goes down from 10 to 0 the degree of fidelity ( accuracy ) in the reproduction becomes increasingly worse-as indicated by the defini- tions inserted in the figure. Thus 9 denotes ‘ Excellent ’ fidelity, 7 ‘ Good ’ fidelity, 5 ‘ Fair ‘, 3 ’ Pot-jr ’ and 1 ‘ Bad ’ fidelity.
A-l.4 The listeners shall not feel obliged to use the defined numbers any more than other numbers. 0bserving the given definitions the listener is free to use any number between 0 and 10, which is most suitable to character- ize the degree of fidelity ( accuracy ) in the corresponding reproduction. If necessary, one decimal place may be used.
A-l.5 If any of the selected programme sections represents music or speech for which the ‘ true-to nature ’ criterion is not applicable ( see 4.3 ) an addition is made to the above instruction of about the following type.
A-1.5.1 ‘With regard to the programme section(s) . . . it is difficult to make a ‘ true-to-nature ’ judgement because . . . ( the programme is des- cribed and the reason is given with regard to this specific programme ). In this case, therefore, the listener should judge the fidelity or accuracy of the reproduction in relation to what the listeners think is the ‘ intended sound ’ of this music. Still the lo-00 scale shall be used with verbal defi- nitions ‘ Excellent-Good-Fair-Bad-Poor ’ as shown in the figure. However, the definition of the end points of the scale are changed. The number 10 now denotes a reproduction which is perfectly true to the ‘ intended sound ‘. The number 0 denotes a reproduction that has practically no similarity at all to the ‘ intended sound ‘.
A-l.6 The instruction should also give information about the approsimate tesi duration, pauses, preliminary trials and other details helpful for the listener. To avoid premature judgements, it is desirable to prescribe that the &dgemcnts shall not be made until the end of the respective programme sectIon. It s!~~ld be underlined that ‘ the ,judgements shall not reflect holv the liytertcr likes, the music as such but only refer to the fidelity of ihe reproduction.
A-2. PAXRWISE COMPARISONS
L
A*,%1 111 this CS~VI inlent tltc listenc‘r shall listen to some different sections of music ( speech ) which are presented over diflerent loudspeakers. Each section is presented (1vic.e in immediate succession, the first time over one of (11~ loudspeaker?, the second time over another loudspeaker ( which
22

ES’ : 10467 - 1983
two loudspeakers appear in such a pair varies, of course, from case to case ). For every such pair the fidelity of the sound reproduction of the two loud- speakers shall be judged, that is, how true to nature the original sounding music ( speech ) 1s reproduced by the respective loudspeaker.
A-2.2 The judgement scale is described as under ‘ single stimulus ratings ’ above.
A-2.2.1 The listener. shall judge the fidelity of‘ the sound reproduction on the O-10 scale for each of the two loudspeakers appearing in every pair presented. Thus one number shall be given for the loudspeaker appearirlg first in the pair and one nunIber for the loudspeaker appearing second. Same number for both of them are not allowed, but diGrent numbers shall be used.
A-2.3 The instruction is completed with various practical details etc, as above under ’ single stimulus ratings ‘.
APPENDIX B (Clauses d.2.1, 4.4.4, 4.4.6, 4.4.9, 4.4.11 and 4.ti.4)
EXAMPLE FOR ESTIMATION OF TEST DURATION
B-l. COMPARISON OF TEST LENGTH
B-l.1 The time patterns for stimulus presentation, according to tlrc two experimental procedures defined in. 4.4 and the duration of pi ograrnmes and pauses recommended in 3.3 can be illustrated in the following way:
a) Single stimulus rating ( SSR )
Stimulus = a certain programme section reproduced over a certain loudspeaker
23
.

IS :10467 - 1983
b) Paired comparison ( PC )
t STIMULUS PAIR RAtlNd
CL A B 8’
20-10 20-60
< 1-2 5-15 s,
ts
NOTE - The time pattern for changeover from one speaker to the other can be chosen by the listener.
where Stimulus pair =a certain programme reproduced over two
different loudspeakers
B-l.2 A comparison between the test durations for the SSR and PC proce- dures ( SGZ Table 1 ) can be made under the following assumptions:
1~ = number of loudspeakers
m = number of programmes
I = ncmber of replications
ti = duration of instruction
6p = duration of preliminary trials
Assumptions :
ti = 7 minutes
fp = (n+m) minutes
.V = number of presentations ( see Note 1 )
tr = duration of presentation of a programme section, including pauses
r = N . ts = specific listening time per subject and programme ( see Table 2 )
L = T.m+ ti + t, = total test length per subject ( see Table 3 )
NOTE 1 - Xumber ofpresentations Nis obtained as n.7 single stimuli, or n ( N - 1 )/2 pairs, for SSR and PC respectively, except for the necessary multiplication for PC when n<4.
NOTE 2 -All time values are examples only and serve mainly the purpose of comparison.
24

IS : 10467 - 1983
TABLE 1 ASSUMPTIONS FOR THE PRESENTATION TIME ts ( IN SECONDS )
(Clause B-1.2)
UUR,~TION
(1)
SSR PC
(2) (3)
Stimulus A 30 30
Pause - 2
Stimulus A - 30
Pause 15 15
ts 45 77 ( per pair )
TABLE 2 CALCULATION OF THE SPECIFIC LISTENING TlME T ( MINUTES PER SUBJECT AND PROGRAMME )
( Clause B- 1.2 )
n
(1)
N--I !* N PRESENTATIONS 1 miu ( We NOTE ) -------------- ---- --
SSR PC SSR PC
(2) (3) (4) (5) (6) (7)
1 0 4 4 - 3
2 1 3 G 3 4’5 3’85
3 2 4 12 6 9 7.7
4 3 3 12 8 9 7’7
5 4 4 211 10 15 12’85
G 5 4 24 15 18 19’25 - - - - - - -
- - - - - - - - - - - - - -
10 9 4 40 4.5 33’15 57’75
NOTE - Comparison is of course dependent on the value of 7, for 2<n<5, r has been chosen in such a way that for PC the number of replications ( n - 1 ) can be multiplied by an integer ( 3, 2, or 1 ) to make up the desired number of replicatious ( 3 or 4 ). For n>5, n - 1 will always be >r, and the comparison between SSR and PC is no longer on equal terms, since the larger number of replications for PC at the same time will increase the reliability. The longer test will, therefore, also be more accurate.
25

IS : 10467 - 1983
TABLE 3 CALCULATION OF THE TOTAL TEST LENGTH L
( in minutes, rounded off ) for m= 5 programmes
( I;‘%ruv H-l .2 )
11
(1)
I. ( nhutes ) (-_---.-__L_._-_~
SSK PC: (3) (4)
1 6
2 7
3 ,‘:
4 !I
5 10
6 11
- - - 10 15
28 -
37 34
tie 54
fi I 53 92 82
108 115
- --
- -_
- --_
191 311
AVYENDIX C
[Clnuses 4.1.1, 4.1.2, 4.1.3, 4.4.7 (Voter!), 4.4.10, 4.7.1 and 4.8.2 (f) ]
STATISTICAL TREATMENT OF DATA FROM LISTENING TESTS
C-l. INTRODUCTIION.
C-l.1 This Appendix is an abbreviated version of a detailed technical report on the ‘ Statistical treatment of data from listening tests ’ ( Gabriels- son, 1979 ). The Appendix is limited to present the general principles for the statistica. analysis described in this report. For details in applications and for more complete understanding of the analysis it is recommended to directly consult the technical report and/or literature cited there.
C-1.2 Each subject in a listenin, 0‘ test is assumed to make a certain number of ratings on the 10-O ‘ true-to-nature ’ scale for each loudspeaker x pro- gramme combination in the test as described under C-4. To get as much Information as possible from the data it may be preferable to treat thern intra-individually ( that is, within each subject ) as wdl as inter-individually ( that is, over subjects within the same group of subjects). The rtatistical treatment may conveniently be divided into two steps.
26

IS : 10467 - 1983
C-1.2.1 Descriptiue Statistics -- In this step the rating data are entered into suitable matrices to make them easily surveyable, and certain common statistics ( for example arithmetic means ) are computed. The data may also be displayed in graphical form. Visual inspection of the matrices, the graphs, and the computed statistics usually lead to certain conclusions about the loudspeakers under test.
This type of descriptive statistics should always be applied and general11 presents no special diEiculties. It is described in C-2 and in parts of C.9.
C-1.2.2 Inferewe Statistics - In this step the rating data are analysed further by means of‘ alla&is of variance ( RNOVA ) and related procedures to test if differences between the ratings for different loudspeakers ( and/or for different programmes ) are statistically significant or not, and if there is an interaction between loudspeakers and programmes. ANOVA may also be used to estimate the reliability of the data, intra-individually and inter-individllally.
C-1.3 The application of this type of statistical trraimcnt is optional. It requires more work and more knowledge about statistics. On the other hand it usually enables the user to extract mnre detailed information from the data and to arrive at more definite conclusiolls. It is also easily general- ized to more comply listening tests. It is tlrscribcd in C-3 to C-8.
C-l.4 In order to illustrate these steps an example will be given using real data from a listening test with four loudspeakers and five programrues. The example refers to ratings on a 10-O ‘ true-to-nature ’ scale. However, the statistical procedures described below may also be used for other rating scales ( ‘ pleasantness ‘, ’ distinctness ‘, ‘ softness ‘, or what may LX the case ) constructed in similar ways.
C-2. DATA MATRICES, DESCRIPTIVE STATISTICS
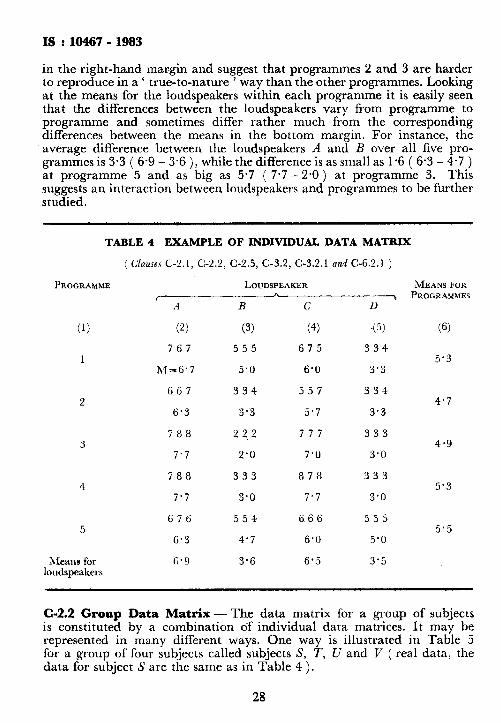
C-2.1 Individual Data Matrix---For a certain subject in this listening test the following data were obtained, see Table 4. He made three ratings per each loudspeaker ?c programme combination. These three values appear in the upper row of each cell, and their arithmetic mean ( M) is <given directly below.
L
C-2.1.1 Direct visual inspection of this matrix reveals much about the results. This subject shows a high stability in his ratings ( high ilktra-- individual reliability ) --- the three ratings within each cell differ very little or are even the sarnc in many cases. The mean ratings for the ioud- !peakers ( over the five programmes appear in the bottom margin and indicate that loudspeakers ,4 and C arc superior to loudspeakers B and 1). The mean ratings at each programme ( over the four loudspeakers ) appear
27
IS : 10467 - 1983
in the right-hand margin and suggest that programmes 2 and 3 are harder to reproduce in a ‘ true-to-nature ’ way than the other programmes. Looking at the means for the loudspeakers within each programme it is easily seen that the differences between the loudspeakers vary from programme to programme and sometimes dialer rather much from the corresponding differences between the means in the bottom margin. For instance, the average difference between the loudspeakers A and B over all five pro- grammes is 3.3 ( 6.9 -- 3.6 ), while the difference is as small as 1.6 ( 6.3 - 4.7 ) at programme 5 and as big as 5.7 ( 7.7 - 2.0 ) at programme 3. This suggests an interaction between loudspeakers and programmes to be further studied.
TABLE 4 EXAMPLE OF INDIVIDUAL DATA MATRIX
( Clauses C-2.1, C-2.2, C-2.5, C-3.2, C-3.2.1 nmi C-6.2.1 )
PROGRAM~TE LOUDSPEAKER MEANS FOR r------------ -h-------_~ PROGRAUEF
A B c D
(1) (2) (3) (4) x5) (6)
767 555 675 334 1 5’3
hI=6.7 5.0 6.0 3.3
667 334 557 334 a 4.7
6.3 3.3 5.7 3.3
788
7’7
788
7.7
2 2.2 777 333 4.9
2’0 7’0 3.0
333 878 333 5’3
3.0 7.7 3’0
5 676 554 666 55 5
5.5 &
6.3 4.7 6.0 5’0
Means for loudspeakers
6.9 3’6 6’ 5 3’5
C-Z.2 Group Data Matrix - The data matrix for a group of subjects is constituted by a combination of individual data matrices. It may be represented in many different ways. One way is illustrated in Table 5 for a group of four subjects called subjects S, T, U and V ( real data, the data for subject S are the same as in Table 4 ).
28

IS : 10467 - 1983
TABLE 5 EXAMPLE OF GROUP DATA MATRIX FOR FOUR SUBJECTS DENOTED S, T, U AND V
(ClausesC-2.2, C-2.6, C-3.3, C-3.3.1, C-4.2, C-4.2.1, C-4.4,G4.4.1, C-6.3and C-9.1.1)
PRO- SUBJECT I,OUDsPEAKER MEAXS FOR
ORAMME c------ ----- ..-_-_ _~~~_~__~~~____~~.~~.~~~ hOGRA.MRIES
‘4
(1) (4 (3) s 7671&=6.7 ‘I’ 5 7 4 _2/1~=5’3
1 U 6 7 7 AJu=6.7 V 6 7 7 iClv=7.3
.W;=6.5 S 667 6.3 ;I‘ 878 7.7
2 I_1 688 7’3 v 187 7.3
7.2
u
!‘f) 3 5 .i .i 0 443 3.7 454 4.3 763 6’0
4.8 334 3.3 323 2.7 433 3’3 ,443 4’3
3.4 S 788 7.7 222 2,o ‘I” 543 4.7 322 2’3
3 17 779 7.7 443 3’7 1: 966 7.0 346 5’0
6.8 3.3 s 788 7,7 333 3’0 7’ 687 7.0 433 3.3
4 1.: 678 7’0 343 3’3 \- 887 7’7 465 3’0
7.3 3.7 S 676 6.3 ‘, 5 4 4 7 T 657 6.0 434 3’7
5 U 6.56 5.7 333 3.0 V 977 7.7 445 4’3
6.4 3.9
Means for 6 8 3.8 loudspeakers
c
(5) 675 6’0 .555 5’0 577 6’3 667 6’3
5.9 357 5’7 447 5’0 678 7.0 874 6.3
6.0 777 7’0 5 3 3 3 7 779 7’7 848 6’0
6.1 878 7’7 545 4‘7 667 6’3 898 8.3
6.8 6 6 6 6 ‘0 563 -1’7 455 4’7 775 6.3
5’4
6.0
I)
(6) (7) 334 3’3 333 3.0 555 5.0 7 4 5 5 . 3
4‘2 3.3 334 3.3 432 3‘0 333 3.0 ,444 4’0
3’3 5.0 333 3.0 112 1’3 344 3.7 33.’ 3.0
‘2 8 4~7
333 3’0 3 1 2 2.n
I12 2’3 774 6’0
3’3 3 3 5 .i 5 5.0 432 3.0 54 1- 4.3 6 6 i .i 7
,I 3 5. 1
3’6
C-Z.3 For each loudspeaker .x programme combination there are twelve ratings, three per each subject. &Is denotes the arithmetic mean of the three ratings by subject S, A&r the same thing for subject T’, and so on. M, ( g for Frouy ) denotes the arithmetic mean for the whole group of subjects. ( 1 hese designations are written only in the upperhand left case but are implicit in the other cases. )
C-2.4 The means for loudspeakers in the bottom margin repersent the mean ratings for the loudspeakers, averaged over programmes and subjects. The means for programmes in the right-hand margin represent the mean ratings al the different programmes, averaged over loudspeakers and subjects.
29
L

IS .: 10467 - 1983
C-Z.5 Visual inspection of this matrix leads to much the same conclusions as the inspection of Table ‘4 ( which was the individual data matrix for subject 5’ ) ; loudspeakers A and C are superior to loudspeakers B and B, there are suggestions of interaction between loudspeakers and programmes, and so on. This matrix also makes it possible to study individual differences in the ratings and/or interactions between subjects and loudspeakers.
C-2.6 A more condensed way of presenting the group data is shown in Table 6. All individual values are omitted, and only the arithmetic means for each programme x” loudspeaker combination are given ( the MLI values in Table 5 ) together with the means for the loudspeakers and for the programmes in the margins.
TABLE 6 CONDENSED GROUP DATA MATRIX
( C1nu.m C-2.6 and C-9.1 )
PROGRAMME
(1)
1
2
3
4
5
Means for loudspeakers
LOUDSPEAKER MEANS POR r-'------------- -JL-.--.----_-~ PROGRAMMES
‘1 B c D
(2) (3) (4) c.5) (6)
6 ’ 5 4.8 5.9 4.2 5.3
7.2 3.4 6’0 3.3 5.0
6.a 3.3 6’ 1 2.8 4.7
7.3 3,7 6.a 3.3 5.3
b 4 3.9 j 4 4.5 5.1
h’a 3.8 6.0 3.6
C-3. ANALYSIS OF VARIANCE ( ANOVA)
C-3.1 Visual inspection of data matrices may sometimes give sufficient information for the purposes at hand. However, to be able to extract more detailed information from the data and arrive at more definite conclusions it may be preferable to use statistical methods like analysis of variance ( ANOVA) and related procedures for significance testing. ANOVA essentially means that the total variance in the data is split up into different components due to the different sources of variation in a listening tets, that is, loudspeakers, programmes, subjects and possible interactions between these variables. The related statistical tests make it possible to decide, with a certain probability, whether the differences in ratings, between different loudspeakers and/or different programmes are ’ true ’ differences, or if they may be due to chance. Similarly it is possible to decide whether there are some ‘ true ’ interactions or not.
30
IS : 10467 - 1983
C-3.1.1 The rationale and the assumptions underlying these procedures are discussed in most texts on statistics and experimental design.
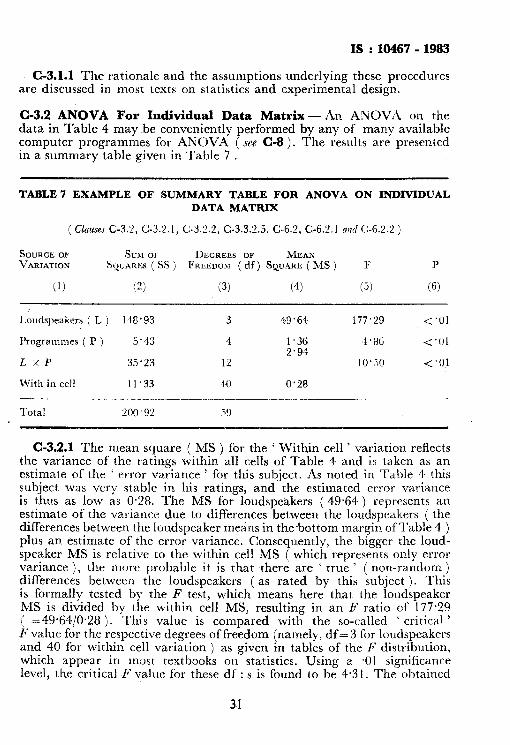
C-3.2 ANOVA For Individual Data Matrix-An ANOVA on the data in Table 4 may be conveniently performed by any of many available computer programmes for ANOVA ( see C-8 ). The results are presented in a summary table given in Table 7 .
TABLE 7 EXAMPLE OF SUMMARY TABLE FOR ANOVA ON INDIVIDUAL DATA MATRIX
( (&useJ C-3.2, C-3.2.1, C-3.2.2, C-3.3.2.5, C-6.2, C-6.2.1 a& C:-6.2.2 )
SOURCE OF Sm1 or I)&GREES OP ~MEAPI’ VARIATION SQUARES ( SS ) FIHZEDOM ( df) SQUARE ( MS ) I: P
(1) (2) (3) (4) (3) (6)
Loudspeakers ( L ) 1 IX.93 3 49’64 177’29 < ‘01
Programmes ( P ) !j“$?, 4 1’36 4.%G <‘Ol 2 .94
L x I-’ 35.23 12 10 ’ 30 <‘Ol
With in cell 11’33 -40 0.2% --___. ~. .~ __~. - _-. .._._ _____-. Total 200 92 .?!I
C-3.2.1 The mean square ( MS ) for the ‘ Within cell ’ variation reflects the variance of the ratings within all cells of Table 4 and is taken as an estimate of the ‘ error variance ’ for this subject. As noted in Table 4 this subject was very stable in his ratings, and the estimated error variance is thus as low as 0.28. The MS for loudspeakers ( 49.64 ) represents an estimate of the variance due to differences between the loudspeakers ( the differences between the loudspeaker means in thebottom margin of Table 4 ) plus an estimate of the error variance. Consequently, the bigger the loud- speaker MS is relative to the within cell MS ( which represents only error variance ), the more probable it is that there are ‘ true ’ ( non-random ) differences between the loudspeakers ( as rated by this subject ). This is formally tested by the F test, which means here that the loudspeaker MS is divided by the within cell MS, resulting in an F ratio of 177.29 ( =49*64/0.28 ). ‘This value is compared with the so-called ‘ critical ’ F value for the respective degrees of freedom (namely, df= 3 for loudspeakers and 40 for within cell variation ) as given in tables of the F distribution, which appear in most textbooks on statistics. Using a .Ol significance level, the critical F value for these df : s is found to be 4.31. The obtained
L
31

IS : 10467 - 1983
F value ( 177.29 ) is far beyond the critical value and thus significant at the .Ol ( 1 percent ) level. In the right-hand column of Table 7 this is denoted by the symbol p < *Ol, which means that the probability ( p ) of getting the observed differences between the loudspeakers solely by chance is less than -01. Consequently the differences may be regarded as ‘ true ‘.
C-3.2.2 An analogue reasoning may be performed as regards the programmes and the interaction loudspeakers x programmes. As seen in Table 7 the corresponding F tests are likewise significant at the -01 level.
C-3.2.3 As used here the F test functions as an ‘ overall ’ test. For ex- ample, a Significant F ratio as regards loudspeakers tells only that there is atleast one significant difference among all possible combinations of the loudspeakers ( that is, the significant difference may be that between A and B and/or that between A and C, and/or between A and D, B and C, R and D, C and D - and/or between more complex combinations as, say, the mean of A + C versus the mean of B + D. To find exactly which difference(s) is ( are ) significant, it is necessary to perform tests for specific comparisons, see C-4. On the other hand a non-significant F ratio for the loudspeakers would mean, that there is no significant difference at all between the loudspeakers in any combination.
C-3.2.4 The interpretation of a significant .interaction loudspeakers x programmes can often be reasonably made by direct inspection of the data matrix. Statistical tests for this purpose are mentioned under C-4. It is important to study the meaning of a significant interaction, since it may give interesting information about the performance of the different loudspeakers for differeilt types of programme material.
C-3.3 ANOVA for Group Data Matrix-When an ANOVA is per- formed on a group data matrix like that in Table 5, the sources of variation will also include the subjects and various interactions involving subjects.
C-3.3.1 The results from ANOVA on the group data in Table 5 are given in the following Table 8.
TABLE 8 EXAMPLE OF SUMMARY TABLE FOR ANOVA ON GROUP DATA MATRIX
( Clmes C-3.3.1, C-4.2.1 and C-9.1.2 )
SouRca or \~.\KI,\.I.ION ss nrs
ill (2) ctf (‘$1 (‘I;,
Tm~dspeakas ( I, ) 465’73 ~ogrammes [ I’ ) 11.94
;ui:je;ts ( s ) >
1: ‘x s 105’25 47’36
17.34 1’ x s -12’86 I.. x P s s 45’98 Within cell 121’33
Total 857’81
3 155’2.5 80 44 < ‘01 Q 2’99 0.84 -.-
19 35.08 3.93 46.16 3.09 < < ‘01 ‘01 ‘; 1.93 2 * 34 = ‘01
3.57 2’70 < 0’1 k: 1’28 1’68 > ‘01
160 0’76
239
32

IS : 10467 - 1983
C-3.3.2 When computing the F values two cases must be distinguished.
C-3.3.2.1 The subjects used in the test constitute themselves the subject population, and the results from the test are strictly valid only for these subjects. The corresponding statistical model is called a fixed model. In this case all F values are computed by dividing the respective MS by the within cell MS ( for loudspeakers 155.25/0*76, for programmes 2.99/0’76, for the subjects 35.08/0.76, and so on for all interaction terms ).
C-3.3.2.2 The subjects are randomly sampled from 8. certain defined population of subjects, to which one wants to generalize the results from the listening test. The four subjects in our example were randomly sampled from a society for high fidelity fans and could thus be considered as repre- sentative for the members of this society. The corresponding statistical model is called a mixed model, and it is this model that is used in the, present case. The F values are then computed somewhat differently in the following way: The F ratio for loudspeakers is obtained by dividing the loudspeaker MS by the loudspeakers x subjects MS ( abbreviated MSr./ MSL,s ), that is 155’25/1*93 =80*44. The critical value for .Ol significance level with df=3 ( for loudspeakers ) and 9 ( f or loudspeakers x subjects ) is 6.99. The observed F value is thus significant at the .Ol level.
.
C-3.3.2.3 The F ratio for programmes is analogously obtained as MSp/MSp,s, that is, 2.99/3*57, which is < 1.00 and thus not significant ( critical value at ~01 significance level with df=4 and 12 is 5.41 ).
C-3.3.2.4 The F ratio for the interection loudspeakers x programmes MSLXP -__ is obtained by MSLXpXs that is, 3.95/1.28=3.09, significant at ,011 level
( critical value for df= 12 and 36 is 2.73 ).
C-3.3.2.5 The F ratios for subjects and for all interactions including subjects ( L x S ), P x S and L x P x S are obtained by dividing the respective MS by the within cell MS ( for instance, for subjects MSs/MS within AI,
35*08/O-76 = 46.16; for L x S interaction MSL,S/MS within ce~l, 1.93/O-76 = 2.54, and so on ). As seen under the p column in Table 7, all these F ratios except that for the triple interaction L x P x S are significant at the selected .Ol level.
C-3.3.2.6 These results may be briefly interpreted as follows:
Loudseeakers - These is at least one significant difference between the mean ratings for the different loudspeakers. Tests for specific comparisons can be made to clarify which differences are significant.
Programmes - There are no significant differences between the mean ratings at the different programmes.
33

IS : 10467 - 1983
c) &bjects -- There is at least one significant difference between the mean ratings for the different subjects. ( This means that different subjects tend to use somewhat different parts of the 10-O scale; compare, for instance, subjects T and V).
d) Interactions - There is a significant loudspeakers x programmes interaction, that is, the differences between the loudspeakers vary from programme to programme in a way that has to be studied in more detail ( possibly by means of further tests, .ree C-4 ).
C-3.3.2.7 The significant loudspeakers x subiects and prograrnmes x subjects interactions mean that the differences “between diffevrent loud- speakers and different programmes, respectively, somehow vary with subjects in a way that has to be further studied. However, there is ( fortu- nately ) no triple interaction loudspeakers x programmes .r subjects.
C-3.3.2.8 Further comments on the use of the fixed or the mixed model and the related generalization possibilities are given in the technical report. Comments are also given concerning listening tests in which each subject makes only one rating per each loudspeaker x programme combi- nation.
C-4. TESTS FOR SPECIFIC COMPARISONS
C-4.1 If the F ratio for loudspeakers is significant, there is at least one significant difference between the mean ratings for different loudspeakers ( or for more complex combinations of loudspeakers ). Tests for specific comparisons are made to clarify exactly which differences are significant. Unfortunately several different situations must be distinguished when making such tests. Four such situations are briefly described as planned independent comparisons, planned non-independent comparisons, non- planned comparisons, and specific comparisons within single programmes. Generally the discussion is limited to comparisons between two loudspeakers at a time ( A versus B, A versus C, etc ). Furthermore only the case with analysis on group data according to the mixed model ( see C-3.3) will be discussed. Other cases are treated in the technical report, which also gives more detailed information concerning the statistical background.
C-4.2 Planned Independent Comparisons - Suppose it was planned already before the listening test that it was especially important to test whether loudspeaker B was better than loudspeaker B. This is then called a planned comparison and may be performed by means of a t test. In the case of a group data matrix like that in Table 5 and using the mixed model, this test is made as follows:
34

IS : 10467 - 198-3
MA - MB 6.8-3.8
‘=1/2M&s,nsp= l/(2) (1.93)/(3) (4) (5) =12*Oo
C-4.2.1 The values for MA and MI+ are found in the bottom margin of Table 5, MSI.~~ in Table 8, n=number of replications under each condition ( each subject made three ratings for each loudspeaker x pro- gramme combination ), s=number of subjects, and 1(, =number of pro- grammes. The degrees of freedom is the same as for L x S in Table 8, that is, 9. The critical value for df=9 at *Ol significance level for a one- tailed t test is 2.82. Since the obtained t value IS higher than the critical value, the difference is said to be significant. A one-tailed test means that one tests the significance of a difference in a certain direction, in this case whether A is better than B ( which thus was found here ). A two-tailed test is used for testing the significance of a difference regardless of its direction; the critical value would then be different from here ( see a table for the t distribution ).
C-4.2.2 The L test procedure may be used for more than one planned comparison, if these comparisons are independent of each other, that is, do not have any loudspeaker in common. Besides A versus B it would be possible also to test C versus D ( but not, for instance, A versus C, since the comparisons A -- 12 and ii -C have loudspeaker il in common and thus are not independent ).
C-4.3 Planned Non-independent Comparisons - Planned compa- risons of interest to the investigator may, of course, include non-independent comparisons. In this case t tests can still be performed according to the formula in C-4.3. However, the selected significance level should now be distributed over the number of t tests that are made. For instance, if it is wanted to test two non-independent comparisons at -01 significance level, each single t test is performed at .01/2 =.005 significance level; with three non-independent comparisons each single test is performed at l 01/3 =*0033 significance level, etc. The critical value for each single t test would then be that corresponding to a *005 ( mOO33, respectively) signi- ficance level, while the significance level for the collection of the two ( three, respectively) tests is the decided .Ol. L
C-4.3.1 The 1 test procedures for planned comparisons described in C-4.3 and C-4.4 do not presuppose a significant overall F test. In fact they may be applied directly to the specific planned comparisons without a prior F test. However, since the ANOVA procedure provides much other valuable information, it is still recommended to perform the ANOVA procedure as a first step.
C-4.4 Non-planned Comparisons - If there are no specific hypotheses regarding specific differences between the loudspeakers in the test, but one simply wants to know if there are any differences between them, t-he
35

IS : 10467 - L983
data are first analyzed by ANOVA and F tests. If the F test for loudspeakers is not significant, the conclusion is that there are no differences between the loudspeakers. If the F test is significant, one may use the following procedure to clarify which differences are significant. The proposed test is known as Tukey’s HSD ( Honestly Significant Difference ). In our case with four loudspeakers there are six possible pair comparisons ( A - B, A-C, A-D, B-C, B-D, and C - D ). Any of these is declared as signi- ficant if the difference between the corresponding means exceeds the computed value for HSD. For group data in Table 5 and using the mixed model the formula for HSD is
HSD=qy/M%;:x+j-- = 5.96d1.93/(3) (4) (5) = 1.07
C-4.4.1 The value of q is found in tables of the distribution of the ‘ studentized range statistic ‘. In this case it is looked up for .Ol significance level, df=9, and for four means and is found to be 5.96, MSL,S, n, s, and p are defined as in C-4.2. Looking at the means in the bottom in the margin of Table 5, we conclude that the differences between loudspeakers A and B, A and D, B and C, and between C and D are bigger than the value of HSD ( 1.07 ) and are thus declared as significant. The tests performed by the HSD procedure are to-tailed tests.
C-4.5 Specific Comparisons Within Single Programmes - If the investigator has planned to compare the ratings for certain loudspeakers at a certain programme, he may use the procedures described in C-4.2 and C-4.3 for independent and non-independent comparisons, respectively, with two modifications. One is, of course, to enter the corresponding loud- speaker means at just that programme into the numerator of the t test formula. The other one is to remove p (= the number of programmes ) from the denominator in this formula.
C-4.5.1 If no comparisons were planned, but ANOVA and E tests have revealed a significant loudspeakers x programmes interaction, this implies that the differences between the loudspeakers somehow vary with pro- grammes. If a formal statistical test is wanted for the differences between the loudspeakers at a certain programme, the HSD procedure in C-4.4 may be used, but the value ofp should be removed from the formula.
C-5. LISTENING TESTS INCLUDING EXTRA VARIABLES
C-5.1 Besides loudspeakers and programmes an investigator may some- times want to include more variables in his listening test. For instant, some or each of the programmes may be presented at different sound levels, the positions of the loudspeakers and/or of the listeners may be varied etc. The more variables are included, the more complex the analysis will be -- and the more important it is to use an efficient procedure like ANOVA
36

IS :10467 -1983
and accompanying tests. The statistical procedures are in most cases rather straight-forward generalizations of those described earlier. Detailed des- criptions of the data treatment in such listening tests are given in the technical report.
C-5.2 If extra variables are included in a test, the total number of listening conditions may become so big that it would be too tiring or unpractical to have the subjects make ratings under all conditions. In such a case one alternative is to have some subjects take part in the test under certain listening conditions and have some other subjects participate under certain other conditions. Depending on the circumstances many different combi- nation possibilities may be considered, the subjects may be divided into still more sub-groups participating under different conditions, and so on. Many examples of such possibilities and the related statistical procedures are also given in the technical report.
C-6. RELIABILITY
C-6.1 There are several ways of checking the reliability of the ratings in a listening test, both for each subject~individually ( intra-rater reliability ) and for all subjects together ( inter-rater reliability ). Detailed procedures for this, using information given by the ANOVA, are described in the technical report. Some points are briefly discussed here.
C-6.2 Intra-individual Reliability - The intra-individual reliability may sometimes by checked by simple visual inspection of the subject’s data matrix ( see C-2.1 ). Another possibility is to look at the estimated variance of the ratings within all cel!s of the subject’s data matrix. This value is given by the MS within cell in the ANOVA on the subject’s data ( see C-3.2, Table 7 ). The smaller this value, the better the reliability.
C-6.2.1 Still another possibility is to compute a reliability index reftlering to the reliability of the mean ratings at each loudspeaker x programme combination. Applied to individual data ( as in Table 4 and 7 ) the relia- bility index Y,” ( w for ‘ within ‘, namely ‘ within individual ’ ) is computed as folIows :
“” = ’ MSwithin c&
- ( SSI, + SSP + SSL~P ) / ( dfL + dfp + dfm. 1
C-6.2.2 Using the corresponding values from Table 7 gives n,=0*97 for this subject, a very high reliability ( the upper limit is I*00 ).
C-6.2.3 A related procedure is to compute the percentage variance accounted for by the loudspeakers, the programmes and the interaction loudspeakers x programmes ( the remaining percentage variance would then be ‘ error variance ’ -- the smaller, the better ). Formulas are given in the technical report.
37

IS : 10467 - 1983
C-6.2.4 Discussions concerning the limits for ‘ lowest acceptable ’ relia- bility are also given in the technical report.
C-6.3 Inter-individual Reliability - The agreement between the differ- ent subjects in their ratings can be estimated by direct visual inspection of a data matrix like that in Table 5, and more formally by extension of the two last-mentioned procedures in C-6.2. Details and discussions are found in the technical report.
C-7. SOME CRITICAL ISSUES IN SIGNIFICANCE TESTING
C-7.1 The conclusions from significance tests are always stated in proba- bility terms, and there are always certain error risks, commonly called +he ‘ Type I error ’ and the ‘ Type II error ‘, respectively. The former is determined by the choice of the significance level ( in this text only the *Ol level has been used, other choices are possible ), the latter affects the ’ power ’ of the statistical test, that is, its possibility of detecting a ’ true ’ difference. Procedures for obtaining acceptable power of significance tests for loudspeakers are discussed in the technical report, With regard to the number of subjects it is concluded that four subjects each of them doing at least two ratings per each loudspeaker x programme combination, is an absolute minimum to achieve acceptable power. Consequently the number of subjects and ratings should preferably be higher than that.
C-7.2 There is a number of assumptions associated with the use of statistical models like those described in this text. Some of these assumptions are probably of less importance. One important assumption is that concerning ‘ independent errors ‘. To fullfill this assumption the presentation order of the loudspeaker x programme combinations should be randomized, differently for different subjects and the ratings of each subject should be independent of the other subjects’ ratings. For further discussions see the technical report.
C-8. COMPUTATIONS, COMPUTER PROGRAMMES AND TABLES
C-8.1 There are many available computer programmes for ANOVA, for instance, within ‘ Biomedical Computer Programmes ’ ( BMD ), ‘ Statistical Package for the Social Sciences ’ ( SPSS ), ‘ IBM Scientific Subroutine Package ( SSP ), ‘ International Mathematical & Statistical Libraries’ ( IMSL ), etc.
C-8.1.1 Computations may also be made by means of electronic calcu- lators. Schemes for ANOVA computations are given in many textbooks on statistics of experimental design. The books also include lislings of short computer programmes for various applications of ANOVA. Tables for the distributions ofF, t, etc, are also given in these books.
38

IS : 10467 - 1983
C-9. PRESENTATION OF RESULTS
C-9.1 If the data treatment is limited to descriptive statistics as described in C-2 the main results can be presented in a condensed group data matrix like that in Table 6. The corresponding data can also be displayed in graphical form, for instance, simply as follows:
PROGRAMME 1
L&JDtP:AKiP LOUDSPEAKER
Examplezof graphical display of group means for loudspeakers, data from Table 6. ( Only means at Programme 1 and in average over all five programmes are included here ).
C-9.1.1 However, it is also strongly recommended to present a complete group data matrix of the type shown in Table 5. This allows the reader to look at the dispersions around the means, to get an impression of the reliability of the data, and to make further computations and analyses on the data, if he wants to do so. The investigator’s own conclusions from his data analysis should, of course, be clearly stated.
C-9.1.2 If the data treatment also includes ANOVA and related proce- dures, the presentation should also include a summary table like that in Table 8. The statistical model ( fixed model, mixed model ) should be stated. The conclusions from the ANOVA and F tests should be stated and related to the data in the group matrix. Significant interactions should be interpreted, and methods and results for specific comparisons ( see C-4 ) be described data on intra-individual and inter-individual reliability . should be given.
C-9.1.3 It should gcncrally be noted that the judgement data for any single loudspeaker should never be quoted separately as an absolute value since the judgements of a loudspeaker more or less depends on which other loudspeakers are included in the test. Data for each loudspeaker should thus be given together with corresponding data for the other loud- speakers in the test as in the above data matrices.
c
39

IS : 10467 - 1983
C-10. CONCLUDING COMMENTS
C-10.1 How detailed the statistical analysis should be made apparently depends on the purposes with the listening test. Simple visual inspection of the data matrix may be enough for certain purposes, and in certain tests the results are so obvious from visual inspection that a more advanced data treatment is not worthwhile. However, for other purposes and in other situations a judicious use of ANOVA and other statistical methods may clarify a complex situation and provide important information for the future work. The statistical treatment is preferably planned before the begining of the listening test, since it may have consequences for the practical realization of the test.
40

![[300-1-2]-1954-10467 - OSAARCHIVUM · ARMED Training Morale Para—Military Organizations Intelligence Service 10467/54 Nov 26 1, - 13551 0300) 0301 0305 0310 0321 0322 A SOLDIER'S](https://img.pdfslide.us/doc/110x75/607ddc9c3b8e893fd91eee4c/300-1-2-1954-10467-osaarchivum-armed-training-morale-paraamilitary-organizations.jpg)

![53rd NCAA Wrestling Tournament 1983 3/10/1983 to … 1983.pdf · 53rd NCAA Wrestling Tournament 1983 3/10/1983 to 3/12/1983 at Oklahoma City ... Jan Michaels [US] ... Barry Davis](https://img.pdfslide.us/doc/110x75/5acd84bf7f8b9a93268db5de/53rd-ncaa-wrestling-tournament-1983-3101983-to-1983pdf53rd-ncaa-wrestling.jpg)