Embed Size (px)
Citation preview

arX
iv:0
906.
3292
v1 [
astr
o-ph
.SR
] 1
8 Ju
n 20
09Mon. Not. R. Astron. Soc. 000, 000–000 (0000) Printed 20 November 2018 (MN LATEX style file v2.2)
IRTF observations of white dwarfs with possible
near-infrared excess
J. Farihi1,2
1Department of Physics & Astronomy, University of Leicester, Leicester LE1 7RH, UK; [email protected] Astronomer at the NASA Infrared Telescope Facility
ABSTRACT
Near-infrared photometry and spectroscopy is obtained for a heterogeneous sample ofnearby white dwarfs with possible excess flux as identified primarily in the Two MicronAll Sky Survey. Among the sample of 43 stars are a number of white dwarfs that areeither metal-rich, magnetic, or binary suspects. With a few notable exceptions in four(or possibly five) distinct categories, the newly obtained JHK photometric data failto corroborate the putative excesses, with < KIRTF −K2MASS >= +0.31 mag. Whereavailable, GALEX photometric data are used to better constrain the overall spectralenergy distribution of the white dwarfs, enabling any excess near-infrared flux to standout more readily against the expected stellar photosphere.
With superior data, a near-infrared photometric excess is confirmed at three metal-rich white dwarfs and ruled out at nine others. Several new binaries are confirmedor suggested; five white dwarf - red dwarf pairs and five double degenerates. Fourapparently single magnetic white dwarfs – two DA and two DQp – display modest tostrong near-infrared excess (relative to non-magnetic models), which may be betterdescribed as two effective temperatures owing to a redistribution of energy in highlymagnetic or peculiar atmospheres.
Key words: binaries: general — circumstellar matter— infrared: stars– stars:evolution— stars: low-mass, brown dwarfs — white dwarfs
1 INTRODUCTION
The physical parameters of white dwarfs make them ex-cellent targets for binary and multiple system studies.These faint stellar embers permit a relatively unobstructedview, across multiple wavelengths, of their most commoncompanions, low mass main-sequence stars (Farihi et al.2005). Their Earth-sized radii offer the ultimate, natural,low contrast background for the near-infrared detectionof all types of intrinsically faint companions: cool whitedwarfs (Zuckerman et al. 1997), ultracool main-sequencedwarfs (Probst 1983), brown dwarfs (Becklin & Zuckerman1988), and planets (Burleigh et al. 2008). Furthermore,their typical warm to hot stellar effective temperaturesgive white dwarfs a distinct ultraviolet signature, oftendetectable against early-type main-sequence companions(Burleigh & Barstow 1998).
White dwarfs come with a hard lower limit on theirtotal age, an attribute lacking in any given non-degeneratefield star. Together with an accurate mass estimate, the mostlikely total age of a white dwarf can be inferred from its mostlikely progenitor mass and lifetime (Williams et al. 2009;Kalirai et al. 2008; Dobbie et al. 2006). In this way, whitedwarfs with substellar companions offer the most accessible,
and best empirical tests of brown dwarf and planetary cool-ing models at intermediate to older ages (Steele et al. 2009;Burleigh et al. 2009; Farihi et al. 2008a).
In recent years, the advantageous, compact nature ofwhite dwarfs has been extended via the discovery of dustwithin the Roche radius of more than one dozen stars(Farihi et al. 2009; von Hippel et al. 2007; Jura et al. 2007),the likely result of tidally-disrupted minor bodies perturbedinto close approach. This orbital phase space is essentiallycovered by the diameter of main-sequence stars, where asimilar encounter would instead produce an impact. Whilenear-infrared excess emission is measured for about halfthe white dwarfs with circumstellar dust (Farihi et al. 2009;Kilic et al. 2006), such warm dust is virtually unheard of attheir main-sequence progenitors (Zuckerman et al. 2008).
This paper presents the results of an extensive photo-metric search for near-infrared excess due to low mass stellarand substellar companions, cool white dwarf companions,and warm circumstellar dust. Excess emission is confirmedat a few to several stars in each of these categories, as wellas in another group that may be associated with magnetism,peculiar atmospheric composition, or both. The observationsand data are presented in §2 and §3, with detailed results
c© 0000 RAS
2 J. Farihi
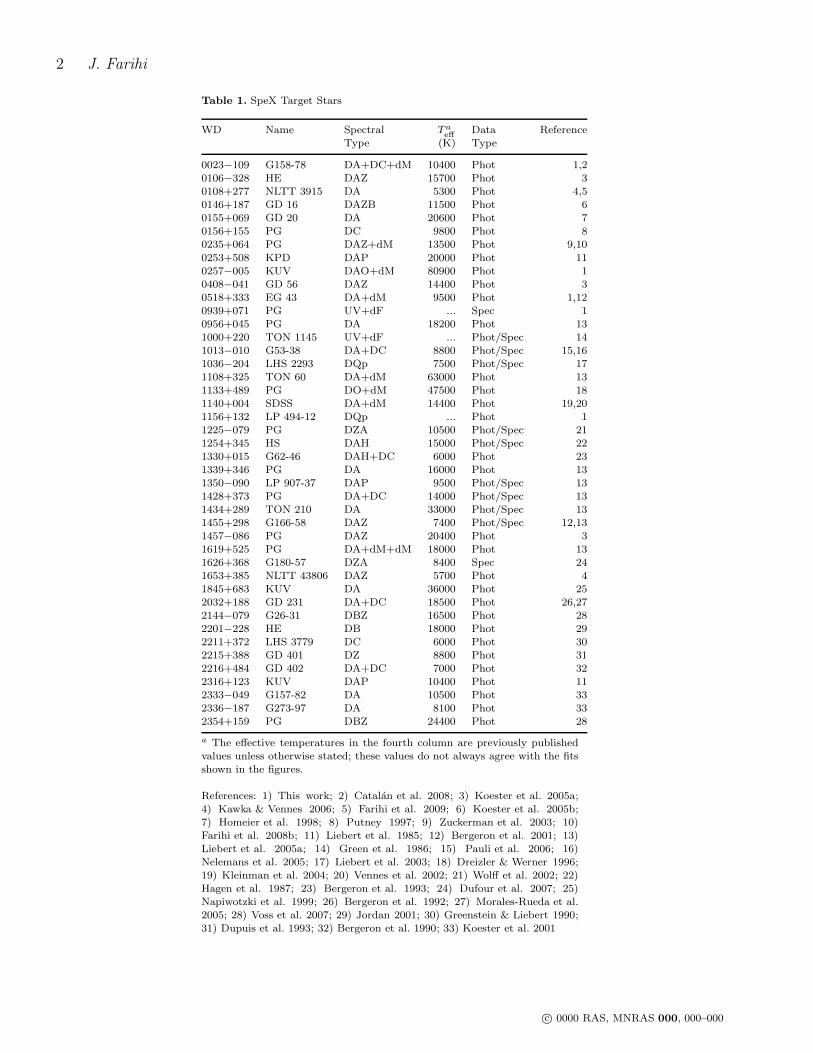
Table 1. SpeX Target Stars
WD Name Spectral Ta
effData Reference
Type (K) Type
0023−109 G158-78 DA+DC+dM 10400 Phot 1,20106−328 HE DAZ 15700 Phot 30108+277 NLTT 3915 DA 5300 Phot 4,50146+187 GD 16 DAZB 11500 Phot 60155+069 GD 20 DA 20600 Phot 70156+155 PG DC 9800 Phot 80235+064 PG DAZ+dM 13500 Phot 9,10
0253+508 KPD DAP 20000 Phot 110257−005 KUV DAO+dM 80900 Phot 10408−041 GD 56 DAZ 14400 Phot 30518+333 EG 43 DA+dM 9500 Phot 1,120939+071 PG UV+dF ... Spec 10956+045 PG DA 18200 Phot 131000+220 TON 1145 UV+dF ... Phot/Spec 141013−010 G53-38 DA+DC 8800 Phot/Spec 15,161036−204 LHS 2293 DQp 7500 Phot/Spec 171108+325 TON 60 DA+dM 63000 Phot 131133+489 PG DO+dM 47500 Phot 181140+004 SDSS DA+dM 14400 Phot 19,201156+132 LP 494-12 DQp ... Phot 11225−079 PG DZA 10500 Phot/Spec 211254+345 HS DAH 15000 Phot/Spec 221330+015 G62-46 DAH+DC 6000 Phot 231339+346 PG DA 16000 Phot 131350−090 LP 907-37 DAP 9500 Phot/Spec 131428+373 PG DA+DC 14000 Phot/Spec 131434+289 TON 210 DA 33000 Phot/Spec 131455+298 G166-58 DAZ 7400 Phot/Spec 12,131457−086 PG DAZ 20400 Phot 31619+525 PG DA+dM+dM 18000 Phot 131626+368 G180-57 DZA 8400 Spec 241653+385 NLTT 43806 DAZ 5700 Phot 41845+683 KUV DA 36000 Phot 252032+188 GD 231 DA+DC 18500 Phot 26,272144−079 G26-31 DBZ 16500 Phot 282201−228 HE DB 18000 Phot 292211+372 LHS 3779 DC 6000 Phot 302215+388 GD 401 DZ 8800 Phot 312216+484 GD 402 DA+DC 7000 Phot 322316+123 KUV DAP 10400 Phot 112333−049 G157-82 DA 10500 Phot 332336−187 G273-97 DA 8100 Phot 332354+159 PG DBZ 24400 Phot 28
a The effective temperatures in the fourth column are previously publishedvalues unless otherwise stated; these values do not always agree with the fitsshown in the figures.
References: 1) This work; 2) Catalan et al. 2008; 3) Koester et al. 2005a;4) Kawka & Vennes 2006; 5) Farihi et al. 2009; 6) Koester et al. 2005b;7) Homeier et al. 1998; 8) Putney 1997; 9) Zuckerman et al. 2003; 10)Farihi et al. 2008b; 11) Liebert et al. 1985; 12) Bergeron et al. 2001; 13)Liebert et al. 2005a; 14) Green et al. 1986; 15) Pauli et al. 2006; 16)Nelemans et al. 2005; 17) Liebert et al. 2003; 18) Dreizler & Werner 1996;19) Kleinman et al. 2004; 20) Vennes et al. 2002; 21) Wolff et al. 2002; 22)Hagen et al. 1987; 23) Bergeron et al. 1993; 24) Dufour et al. 2007; 25)Napiwotzki et al. 1999; 26) Bergeron et al. 1992; 27) Morales-Rueda et al.2005; 28) Voss et al. 2007; 29) Jordan 2001; 30) Greenstein & Liebert 1990;31) Dupuis et al. 1993; 32) Bergeron et al. 1990; 33) Koester et al. 2001
c© 0000 RAS, MNRAS 000, 000–000
IRTF observations of white dwarfs with possible near-infrared excess 3
on individual objects given in §4, and a brief discussion in§5.
2 OBSERVATIONS & DATA
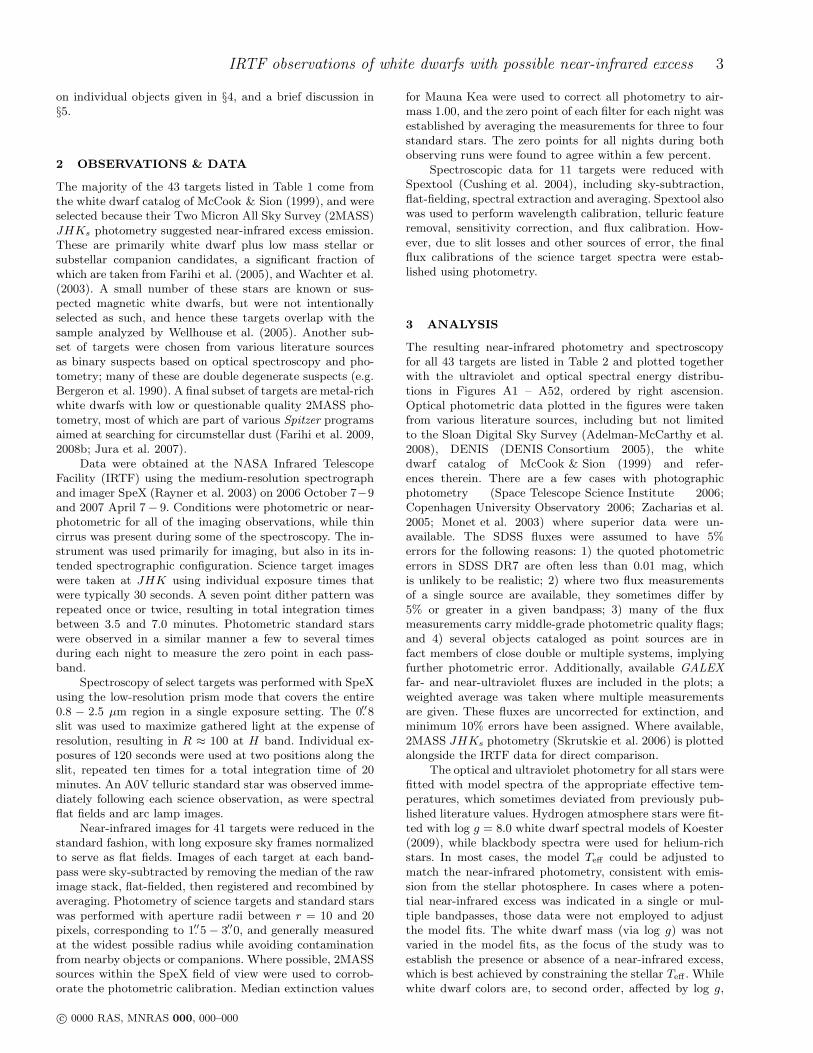
The majority of the 43 targets listed in Table 1 come fromthe white dwarf catalog of McCook & Sion (1999), and wereselected because their Two Micron All Sky Survey (2MASS)JHKs photometry suggested near-infrared excess emission.These are primarily white dwarf plus low mass stellar orsubstellar companion candidates, a significant fraction ofwhich are taken from Farihi et al. (2005), and Wachter et al.(2003). A small number of these stars are known or sus-pected magnetic white dwarfs, but were not intentionallyselected as such, and hence these targets overlap with thesample analyzed by Wellhouse et al. (2005). Another sub-set of targets were chosen from various literature sourcesas binary suspects based on optical spectroscopy and pho-tometry; many of these are double degenerate suspects (e.g.Bergeron et al. 1990). A final subset of targets are metal-richwhite dwarfs with low or questionable quality 2MASS pho-tometry, most of which are part of various Spitzer programsaimed at searching for circumstellar dust (Farihi et al. 2009,2008b; Jura et al. 2007).
Data were obtained at the NASA Infrared TelescopeFacility (IRTF) using the medium-resolution spectrographand imager SpeX (Rayner et al. 2003) on 2006 October 7−9and 2007 April 7− 9. Conditions were photometric or near-photometric for all of the imaging observations, while thincirrus was present during some of the spectroscopy. The in-strument was used primarily for imaging, but also in its in-tended spectrographic configuration. Science target imageswere taken at JHK using individual exposure times thatwere typically 30 seconds. A seven point dither pattern wasrepeated once or twice, resulting in total integration timesbetween 3.5 and 7.0 minutes. Photometric standard starswere observed in a similar manner a few to several timesduring each night to measure the zero point in each pass-band.
Spectroscopy of select targets was performed with SpeXusing the low-resolution prism mode that covers the entire0.8 − 2.5 µm region in a single exposure setting. The 0.′′8slit was used to maximize gathered light at the expense ofresolution, resulting in R ≈ 100 at H band. Individual ex-posures of 120 seconds were used at two positions along theslit, repeated ten times for a total integration time of 20minutes. An A0V telluric standard star was observed imme-diately following each science observation, as were spectralflat fields and arc lamp images.
Near-infrared images for 41 targets were reduced in thestandard fashion, with long exposure sky frames normalizedto serve as flat fields. Images of each target at each band-pass were sky-subtracted by removing the median of the rawimage stack, flat-fielded, then registered and recombined byaveraging. Photometry of science targets and standard starswas performed with aperture radii between r = 10 and 20pixels, corresponding to 1.′′5− 3.′′0, and generally measuredat the widest possible radius while avoiding contaminationfrom nearby objects or companions. Where possible, 2MASSsources within the SpeX field of view were used to corrob-orate the photometric calibration. Median extinction values
for Mauna Kea were used to correct all photometry to air-mass 1.00, and the zero point of each filter for each night wasestablished by averaging the measurements for three to fourstandard stars. The zero points for all nights during bothobserving runs were found to agree within a few percent.
Spectroscopic data for 11 targets were reduced withSpextool (Cushing et al. 2004), including sky-subtraction,flat-fielding, spectral extraction and averaging. Spextool alsowas used to perform wavelength calibration, telluric featureremoval, sensitivity correction, and flux calibration. How-ever, due to slit losses and other sources of error, the finalflux calibrations of the science target spectra were estab-lished using photometry.
3 ANALYSIS
The resulting near-infrared photometry and spectroscopyfor all 43 targets are listed in Table 2 and plotted togetherwith the ultraviolet and optical spectral energy distribu-tions in Figures A1 – A52, ordered by right ascension.Optical photometric data plotted in the figures were takenfrom various literature sources, including but not limitedto the Sloan Digital Sky Survey (Adelman-McCarthy et al.2008), DENIS (DENIS Consortium 2005), the whitedwarf catalog of McCook & Sion (1999) and refer-ences therein. There are a few cases with photographicphotometry (Space Telescope Science Institute 2006;Copenhagen University Observatory 2006; Zacharias et al.2005; Monet et al. 2003) where superior data were un-available. The SDSS fluxes were assumed to have 5%errors for the following reasons: 1) the quoted photometricerrors in SDSS DR7 are often less than 0.01 mag, whichis unlikely to be realistic; 2) where two flux measurementsof a single source are available, they sometimes differ by5% or greater in a given bandpass; 3) many of the fluxmeasurements carry middle-grade photometric quality flags;and 4) several objects cataloged as point sources are infact members of close double or multiple systems, implyingfurther photometric error. Additionally, available GALEX
far- and near-ultraviolet fluxes are included in the plots; aweighted average was taken where multiple measurementsare given. These fluxes are uncorrected for extinction, andminimum 10% errors have been assigned. Where available,2MASS JHKs photometry (Skrutskie et al. 2006) is plottedalongside the IRTF data for direct comparison.
The optical and ultraviolet photometry for all stars werefitted with model spectra of the appropriate effective tem-peratures, which sometimes deviated from previously pub-lished literature values. Hydrogen atmosphere stars were fit-ted with log g = 8.0 white dwarf spectral models of Koester(2009), while blackbody spectra were used for helium-richstars. In most cases, the model Teff could be adjusted tomatch the near-infrared photometry, consistent with emis-sion from the stellar photosphere. In cases where a poten-tial near-infrared excess was indicated in a single or mul-tiple bandpasses, those data were not employed to adjustthe model fits. The white dwarf mass (via log g) was notvaried in the model fits, as the focus of the study was toestablish the presence or absence of a near-infrared excess,which is best achieved by constraining the stellar Teff . Whilewhite dwarf colors are, to second order, affected by log g,
c© 0000 RAS, MNRAS 000, 000–000

4 J. Farihi
errors resulting from fixing log g in the model fits shouldbe of the same order or smaller than the uncertainty in Teff
itself (Bergeron et al. 1995b). Where utilized for distanceestimates to binary and multiple system components (Ta-ble 3), white dwarf model parameters (masses, radii, colors,and absolute magnitudes) were taken from Bergeron et al.(1995a,b), while empirical low mass stellar parameters wereevaluated using the colors and absolute magnitudes given inKirkpatrick & McCarthy (1994).
4 RESULTS FOR INDIVIDUAL OBJECTS
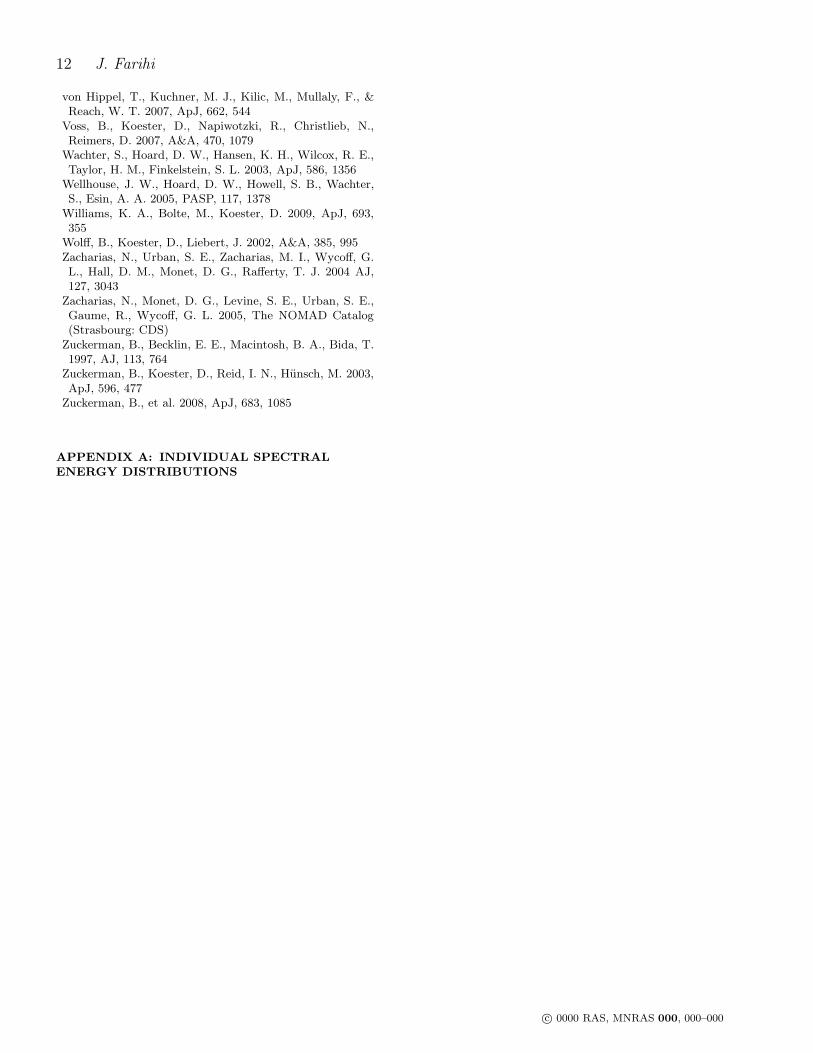
0023−109 . G158-78 is a likely triple system.Eggen & Greenstein (1965) first reported a co-moving,cool companion, G158-77, henceforth designated G158-78B.The wide pair are separated by 59.′′4 at position angle330◦ based on analysis of archival plates dating from1954.7, 1983.6 and 1998.8. Modern astrometry yields aproper motion of (72,−205) mas yr−1 for the white dwarf(Salim & Gould 2003), and (74,−206) mas yr−1 for the sec-ondary (Zacharias et al. 2004). G158-78B has V −K = 3.5(Reid 1996), indicating a spectral type of M0V at aphotometric distance of 92 pc (Kirkpatrick & McCarthy1994).
Reid (1996) reported radial velocity variations in thewhite dwarf G158-78A, with at least one value clearly in-compatible with the radial velocity of G158-78B. While thebroad-band optical colors of the primary suggest a 7000 Kstar, high quality spectroscopic data reveal an effective tem-perature near 10000 K (Catalan et al. 2008; Kleinman et al.2004). This higher temperature, necessary to explain theGALEX data for this white dwarf, implies the red opti-cal and near-infrared fluxes are greater than expected fora single star. Figure A1 shows the complete spectral en-ergy distribution is well reproduced by the addition of alow-luminosity companion with temperature around 6500K. The implied tertiary star, G158-78C, can only be anotherwhite dwarf.
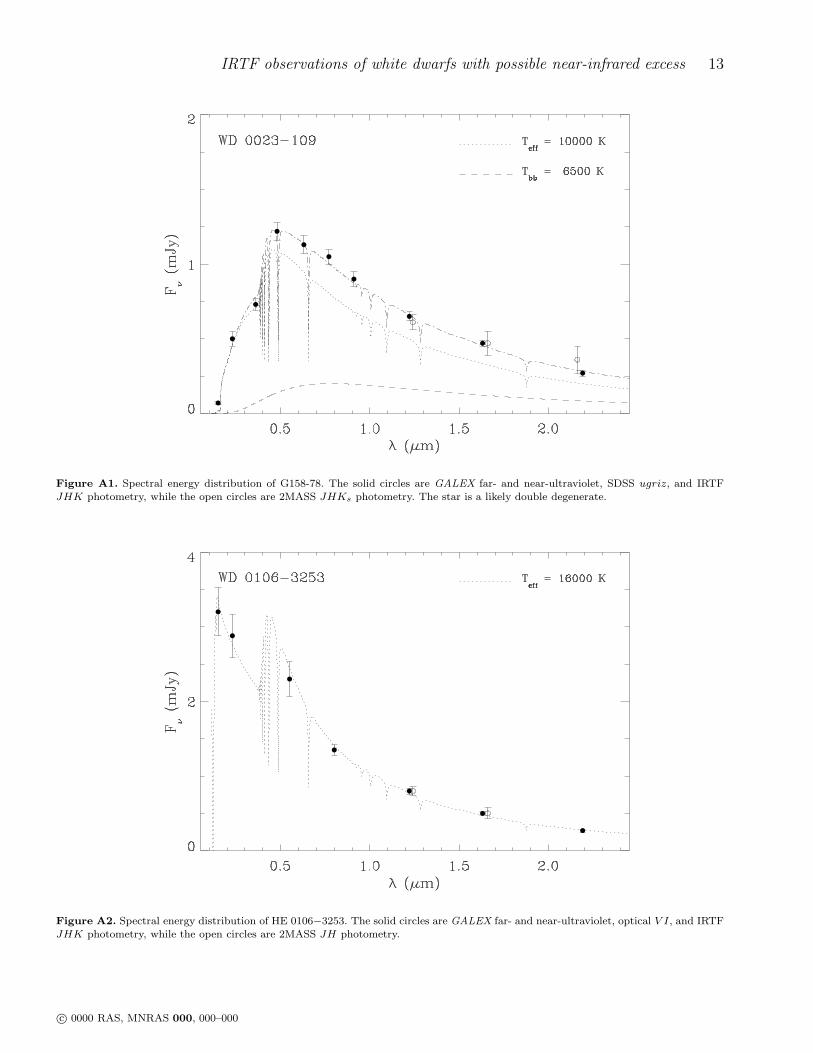
0106−328 . The coordinates of this warm DAZ star are in-accurate in SIMBAD, but correct to within several arcsec-onds in the current online version of McCook & Sion (2008).Its 2MASS position is 01h08m36.03s −32◦37′43.′′6 (J2000).There is no photometric nor spectroscopic K-band excess atthis polluted white dwarf (Kilic et al. 2008).
0108+277 . NLTT 3915 is located a few arcseconds awayfrom a background star (Farihi et al. 2009) that is perhapsresponsible (by contaminating sky apertures) for the lowerfluxes reported in 2MASS versus the IRTF values.
0146+187 . GD 16 has a mid-infrared excess from warmcircumstellar dust (Farihi et al. 2009). The IRTF photom-etry disagrees somewhat with 2MASS at J band, butis consistent with the white dwarf effective temperature(Koester et al. 2005b). The GALEX detection of GD 16 ap-pears on the edge of the array, and is unlikely to be reliable.
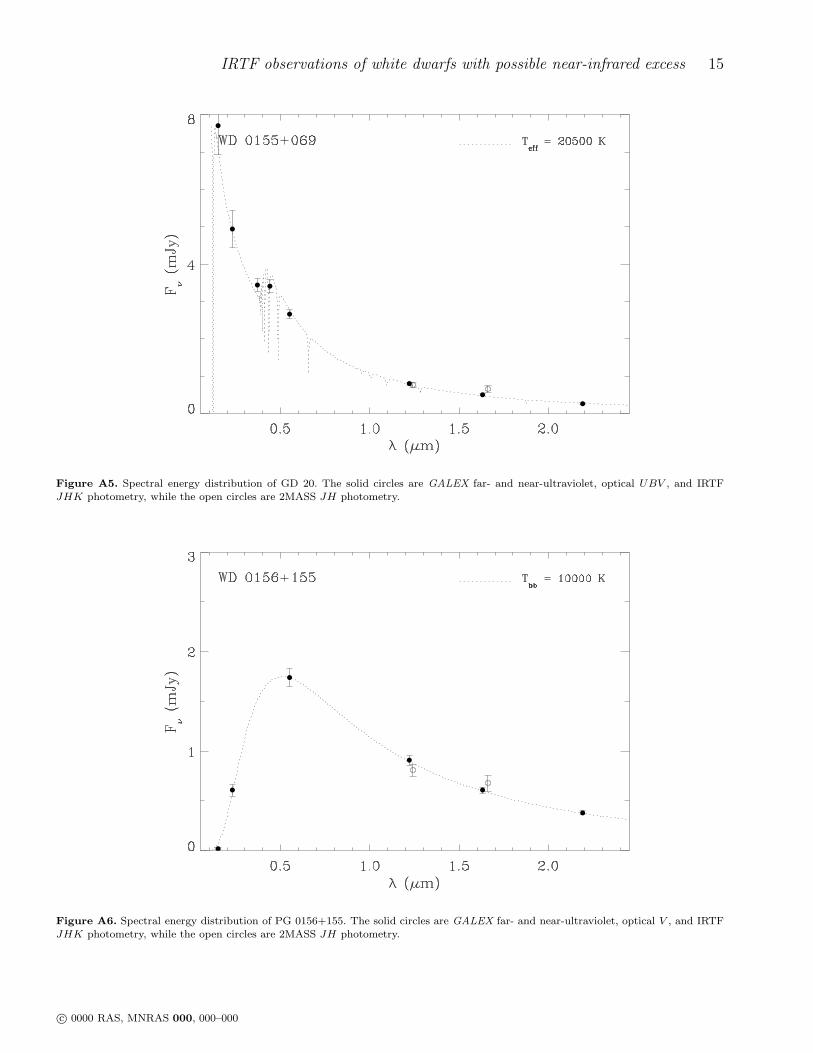
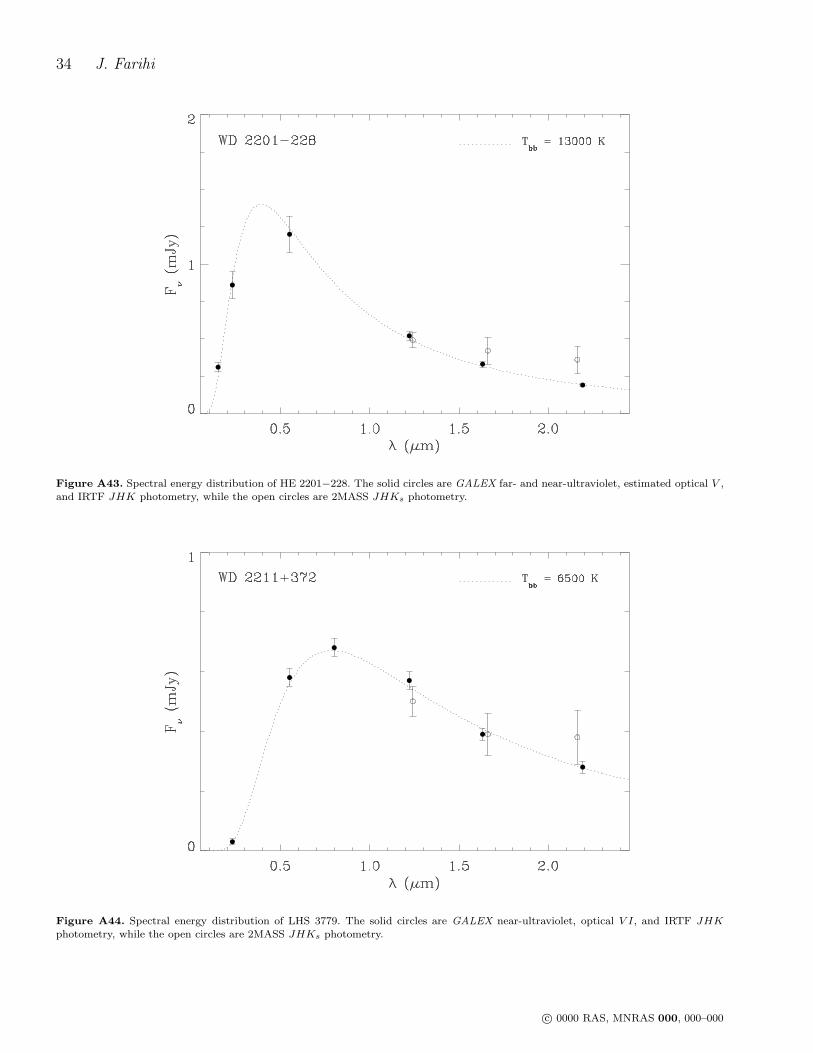
0155+069, 0156+155, 1434+289, 2144−079, &
2211+372 . The apparent 2MASS excesses at these starsare spurious.
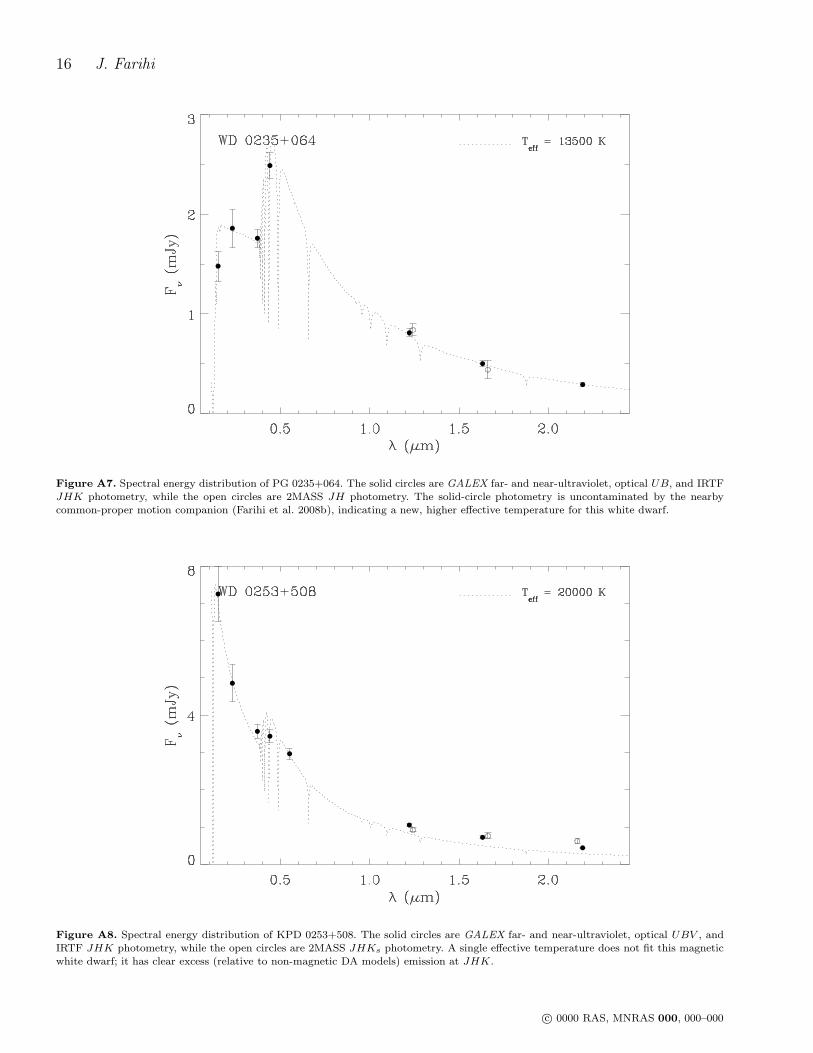
0235+064 . This PG star is located several arcseconds froma common-proper motion companion M dwarf. The compan-ion has likely caused some prior studies of the white dwarf tounderestimate its effective temperature via contamination ofoptical data (Farihi et al. 2008b). All data presented here isunaffected by the light of the dM companion, and a modelfit to the full spectral energy distribution yields Teff ≈ 13500K. Assuming log g = 8.0 places the system at 62 pc, consis-tent with a companion spectral type of M3.5 (V −K = 4.9)at that distance.
0253+508 . The ultraviolet and optical data for this starare well-modeled with a Teff = 20000 K hydrogen at-mosphere, non-magnetic white dwarf (Liebert et al. 1985;Downes & Margon 1983), as can be seen in Figure A8. How-ever, the V − K = −0.16 color is suggestive of a muchcooler star, near 10000 K. Whether the JHK excess (rel-ative to non-magnetic models) emission is photospheric innature remains to be seen, but the fluxes are not consistentwith a low mass star or brown dwarf (Farihi et al. 2005),nor circumstellar dust (Kilic et al. 2006). It is possible thatthe highly magnetic stellar atmosphere is causing an emer-gent two-temperature appearance and further investigationis warranted.
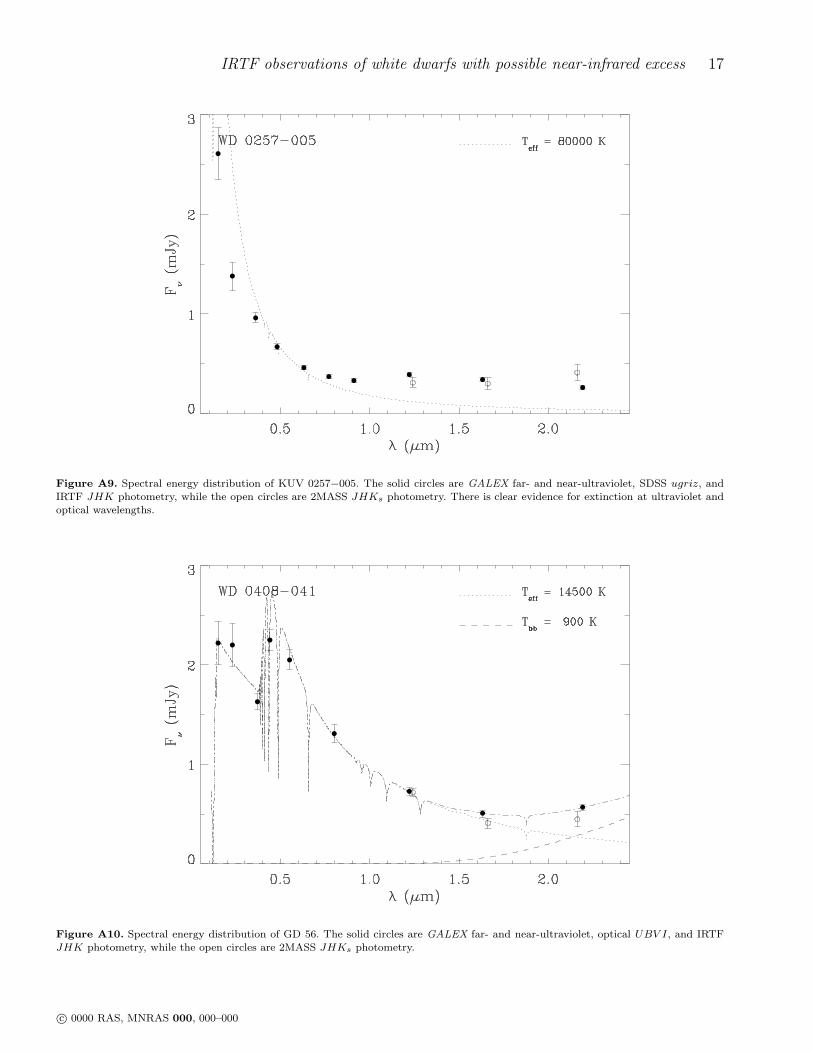
0257−005 . This system is resolved into two componentsseparated by 1.′′0 in HST / ACS observations (Farihi et al.2009, in preparation). The binary is also partially resolvedin the IRTF observations, but only photometry for the com-posite double was possible. Near-infrared data alone doesnot strongly constrain the companion parameters, but theACS data yield I −K = 2.6 and an estimated spectral typeof M4.5 at 490 pc.
Eisenstein et al. (2006) list the primary star as typesdO with Teff = 69000 K and log g = 5.9, yet only whitedwarfs should attain such high temperatures. These parame-ters may be due to a problematic automated fit to the SDSSspectrum and photometry; a mild red continuum and a fewlate-type stellar features are present in the data beyond 6000A. Visual examination of the spectrum indicates a likelyDAO white dwarf, a hypothesis corroborated by the implieddistance to the M dwarf companion; at 490 pc, the primarywould be intrinsically too faint for a horizontal branch star(Lisker et al. 2005).
Following the method of Rebassa-Mansergas et al.(2007), a fit to the SDSS spectrum yields Teff = 80900±7600K and log g = 7.13±0.34, verifying KUV 0257−005 is a DAOwhite dwarf. Allowing for some mild extinction in the opti-cal yields a photometric distance of 1040±330 pc, which canonly be matched by the cool companion if it is an equal lu-minosity double at 700 pc. Further observations are requiredto test this scenario.
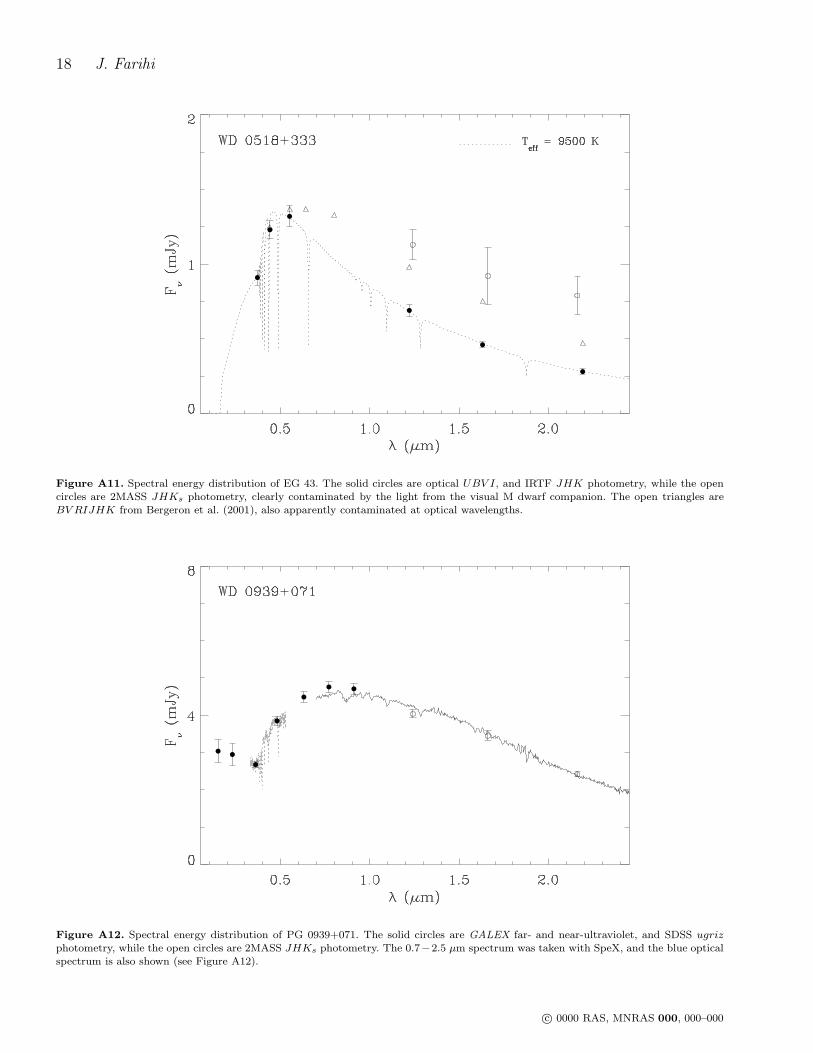
0408−041 . GD 56 has a rare, strong infrared excess dueto circumstellar dust that manifests beginning at H band(Kilic et al. 2006). The IRTF photometry corroborates thisfinding, and improves significantly upon 2MASS data.
0518+333 . EG 43 (G86-B1B, NLTT 14920) is part of acommon-proper motion binary with an M dwarf (G86-B1A,NLTT 14919; Salim & Gould 2003) 7.′′4 distant. The white
c© 0000 RAS, MNRAS 000, 000–000
IRTF observations of white dwarfs with possible near-infrared excess 5
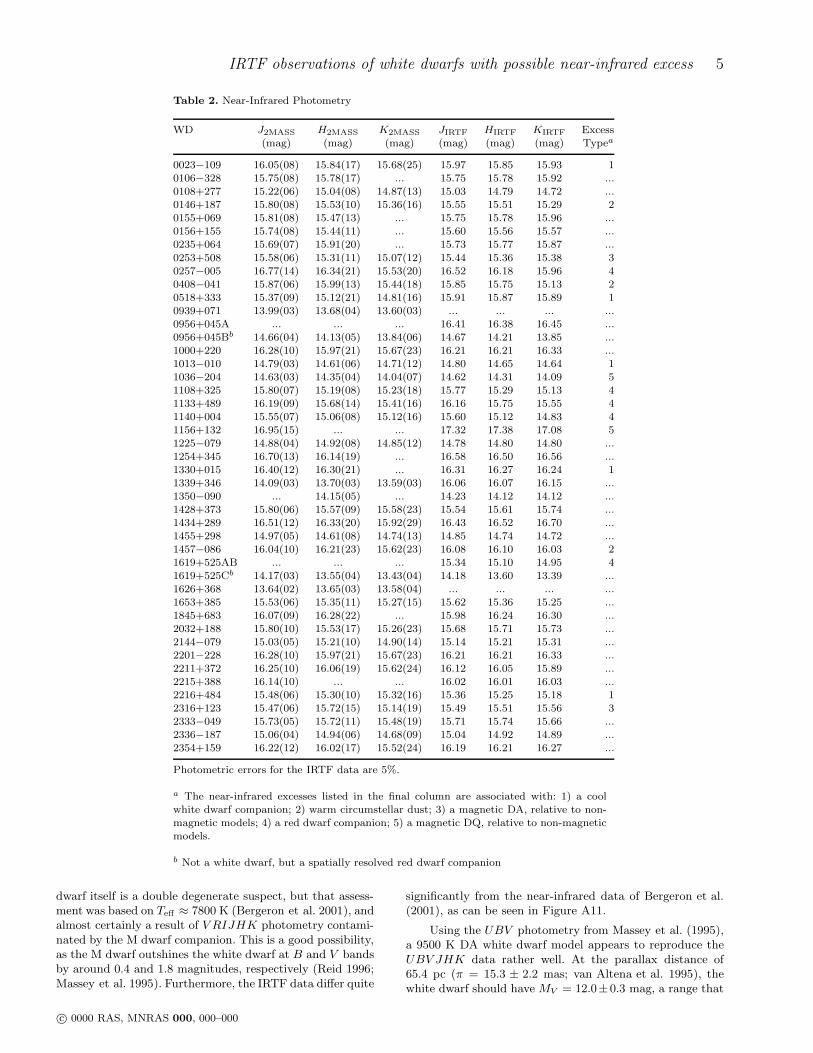
Table 2. Near-Infrared Photometry
WD J2MASS H2MASS K2MASS JIRTF HIRTF KIRTF Excess(mag) (mag) (mag) (mag) (mag) (mag) Typea
0023−109 16.05(08) 15.84(17) 15.68(25) 15.97 15.85 15.93 10106−328 15.75(08) 15.78(17) ... 15.75 15.78 15.92 ...0108+277 15.22(06) 15.04(08) 14.87(13) 15.03 14.79 14.72 ...0146+187 15.80(08) 15.53(10) 15.36(16) 15.55 15.51 15.29 20155+069 15.81(08) 15.47(13) ... 15.75 15.78 15.96 ...0156+155 15.74(08) 15.44(11) ... 15.60 15.56 15.57 ...0235+064 15.69(07) 15.91(20) ... 15.73 15.77 15.87 ...
0253+508 15.58(06) 15.31(11) 15.07(12) 15.44 15.36 15.38 30257−005 16.77(14) 16.34(21) 15.53(20) 16.52 16.18 15.96 40408−041 15.87(06) 15.99(13) 15.44(18) 15.85 15.75 15.13 20518+333 15.37(09) 15.12(21) 14.81(16) 15.91 15.87 15.89 10939+071 13.99(03) 13.68(04) 13.60(03) ... ... ... ...0956+045A ... ... ... 16.41 16.38 16.45 ...0956+045Bb 14.66(04) 14.13(05) 13.84(06) 14.67 14.21 13.85 ...1000+220 16.28(10) 15.97(21) 15.67(23) 16.21 16.21 16.33 ...1013−010 14.79(03) 14.61(06) 14.71(12) 14.80 14.65 14.64 11036−204 14.63(03) 14.35(04) 14.04(07) 14.62 14.31 14.09 51108+325 15.80(07) 15.19(08) 15.23(18) 15.77 15.29 15.13 41133+489 16.19(09) 15.68(14) 15.41(16) 16.16 15.75 15.55 41140+004 15.55(07) 15.06(08) 15.12(16) 15.60 15.12 14.83 41156+132 16.95(15) ... ... 17.32 17.38 17.08 51225−079 14.88(04) 14.92(08) 14.85(12) 14.78 14.80 14.80 ...1254+345 16.70(13) 16.14(19) ... 16.58 16.50 16.56 ...1330+015 16.40(12) 16.30(21) ... 16.31 16.27 16.24 11339+346 14.09(03) 13.70(03) 13.59(03) 16.06 16.07 16.15 ...1350−090 ... 14.15(05) ... 14.23 14.12 14.12 ...1428+373 15.80(06) 15.57(09) 15.58(23) 15.54 15.61 15.74 ...1434+289 16.51(12) 16.33(20) 15.92(29) 16.43 16.52 16.70 ...1455+298 14.97(05) 14.61(08) 14.74(13) 14.85 14.74 14.72 ...1457−086 16.04(10) 16.21(23) 15.62(23) 16.08 16.10 16.03 21619+525AB ... ... ... 15.34 15.10 14.95 41619+525Cb 14.17(03) 13.55(04) 13.43(04) 14.18 13.60 13.39 ...1626+368 13.64(02) 13.65(03) 13.58(04) ... ... ... ...1653+385 15.53(06) 15.35(11) 15.27(15) 15.62 15.36 15.25 ...1845+683 16.07(09) 16.28(22) ... 15.98 16.24 16.30 ...2032+188 15.80(10) 15.53(17) 15.26(23) 15.68 15.71 15.73 ...2144−079 15.03(05) 15.21(10) 14.90(14) 15.14 15.21 15.31 ...2201−228 16.28(10) 15.97(21) 15.67(23) 16.21 16.21 16.33 ...2211+372 16.25(10) 16.06(19) 15.62(24) 16.12 16.05 15.89 ...2215+388 16.14(10) ... ... 16.02 16.01 16.03 ...2216+484 15.48(06) 15.30(10) 15.32(16) 15.36 15.25 15.18 12316+123 15.47(06) 15.72(15) 15.14(19) 15.49 15.51 15.56 32333−049 15.73(05) 15.72(11) 15.48(19) 15.71 15.74 15.66 ...2336−187 15.06(04) 14.94(06) 14.68(09) 15.04 14.92 14.89 ...2354+159 16.22(12) 16.02(17) 15.52(24) 16.19 16.21 16.27 ...
Photometric errors for the IRTF data are 5%.
a The near-infrared excesses listed in the final column are associated with: 1) a coolwhite dwarf companion; 2) warm circumstellar dust; 3) a magnetic DA, relative to non-magnetic models; 4) a red dwarf companion; 5) a magnetic DQ, relative to non-magneticmodels.
b Not a white dwarf, but a spatially resolved red dwarf companion
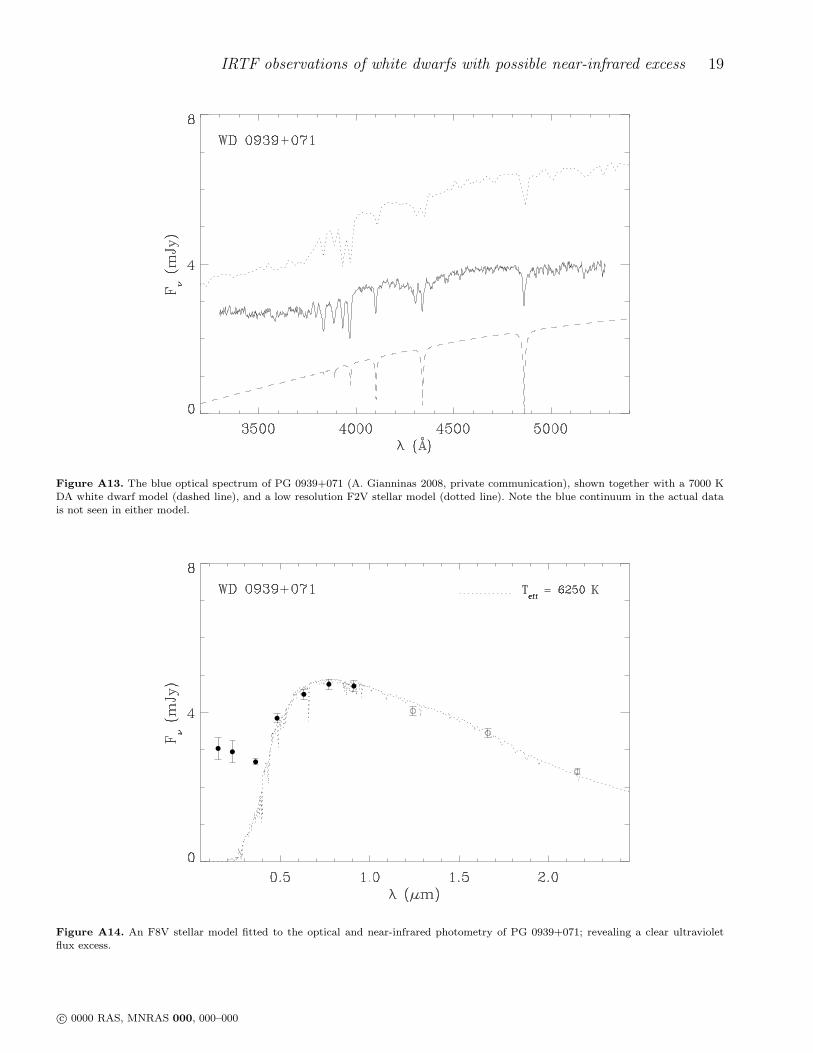
dwarf itself is a double degenerate suspect, but that assess-ment was based on Teff ≈ 7800 K (Bergeron et al. 2001), andalmost certainly a result of V RIJHK photometry contami-nated by the M dwarf companion. This is a good possibility,as the M dwarf outshines the white dwarf at B and V bandsby around 0.4 and 1.8 magnitudes, respectively (Reid 1996;Massey et al. 1995). Furthermore, the IRTF data differ quite
significantly from the near-infrared data of Bergeron et al.(2001), as can be seen in Figure A11.
Using the UBV photometry from Massey et al. (1995),a 9500 K DA white dwarf model appears to reproduce theUBV JHK data rather well. At the parallax distance of65.4 pc (π = 15.3 ± 2.2 mas; van Altena et al. 1995), thewhite dwarf should have MV = 12.0±0.3 mag, a range that
c© 0000 RAS, MNRAS 000, 000–000
6 J. Farihi
includes log g = 8.0 at this higher effective temperature.Therefore, the white dwarf should no longer be considereda double degenerate suspect.
The M dwarf companion has V − K = 4.5, consistentwith a spectral type of M3. However, the implied MK = 5.7mag at 65.4 pc is brighter than expected for this spectraltype. Indeed, this star is a visual binary separated by 0.′′2with HST / ACS, making the system a triple (Farihi et al.2009, in preparation). Assuming equal luminosity gives eachstar in G86-B1AC MK = 6.5 mag, consistent with M3 spec-tral types implied by their color.
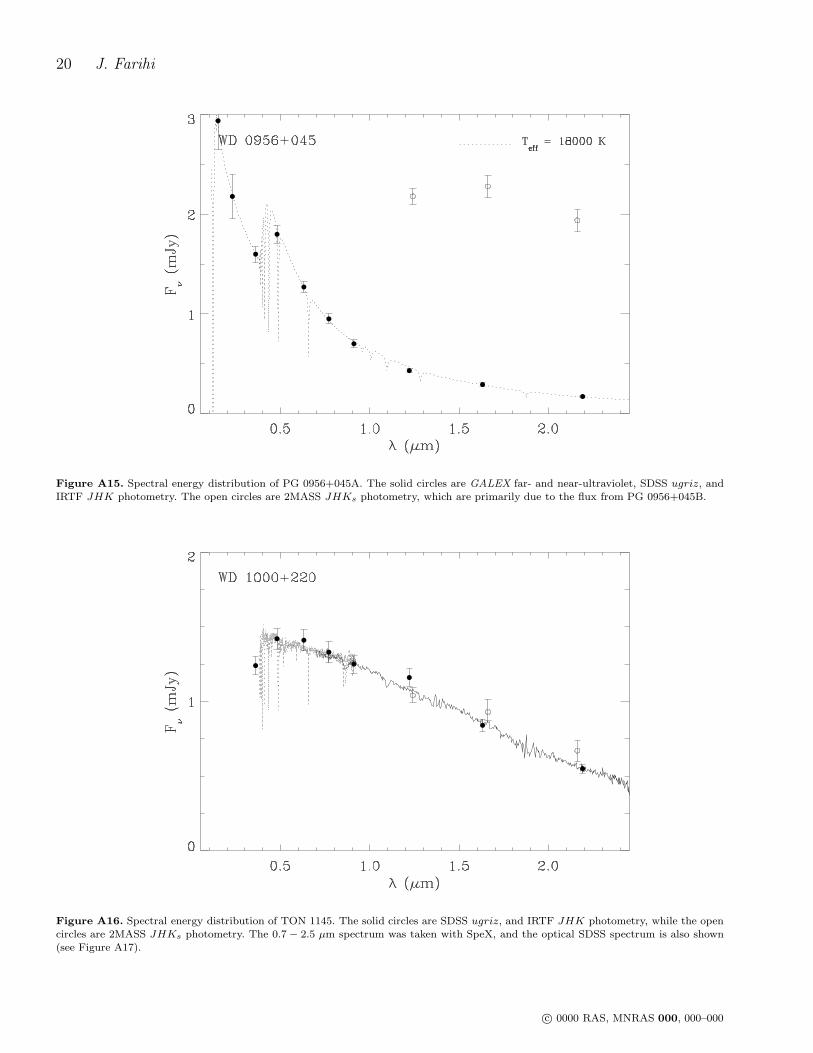
0939+071 . This star has persisted among white dwarf listsover the years lacking any high quality observations in theliterature. Its status as a degenerate star rests firstly withGreenstein (1984), who lists it as a weak-lined DA of temper-ature near 7200 K, and secondly upon Green et al. (1986),who list the star as DC in the same temperature class, witha blue photoelectric color index of U − B = −0.55. How-ever, the V = 14.9 mag star has a very small proper mo-tion on the order of 10 mas yr−1 (Adelman-McCarthy et al.2008; Farihi et al. 2005), and its optical spectrum revealscalcium H and K lines (A. Gianninas 2008, private com-munication; see Figure A12). Together, these data indicatea main-sequence F-type star, with the former more likelybased on the strength of the Balmer lines compared to Ku-rucz models1
Interestingly, the star has a clear blue-ultraviolet excessat GALEX and optical wavelengths that cannot be repro-duced by a single temperature component, and is most read-ily explained by a hot subdwarf or very hot white dwarf com-panion. However, for this to be the case, the far-ultravioletflux would have to suffer from a significant degree of ex-tinction. Figures A12 – A14 display various data for thisstar, which strongly support both an ultraviolet and blueoptical excess, relative to a main-sequence F or G-type star.High-resolution observations of this object taken by the SPYsurvey with VLT / UVES also reveal a clear blue-ultravioletexcess (R. Napiwotzki 2009, private communication).
0956+045 . This PG white dwarf is part of a visual dou-ble separated by 2.′′0 (Farihi et al. 2005), and the M dwarfcompanion dominates the binary light redward of 0.8 µm.Spatially-resolved JHK photometry from the IRTFmatchesthe predictions of an 18000 K DA model (Liebert et al.2005a). SDSS griz photometry of PG 0956+045B providesnew color information, and when combined with its near-infrared photometry, indicate an updated spectral type ofM5 (Bochanski et al. 2007).
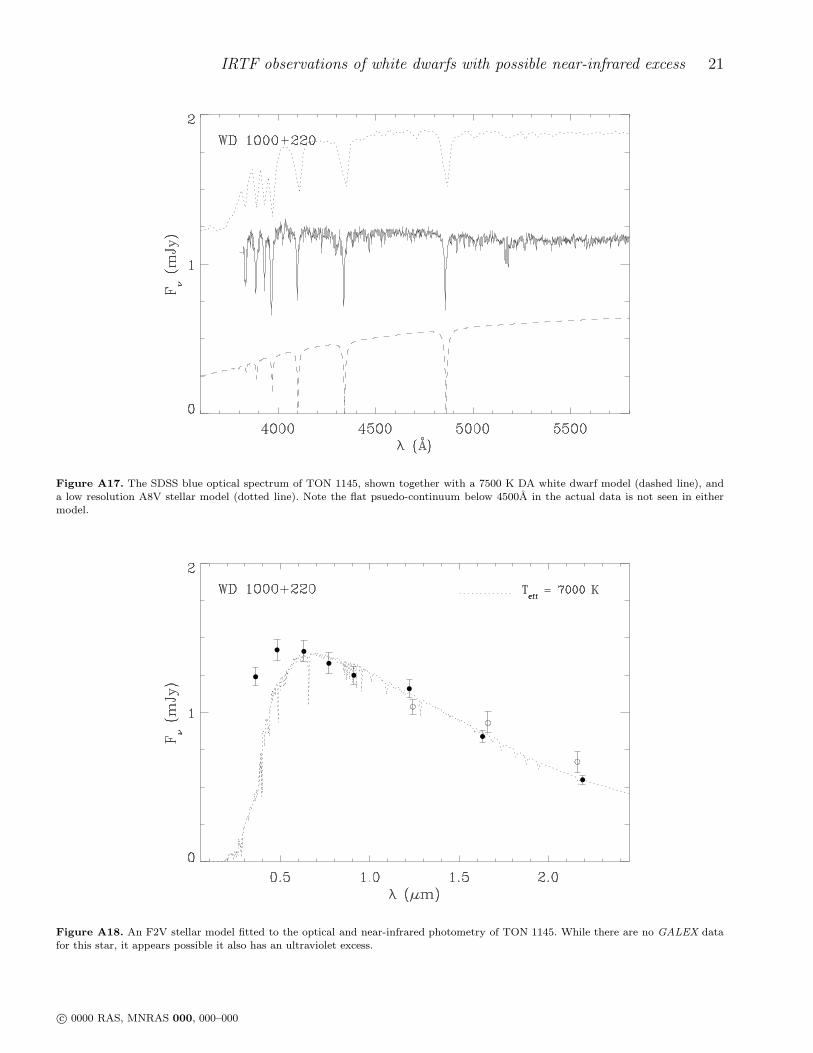
1000+220 . TON 1145 appears similar to PG 0939+071 ina few ways; its data are shown in Figures A16–A18. First, itsblue optical spectrum appears to be F-type with similar linestrengths. Second, while a main-sequence stellar model fitsnearly all the photometric data, there may be an ultravioletexcess, but unfortunately, there are no GALEX data for thisstar. Third, it has a proper motion of order 10 mas yr−1,meaning it is quite distant. A late A-type or early F-typestar fits most of the photometric data excepting the SDSS
1 http://www.stsci.edu/hst/observatory/cdbs/k93models.html
ug fluxes, perhaps indicating a hot subdwarf or very hotwhite dwarf companion.
1013−010 . G53-38 is a confirmed double degenerate,a single-lined spectroscopic binary (Nelemans et al. 2005).From Figure A19, there appears to be photometric evi-dence of the hidden white dwarf companion. Pauli et al.(2006) give 8800 K for the primary based on Balmer linespectroscopy, that underpredicts the red optical and near-infrared fluxes substantially. A combination of a 9000 K DAwhite dwarf and a T eff ∼ 6000 K DC white dwarf is able toreproduce the entire spectral energy distribution quite well.
1036−204 . LHS 2293 is a DQ peculiar white dwarf thatdisplays two clearly disparate effective temperatures, evenwhile excluding the heavily absorbed 4000 − 6000 A re-gion (Jordan & Friedrich 2002; Schmidt et al. 1999). TheGALEX near-ultraviolet and optical URI photometry canbe fitted with a 7500 K star, consistent with the analysis ofLiebert et al. (1978), while the IJHK photometry can bereproduced by a 4300 K blackbody. This could be a spec-tacular example of energy redistribution in a highly unusualatmosphere; clearly more data are warranted for this highlymagnetic white dwarf.
1108+325 . This is a visual binary separated by 0.′′2 asimaged with HST / ACS (Farihi et al. 2009, in preparation).The improved JHK data here indicate I − K = 2.1 and adM3 companion, consistent with the estimated white dwarfdistance of 560 pc (Liebert et al. 2005a).
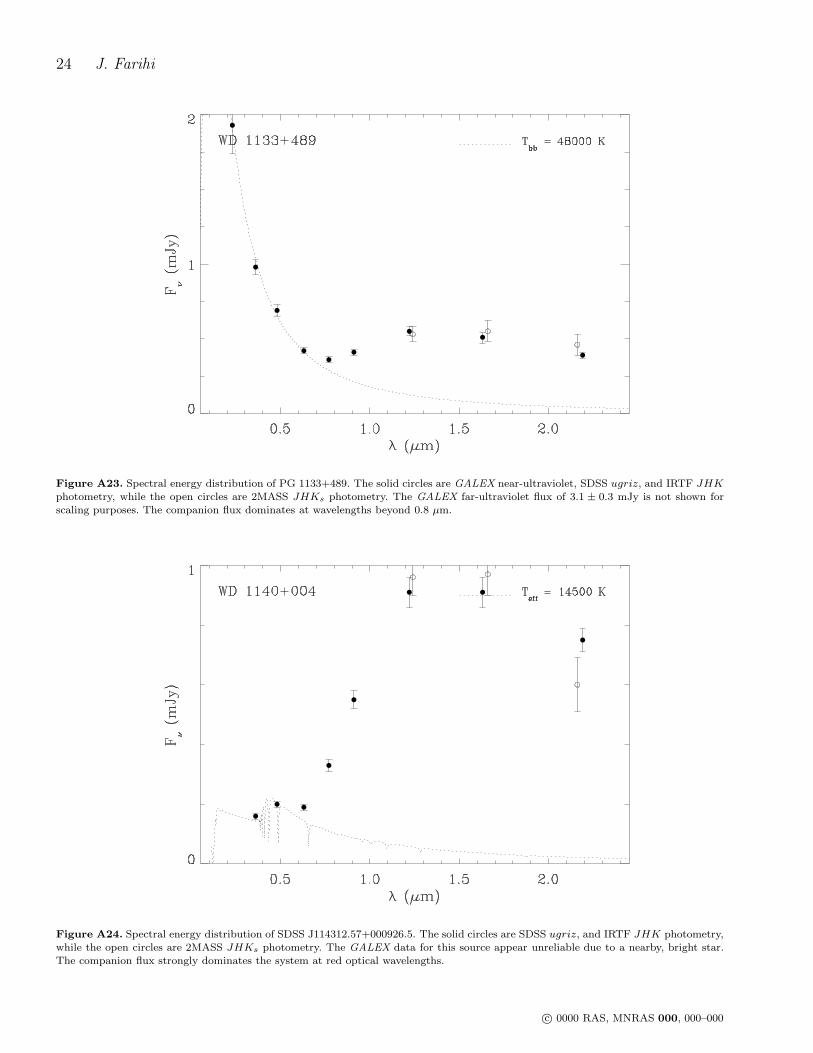
1133+489 . Farihi et al. (2006) resolve this binary at 0.′′1with HST / ACS. The improved JHK data here indicateI − K = 2.7 for PG 1133+489B, and a dM5 companion,consistent with a 370 pc distance to a log g = 8.0 whitedwarf with Teff = 47500 K.
1140+004 . The optical spectrum of this star reveals twostrong components, a white dwarf in the blue and an Mdwarf in the red. The companion spectral type has been es-timated previously to be M4 (Raymond et al. 2003) and M6(Silvestri et al. 2006). The IRTF near-infrared data permita broad-band color analysis of the companion that yieldsI −K = 2.6 and an estimated spectral type of M5. This isconsistent with the 240 pc distance to a Teff = 14500 K, logg = 8.0 white dwarf (Kleinman et al. 2004).
1156+132 . LP 494-12 is a DQ peculiar star with a rela-tively warm effective temperature. Ongoing coverage of thisregion by the UKIRT Infrared Deep Sky Survey (UKIDSS)confirms the IRTF K-band excess, reporting (H,K) =(17.32, 17.08) mag for this white dwarf. The nature of theexcess emission may be related to its unusual atmosphere ora strong magnetic field (or both), and could be a redistri-bution of emergent energy as potentially seen in LHS 2293.If correct, the excess at LP 494-12 is still unusual as it onlymanifests beyond the H band.
1225−079 . A strong 8600 A calcium absorption featureis clearly detected in this DZA white dwarf. The individuallines of the triplet are unresolved at the resolution of theSpeX prism.
c© 0000 RAS, MNRAS 000, 000–000
IRTF observations of white dwarfs with possible near-infrared excess 7
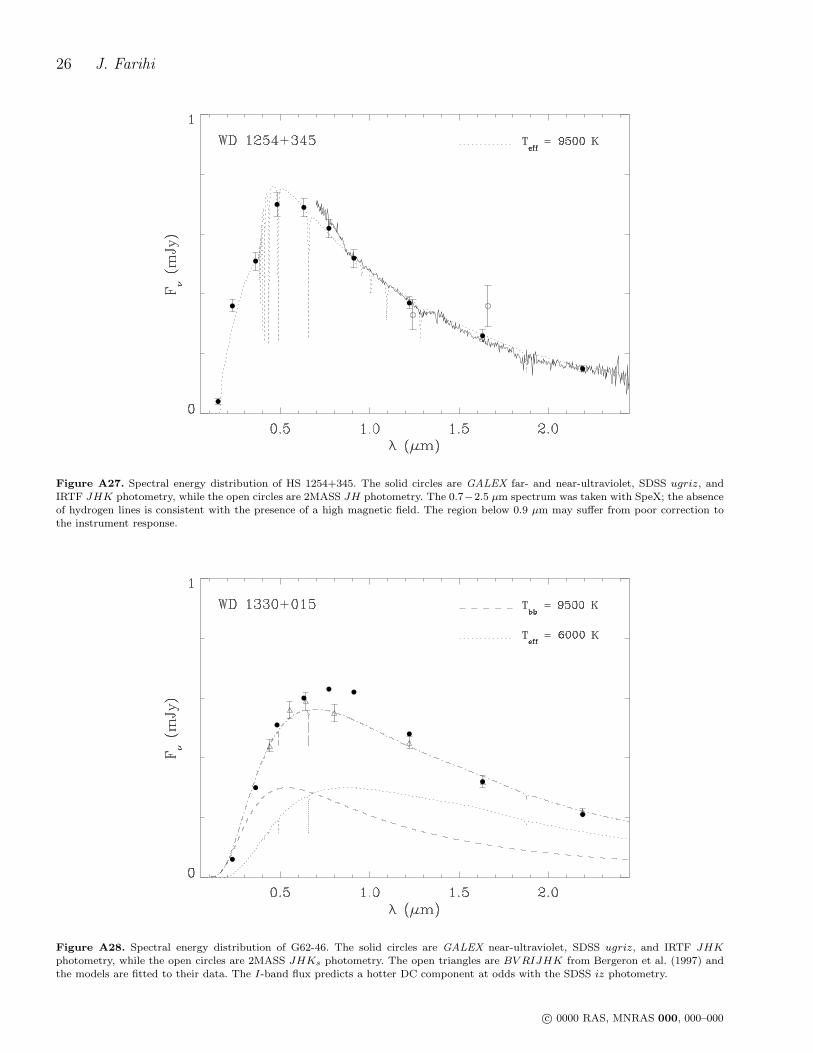
1254+345 . Using non-magnetic DA models, an effectivetemperature of 9500 K is estimated for this highly magneticwhite dwarf (see Figure A27). This is considerably lowerthan the previous estimate of 15000 K (Hagen et al. 1987),and is consistent with the slope of its optical, SDSS spec-trum.
1330+015 . G62-46 is a likely DAH+DC binary basedon spectra that reveal diluted, Zeeman-split lines of Hα
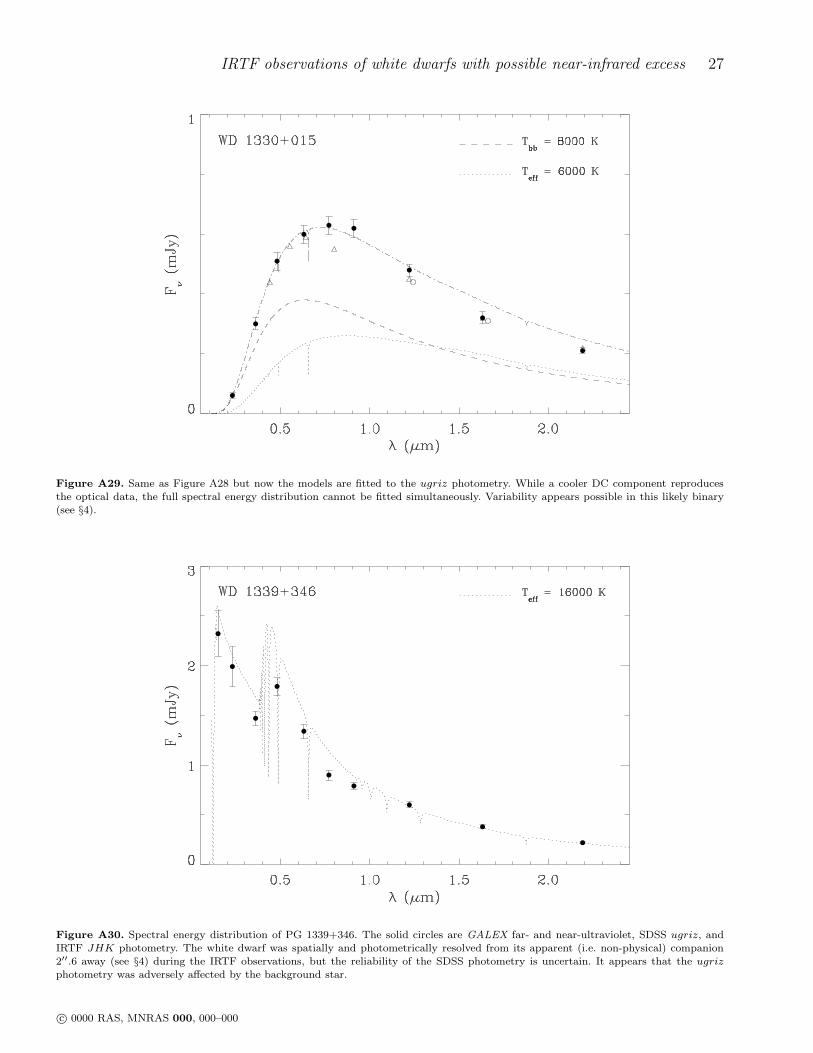
(Bergeron et al. 1993). Figure A28 essentially reproducesthe double degenerate model fit of Bergeron et al. (1993)with 9500 K DC, and 6000 K DA components. However, theI-band flux differs significantly from the SDSS iz photome-try, that appear to be corroborated by DENIS I-band data.Using the SDSS and IRTF data, the full spectral energy dis-tribution cannot be modeled within the photometric errorsas either a single or double source; the resulting compositeeither overpredicts the HK, or underpredicts the iz fluxes.The SDSS catalog lists a ’good’ quality flag for this pho-tometry, and hence variability may be present. A less likelypossibility is near-infrared flux suppression in the cooler DAcomponent. The GALEX near-ultraviolet and u-band fluxesmay favor a DC component closer to 8000 K.
1339+346 . Part of an apparent stellar triple at galacticlatitude |b| = 77◦, the white dwarf is not physically associ-ated with the remaining pair of stars, currently located 2.′′6and 21.′′2 distant. This pair of cool stars appear to be co-moving at (27,−37) mas yr−1 (Zacharias et al. 2005), whiletheir SDSS and IRTF colors suggest they are main-sequenceK stars at roughly 720 pc.
Utlizing an epoch 1950.4 POSS plate scan comparedwith the epoch 2007.4 IRTF J-band image, the white dwarfhas clearly moved relative to the K stars by a few arcsec-onds. From the motion relative to the nearest K star, a totalproper motion of (80,−72) mas yr−1 is calculated for thewhite dwarf.
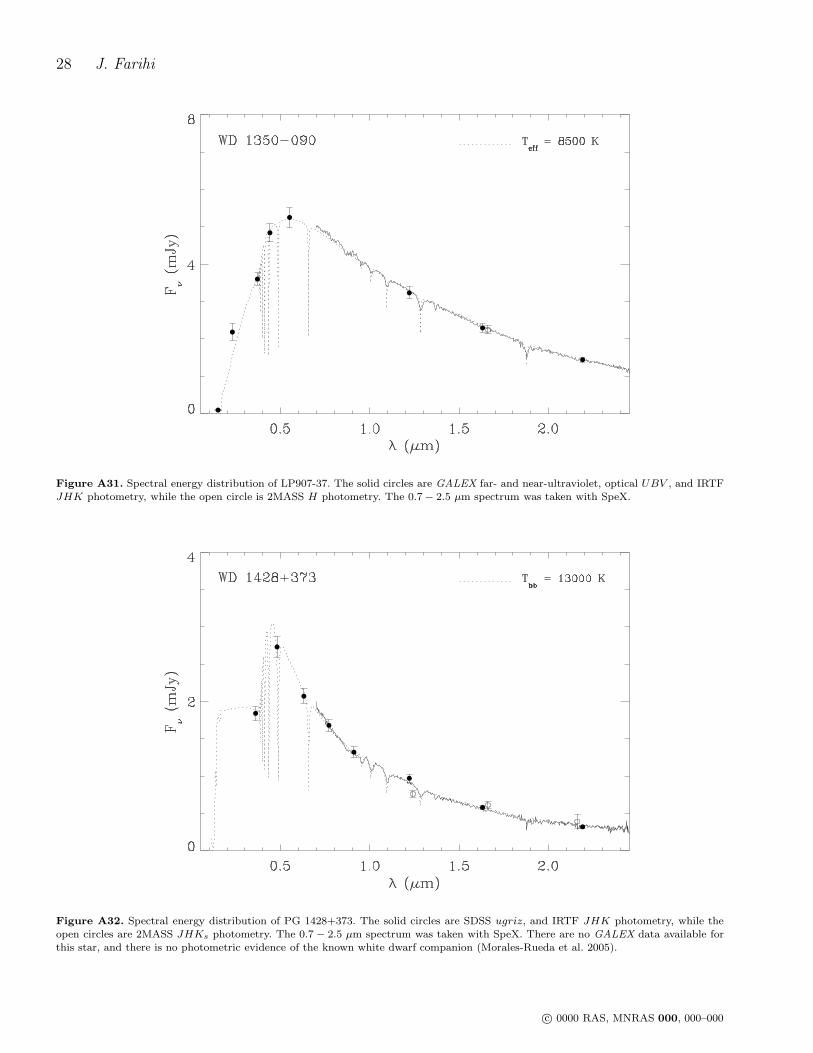
1350−090 . The DA model fitted to the broad energydistribution in Figure A31 yields an effective temperaturearound 1000 K lower than the spectroscopically derivedvalue of Liebert et al. (2005a). LP 907-37 is a DAP whitedwarf with a kG magnetic field (Schmidt & Smith 1994);the Zeeman split hydrogen lines (Koester et al. 2005a) can-not be seen in the low resolution SpeX prism data. The2MASS catalog lacks JKs photometry for this m < 14.5mag white dwarf.
1428+373 . The DA model fitted to the broad energydistribution in Figure A32 yields an effective temperaturearound 1000 K lower than the spectroscopically derivedvalue of Liebert et al. (2005a).
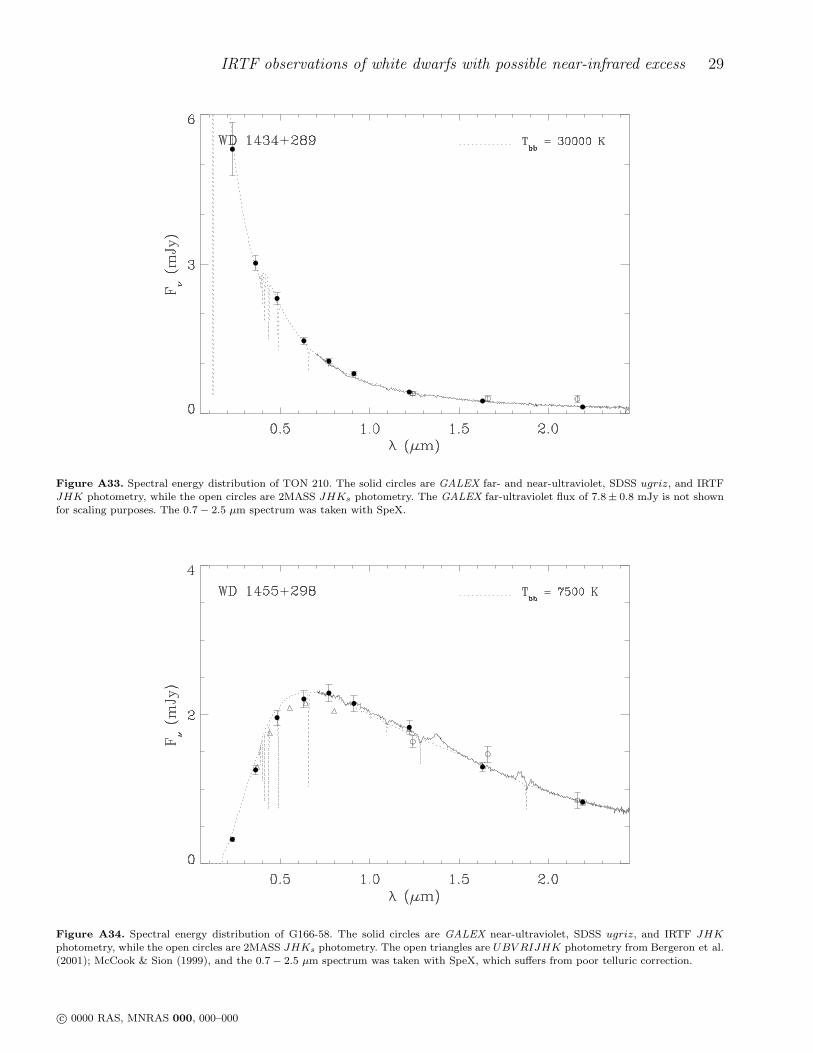
1455+298 . This is another case where the SDSS iz
photometry deviates significantly from the I-band flux ofBergeron et al. (2001). The SpeX prism data appear to agreewell with the SDSS fluxes. The apparent 2MASS H-bandphotometric excess for this white dwarf is spurious.
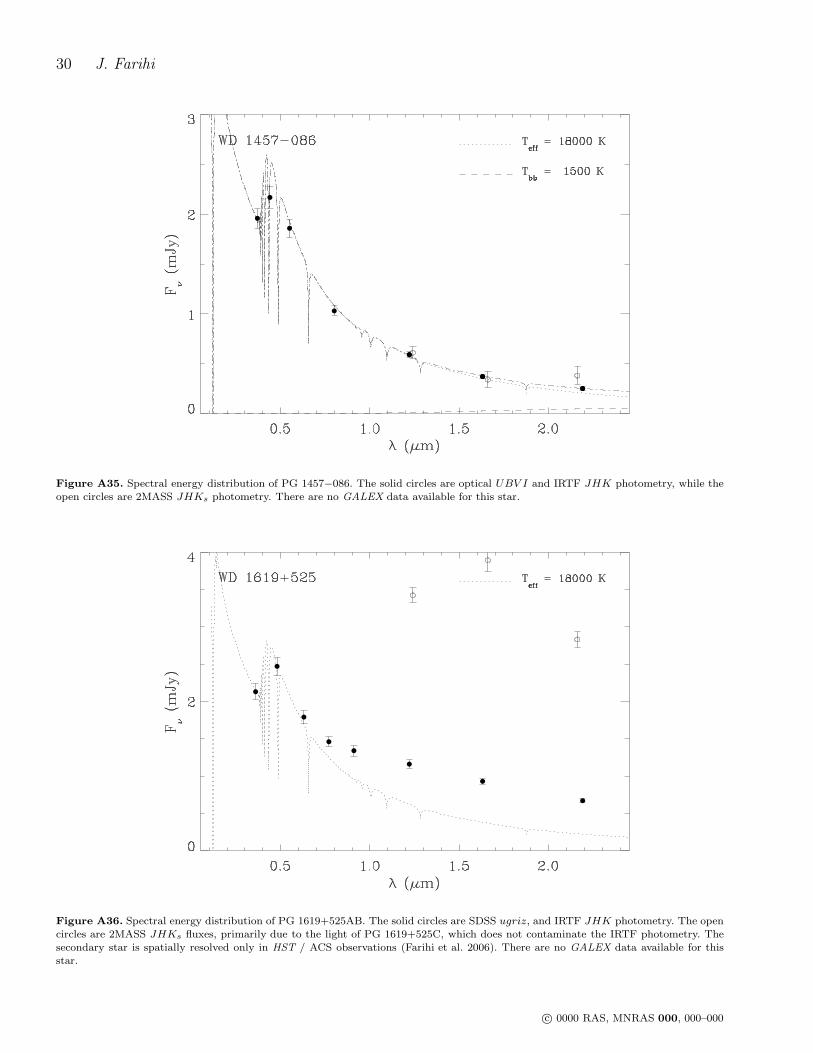
1457−086 . The apparent 2MASS Ks-band excess at thismetal-rich white dwarf is real, but significantly milder in
the IRTF photometry. Optical Balmer line spectroscopy ofthis star by two independent studies yields Teff = 21500 K(Liebert et al. 2005a) and 20400 K (Koester et al. 2005a),yet such models cannot reproduce the UBV IJH fluxes inFigure A35. A 20000 K DA model fitted to the UBV I pho-tometry predicts the measured J-band flux is in excess of theexpected white dwarf photosphere. The optical photometryof Kilkenny et al. (1997) may be somewhat uncertain, butwith only these data available, an 18000 K model reproducesall the photometric fluxes exceptingK band; consistent withan excess due to warm dust (Farihi et al. 2009).
1619+525 . This is a possible triple system (Farihi et al.2006) consisting of a white dwarf and a cool main-sequencecompanion separated by 0.′′5 at position angle 24◦ , togetherwith another cool companion at 2.′′6 and position angle 283◦.The IRTF images spatially resolve PG 1619+525AB from C,and when combined with their HST / ACS F814W photom-etry, imply earlier companion spectral types than previouslysuspected based on the nominal 100 pc photometric distanceto the white dwarf (Farihi et al. 2006; Liebert et al. 2005a).
However, the likely companions both yield consistentphotometric distances near 300 pc: PG 1619+525B hasK = 15.3 mag, I − K = 2.8, while PG 1619+525C hasK = 13.4 mag, I −K = 1.9, compatible with spectral typesM5 and M2 respectively. Common proper motion has notbeen established for these stars, yet a physical association isprobable based on their proximity and high galactic latitude(Farihi et al. 2006). The probability of a chance alignmentwith an M dwarf at 300 pc within a cylinder of r = 0.′′5 andlength 100 pc centered on the white dwarf is less than 1 in5 × 105, while for two M dwarfs within r = 2.′′6 the proba-bility is less than 1 in 2×10⁶. The odds would be somewhatgreater for distant background stars with reddened I-bandmagnitudes, yet ultimately unlikely.
Examination of epoch 1954.5 POSS I plates reveals littleappreciable motion relative to SDSS images taken in 2004.5;USNO-B1 gives a proper motion for the composite triple of(34,−12) mas yr−1, favoring a distant system (vtan = 17 kms−1 at 100 pc versus 51 km s−1 at 300 pc). Yet the whitedwarf parameters derived via Balmer line spectroscopy donot permit such a distant interpretation, as it would implya temperature inconsistent with the UBV photometry andslope of the optical spectrum, or an extremely low surfacegravity. For the time being, the physical association of thesethree stars remains tentative.
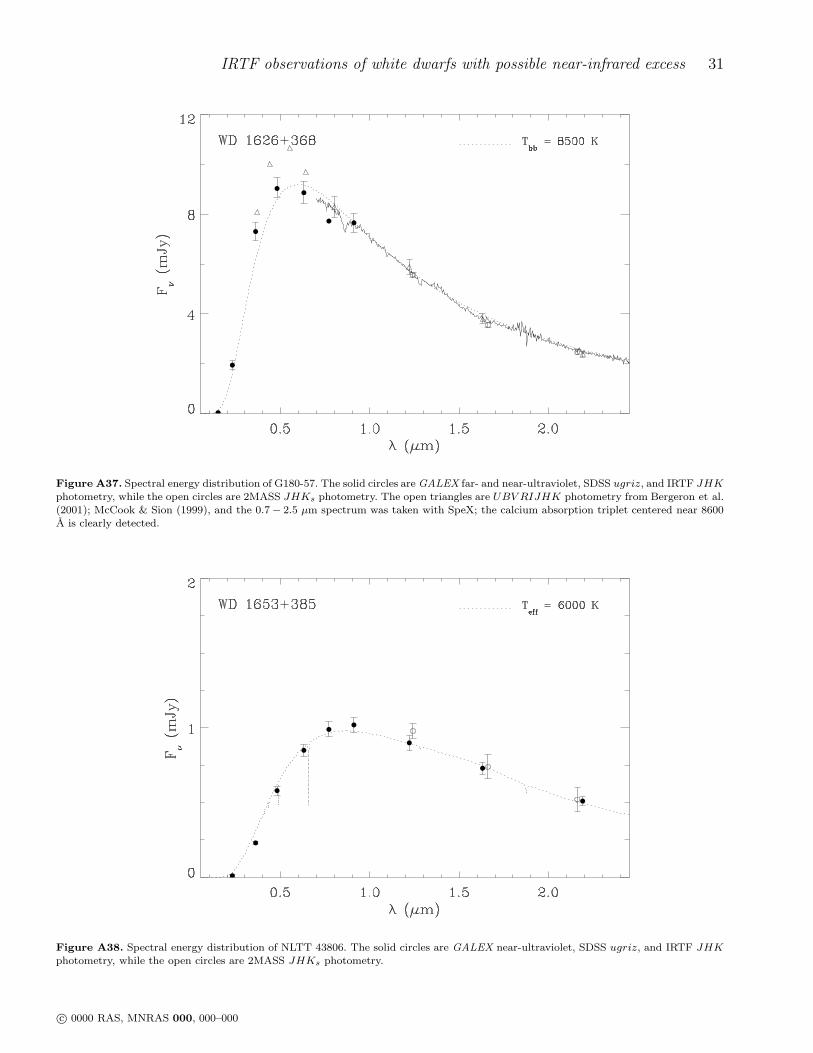
1626+368 . G180-57 is a DZA with a strong 8600 A cal-cium absorption feature detected in its spectrum. The in-dividual lines of the triplet are unresolved at the resolu-tion of the SpeX prism. It is unclear why the SDSS pho-tometry differs significantly with available optical fluxesfrom Bergeron et al. (2001) and several similar measure-ments (McCook & Sion 1999); variability appears possiblein this star.
1653+385 . NLTT 43806 is listed among nearby whitedwarfs with a photometric distance of 15 pc (Holberg et al.2008; Kawka & Vennes 2006), based on an estimated V =15.9 mag (Salim & Gould 2003). The SDSS photometry im-plies a distance greater than 20 pc, with g = 17.0 mag(V ≈ 16.8 mag) and d = 24 pc.
c© 0000 RAS, MNRAS 000, 000–000
8 J. Farihi
1845+683 . This white dwarf is neither a binary nor bi-nary suspect. Green et al. (2000) incorrectly identified thisextreme ultraviolet source with a nearby, unrelated near-infrared source (Farihi et al. 2006).
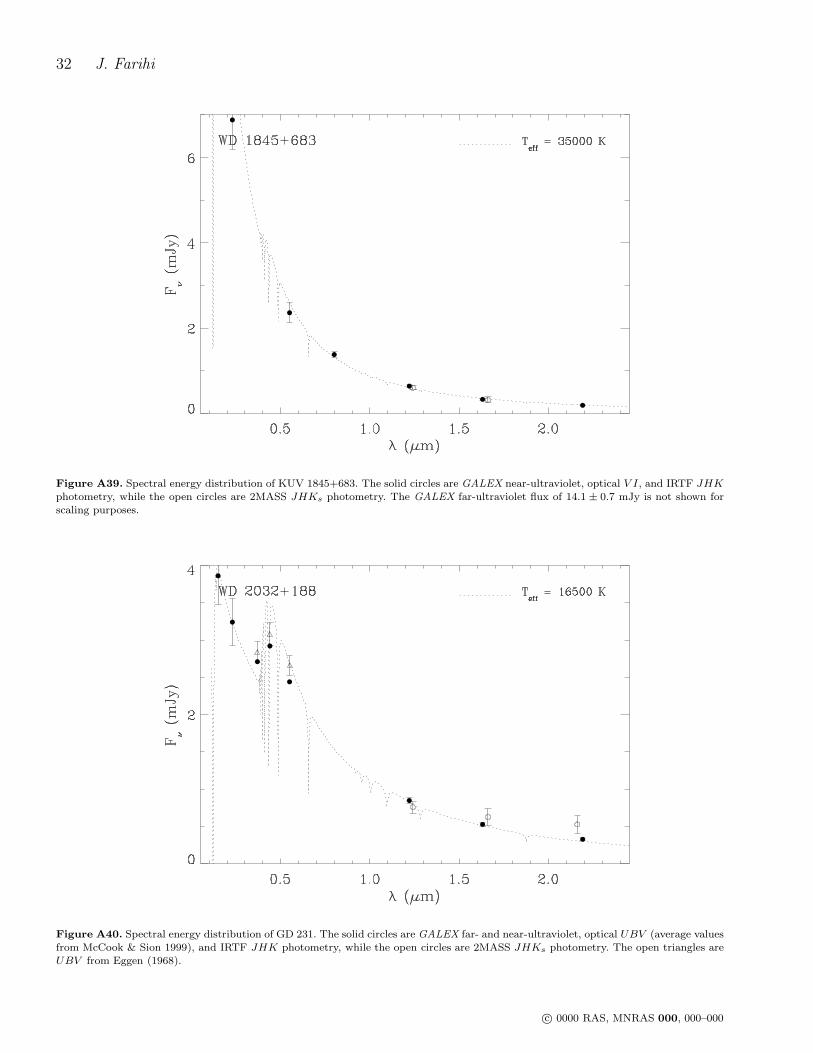
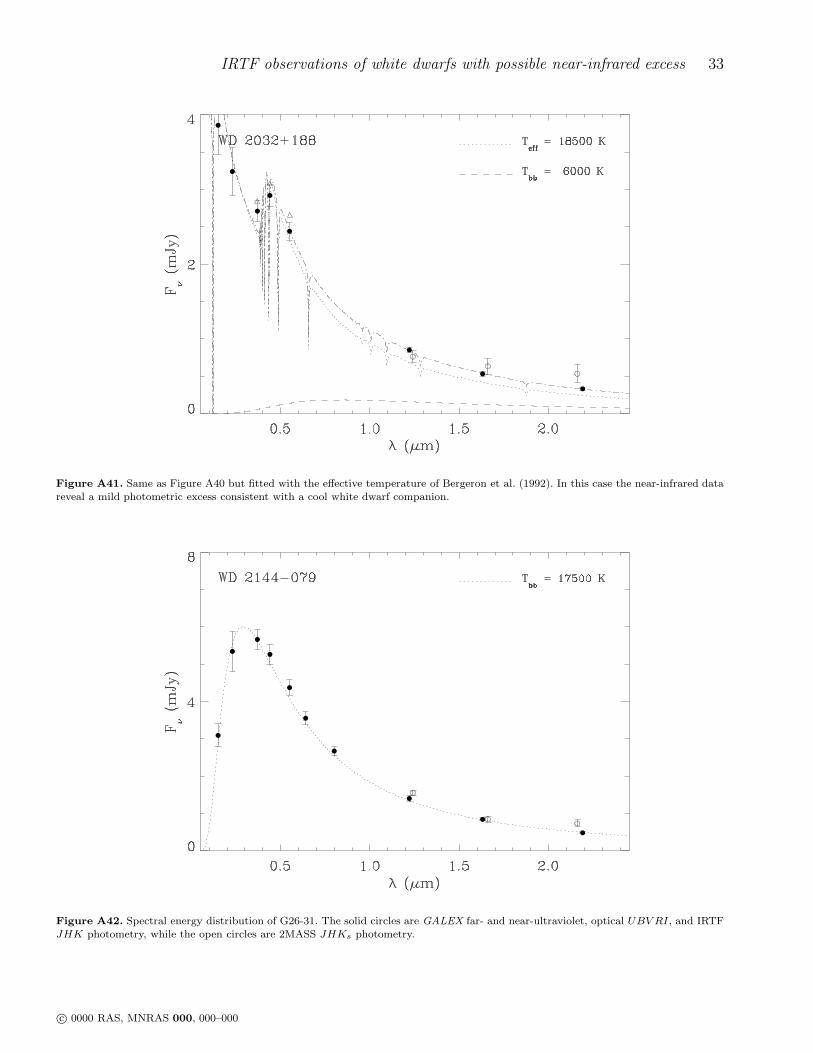
2032+188 . GD 231 is a double degenerate(Morales-Rueda et al. 2005) and may display mild near-infrared excess due to its unseen companion, but the larger2MASS excess is not confirmed. Figure A40 demonstratesthat the entire spectral energy distribution can be decentlymatched by a 16500 K DA model, but this may simplyreflect a good approximation of the composite light ratherthan an accurate effective temperature of either component.Assuming the 18500 K spectroscopic temperature derivedby Bergeron et al. (1992) is correct, Figure A41 predictsan excess at JHK that is consistent with a 6000 K DCcompanion.
2201−228 . This star was tentatively classified as a mag-netic DA, but has since been correctly reclassified as DB(Jordan 2001). The apparent 2MASS excess at this whitedwarf is not confirmed; the 13000 K fit to its spectral en-ergy distribution shown in Figure A43 is the first time aneffective temperature has been assessed for this DB star.
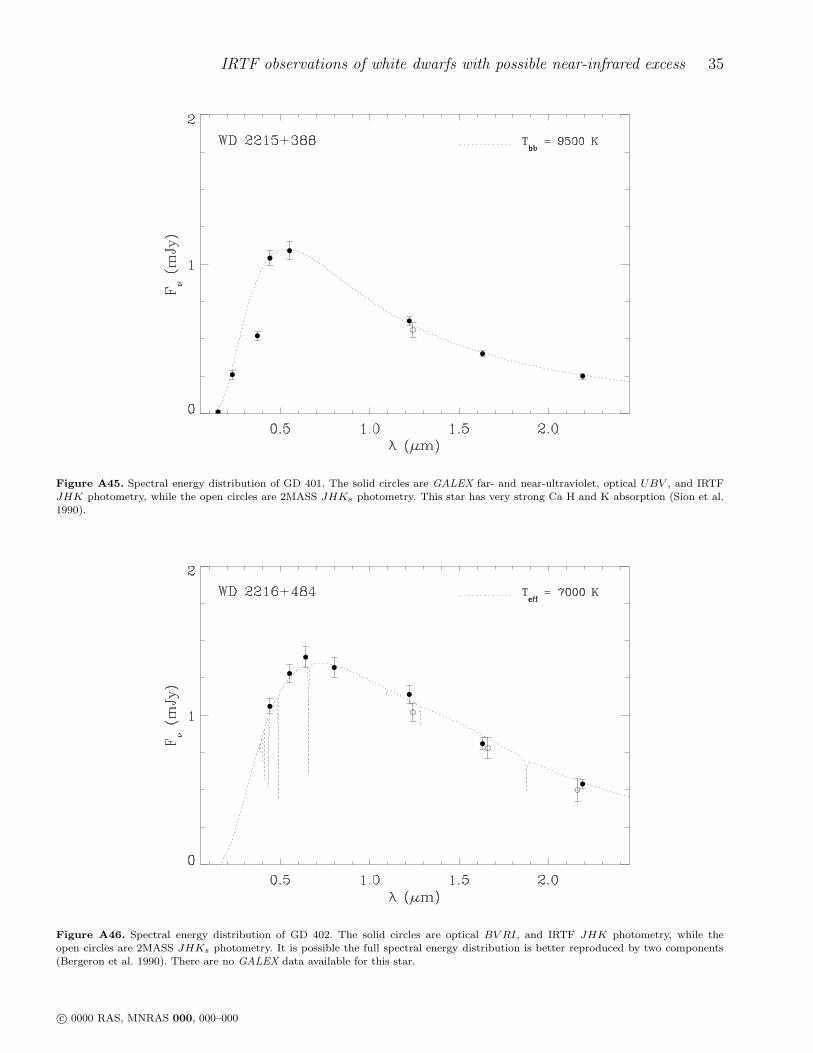
2215+388 . The U -band photometry for this DZ star ap-pears influenced by its strong Ca H and K absorption, andpossibly other elements (Sion et al. 1990).
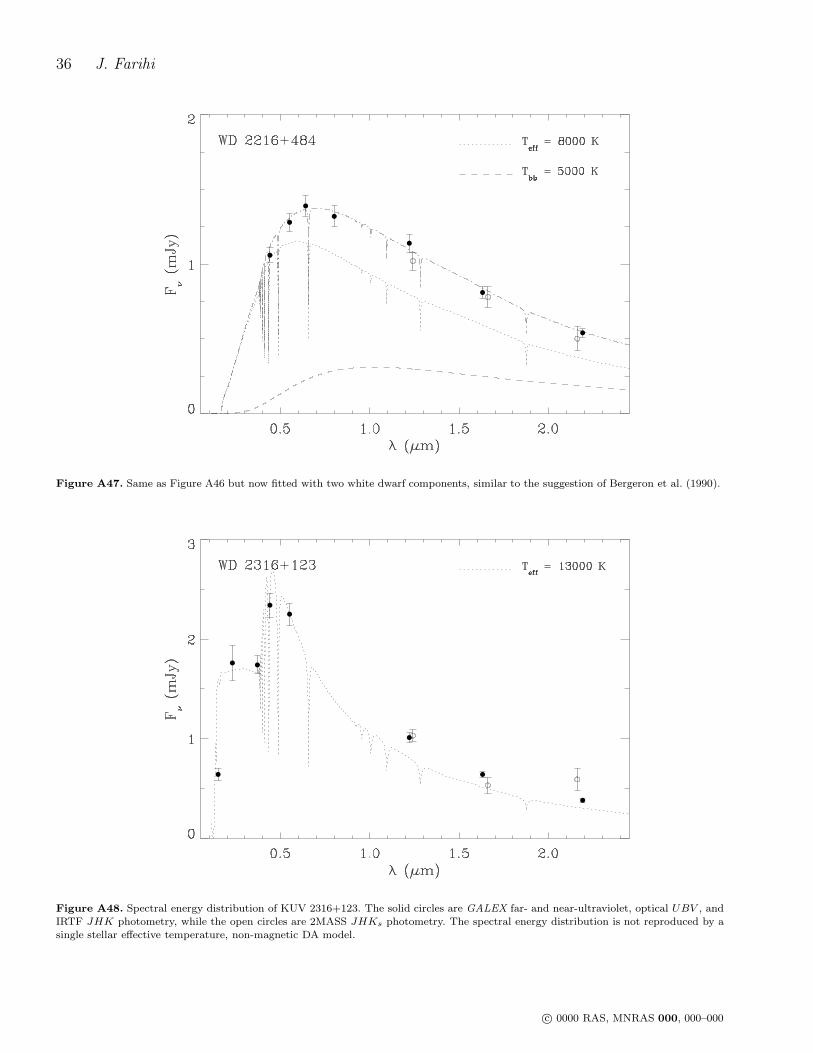
2216+484 . GD 402 is a suspected DA+DC system basedon the fact that its optical colors (and the shape of its opticalspectrum) predict a significantly higher effective tempera-ture than do its relatively weak Balmer lines (Bergeron et al.1990). Although the expanded spectral energy distribution– including the IRTF near-infrared data – can be nearlyreproduced by a single 7000 K component as shown in Fig-ure A46, the photometry can also be well-modeled with twowhite dwarf components of approximately 8000 K and 5000K (Figure A47).
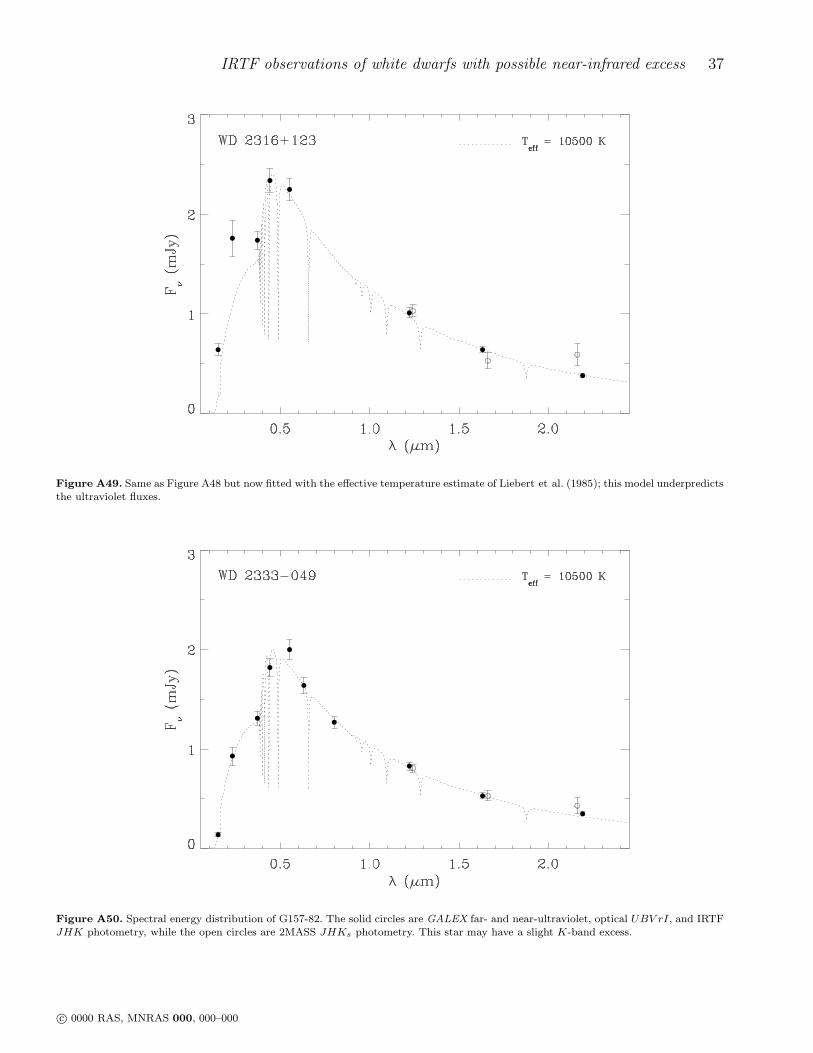
2316+123 . This magnetic white dwarf has a spectral en-ergy distribution that cannot be fitted by a single temper-ature (non-magnetic) white dwarf model. Figure A48 fitsthe combined ultraviolet and optical fluxes to yield a tem-perature near 13000 K, while Figure A49 fits the combinedoptical and near-infrared colors with a temperature around10500 K. It is unclear whether this difficulty is related to themagnetic nature of the star, or if there is a real JHK pho-tometric excess (relative to non-magnetic models), implyingthe possibility of binarity.
2333−049 . This white dwarf may have a small K-bandexcess, but more data are needed to confirm or rule out thispossibility; the V -band flux appears too bright for the modelshown in Figure A50.
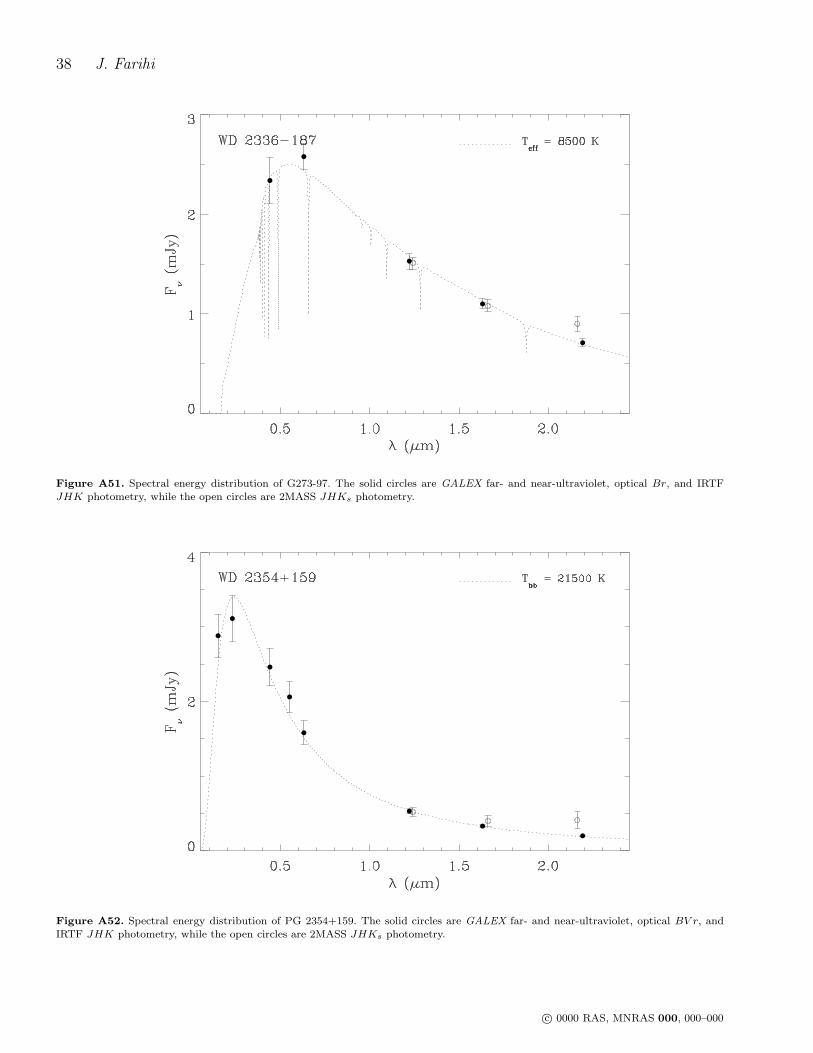
2336−187 . G273-97 is by far the best near-infrared excesscandidate based on its 2MASS data, which appear reliableat all wavelengths. However, the IRTF observations demon-strate that the 2MASS catalog contains significant errorseven at S/N > 10.
2354+159 . Both Voss et al. (2007) and Beauchamp et al.(1999) give Teff ≈ 24500 K – assuming no hydrogen – for thisDBZ star. However, both authors give alternative effectivetemperatures near 22500 K for a nominal hydrogen abun-dance. The higher temperature overpredicts the GALEX
fluxes for this star, and the fit shown in Figure A52 employsa temperature of 21500 K to match all the photometry; pos-sibly indicating some hydrogen is present and closer to the19000 K value given by Koester et al. (2005a).
This white dwarf is another exemplary case of a 2MASSexcess not being corroborated by targeted JHK photome-try; the lack of infrared excess is also confirmed by Spitzer
IRAC observations (Farihi et al. 2009).
5 DISCUSSION
5.1 Near-Infrared Excesses Predicted by 2MASS
The white dwarf fluxes in the 2MASS catalog were the primemotivation for obtaining follow up data, hence it is relevantto ask how well they predicted the IRTF JHK photometry,and the presence of any near-infrared excess. Figure 1 com-pares the IRTF and 2MASS fluxes (in Vega magnitudes) forall 39 Table 2 white dwarf targets with both sets of pho-tometry; transformations between filter sets were ignored asthey are generally within a few percent (Carpenter 2001).
The 2MASS 10σ minimum detection limit for the wholesky is (J,H,Ks) = (15.8, 15.1, 14.3) mag (Skrutskie et al.2006), and there is decent accord for measurements brighterthan this limit. The generally disagreeable behavior of the2MASS data below the 10σ limit in all three filters is notsurprising, yet is most pronounced in theK band. Somewhatunexpectedly, the J-band shows several discordant measuresat the 1 − 2σ level at relatively bright stars. In fact, ofthe co-observed white dwarfs at each bandpass, the H-band2MASS data agree most frequently with the IRTF observa-tions over all brightnesses. At the 1σ level, the 2MASS andIRTF photometry agree for 29 of 37 stars (78%) at H , 25 of38 stars (66%) at J , and 14 of 29 stars (48%) at K.
An infrared excess is revealed by the relative flux lev-els of three or more photometric fluxes, at least two ofwhich should be consistent with photospheric emission andat least one of which is significantly higher than expected forthe photosphere alone. Using this practical definition, the2MASS photometry suggest an H and/or Ks-band excess –relative to 2MASS J or ultraviolet/optical photometry – for27 white dwarfs in Table 2. The potential excess fluxes aremost readily discerned in the Figures, and where confirmedby the IRTF data, these excesses are often of a significantlymilder or altogether different nature than suggested by the2MASS or near-infrared data alone. Hence, it is difficult toprecisely quantify the number of IRTF confirmed versus po-tential 2MASS excesses.
However, by bulk, of the 27 suggested 2MASS candi-date excesses, there are 17 white dwarfs in Table 2 witha confirmed or likely IRTF-measured excess. Interestingly,10 of these are sufficiently mild that (J −K)IRTF < 0.3 or(J − H)IRTF < 0.2, and required shorter wavelength datato be recognized with confidence. Five additional sourcesdisplay relatively strong IRTF excesses in all three near-infrared bandpasses; arising from low mass stellar com-panions, these five objects are also fairly unambiguous in
c© 0000 RAS, MNRAS 000, 000–000

IRTF observations of white dwarfs with possible near-infrared excess 9
Figure 1. The absolute value of the magnitude difference be-tween the IRTF and 2MASS near-infrared photometry for allmutually observed target stars, plotted versus magnitude and un-corrected for distinct filter sets. The displayed error bars are the2MASS uncertainties, the dashed line represents the 2MASS 10σdetection threshold, and the dotted line represents a 5% error inthe IRTF photometry.
2MASS, where they suffer from low S/N H- and Ks-bandfluxes or source confusion. Figure 2 graphically representsall the IRTF near-infrared excesses, including the milderand more subtle cases, by plotting the 2MASS versus IRTFJ − H and J − K measured colors for all white dwarfswith photometry in both datasets. As a rule, the plots showthat the 2MASS data overpredicts the IRTF colors, espe-cially in J − K, and that nine of 22 white dwarfs have(J − K)IRTF > 0.3 as measured by the IRTF and 2MASSrespectively.
Figure 2. IRTF versus 2MASS near-infrared colors. The upperfigure plots J − H for all 37 white dwarfs in common, while thelower figure plots J−K for all 30 white dwarfs in common. Objectswith a comfirmed or likely near-infrared excess are shown as filledsymbols; error bars are not shown to avoid overcrowding in thefigure.
5.2 Several Varieties of Near-Infrared Excess at
White Dwarfs
Three metal-contaminated white dwarfs with dust disksand mid-infrared excess emission also display excess fluxin the IRTF dataset: GD 16, GD 56 and PG 1457−086(Farihi et al. 2009; Jura et al. 2007). Of the known whitedwarfs with orbiting dust and an infrared excess, only abouthalf reveal themselves shortward of 3 µm (Farihi et al. 2009;Kilic et al. 2006), and, where present, these near-infrareddata constrain the inner dust temperature (Jura et al.2009). Nine other metal-polluted white dwarfs have IRTFdata consistent with photospheric emission, all of which havepublished or pending Spitzer IRAC observations.
Near-infrared excess due to cool, unevolved dwarf com-panions is typically evident and strong already by 1 µm(Farihi et al. 2005). Yet nearly all five white dwarf - reddwarf binaries confirmed by the IRTF observations had un-certain 2MASS photometric excesses which required moreaccurate measurements, primarily to obtain the I−K colorof the companion, which in turn constrains spectral type
c© 0000 RAS, MNRAS 000, 000–000
10 J. Farihi
(and mass for a given metallicity). A few cases were fol-lowed up in order to obtain higher spatial resolution images(Farihi et al. 2006) than are available via the 2MASS imageserver.
Few double white dwarf binaries are identified in thenear-infrared, but such discoveries are not unprecedented(Farihi et al. 2005; Nelemans et al. 2005; Zuckerman et al.1997). The cooler component in a double degenerate binaryshould be outshone by its primary at all wavelengths, inthe ultraviolet and optical due to effective temperature, andin the infrared owing to radius. The component with anolder cooling age should have finished the main sequencefirst, descending from the higher mass progenitor star, andbecoming the higher mass and smaller radius degeneratestar (Dobbie et al. 2006). These systems can still exhibit anexcess from the smaller, cooler component, as can be seen forG158-78 and G53-38, where companions have been indicatedby independent means. The IRTF photometry tentativelyidentifies three more double degenerate suspects: G62-46,GD 231, and GD 402.
The near-infrared data on the confirmed or likely mag-netic DA white dwarfs KPD 0253+508 and KUV 2316+123,and DQp white dwarfs LHS 2293 and LP 494-12 rangefrom surprising to spectacular. These stars are all presum-ably single at present, at least until shown otherwise. Non-interacting stellar and substellar companions to magneticwhite dwarfs are rare (or possibly nonexistent; Liebert et al.2005b), but that leaves room for a degenerate companion, asis suspected in the case of G62-46. In any case, non-magneticmodels clearly fail to reproduce the spectral energy distribu-tions of these stars – the near-infrared fluxes in particular– while magnetic models are lacking. The newly acquiredIRTF data provides a new impetus to understand mag-netic white dwarf atmospheres, which are still poorly con-strained, especially in the infrared. Follow up spectroscopyis warranted for these cases, ideally with broad wavelengthcoverage from short optical wavelengths through the near-infrared.
ACKNOWLEDGMENTS
The author thanks referee T. Von Hippel for commentswhich improved the quality and clarity of the manuscript, D.Koester for the use of his models (and B. Gansicke for pro-viding them), M. Burleigh for many helpful discussions, A.Gianninas and G. Schmidt for sharing their optical spectraof PG 0939+071 and LHS 2293, respectively. The data pre-sented here were obtained at the Infrared Telescope Facility,which is operated by the University of Hawaii under Coop-erative Agreement no. NCC 5-538 with NASA, Science Mis-sion Directorate, Planetary Astronomy Program. This pub-lication makes use of data products from the Two Micron AllSky Survey, which is a joint project of the University of Mas-sachusetts and the Infrared Processing and Analysis Center/ California Institute of Technology, funded by NASA andthe National Science Foundation. This work includes datataken with the NASA Galaxy Evolution Explorer, operatedfor NASA by the California Institute of Technology underNASA contract NAS5-98034. Some data presented hereinare part of the Sloan Digital Sky Survey, which is managed
by the Astrophysical Research Consortium for the Partici-pating Institutions (http://www.sdss.org/).
REFERENCES
Adelman-McCarthy, J. K., et al. 2008, ApJS, 175, 297Becklin, E. E., Zuckerman, B. 1988, Nature, 336, 656Beauchamp, A., Wesemael, F., Bergeron, P., Fontaine, G.,Saffer, R. A., Liebert, J., Brassard, P. 1999, ApJ, 516, 887
Bergeron, P., Greenstein, J. L., Liebert, J. 1990, ApJ, 361,190
Bergeron, P., Leggett, S. K., Ruiz, M. T. 2001, ApJS, 133,413
Bergeron, P., Ruiz, M. T., Leggett, S. K. 1993, ApJ, 407,733
Bergeron, P., Ruiz, M. T., Leggett, S. K. 1997, ApJS, 108,339
Bergeron, P., Saffer, R. A., Liebert, J. 1992, ApJ, 394, 228Bergeron, P., Saumon, D., Wesemael, F. 1995a, ApJ, 443,764
Bergeron, P., Wesemael, F., Beauchamp, A. 1995b, PASP,107, 1047
Bochanski, J. J., West, A. A., Hawley, S. L., Covey, K. R.2007, AJ,133, 531
Burleigh, M. R., Barstow, M. A. 1998, MNRAS, 295, L15Burleigh, M. R., Farihi, J. Napiwotzki, R., Marsh, T. R.,Dobbie, P. D. 2009, MNRAS, submitted
Burleigh, M. R. et al. 2008, MNRAS, 386, L5Carpenter, J. M. 2001, AJ, 121, 2851Copenhagen University Observatory 2006, The CarlsbergMeridian Catalog 14 (Strasbourg: CDS)
Catalan, S., Isern, J., Garcıa-Berro, E., Ribas, I., Allende-Prieto, C., Bonanos, A. Z. 2008, A&A, 477, 213
Cushing, M. C., Vacca, W. D., Rayner, J. T. 2004, PASP,116, 362
DENIS Consortium 2005, The DENIS Database, 3rd Re-lease (Strasbourg: CDS)
Dobbie, P. D., et al. 2006, MNRAS, 369, 383Downes, R. A., Margon, B. 1983, PASP, 95, 358Dreizler, S., Werner, K. 1996, A&A, 314, 217Dufour, P., et al. 2007, ApJ, 663, 1291Dupuis, J., Fontaine, G., Wesemael, F. 1993b, ApJS, 87,345
Eggen, O. J. 1968, ApJS, 16, 97Eggen, O. J., Greenstein, J. L. 1965, ApJ, 142, 925Eisenstein, D. J., et al. 2006, AJ, 132, 676Farihi, J., Becklin, E. E., Zuckerman, B. 2005a, ApJS, 161,394
Farihi, J., Becklin, E. E., Zuckerman, B. 2008a, ApJ, 681,1470
Farihi, J., Hoard, D. W., Wachter S. 2006, ApJ, 646, 480Farihi, J., Jura, M., Zuckerman, B. 2009, ApJ, 694, 805Farihi, J., Zuckerman, B., & Becklin, E. E. 2008b, ApJ,674, 431
Green, P. J., Ali, B., Napiwotzki, R. 2000, ApJ, 540, 992Green, R. F., Schmidt, M., Liebert, J. 1986, ApJS, 61, 305Greenstein, J. L. 1984, ApJ, 276, 602Greenstein, J. L., Liebert, J. W. 1990, ApJ, 360, 662Hagen H. J., Groote D., Engels D., Haug U., Toussaint, F.,Reimers, D.1987, A&A,183, L7
c© 0000 RAS, MNRAS 000, 000–000

IRTF observations of white dwarfs with possible near-infrared excess 11
Table 3. Constraints on Multiple System Components
WD Companion Spectral Separation d
Type (arcsec) (pc)
0023−109 G158-78B dM0 59.4 92G158-78C DC8 ... ...
0235+064 PG 0235+064B dM3.5 7.8 620257−005 KUV 0257−005B dM4.5 1.0 4940518+333 G86-B1AC dM3 7.4 650956+045 PG 0956+045B dM5 2.0 1141013−010 G53-38B DC8 ... ...
1108+325 TON 60B dM3 0.2 5601133+489 PG 1133+489B dM5 0.1 3701140+004 WD 1140+004B dM5 ... 2401619+525 1619+525B dM2 2.6 300
1619+525C dM5 0.5 300
Holberg, J. B., Sion, E. M., Oswalt, T., McCook, G. P.,Foran, S., Subasavage, J. P. 2008, AJ, 135, 1225
Homeier, D., Koester, D., Hagen, H. J., Jordan, S., Heber,U., Engels, D., Reimers, D., Dreizler, S. 1998, A&A, 338,563
Jordan, S. 2001, Proceedings of the 12th European Work-shop on White Dwarfs, eds. J. L. Provencal et al. (SanFrancisco: ASP), 269
Jordan, S., Friedrich, S. 2002, A&A, 383, 519Jura, M., Farihi, J., Zuckerman, B. 2007a, ApJ, 663, 1285
Jura, M., Farihi, J., Zuckerman, B. 2009, AJ, 137, 3191Kalirai, J. S., Hansen, B. M. S., Kelson, D. D., Reitzel, D.B., Rich, R. M., Richer, H. B. 2008, ApJ, 676, 594
Kawka, A., Vennes, S. 2006, ApJ, 643, 402Kilic, M., Farihi, J., Nitta, A., Leggett, S. K. 2008, AJ, 136,111
Kilic, M., von Hippel, T., Leggett, S. K., Winget, D. E.2006, ApJ, 646, 474
Kilkenny, D., O’Donoghue, D., Koen, C., Stobie, R. S.,Chen A. 1997, MNRAS, 287, 867
Kirkpatrick, J. D., McCarthy, D. W. 1994, AJ, 107, 333Kleinman, S. J. et al. 2004, ApJ, 607, 426Koester, D. 2009, to appear in Memorie della SocietaAstronomica Italiana, based on lectures given at theSchool of Astrophysics “F. Lucchin”, Tarquinia, June2008 (arXiv:0812.048)
Koester, D., et al. 2001, A&A, 378, 556
Koester, D., Rollenhagen, K., Napiwotzki, R., Voss, B.,Christlieb, N., Homeier, D., Reimers, D. 2005a, A&A, 432,1025
Koester, D., Napiwotzki, R., Voss, B., Homeier, D.,Reimers, D. 2005b, A&A, 439, 317
Liebert, J., Angel, J. R. P., Stockman, H. S., Beaver, E. A.1978, ApJ, 225, 181
Liebert, J., Schmidt, G. D., Sion, E. M., Starrfield, S. G.,Green, R. F., Boroson, T. A. 1985, PASP, 97, 158
Liebert, J., Bergeron, P., Holberg, J. B. 2003, AJ, 125, 348
Liebert, J., Bergeron, P., Holberg, J. B. 2005, ApJS, 156,47
Liebert, J., et al. 2005, AJ, 129, 2376Lisker, T., Heber, U., Napiwotzki, R., Christlieb, N., Han,Z., Homeier, D., Reimers, D. 2005, A&A, 430, 223
Massey, P., Johnson, K. E., Degioia-Eastwood K. 1995,ApJ, 454, 151
McCook, G. P., Sion, E. M. 2006, Catalog of Spectroscop-ically Identified White Dwarfs (Strasbourg: CDS)
McCook, G. P., Sion, E. M. 1999, ApJS, 121, 1Monet, D., et al. 2003, AJ, 125, 984
Morales-Rueda, L., Marsh, T. R., Maxted, P. F. L., Nele-mans, G., Karl, C., Napiwotzki, R., Moran, C. K. J. 2005,MNRAS, 359, 648
Napiwotzki, R., Green, P. J., Saffer, R. A. 1999, ApJ, 517,399
Nelemans, G., et al. 2005, A&A, 440, 1087Pauli, E. M., Napiwotzki, R., Heber, U., Altmann, M.,Odenkirchen, M. 2006, A&A, 447, 173
Probst, R. 1983, ApJS, 53, 335Putney, A. 1997, ApJS, 112, 527Raymond, S. N., et al. 2003, AJ, 125, 2621Rayner, J. T., Toomey, D. W., Onaka, P. M., Denault, A.J., Stahlberger, W. E., Vacca, W. D., Cushing, M. C.,Wang S. 2003, PASP, 115, 362
Rebassa-Mansergas, A., Gansicke, B. T., Rodrıguez-Gil, P.,Schreiber, M. R., Koester, D. 2007, MNRAS, 382, 1377
Reid, I. N. 1996, AJ, 111, 2000Salim, S., Gould, A. 2003, ApJ, 582, 1011Schmidt, G. D., Smith, P. S. 1994, ApJ, 423, L63Schmidt, G. D., Bergeron, P., Fegley, B. 1995, ApJ, 443,274
Schmidt, G. D., Liebert, J., Harris, H. C., Dahn, C. C.,Leggett, S. K. 1999, ApJ, 512, 916
Silvestri, N. M., et.al. 2006, AJ, 131, 1674Sion, E. M., Hammond, G. L., Wagner, R. M., Starrfield,S. G., Liebert, J. 1990, ApJ, 362, 691
Skrutskie, M. F., et al. 2006, AJ, 131, 1163Space Telescope Science Institute 2006, The Guide StarCatalog Version 2.3, (Baltimore: STScI)
Steele, P. R., Burleigh, M. R., Farihi, J., Gansicke, B. T.,Jameson, R. F., Dobbie, P. D., Barstow Dobbie, M. A.2009, A&A, in press
Vacca, W. D., Cushing, M. C., Rayner, J. T. 2003, PASP,115, 389
van Altena, W. F., Lee, J. T., Hoffleit, E. D. 1995, TheGeneral Catalogue of Trigonometric Paralaxes, 4th edition(New Haven: Yale University Observatory)
Vennes, S., Smith, R. J., Boyle, B. J., Croom, S. M., Kawka,A., Shanks, T., Miller, L., Loaring, N. 2002, MNRAS, 335,673
c© 0000 RAS, MNRAS 000, 000–000
12 J. Farihi
von Hippel, T., Kuchner, M. J., Kilic, M., Mullaly, F., &Reach, W. T. 2007, ApJ, 662, 544
Voss, B., Koester, D., Napiwotzki, R., Christlieb, N.,Reimers, D. 2007, A&A, 470, 1079
Wachter, S., Hoard, D. W., Hansen, K. H., Wilcox, R. E.,Taylor, H. M., Finkelstein, S. L. 2003, ApJ, 586, 1356
Wellhouse, J. W., Hoard, D. W., Howell, S. B., Wachter,S., Esin, A. A. 2005, PASP, 117, 1378
Williams, K. A., Bolte, M., Koester, D. 2009, ApJ, 693,355
Wolff, B., Koester, D., Liebert, J. 2002, A&A, 385, 995Zacharias, N., Urban, S. E., Zacharias, M. I., Wycoff, G.L., Hall, D. M., Monet, D. G., Rafferty, T. J. 2004 AJ,127, 3043
Zacharias, N., Monet, D. G., Levine, S. E., Urban, S. E.,Gaume, R., Wycoff, G. L. 2005, The NOMAD Catalog(Strasbourg: CDS)
Zuckerman, B., Becklin, E. E., Macintosh, B. A., Bida, T.1997, AJ, 113, 764
Zuckerman, B., Koester, D., Reid, I. N., Hunsch, M. 2003,ApJ, 596, 477
Zuckerman, B., et al. 2008, ApJ, 683, 1085
APPENDIX A: INDIVIDUAL SPECTRAL
ENERGY DISTRIBUTIONS
c© 0000 RAS, MNRAS 000, 000–000
IRTF observations of white dwarfs with possible near-infrared excess 13
Figure A1. Spectral energy distribution of G158-78. The solid circles are GALEX far- and near-ultraviolet, SDSS ugriz, and IRTFJHK photometry, while the open circles are 2MASS JHKs photometry. The star is a likely double degenerate.
Figure A2. Spectral energy distribution of HE 0106−3253. The solid circles are GALEX far- and near-ultraviolet, optical V I, and IRTFJHK photometry, while the open circles are 2MASS JH photometry.
c© 0000 RAS, MNRAS 000, 000–000

14 J. Farihi
Figure A3. Spectral energy distribution of NLTT 3915. The solid circles are GALEX near-ultraviolet, optical V , and IRTF JHK
photometry, while the open circles are 2MASS JHKs photometry.
Figure A4. Spectral energy distribution of GD 16. The solid circles are optical V r, and IRTF JHK photometry, while the open circlesare 2MASS JHKs photometry. There are no GALEX data available for this star.
c© 0000 RAS, MNRAS 000, 000–000
IRTF observations of white dwarfs with possible near-infrared excess 15
Figure A5. Spectral energy distribution of GD 20. The solid circles are GALEX far- and near-ultraviolet, optical UBV , and IRTFJHK photometry, while the open circles are 2MASS JH photometry.
Figure A6. Spectral energy distribution of PG 0156+155. The solid circles are GALEX far- and near-ultraviolet, optical V , and IRTFJHK photometry, while the open circles are 2MASS JH photometry.
c© 0000 RAS, MNRAS 000, 000–000
16 J. Farihi
Figure A7. Spectral energy distribution of PG 0235+064. The solid circles are GALEX far- and near-ultraviolet, optical UB, and IRTFJHK photometry, while the open circles are 2MASS JH photometry. The solid-circle photometry is uncontaminated by the nearbycommon-proper motion companion (Farihi et al. 2008b), indicating a new, higher effective temperature for this white dwarf.
Figure A8. Spectral energy distribution of KPD 0253+508. The solid circles are GALEX far- and near-ultraviolet, optical UBV , andIRTF JHK photometry, while the open circles are 2MASS JHKs photometry. A single effective temperature does not fit this magneticwhite dwarf; it has clear excess (relative to non-magnetic DA models) emission at JHK.
c© 0000 RAS, MNRAS 000, 000–000
IRTF observations of white dwarfs with possible near-infrared excess 17
Figure A9. Spectral energy distribution of KUV 0257−005. The solid circles are GALEX far- and near-ultraviolet, SDSS ugriz, andIRTF JHK photometry, while the open circles are 2MASS JHKs photometry. There is clear evidence for extinction at ultraviolet andoptical wavelengths.
Figure A10. Spectral energy distribution of GD 56. The solid circles are GALEX far- and near-ultraviolet, optical UBV I, and IRTFJHK photometry, while the open circles are 2MASS JHKs photometry.
c© 0000 RAS, MNRAS 000, 000–000
18 J. Farihi
Figure A11. Spectral energy distribution of EG 43. The solid circles are optical UBV I, and IRTF JHK photometry, while the opencircles are 2MASS JHKs photometry, clearly contaminated by the light from the visual M dwarf companion. The open triangles areBV RIJHK from Bergeron et al. (2001), also apparently contaminated at optical wavelengths.
Figure A12. Spectral energy distribution of PG 0939+071. The solid circles are GALEX far- and near-ultraviolet, and SDSS ugriz
photometry, while the open circles are 2MASS JHKs photometry. The 0.7−2.5 µm spectrum was taken with SpeX, and the blue opticalspectrum is also shown (see Figure A12).
c© 0000 RAS, MNRAS 000, 000–000
IRTF observations of white dwarfs with possible near-infrared excess 19
Figure A13. The blue optical spectrum of PG 0939+071 (A. Gianninas 2008, private communication), shown together with a 7000 KDA white dwarf model (dashed line), and a low resolution F2V stellar model (dotted line). Note the blue continuum in the actual datais not seen in either model.
Figure A14. An F8V stellar model fitted to the optical and near-infrared photometry of PG 0939+071; revealing a clear ultravioletflux excess.
c© 0000 RAS, MNRAS 000, 000–000
20 J. Farihi
Figure A15. Spectral energy distribution of PG 0956+045A. The solid circles are GALEX far- and near-ultraviolet, SDSS ugriz, andIRTF JHK photometry. The open circles are 2MASS JHKs photometry, which are primarily due to the flux from PG 0956+045B.
Figure A16. Spectral energy distribution of TON 1145. The solid circles are SDSS ugriz, and IRTF JHK photometry, while the opencircles are 2MASS JHKs photometry. The 0.7− 2.5 µm spectrum was taken with SpeX, and the optical SDSS spectrum is also shown(see Figure A17).
c© 0000 RAS, MNRAS 000, 000–000
IRTF observations of white dwarfs with possible near-infrared excess 21
Figure A17. The SDSS blue optical spectrum of TON 1145, shown together with a 7500 K DA white dwarf model (dashed line), anda low resolution A8V stellar model (dotted line). Note the flat psuedo-continuum below 4500A in the actual data is not seen in eithermodel.
Figure A18. An F2V stellar model fitted to the optical and near-infrared photometry of TON 1145. While there are no GALEX datafor this star, it appears possible it also has an ultraviolet excess.
c© 0000 RAS, MNRAS 000, 000–000

22 J. Farihi
Figure A19. Spectral energy distribution of G53-38. The solid circles are GALEX far- and near-ultraviolet, SDSS ugr, optical V I, andIRTF JHK photometry, while the open circles are 2MASS JHKs photometry. The 0.7− 2.5 µm spectrum was taken with SpeX. Thereappears to be photometric evidence of the known, hidden white dwarf companion (Nelemans et al. 2005).
Figure A20. Spectral energy distribution of LHS 2293. The solid circles are GALEX near-ultraviolet, optical UBV RI, and IRTF JHK
photometry, while the open circles are 2MASS JHKs photometry. Also shown is the optical spectrum from Schmidt et al. (1995). Theultraviolet and optical photometry seem to indicate an effective temperature near 7500 K (Liebert et al. 1978).
c© 0000 RAS, MNRAS 000, 000–000

IRTF observations of white dwarfs with possible near-infrared excess 23
Figure A21. The 0.7 − 2.5 µm spectrum taken with SpeX indicates a significantly lower effective temperature of 4300 K. The regionbelow 0.9 µm may suffer from poor correction to the instrument response.
Figure A22. Spectral energy distribution of TON 60. The solid circles are GALEX near-ultraviolet, SDSS ugriz, and IRTF JHK
photometry, while the open circles are 2MASS JHKs photometry. The GALEX far-ultraviolet flux of 4.9 ± 0.5 mJy is not shown forscaling purposes. The light of TON 60B dominates at wavelengths beyond 0.8 µm.
c© 0000 RAS, MNRAS 000, 000–000
24 J. Farihi
Figure A23. Spectral energy distribution of PG 1133+489. The solid circles are GALEX near-ultraviolet, SDSS ugriz, and IRTF JHK
photometry, while the open circles are 2MASS JHKs photometry. The GALEX far-ultraviolet flux of 3.1 ± 0.3 mJy is not shown forscaling purposes. The companion flux dominates at wavelengths beyond 0.8 µm.
Figure A24. Spectral energy distribution of SDSS J114312.57+000926.5. The solid circles are SDSS ugriz, and IRTF JHK photometry,while the open circles are 2MASS JHKs photometry. The GALEX data for this source appear unreliable due to a nearby, bright star.The companion flux strongly dominates the system at red optical wavelengths.
c© 0000 RAS, MNRAS 000, 000–000

IRTF observations of white dwarfs with possible near-infrared excess 25
Figure A25. Spectral energy distribution of LP 494-12. The solid circles are GALEX near-ultraviolet, SDSS ugriz, and IRTF JHK
photometry, while the open circle is 2MASS J photometry. The ugr flux points were ignored in the fit as large absorption bands affectthose bandpasses, while the iz photometry is unaffected by features in the SDSS spectrum.
Figure A26. Spectral energy distribution of PG 1225−079. The solid circles are GALEX far- and near-ultraviolet, optical V , and IRTFJHK photometry, while the open circles are 2MASS JHKs photometry. The 0.7− 2.5 µm spectrum was taken with SpeX; the calciumabsorption triplet centered near 8600 A is clearly detected.
c© 0000 RAS, MNRAS 000, 000–000
26 J. Farihi
Figure A27. Spectral energy distribution of HS 1254+345. The solid circles are GALEX far- and near-ultraviolet, SDSS ugriz, andIRTF JHK photometry, while the open circles are 2MASS JH photometry. The 0.7−2.5 µm spectrum was taken with SpeX; the absenceof hydrogen lines is consistent with the presence of a high magnetic field. The region below 0.9 µm may suffer from poor correction tothe instrument response.
Figure A28. Spectral energy distribution of G62-46. The solid circles are GALEX near-ultraviolet, SDSS ugriz, and IRTF JHK
photometry, while the open circles are 2MASS JHKs photometry. The open triangles are BV RIJHK from Bergeron et al. (1997) andthe models are fitted to their data. The I-band flux predicts a hotter DC component at odds with the SDSS iz photometry.
c© 0000 RAS, MNRAS 000, 000–000
IRTF observations of white dwarfs with possible near-infrared excess 27
Figure A29. Same as Figure A28 but now the models are fitted to the ugriz photometry. While a cooler DC component reproducesthe optical data, the full spectral energy distribution cannot be fitted simultaneously. Variability appears possible in this likely binary(see §4).
Figure A30. Spectral energy distribution of PG 1339+346. The solid circles are GALEX far- and near-ultraviolet, SDSS ugriz, andIRTF JHK photometry. The white dwarf was spatially and photometrically resolved from its apparent (i.e. non-physical) companion2′′.6 away (see §4) during the IRTF observations, but the reliability of the SDSS photometry is uncertain. It appears that the ugriz
photometry was adversely affected by the background star.
c© 0000 RAS, MNRAS 000, 000–000
28 J. Farihi
Figure A31. Spectral energy distribution of LP907-37. The solid circles are GALEX far- and near-ultraviolet, optical UBV , and IRTFJHK photometry, while the open circle is 2MASS H photometry. The 0.7− 2.5 µm spectrum was taken with SpeX.
Figure A32. Spectral energy distribution of PG 1428+373. The solid circles are SDSS ugriz, and IRTF JHK photometry, while theopen circles are 2MASS JHKs photometry. The 0.7 − 2.5 µm spectrum was taken with SpeX. There are no GALEX data available forthis star, and there is no photometric evidence of the known white dwarf companion (Morales-Rueda et al. 2005).
c© 0000 RAS, MNRAS 000, 000–000
IRTF observations of white dwarfs with possible near-infrared excess 29
Figure A33. Spectral energy distribution of TON 210. The solid circles are GALEX far- and near-ultraviolet, SDSS ugriz, and IRTFJHK photometry, while the open circles are 2MASS JHKs photometry. The GALEX far-ultraviolet flux of 7.8± 0.8 mJy is not shownfor scaling purposes. The 0.7− 2.5 µm spectrum was taken with SpeX.
Figure A34. Spectral energy distribution of G166-58. The solid circles are GALEX near-ultraviolet, SDSS ugriz, and IRTF JHK
photometry, while the open circles are 2MASS JHKs photometry. The open triangles are UBV RIJHK photometry from Bergeron et al.(2001); McCook & Sion (1999), and the 0.7− 2.5 µm spectrum was taken with SpeX, which suffers from poor telluric correction.
c© 0000 RAS, MNRAS 000, 000–000
30 J. Farihi
Figure A35. Spectral energy distribution of PG 1457−086. The solid circles are optical UBV I and IRTF JHK photometry, while theopen circles are 2MASS JHKs photometry. There are no GALEX data available for this star.
Figure A36. Spectral energy distribution of PG 1619+525AB. The solid circles are SDSS ugriz, and IRTF JHK photometry. The opencircles are 2MASS JHKs fluxes, primarily due to the light of PG 1619+525C, which does not contaminate the IRTF photometry. Thesecondary star is spatially resolved only in HST / ACS observations (Farihi et al. 2006). There are no GALEX data available for thisstar.
c© 0000 RAS, MNRAS 000, 000–000
IRTF observations of white dwarfs with possible near-infrared excess 31
Figure A37. Spectral energy distribution of G180-57. The solid circles are GALEX far- and near-ultraviolet, SDSS ugriz, and IRTF JHK
photometry, while the open circles are 2MASS JHKs photometry. The open triangles are UBV RIJHK photometry from Bergeron et al.(2001); McCook & Sion (1999), and the 0.7− 2.5 µm spectrum was taken with SpeX; the calcium absorption triplet centered near 8600A is clearly detected.
Figure A38. Spectral energy distribution of NLTT 43806. The solid circles are GALEX near-ultraviolet, SDSS ugriz, and IRTF JHK
photometry, while the open circles are 2MASS JHKs photometry.
c© 0000 RAS, MNRAS 000, 000–000
32 J. Farihi
Figure A39. Spectral energy distribution of KUV 1845+683. The solid circles are GALEX near-ultraviolet, optical V I, and IRTF JHK
photometry, while the open circles are 2MASS JHKs photometry. The GALEX far-ultraviolet flux of 14.1 ± 0.7 mJy is not shown forscaling purposes.
Figure A40. Spectral energy distribution of GD 231. The solid circles are GALEX far- and near-ultraviolet, optical UBV (average valuesfrom McCook & Sion 1999), and IRTF JHK photometry, while the open circles are 2MASS JHKs photometry. The open triangles areUBV from Eggen (1968).
c© 0000 RAS, MNRAS 000, 000–000
IRTF observations of white dwarfs with possible near-infrared excess 33
Figure A41. Same as Figure A40 but fitted with the effective temperature of Bergeron et al. (1992). In this case the near-infrared datareveal a mild photometric excess consistent with a cool white dwarf companion.
Figure A42. Spectral energy distribution of G26-31. The solid circles are GALEX far- and near-ultraviolet, optical UBV RI, and IRTFJHK photometry, while the open circles are 2MASS JHKs photometry.
c© 0000 RAS, MNRAS 000, 000–000
34 J. Farihi
Figure A43. Spectral energy distribution of HE 2201−228. The solid circles are GALEX far- and near-ultraviolet, estimated optical V ,and IRTF JHK photometry, while the open circles are 2MASS JHKs photometry.
Figure A44. Spectral energy distribution of LHS 3779. The solid circles are GALEX near-ultraviolet, optical V I, and IRTF JHK
photometry, while the open circles are 2MASS JHKs photometry.
c© 0000 RAS, MNRAS 000, 000–000
IRTF observations of white dwarfs with possible near-infrared excess 35
Figure A45. Spectral energy distribution of GD 401. The solid circles are GALEX far- and near-ultraviolet, optical UBV , and IRTFJHK photometry, while the open circles are 2MASS JHKs photometry. This star has very strong Ca H and K absorption (Sion et al.1990).
Figure A46. Spectral energy distribution of GD 402. The solid circles are optical BV RI, and IRTF JHK photometry, while theopen circles are 2MASS JHKs photometry. It is possible the full spectral energy distribution is better reproduced by two components(Bergeron et al. 1990). There are no GALEX data available for this star.
c© 0000 RAS, MNRAS 000, 000–000
36 J. Farihi
Figure A47. Same as Figure A46 but now fitted with two white dwarf components, similar to the suggestion of Bergeron et al. (1990).
Figure A48. Spectral energy distribution of KUV 2316+123. The solid circles are GALEX far- and near-ultraviolet, optical UBV , andIRTF JHK photometry, while the open circles are 2MASS JHKs photometry. The spectral energy distribution is not reproduced by asingle stellar effective temperature, non-magnetic DA model.
c© 0000 RAS, MNRAS 000, 000–000
IRTF observations of white dwarfs with possible near-infrared excess 37
Figure A49. Same as Figure A48 but now fitted with the effective temperature estimate of Liebert et al. (1985); this model underpredictsthe ultraviolet fluxes.
Figure A50. Spectral energy distribution of G157-82. The solid circles are GALEX far- and near-ultraviolet, optical UBV rI, and IRTFJHK photometry, while the open circles are 2MASS JHKs photometry. This star may have a slight K-band excess.
c© 0000 RAS, MNRAS 000, 000–000
38 J. Farihi
Figure A51. Spectral energy distribution of G273-97. The solid circles are GALEX far- and near-ultraviolet, optical Br, and IRTFJHK photometry, while the open circles are 2MASS JHKs photometry.
Figure A52. Spectral energy distribution of PG 2354+159. The solid circles are GALEX far- and near-ultraviolet, optical BV r, andIRTF JHK photometry, while the open circles are 2MASS JHKs photometry.
c© 0000 RAS, MNRAS 000, 000–000