Embed Size (px)
Citation preview

Irrigated wheat in southern cropping systems

ii | NSW Department of Primary Industries
This manual was produced by NSW Department of Primary Industries as part of the Southern irrigated cereal and canola varieties achieving target yields project (DAN00198; 2014–2017). The project had joint investment by NSW Department of Primary Industries and the Grains Research and Development Corporation.
The following organisations have provided experiment data, technical input or project support and are gratefully acknowledged:
Compiled and edited by Cynthia Podmore, NSW DPI, Wagga Wagga NSW.
Reviewed by Peter Matthews, Technical Specialist Grain Services, NSW DPI, Orange NSW; Damian Jones, Irrigated Cropping Council, Kerang Victoria; Terry Horan, Senior Agronomic Specialist, Roberts, Tasmania.
ISBN: 978-1-76058-133-6 (web)
© State of New South Wales through Department of Industry 2017. You may copy, distribute, display, download and otherwise freely deal with this publication for any purpose, provided that you attribute the Department of Industry as the owner. However, you must obtain permission if you wish to:
• charge others for access to the publication (other than at cost) • include the publication in advertising or a product for sale • modify the publication • republish the publication on a website.
You may freely link to the publication on a departmental website.
DisclaimerThe information contained in this publication is based on knowledge and understanding at the time of writing (June 2017) and may not be accurate, current or complete. The State of New South Wales (including the NSW Department of Industry), the author and the publisher take no responsibility, and will accept no liability, for the accuracy, currency, reliability or correctness of any information included in the document (including material provided by third parties). Readers should make their own inquiries and rely on their own advice when making decisions related to material contained in this publication.
Always read the labelUsers of agricultural or veterinary chemical products must always read the label and any permit, before using the product, and strictly comply with the directions on the label and the conditions of any permit. Users are not absolved from compliance with the directions on the label or the conditions of the permit by reason of any statement made or not made in this publication.
The product trade names in this publication are supplied on the understanding that no preference between equivalent products is intended and that the inclusion of a product name does not imply endorsement by the department over any equivalent product from another manufacturer.

IRRIGATED WHEAT IN SOUTHERN CROPPING SYSTEMS 2017 | 1
ContentsIntroduction 4
Irrigation management 7John Smith and Brian Dunn, NSW DPI Yanco
Varietal selection 12Peter Matthews, NSW DPI Orange
Crop establishment 21Eric Koetz, NSW DPI Wagga Wagga
Crop nutrition 25Tony Napier, NSW DPI Yanco
Disease management 29Brad Baxter, NSW DPI Wagga Wagga, Dr Steven Simpfendorfer, NSW DPI Tamworth and Dr Andrew Milgate, NSW DPI Wagga Wagga
Insect management 36Jo Holloway, NSW DPI Wagga Wagga
Weed management 41Aaron Preston, NSW DPI Wagga Wagga
Case study 43Improving irrigation efficiency through infrastructure improvements in northern Victoria
Case study 47High-yielding irrigated wheat in the Lachlan Valley, NSW
Appendix 1: project overview 50‘Southern irrigated cereal and canola varieties achieving target yields’
Appendix 2: constraints 58Current irrigated cropping production constraints – the growers’ perspective

2 | NSW Department of Primary Industries
AcknowledgementsThe following people and organisations are gratefully acknowledged for their contributions to this project:Deb Slinger, Director Southern Cropping, NSW DPI, Wagga Wagga NSW Luke Gaynor, Leader Southern Dryland Systems, NSW DPI, Wagga Wagga NSW Neroli Graham, Research Officer, NSW DPI, Tamworth NSW Tania Moore, Project Officer, NSW DPI, Griffith
Murrumbidgee ValleyTony Napier, Research & Development Agronomist Irrigated, NSW PI, Yanco NSW Glenn Morris, Technical Assistant, NSW DPI, Yanco NSW Daniel Johnston, Technical Assistant, NSW DPI, Yanco NSW
Murray ValleyTony Napier, Research & Development Agronomist Irrigated, NSW DPI, Yanco NSW Eric Koetz, Research Agronomist Weeds, NSW DPI, Wagga Wagga NSW
Lachlan ValleyNeil Fettell, Senior Research Advisor, Central West Farming Systems, Condobolin NSW Barry Haskins, Agronomist/Director, Ag Grow Agronomy and Research, Hillston NSW Rachael Whitworth, Research Manager, Ag Grow Agronomy and Research, Hillston NSW
North-west VictoriaDamian Jones, Trials Manager, Irrigated Cropping Council, Kerang Victoria Rob Fisher, former CEO, Irrigated Cropping Council, Kerang Victoria
South-east South AustraliaAmanda Pearce, Senior Research Scientist, SARDI, Struan Research Centre, Naracoorte SA Felicity Turner, former Operations and Research Manager, MacKillop Farm Management Group, Naracoorte SA
TasmaniaHeather Cosgriff, former Tasmanian Trials & Projects Manager, Southern Farming Systems, Cressy Tasmania
Acronyms used in this publicationBMP Best Management PracticeCIA Coleambally Irrigation AreaCWFS Central West Farming SystemsGRDC Grains Research and Development CorporationICC Irrigated Cropping Council (Victoria)IREC Irrigation Research and Extension CommitteeMFMG MacKillop Farm Management GroupMIA Murrumbidgee Irrigation AreaNSW DPI New South Wales Department of Primary IndustriesSFS Southern Farming SystemsSARDI South Australian Research and Development InstituteVSAP Variety Specific Agronomy PackageML MegalitreNDVI Normalised Difference Vegetation Index

IRRIGATED WHEAT IN SOUTHERN CROPPING SYSTEMS 2017 | 3
ReferencesAngus, JF 2001, Nitrogen supply and demand in Australian agriculture. Australian Journal of Experimental Agriculture 41, 277-288.
Angus, J 2015, Topdressing for high yielding crops – An irrigator’s crop N budget, GRDC technical workshop, Finley.
Angus, J and Lacy, J 2002a, ‘N management for an 8 tonne/ha wheat under irrigation in south-eastern Australia’, IREC Farmers Newsletter, No. 161, Spring 2002.
Angus, J and Lacy, J 2002b, ‘A targeted nitrogen budget lifts irrigated crop yields’, Farming Ahead, no. 129, September 2002.
Anon. 2015, ‘MIA system information’, Murrumbidgee Irrigation Limited, viewed 9 August 2017, http://www.mirrigation.com.au/Learning-Centre/Fact-Sheets.
Anon. 2017, ‘NSW Irrigators’ Council Fact Sheet – Murrumbidgee Valley’, viewed 9 August 2017, http://www.nswic.org.au/pdf/catchment_profiles/Murrumbidgee.pdf.
Australian Bureau of Statistics 2016, ‘Gross Value of Irrigated Agricultural Production, 2014–15’, viewed 9 June 2016, http://www.abs.gov.au/AUSSTATS/[email protected]/allprimarymainfeatures/A467007AF561EFFFCA257D64002815DB?opendocument.
Dunn, B, Dunn, T, Hodges, C and Dawe, C 2016, ‘Wheat – How many spring irrigations?’ IREC Farmers Newsletter, No. 194, pp 18–21.
Lacy, J and Giblin, K 2006, ‘Growing eight tonnes a hectare of irrigated wheat in southern NSW’, Primefact 197, NSW Department of Primary Industries.
McMullen, B (ed) 2000, SOILpak for vegetable growers, pp D5.1–D5.6, NSW Department of Primary Industries, viewed 9 June 2016, http://archive.dpi.nsw.gov.au/content/land-and-natural-resources/soil-management/vegetable.
Stapper, M 2006, ‘Irrigated winter cereals – variety choice and management’, Research Update for Growers-Northern Region, GRDC Code: CSP342, Agronomy Soils Environment, viewed 9 June 2016, http://www.grdc.com.au/growers/res_upd/north/n06/stapper.htm.
Further readingAnon. 2013, ‘Achievable yields for irrigated wheat’, Irrigated wheat fact sheet, Grains Research & Development Corporation.
Anon. 2014, ‘Lifting yields from 5 t/ha to 8 t/ha…or more’, Irrigated wheat in the Murrumbidgee/Murray fact sheet, Grains Research & Development Corporation.
Harris, G, Jackson, R, Payero, J and Peake, A 2013, ‘Irrigated wheat – best practice guide’ in WATERpak – a guide for irrigation management in cotton and grain farming systems, Cotton Research and Development Corporation.
Lacy, J, Milgate, A, Hutchison, A, Graham, N, Thomson, T, O’Keeffe, K, Haskins, B, Whitworth, R, Smith, J & Hoogers, R 2011, ‘Economic returns from high & low input irrigated wheat’, IREC Farmers’ Newsletter – Large Area No. 184: Autumn 2011.
Stapper, M 2004, ‘Achieving higher irrigated wheat yields, Grains Research Update for Irrigation Croppers, Grains Research & Development Corporation.
Stapper, M 2007, ‘High-Yielding Irrigated Wheat Crop Management’, Irrigated Cropping Forum Report.
Sykes, J 2012, ‘Irrigated Wheat – Best Practice Guidelines In Cotton Farming Systems’, Cotton Catchment Communities CRC and Grains Research & Development Corporation.
Varley, A, Giblin, K and Lacy, J 1999, ‘Wheat Check Recommendations or irrigation farmers of the southern Murray Darling Basin’, NSW Agriculture.

4 | NSW Department of Primary Industries
IntroductionThis manual provides an outline of the best management practice principles to consider for high-yielding irrigated wheat production in south-eastern Australia. It is an output of the ‘Southern irrigated cereal and canola varieties achieving target yields’ project (2014–17) that aimed to demonstrate an increase in irrigated cereal and canola production.
A series of research experiments were conducted to identify the optimum cereal and canola varieties and their associated agronomic management practices to maximise production in irrigated farming systems in south-eastern Australia. An overview of the project including outputs and experiment locations can be found in Appendix 1.
Organisations that have conducted research experiments for the project are NSW DPI (Murrumbidgee Valley, NSW; Murray Valley, NSW), Irrigated Cropping Council (Northern Victoria), Southern Farming Systems (Tasmania), MacKillop Farm Management Group (south-east South Australia), Central West Farming Systems (Lachlan Valley, NSW) and Ag Grow Agronomy & Research (Lachlan Valley, NSW).
Regionally relevant variety specific agronomy packages (VSAPs) containing detailed outcomes from each research location have also been produced.
The project (DAN00198) had joint investment from NSW Department of Primary Industries (NSW DPI) and the Grains Research and Development Corporation (GRDC).
Irrigated wheat production in south-eastern AustraliaIrrigated agricultural production is a key driver of many regional economies with irrigated cereal (grain) crop production alone having a gross value of $464.1 million Australia-wide in 2014–15 (Australian Bureau of Statistics 2016).
Low and unreliable water allocations and the rising cost of water now affect irrigated farming operations in most irrigation regions of south-eastern Australia. It has become increasingly important for growers to maximise water use efficiency, or produce more grain per millimetre of water. Farm management decisions are now more focused on water use, from irrigation scheduling to crop and variety selection.
Summer crops such as rice that have an absolute minimum water requirement for production have decreased in land area in favour of winter grain crops such as wheat that require less water and are considered a safer option in the current climate. Additionally, the expansion of the cotton industry in southern NSW has seen an associated increase in the area of irrigated wheat as it is an effective weed, disease and pest break crop suitable for the irrigation layouts within cotton cropping rotations. Irrigated wheat is an opportunity crop around the summer cash crops in these circumstances.
There is significant potential to further increase irrigated wheat production in south-eastern Australia with optimal varietal selection and agronomic management. Research in dryland cropping systems has proven the positive impact of varietal selection and tailoring agronomic management to specific varieties and geographical locations has on grain yield and grain quality. However, dryland varietal recommendations and variety specific agronomic packages are not necessarily valid in irrigated cropping systems thus there is a requirement for further research in irrigated farming systems.

Intro
duct
ion
IRRIGATED WHEAT IN SOUTHERN CROPPING SYSTEMS 2017 | 5
Irrigated wheat production systems have evolved over recent years with the identification of better performing varieties and development of agronomic management practices tailored to these varieties. Target yields are gradually increasing and have shifted from 8 t/ha in 2006 (Lacy & Giblin 2006) to as high as 14 t/ha in some irrigation areas of south-eastern Australia in 2016 (P Matthews 2017, pers. comm., 24 August).
Irrigated wheat yields are primarily determined by how well the crop’s requirements for growth are met and yield-reducing factors such as poor plant nutrition, pest and disease pressure (including the foliar diseases septoria tritici blotch and yellow leaf spot), and lodging (leading to high screenings, low test weight, increased weather damage risk and harvest difficulty) are minimised. Consistently achieving targeted yields in excess of 8 t/ha requires a higher level of planning and management and a commitment to higher crop inputs. For example, the nitrogen budget is determined by the target yield so a higher target yield requires a higher total nitrogen budget. Crop inputs and management that can affect grain yield, grain quality and lodging include varietal selection, plant population, sowing date, irrigation frequency, grazing management, fungicide application, plant growth regulators, nitrogen rate and timing of nitrogen application.
Experiments conducted between 2014 and 2017 as part of the ‘Southern irrigated cereal and canola varieties achieving target yields’ project confirmed that producing 10 t/ha plus of irrigated wheat is attainable under a high input management system. The experiments produced yields over 10 t/ha at multiple locations in multiple years and demonstrated a significant yield (and yield stability) advantage when varieties most suited to irrigated systems in that particular area were selected, and the crop was managed according to best management practices for that variety. However, irrigated wheat growers in south-eastern Australia commonly yield less than the potential yield and continued research is required to fine-tune variety and management recommendations to assist growers to achieve a higher target yield.
Key project outcomesKey outcomes of the irrigated wheat component of the irrigated cereal and canola project include:• Varietal selection has a highly significant effect on irrigated wheat grain yield. Select varieties
that are proven to consistently produce high yields in your area.• Nitrogen rate and time of application will affect grain yield and quality, as well as lodging.
Avoid high nitrogen levels early in the growing season to prevent excessive dry matter accumulation and lodging later in the season.
• Plant population affects crop establishment and grain yield. Irrigated wheat plant populations should generally be between 150 and 200 plants/m2 but should be adjusted to suit each location, irrigation system and target grain yield.
Key management areasPaddock selection Select paddocks with good soil structure that are not hard setting or crusting,
and have good internal drainage allowing adequate root depth.Irrigation layout Use layouts suitable for your soil type with minimal watering and drainage
periods where possible.Crop sequencing Include break crops in the rotation for weed and disease management.Soil moisture at sowing Soil moisture at sowing is essential for optimal emergence and crop stand. Pre-
irrigate or irrigate-up, if necessary, to ensure adequate soil moisture at sowing.Variety Select a variety that is proven to consistently reach your target yield in your
region.Sowing time Sow within the recommended sowing window for your region and the variety
selected (under irrigation).

6 | NSW Department of Primary Industries
Establishment Aim for a plant population of 150–200 plants/m2 for maximum grain yield.Grazing Avoid overgrazing, especially at critical growth stages.Nutrition Use soil test data and target grain yield to tailor your fertiliser program. Leaf
tissue testing in-crop is helpful for foliar trace element adjustments and assisting with N and K topdressing requirements.
Weeds, pests & diseases Control weeds, pests and diseases with break crops and pesticide application as required.
Irrigation scheduling Monitor soil moisture to accurately schedule irrigation events. Avoid moisture stress and waterlogging at critical growth stages.

IRRIGATED WHEAT IN SOUTHERN CROPPING SYSTEMS 2017 | 7
Irrigation managementJohn Smith and Brian Dunn, NSW DPI Yanco
The greatest benefit of being able to irrigate a wheat crop is that it provides the grower with a high degree of confidence that an economic return will be obtained from inputs applied. This allows growers the opportunity to increase inputs with greater assurance that higher grain yields and profits will result.
Irrigation water is one of the most limiting resources within an irrigated farm business and needs to be managed in a way that maximises return ($/ML) within the irrigation system. Water prices for the temporary trade of water in the Murray Valley have averaged $139/ML from 1998/99–2015/16 with a range of $58–$274/ML (www.murrayirrigation.com.au). This highlights how quickly water can become a significant cost to an irrigation enterprise, especially if used inefficiently.
Water productivity in irrigation farming systems, defined as tonnes of product per megalitre (ML) of irrigation water, is influenced by four areas of irrigation system management:1. Opportunity time (water on/off time) – This refers to the period of time between the soil first
being covered with water and surface drainage complete leaving any remaining surface water to infiltrate into the soil.
2. Irrigation layouts/systems – Different layouts and irrigation systems are suited to different soil types and influence crops grown and yield potential. They may also influence decisions around water priorities, particularly in seasons with limited water availability.
3. Irrigation management – This depends on irrigation layout and the water budget in each season. More efficient layouts offer the opportunity for higher yield potential and better response to more irrigations allowing fully scheduled irrigated production. Limited water may dictate partial spring irrigation or pre-watering of crops and when combined with better layouts the return from the available water is maximised.
4. Irrigation scheduling – Soil and plant-based tools that enable better matching of soil water availability to plant requirements are useful for management of irrigation timing in fully irrigated crops which can increase water productivity.
Opportunity timeThe most important factor in the success of most irrigated crops is the length of time from when water is first applied to the soil surface to when soil surface drainage is complete. If this period is too long there is limited opportunity for remaining surface water to infiltrate into the soil and waterlogging will often occur with subsequent negative impacts on plant growth.
If the opportunity time is too short, then the amount of water applied to the bay within the flooded irrigation system will be inadequate which may lead to patchy water infiltration within the bay leading to variable crop growth and reduced potential. In addition to the low and variable coverage of the crop, further water events will need to be scheduled within the growing season to ensure that crops are not water stressed within the fully irrigated cropping system. Getting the balance between minimising opportunity time and refilling the soil profile with sufficient plant available water is becoming more important in automated systems on lighter soil types.
The maximum opportunity time depends on soil type and irrigation layout and is important because it influences the period of waterlogging following each irrigation event. Waterlogging

8 | NSW Department of Primary Industries
has a cumulative effect on plant production and each event further impacts growth and development of the crop.
Maximum opportunity time targets are:• Overhead irrigation – system uniformity is much more important than opportunity time in
overhead irrigation as water application is over a very short period of time (less than one hour)
• Border check – 6 hours (Agriculture Victoria)• Rice layouts (poorly-structured soils) – 10 hours, including sodic soils (with soil management
practices to improve their physical fertility)• Rice layouts (well-structured soils) – 18 hours for better draining non-swelling soils (red-
brown earths).
Opportunity times greater than those listed can significantly reduce water productivity. Research conducted by NSW DPI in the Murrumbidgee Valley has shown that extending the opportunity time from 6 to 48 hours on soil with good drainage resulted in a 25% reduction in water productivity in irrigated wheat (Dunn et al. 2016) (Figure 1). Generally, waterlogging conditions that reduce crop biomass will reduce grain yield.
A key aspect of reducing opportunity time is improving drainage and reducing the recession time of water. Often, supply rates are adequate but excessive drainage times from the field are the problem.
Irrigation layouts/systemsThe choice of irrigation layout or system will depend on several factors including soil type and structure, topography, other crops in the rotation and economic constraints of capital improvement. Good irrigation layouts that allow fast irrigation and most importantly lower drainage times will result in higher water productivity, grain yields and profitability.
Irrigation layouts and systems should ideally be matched to the specific soil types (Table 1). If they are not matched to soil types, water productivity may be compromised requiring greater emphasis on irrigation management to minimise the risk of waterlogging.
Table 1 Irrigation systems and the range of soil types that they are most suited to.
Irrigation system Soil type
Overhead irrigation Red-brown earthsSandhill soilsAll Tasmanian cropping soils
Border check Red-brown earthsTransitional red-brown earthsSelf-mulching and non-self-mulching clays
Raised beds Self-mulching claysRed-brown earthsTransitional red-brown earths
Rice layouts Non-self-mulching claysRed-brown earthsNon-sodic transitional red-brown earths
Overhead irrigationOverhead irrigation systems are best suited to lighter soil types with high infiltration rates or undulating topography where the cost of landforming is extremely high. Soils that disperse are generally not suited to spray irrigation systems. Overhead irrigation systems allow for high water productivity and often lower crop water use compared to flood irrigation systems, and also have less risk of waterlogging occurring. The flexibility of water management that

Irrig
atio
n
IRRIGATED WHEAT IN SOUTHERN CROPPING SYSTEMS 2017 | 9
overhead irrigation offers also means that they allow the application of light irrigations enabling the establishment of crops on time and irrigation during dry winters when surface irrigation is too risky. The biggest disadvantage of overhead irrigation is the high cost of initial capital investment, operation and maintenance.
Border checkBorder check is a common layout often used for irrigated wheat as it suits a large range of soil types. The entire soil surface is flooded which can increase the risk of waterlogging, particularly if the slope and length of runs do not match the soil type. It is important that the field can be irrigated and all surface water drained within 6 hours, or less on very heavy soils, to reduce waterlogging risk.
Border check can be utilised over a range of slopes but as the slopes become flatter the length of runs will need to be shorter so the irrigation flood and drain time of less than 6 hours can still be achieved.
Figure 1 Growers inspecting the irrigation scheduling experiments at Yanco, 2015.
Raised bedsRaised beds allow for improved drainage and significantly reduce the risk of waterlogging and surface crusting as the entire soil surface is not covered with water. Raised beds are suitable for most soil types, except for light textured soils as the water subs up from the furrows into the beds due to capillary action which is most successful on heavier clay soils.
Raised beds allow the opportunity for double cropping winter and summer crops and, when established in a bankless channel layout, provide opportunity for changing crop types. Raised beds are not suited to sodic soils as soils with high sodium levels swell when wet and disperse with the addition of water causing structural collapse (McMullen 2000).
Rice layoutsRice irrigation layouts are usually landformed and laser levelled with rectangular bays and drainage recycle systems. Rice layouts have adequate slopes and suitable sized irrigation structures that allow good supply of water. Drainage is often the main problem in these layouts due to the slopes causing back-up of water in preceding bays. Opportunity times as long as 40–50 hours have been identified, resulting in waterlogging periods of 100–150 hours (4–6 days). Improved design of existing layouts and alternative layouts such as bankless channels and V bays are enabling better drainage with opportunity times of 10 hours, thus allowing irrigated wheat to be successfully grown in rice layouts.
10 | NSW Department of Primary Industries
Irrigation managementPre-irrigationPaddocks where wheat is to be grown are sometimes pre-irrigated in early autumn to provide subsoil moisture for the wheat crop during winter. This practice is dependent on subsoil moisture levels, late summer rainfall and irrigation water availability.
The timing of pre-irrigation is dependent on geographical region and soil type. In the Murrumbidgee Valley, pre-irrigation is undertaken in late March/early April allowing the topsoil to dry and timely sowing to occur, and also act as a buffer against waterlogging in wet winters. Improved layouts, minimum tillage (providing firm ground conditions) and shorter season wheat varieties have resulted in pre-irrigation often being carried out later into autumn. Heavier clay soils with poor layouts need to be irrigated earlier than fields with light soils and good layouts due to the higher water holding capacity and slower drying time.
How many spring irrigations?Spring irrigation of a wheat crop is one of the major factors influencing grain yield. The decision of when and how often to irrigate is complex and depends on several factors including available soil moisture, rainfall, time of irrigation water availability in relation to plant development, potential yield benefit, risk of waterlogging or lodging, and returns from using the water on another crop or selling it.
Regardless of how many irrigations you intend to apply to your wheat crop during the growing season the most important factor to consider is that adequate moisture is available during the head emergence stage. Head emergence is the most sensitive growth stage to moisture stress in a wheat crop.
If you are planning to limit the number of spring irrigations applied to a wheat crop it is important to find a balance between irrigating before significant moisture stress to the wheat plants occurs while also ensuring adequate moisture is available during head emergence.
If only one irrigation is going to be applied to the crop the best timing for this is around early to mid-stem elongation. The crop will still have time to increase biomass with some moisture remaining for the critical flowering and early grain fill stages. Any late season rainfall will also then be more beneficial.
If two irrigations are possible, the first irrigation should be applied at early stem elongation with the second applied between flag leaf emergence and flowering.
Timing of the first irrigation is very important to maximise water productivity and speed at which the water can be applied. If the first irrigation is not applied until the soil profile is very dry it will take much longer and use considerably more water for the irrigation, both of which are not desirable. One irrigation applied once the soil has dried to depth can use almost as much water as two irrigations applied at the correct times.
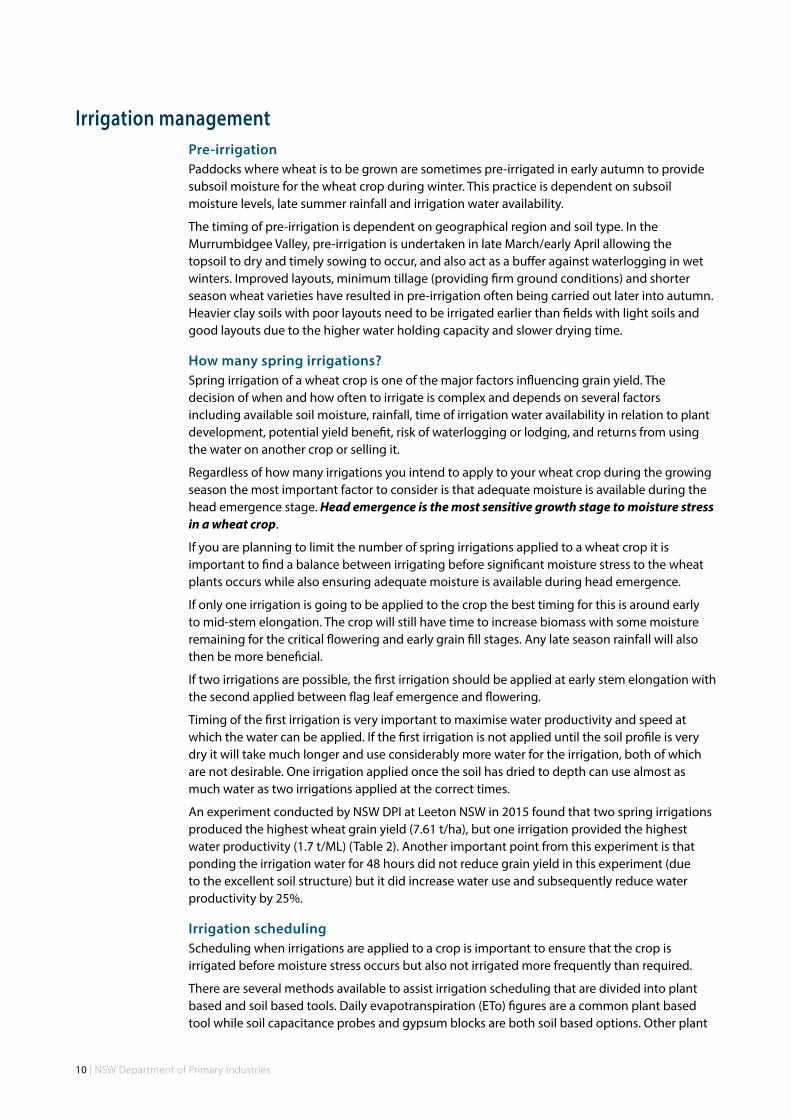
An experiment conducted by NSW DPI at Leeton NSW in 2015 found that two spring irrigations produced the highest wheat grain yield (7.61 t/ha), but one irrigation provided the highest water productivity (1.7 t/ML) (Table 2). Another important point from this experiment is that ponding the irrigation water for 48 hours did not reduce grain yield in this experiment (due to the excellent soil structure) but it did increase water use and subsequently reduce water productivity by 25%.
Irrigation schedulingScheduling when irrigations are applied to a crop is important to ensure that the crop is irrigated before moisture stress occurs but also not irrigated more frequently than required.
There are several methods available to assist irrigation scheduling that are divided into plant based and soil based tools. Daily evapotranspiration (ETo) figures are a common plant based tool while soil capacitance probes and gypsum blocks are both soil based options. Other plant
Irrig
atio
n
IRRIGATED WHEAT IN SOUTHERN CROPPING SYSTEMS 2017 | 11
indices are being developed using plant based methods that will increase the ease of irrigation scheduling and offer the advantage of identifying in-field variability throughout the season.
Table 2 Grain yield (t/ha), water use (ML/ha, irrigation + rainfall) and water productivity (t/ML) of wheat on a self-mulching clay soil following various irrigation frequencies at Leeton NSW, 2015.
Irrigation frequency Grain yield (t/ha) Water use (ML/ha) Water productivity (t/ML)
No irrigation 5.1 3.1 1.6One irrigation 7.2 4.1 1.7Two irrigations 7.9 4.9 1.6Two irrigations waterlogged 7.6 6.1 1.3l.s.d. (P = 0.05) 0.4 0.2 0.1
Evapotranspiration (ETo) is the combined process of evaporation from soil and plant surfaces and transpiration through the plant. Estimates of daily evapotranspiration measurements are very useful for the irrigation management of crops. The factors that affect evapotranspiration rate include solar radiation, air temperature, atmospheric moisture levels, wind and soil moisture. There are many meteorological websites that provide irrigators with daily evapotranspiration figures for their location.
The use of ETo requires growers to access weather data from the internet and keep records for each of their fields. A crop coefficient that depends on the growth stage of the crop is also required. Once familiar with using this method and the plant available water for each soil it is easy to use and also valuable for predicting when future irrigations will be required.
Soil capacitance probes consist of two metal electrodes mounted on a circuit board with a small space between them with the soil acting as the dielectric in between. A measure of soil moisture occurs when the capacitance changes within the circuit.
Gypsum blocks measure soil water tension which is a measure of the force which the plant must overcome to use the water in the soil profile.
There are several providers of services to install and monitor soil capacitance and gypsum blocks as well as an increasing number of data logging methods allowing the soil moisture data to be accessed in the field or in real-time from the internet. It is important that this equipment is installed in locations that are representative of the majority of the field or the results may be misleading.
Regardless of method used, it is important to monitor crop water use in order to avoid crop moisture stress. Do not allow soil water to deplete below 50% of plant available water capacity (PAWC) referred to as readily available water (RAW). The point of timely irrigation is commonly known as the ‘refill point’. Plant growth and yield potential will decline considerably if soils are allowed to dry down beyond the point of RAW, which is particularly important in crops fully irrigated for maximum yield potential. Readily available water will vary across soil types (Table 3).
Table 3 Estimate of readily available water (0–60 cm) for a range of soil types.
Soil texture Readily available water (mm) (0–60 cm)
Sand 24Sandy loam 42Loam 54Sandy clay loam 49Clay loam 48Light clay 42Medium to heavy clay 39

12 | NSW Department of Primary Industries
Varietal selectionPeter Matthews, NSW DPI Orange
Variety selection is a key factor for producing a high-yielding irrigated wheat crop and sets the production base for maximising the return on investment for irrigation water.
Wheat variety development in Australia has primarily been targeted at dryland production, with variety suitability for irrigated production a secondary consideration. Over the past 10 years there has been increased interest in irrigated wheat variety evaluation. Studies have been undertaken in the key regions of south-eastern Australia including the Lachlan Valley, Murrumbidgee Valley, Murray Valley, northern Victoria, south-western Victoria, south-east South Australia and in Tasmania (Figure 2).
Varieties that perform well under irrigation have:• high yield potential with a maturity that suits the local environment• high tolerance to crop lodging• good disease tolerance/rating• crop maturity that matches water availability and application timing.
Other considerations include crop tillering ability, variety end use, waterlogging tolerance, coleoptile length and herbicide tolerance.
Figure 2 Irrigated early-season National Variety Trial (NVT) wheat experiment at the late grain filling stage at Yenda in 2014. The average site grain yield was 8 t/ha.
IRRIGATED WHEAT IN SOUTHERN CROPPING SYSTEMS 2017 | 13
Varie
ties
High-yielding varieties that suit local growing conditionsThere is limited ongoing variety evaluation under irrigation in south-eastern Australia, with the bulk of variety evaluation conducted under dryland conditions through the National Variety Trials (NVT) program. Currently, there are four irrigated NVT wheat sites: Numurkah, Victoria; Mayrung, Murray Valley, NSW; Griffith and Yenda, Murrumbidgee Valley, NSW; and the northern midlands of Tasmania. Results from the NVT program for specific sites can be found at www.nvtonline.com.au.
More recently, some variety evaluation has been undertaken in the ‘Southern irrigated cereal and canola varieties achieving target yields’ project which provided variety responses to irrigation and varying agronomic treatments.
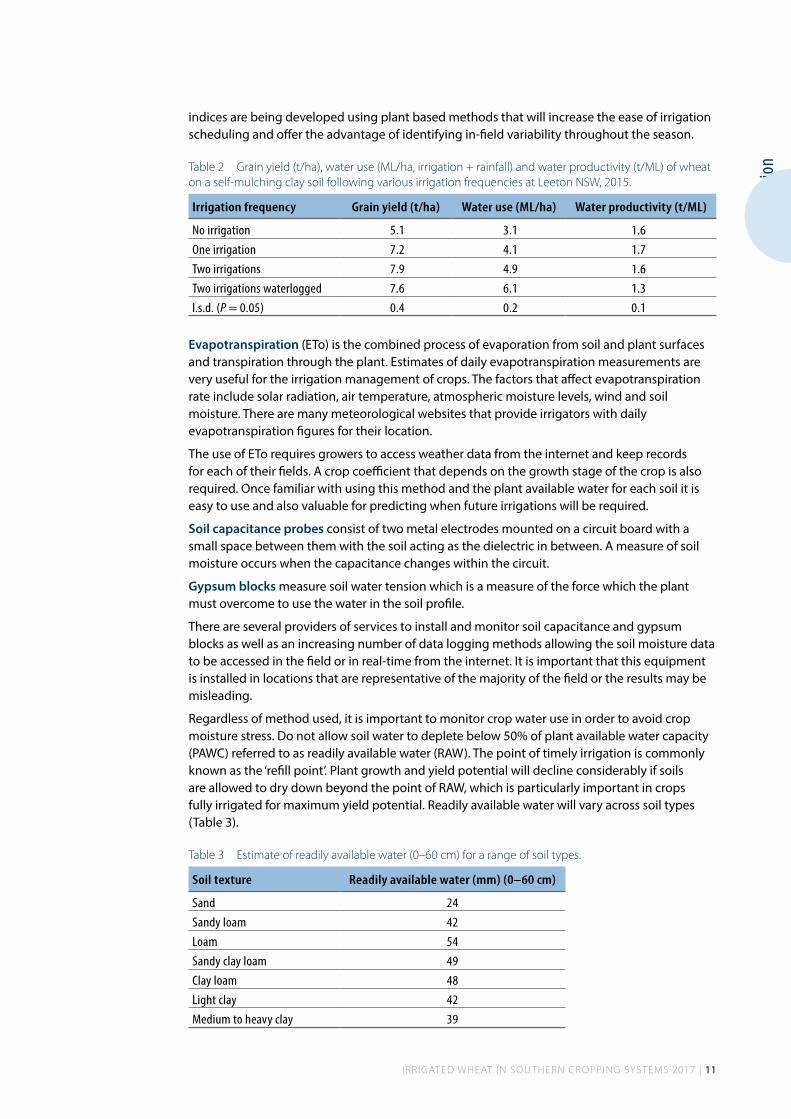
Growers should look at irrigated variety evaluation experiment data or at sites in the local region where seasonal conditions have been favourable and water was not a limiting factor. Table 4 shows the change in varietal ranking for wheat varieties tested in Coleambally under both irrigated and rainfed conditions in 2009, highlighting the importance of using irrigated experiment performance in preference to dryland performance. Growers should be cautious with using data from outside the local region, as growing conditions could differ and a variety that performs well in one location might not be as adapted to another location.
Table 4 Wheat variety evaluation experiments in 2009 ranking commercial varieties for grain yield in a fully irrigated experiment versus a rainfed experiment at Coleambally, NSW. Site variety correlation between experiments was 0.548.
Variety Irrigated Rainfed
Grain yield (t/ha) Experiment rank Grain yield (t/ha) Experiment rank
YendaA 9.29 24 4.70 908
CharaA 8.66 81 5.50 79
BolacA 8.47 122 5.08 576
EGA BountyA 8.44 129 4.74 878
MerindaA 8.41 138 5.38 187
EGA WedgetailA 8.25 188 4.81 838
Sentinel 3RA 8.17 218 5.45 125
Rosella 8.14 228 4.65 926
MaceA 8.08 249 5.77 4
Janz 7.95 300 5.47 104Diamondbird 7.87 335 5.28 302Ellison 7.86 339 5.04 622Drysdale 7.84 346 5.31 261
CrusaderA 7.83 350 5.18 451
H45 7.76 386 5.33 243
VenturaA 7.66 432 5.47 101
GladiusA 7.66 433 5.44 136
AxeA 7.51 499 5.59 36
Lincoln 7.45 521 5.42 157
EGA EaglehawkA 7.42 536 4.61 933
WaaganA 7.40 544 5.51 72
EspadaA 7.39 552 5.44 138
EGA GregoryA 6.94 711 5.03 634
SunvaleA 6.32 870 4.82 831

14 | NSW Department of Primary Industries
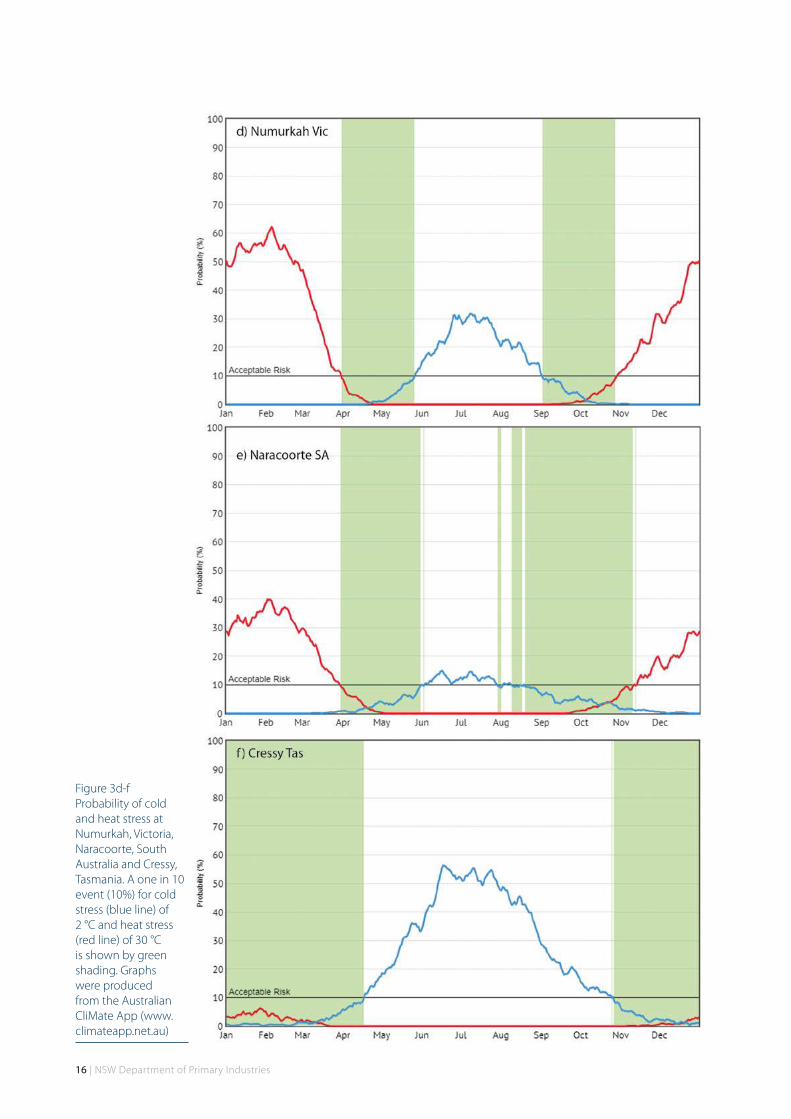
Irrigating a wheat crop does not change the primary drivers of plant growth in a specific region – temperature and daylight hours (solar radiation) – it only removes water stress at key growth and development stages. Frost at flowering, heat stress through grain fill and solar radiation through the season all affect grain yield. Producing a high-yielding irrigated crop combines variety maturity and a suitable sowing date to reduce the risk of frost damage at flowering but allows the grain to develop when solar radiation is at its peak, under mild, but sunny, spring and early summer conditions.
Figure 3a-f shows the key periods where frost and heat stress occur, based on historical weather data generated from the Australian CliMate App. The CliMate App can be found and downloaded from www.climateapp.net.au. The optimal period for flowering and grain fill for central NSW is quite different from the northern midlands of Tasmania meaning different varieties are suited to these contrasting regions.
Tolerance to crop lodgingCrop lodging is a major risk when targeting high yields under irrigation and has caused up to 80% yield loss in commercial crops in some seasons. This is due to the effects of lodging on the plant’s ability to efficiently use resources such as light and the physical inability of commercial headers to pick up the lodged crop. In addition to direct yield loss, lodging also increases screenings, lowers grain test weight, increases the risk of weather damage and slows harvest.
Crop lodging is a result of two factors: poor plant anchorage and weak stem strength. These factors are influenced by variety, environmental conditions and in-crop management, especially irrigation.
The effects of irrigation management, plant spacing, nitrogen management and plant growth regulators (PGR) are discussed in the relevant chapters – each can be manipulated to reduce the risk of crop lodging.
There are genetic differences in a variety’s ability to develop secondary roots that affect the plant’s physical anchorage to the soil, and stem strength which prevents the stem from collapsing and being bent at a weak point. Plant height is also important; the longer the stem the more strain it places on the lower stem and root system under high head weights and windy conditions.
Wheat variety ratings for lodging are available in most state variety sowing guides and are based on the variety’s accumulative ability to withstand lodging by improved plant anchorage and stem strength (Figure 4). There is an environment by variety interaction on plant lodging so use ratings from local experiments where possible. Table 5 shows the current rating from the NSW DPI Winter crop variety sowing guide 2017 of selected varieties. Local experience is also important.

IRRIGATED WHEAT IN SOUTHERN CROPPING SYSTEMS 2017 | 15
Varie
ties
Figure 3a-c Probability of cold and heat stress at Forbes, Griffith and Finley NSW. A one in 10 event (10%) for cold stress (blue line) of 2 °C and heat stress (red line) of 30 °C is shown by green shading. Graphs were produced from the Australian CliMate App (www.climateapp.net.au)
16 | NSW Department of Primary Industries
Figure 3d-f Probability of cold and heat stress at Numurkah, Victoria, Naracoorte, South Australia and Cressy, Tasmania. A one in 10 event (10%) for cold stress (blue line) of 2 °C and heat stress (red line) of 30 °C is shown by green shading. Graphs were produced from the Australian CliMate App (www.climateapp.net.au)

IRRIGATED WHEAT IN SOUTHERN CROPPING SYSTEMS 2017 | 17
Varie
ties
Figure 4 Wheat lodging at early grain fill in the 2014 NVT experiment at Mayrung comparing a moderately susceptible variety (left) and a moderately resistant variety (right). Average site grain yield was 7.5 t/ha.
Table 5 Lodging resistance rating for wheat varieties in NSW, 2017.
Wheat variety Lodging rating Wheat variety Lodging rating
BeckomA MR–MS LongReach LancerA MR
BolacA MR LivingstonA MR–MS
CharaA MR MaceA MR–MS
CobraA R–MR MerindaA MR
CondoA MR–MS LongReach MerlinA MS
CoolahA MR–MS MitchA MR–MSP
CorackA MR ReliantA MS
CrusaderA MR ScepterA MR
CutlassA MR–MS LongReach ScoutA MS
LongReach DartA R–MR Sentinel 3RA MR
EGA GregoryA MS ShieldA MR
EGA WedgetailA MR LongReach SpitfireA MR–MS
Elmore CL PLUSA MR–MS SunlambA MR–MS
Emu RockA MR SunmateA MRP
EstocA MR SunmaxA MR–MS
LongReach FlankerA MS SuntimeA MR–MS
ForrestA MR–MS SuntopA MR–MS
GauntletA MR–MS SunvaleA S–VS
Grenade CL PLUSA MR–MS LongReach TrojanA MR–MSP
Janz MS WallupA MR
KioraA MR WhistlerA R
KittyhawkA MR Wylah MS–SResistance ratings: R – resistant, MR – moderately resistant, MS – moderately susceptible, S – susceptible,VS – very susceptible, P – provisional rating.

18 | NSW Department of Primary Industries
Water availability and application timingWater availability and supply timing in irrigation systems vary and are subject to local regulations and seasonal supply. Matching available water resources with variety maturity will maximise water use efficiency (WUE). In regions where the primary water source in early spring is supplementary irrigation, shorter season varieties are better suited in limited irrigation situations. However, if in-crop rainfall is the main water source up until early grain fill, long or main season varieties can be grown and finished with irrigation.
The first irrigation of the season in late winter–early spring is important in maintaining yield potential when targeting yields of greater than 7–8 t/ha. The crop should not be moisture-stressed during stem elongation as it coincides with the start of the reproductive phase where ear size and grain number is set. If high yields are to be obtained, then variety maturity needs to be matched to when irrigation water becomes available in the irrigation system or water stored on farm.
In Tasmania, early irrigation is important for early sown (February/March) winter wheats to ensure even establishment and fast dry matter production which will maximise grazing potential and gross margin returns from a wheat crop.
Disease resistanceSelecting a wheat variety with the best available resistance to diseases is more critical in irrigated wheat production than in dryland production. Irrigated crops tend to be more conducive to disease development, with larger, bulkier and wetter canopies due to irrigation and a higher disease carry-over pressure from tighter crop rotations used in many irrigation areas.
Yield losses from disease of only 3–5% in dryland crops become economically significant at 6–14 t/ha yield potential. These losses are due to loss of green leaf area or restricted water and nutrient movement in the plant. Research on irrigated wheat has shown that green leaf retention later in the crop cycle is an important factor in achieving high yields.
Variety resistance levels for the major diseases can be found in annual state cropping guides. Whilst many of the familiar foliar diseases such as stripe rust can be managed by foliar fungicides, other diseases such as crown rot or necrotrophic diseases such as yellow leaf spot require a more strategic and systematic approach to control. The chapter on disease management outlines the major diseases that affect wheat in south-eastern Australia and current management strategies.
Variety tillering abilityTillering ability is an important factor in canopy management to achieve the desired head density for the target yield. Wheat varieties vary widely in their ability to tiller, with tiller expression influenced by sowing date and soil fertility. For example, LongReach DartA and H45 are known for their lower tillering ability compared with varieties such as SunvaleA and winter wheats such as EGA WedgetailA that have a higher tillering ability. Ideal head numbers will vary depending on the target yield.
Research conducted by CSIRO in 2000 found that at Griffith, NSW, the ideal head number was 500–600 heads/m2, which needed a crop with 600–800 tillers/m2 at stem elongation to consistently allow the crop to reach maximum yield potential in the seasons studied.
Too many tillers are just as much of a problem as too few tillers. Crops that produce more tillers than necessary waste resources early in the season by growing excessive crop biomass. Larger canopies also have an increased risk of foliar diseases and crop lodging.

IRRIGATED WHEAT IN SOUTHERN CROPPING SYSTEMS 2017 | 19
Varie
ties
Variety end useWheat type and quality classification need to be considered when choosing a variety for irrigation. Depending on what marketing arrangements are available, growing a variety with a higher delivery grade may improve gross returns over having a higher-yielding, lower-quality variety. With the flexibility of crop management in irrigated systems there are opportunities to produce a number of specialist wheat products such as soft or durum wheat, where managing both crop nutrition and water enable crops to consistently achieve grain quality specifications.
Waterlogging toleranceOne of the limitations in irrigated wheat production is short-term waterlogging, particularly in border check or rice layouts. This short-term waterlogging affects plant growth, which can also affect final grain yield. The length of the waterlogging period, plant growth stage and levels of soil chemical components such as iron and manganese interact to reduce plant growth. The irrigation management chapter discusses the risks of the various irrigation layouts and ways to reduce waterlogging.
There are varietal differences in wheat to waterlogging tolerance, with screening in Western Australia in 2002–2004 showing a difference of up to 26% in grain yield of varieties under moderate waterlogging conditions. There is very limited information on how newer varieties tolerate waterlogging, with much of this from observed visual differences in irrigated breeding company experiments rather than formal screening. Growers should take the opportunity to inspect irrigated variety experiments where possible and keep records of experiences where more than one variety is grown on-farm.
Coleoptile lengthWheat varieties differ in their coleoptile length, with current variety screening showing up to a 3.8 cm difference in commercial varieties (Figure 5). Under good sowing conditions, this may not be a factor; however, if growers are considering to either water up sown crops, sow deeper into conserved moisture or increase seeding depth to improve crop lodging tolerance, this can affect even crop establishment.
Figure 5 A wheat seedling showing the coleoptile and emerging leaf.
Many of the heavier clay soils can slump once wetted and seed may sink deeper than originally sown from seed settling or collapse of furrow shoulders. Having a longer coleoptile length variety can also help quicker emergence from the cold, wet soils common in watered up crops through winter. Table 6 show results from the latest varietal screening for coleoptile length. Updated information can be found in respective winter crop sowing guides. The chapter on crop establishment outlines the importance of even plant establishment and the benefit of achieving the target plant population.

20 | NSW Department of Primary Industries
Table 6 Predicted mean coleoptile length (cm) of selected main season varieties from 55 NVT sites from 2008–2015.
Variety Predicted mean coleoptile length (cm)
Variety Predicted mean coleoptile length (cm)
AxeA 6.0 Justica CL PLUSA 6.7
B53A 6.4 Kord CL PLUSA 6.7
BarhamA 6.8 LivingstonA 6.6
BeckomA 6.4 MaceA 6.9
CharaA 6.3 MerindaA 6.5
Clearfield JanzA 6.4 LongReach MerlinA 7.2
LongReach CobraA 6.6 QAL2000A 7.2
CondoA 6.5 QALBisA 6.7
CorackA 6.8 Reliant 6.6
Correll 7.7 ScepterA 6.6
LongReach CrusaderA 6.7 LongReach ScoutA 7.3
LongReach DartA 7.2 Shield 6.6
DS DarwinA 5.6 SpitfireA 7.1
EGA GregoryA 6.4 SunmateA 7.1
Elmore CL PLUSA 7.1 SuntopA 7.1
Emu RockA 6.5 SunvaleA 7.0
Grenade CL PLUSA 6.6 TenfourA 6.6
LongReach ImpalaA 5.7 VenturaA 6.6
Janz 7.0 WallupA 6.3
Check varieties
FederationA (long) 9.8
WhistlerA (short) 5.9
Herbicide toleranceTight rotations in most irrigated farming systems mean that irrigated wheat is commonly double cropped after summer crops. The options for weed control in some summer crops is limited with imidazolinone herbicides frequently used to control weeds in broadleaf crops. Given the tight timelines between crops, there is a potential risk for herbicides not to be broken down before sowing wheat. To minimise the risk of crop damage where plant-back conditions have not been reached, wheat varieties that have tolerance to the imidazolinone group of herbicides need to be considered.
Imidazolinone-tolerant wheat varieties can be used to manage certain weed spectrums in-crop, where there are limited herbicide options available.
IRRIGATED WHEAT IN SOUTHERN CROPPING SYSTEMS 2017 | 21
Crop establishmentEric Koetz, NSW DPI Wagga Wagga
Achieving high wheat grain yields under irrigation is dependent on a number of important agronomic and physiological factors. Paddocks with low weed and disease pressure, and good nutrition status are essential for optimum crop establishment and can be identified using paddock history, especially the presence of break crops. Modern seeding equipment has reduced the need for multiple tillage operations for seedbed preparation and adoption of stubble retention has resulted in a shift towards wider row spacing and direct drilling. Improvements to disc openers and direct drill bars with press wheels provide good seed to soil contact which is important for fast, uniform establishment.
Irrigation schedulingIrrigation scheduling can impact on crop establishment as wheat requires good soil moisture for germination and moist conditions after emergence for uniform crop establishment. Pre-watering in autumn can provide the benefit of early seeding opportunities. Other options are to delay sowing until there has been sufficient rainfall for good seedbed moisture, or sow dry and water up. Depending on irrigation method, sowing dry and watering up is the least desirable option as emergence can be staggered and root development impeded. See Irrigation management chapter for more information on irrigation scheduling.
Sowing timeA significant key to achieving high irrigated wheat yields is the three T’s – timing, timing and timing. The crop sowing date must fall in the recommended sowing window for the variety selected so the desired flowering window is achieved. Sowing early in the recommended sowing window for a particular variety provides the variety with the best opportunity to flower at the optimum time.
There is a range of wheat variety maturity groups that growers can select from including long season winter wheats, main season spring wheats and short season spring wheats. Long season winter wheats can be sown in February/March through to April, main season spring wheats can be sown from late April–June, whilst short season spring wheats have a sowing window from May to September, depending on location. Refer to the respective state variety sowing guides for the optimum sowing windows for your regions.
Sowing earlier than the recommended sowing window increases the likelihood of frost events during flowering that can result in significant yield reductions. If varieties are sown after their recommended sowing window the crop flowers late in the season exposing the plants to heat and moisture stress during the grain filling period which can result in grain yield losses of up to 100–150 kg/ha/day (Stapper 2006). Every 1 °C increase in temperature above 14 °C during grain fill can result in a 5% decrease in grain yield (Stapper 2006). See the Varietal selection chapter for more information on how to select wheat varieties for irrigated farming systems in your region.
Sowing depthSowing depth is important in irrigated cropping systems to ensure plants develop sufficient anchorage to minimise the effects of lodging in high yielding conditions. Shallow sowing reduces the capacity of the wheat plants to develop adequate secondary root structures and

22 | NSW Department of Primary Industries
anchor points to reduce lodging later in the season. Selecting varieties with long coleoptile length and good early vigor will help develop stem strength as tillering and early biomass are reduced delaying canopy closure and helping to promote stronger stems.
Planting nutritionSoil testing to obtain nitrogen (N) and phosphorus (P) levels is an important tool in developing a nutrition package. Soil nitrogen management is important in irrigated systems, especially when targeting very high yields. The accepted ‘rule of thumb’ is wheat requires 40 kg N/ha per tonne of grain produced. Total N available at sowing (starting soil N and fertiliser) should be 100–120 kg N/ha. Too much early nitrogen available to the wheat crop leads to excess biomass and increased risk of lodging. Stapper (2006) and Angus and Lacy (2002a; 2002b) suggest that the best strategy to achieve high irrigated wheat yields is one or two topdressing events after GS31 (Figure 6). The recommendation is for 30% of the crops N requirement to be available at sowing and the remaining 70% for the targeted yield to be topdressed.
Phosphorus is also important for early plant development, especially root growth. As a rule of thumb, wheat requires 4 kg P/ha per tonne of target grain yield produced. The most common products for the supply of phosphorus at sowing are MAP (22% P) and DAP (18% P). Refer to the Crop nutrition chapter for more information on developing a nutrition management strategy.
Figure 6 Topdressing nitrogen in the irrigated wheat experiment at Finley, 2015.
Plant populationThe optimum plant population for irrigated wheat is 150–200 plants/m2. This equates to sowing rates of 90–110 kg/ha (depending on the grain weight). In experiments conducted by NSW DPI in the Murray Valley in the 2000s, grain yields increased as sowing rate increased (Table 7). However, lower sowing rates with plants more evenly spaced have been shown to be more tolerant of lodging (Figure 7).
Table 7 Irrigated wheat grain yield (t/ha) response to plant population in the Murray Valley, 2007–2010.
Target plant population (plants/m2)
Wheat grain yield (t/ha)
2007 2008 2009 2010
150 3.79a 2.56a 3.80a
250 3.99b 2.69b 4.27b
140 3.95a
210 4.74b
280 5.09c
Numbers in the same column sharing a common letter are not significantly different at l.s.d. (P = 0.05). Source: VSAP project database, NSW DPI Wagga Wagga.

Esta
blish
men
t
IRRIGATED WHEAT IN SOUTHERN CROPPING SYSTEMS 2017 | 23
To calculate the sowing rate required for the target plant population a simple equation can be used.
sowing rate = (kg/ha) germination % × establishment %
target plant population (per m2) × thousand grain weight (g) × 100
Example:
sowing rate = 95% × 80%
180 × 40 × 100
= 94.7 kg/ha
Target plant population = 180 plants/m2
Thousand grain weight = 40 gGermination = 95%Establishment = 80%
Figure 7 Wheat experiments lodging, Finley 2015 (Image source: Eric Koetz, NSW DPI).
Row spacingRow spacing is an important consideration, not only for grain yield but also lodging. Wider row spacings allow more light into the canopy up to GS32 allowing for thicker stems and stronger anchorage of the crowns (Stapper 2006). However, at the widest row spacing (36 cm) grain yield was lower than the medium (24 cm) and narrow (18 cm) row spacings in irrigated wheat experiments conducted by NSW DPI at Deniliquin in 2009–11. There was no significant difference in grain yield between the 18 cm and 24 cm row spacings. Many growers are moving to wider rows to be able to handle the high stubble loads. Selecting the most suitable row spacing for the target plant population will produce the highest yield.
Plant growth regulatorsPlant growth regulators (PGRs) can reduce the risk of lodging by reducing plant height and overall crop canopy and are used overseas (New Zealand and Europe), and in some parts of Australia, to manage lodging in cereals with high yield potential. Research in Australia is

24 | NSW Department of Primary Industries
minimal and has produced inconsistent results (Stapper 2006) with experimental results from South Australia showing no yield response from the application of PGRs in 2012 and 2013.
Despite this, crops with high yield potential in the southern regions regularly receive a PGR application. All crops grown in Tasmania with a yield target of 10 t/ha or greater receive a full growth regulator program.
Moddus® Evo (250 g/L trinexapac-ethyl) is registered as a yield and quality enhancer in wheat (and barley and oats). It is applied at the beginning of stem elongation (GS30–32) to reduce excessive crop biomass and lodging and enhance general crop development. Chlormequat is another growth regulator registered in wheat in Australia and is used alone and in conjunction with trinexapac-ethyl for high yield potential wheat at GS31.

IRRIGATED WHEAT IN SOUTHERN CROPPING SYSTEMS 2017 | 25
Crop nutritionTony Napier, NSW DPI Yanco
High yielding irrigated wheat production requires effective nitrogen (N) management. Nitrogen levels in excess of the crop’s requirements create large plant biomass and increases the risk of lodging and plant diseases which can result in lower grain yields. Insufficient nitrogen will result in lower plant biomass and grain yield compared to a crop with adequate nutrition. Available nitrogen levels will also affect the number of heads produced, the number of grains per head, grain size and grain protein content.
Application of nitrogenous fertiliser must be managed according to the target yield to produce a high yielding crop with a grain protein concentration that meets receival standards for each variety. To produce a wheat crop that yields 8 t/ha plus the crop will require adequate tillers and a large grain size. A crop with 500 heads/m2 and an average of 36 grains/head and a grain size of 45 g/1000 grains will achieve a yield of 8 t/ha.
Production of wheat crops in excess of 8 t/ha requires split applications of nitrogenous fertiliser over the growing season at three main application times. The first application is usually at sowing, the second (or first topdressing) at tillering to stem elongation and the third (or second topdressing) at flag leaf to booting (Figure 8). The application of three smaller amounts of nitrogen allows for better matching of crop N demands and applied N.
Figure 8 Topdressing NSW DPI’s irrigated wheat experiments at Leeton.
Dry matter production from sowing until the end of tiller development (during the winter months) is relatively slow and thus nitrogen requirement is minimal. Application of large amounts of nitrogen (in excess of the plant’s requirement) during this period will promote excess vegetative growth resulting in the crop developing a large canopy. As a result, the crop will have increased risk of foliar disease and lodging.
During stem elongation, the wheat plant undergoes a period of rapid vegetative growth in order to build the main structure of the plant both above and below the ground. Nitrogen uptake during this period can be as high as 3 kg N/ha/day (Angus 2001) (Figure 9). During this growth phase available nitrogen levels must meet the crop’s requirement to ensure that plant growth and leaf area are produced to maximise grain yield. The first nitrogen topdressing is generally applied at the beginning of stem elongation (Figure 10). If nitrogen levels are not sufficient during stem elongation, tillers will start to die off and as a result grain yield will be reduced.

26 | NSW Department of Primary Industries
0.0 0.5 1.0 1.5 2.0 2.5 3.0 3.5
Late May
Early June
Mid June
Late June
Early July
Mid July
Late July
Early August
Mid August
Late August
Early September
Mid September
Late September
Early October
Mid October
Late October
Early November
Mid November
Nitrogen uptake (kg N/ha/day)
Gro
win
g se
ason
(mon
th)
Figure 9 Estimated nitrogen uptake by an irrigated wheat crop over the growing season (Angus 2001).
Due to the high demand for nitrogen over the stem elongation period, plant nitrogen reserves may be low when it reaches the booting stage. Irrigated wheat crops may require a second nitrogen topdressing to achieve the target yield. Low nitrogen availability during grain filling will cause low grain protein concentration at harvest. The second topdressing should be applied before booting as delaying the nitrogen application until after flowering will not result in a yield increase.
Determining a target yieldThe target yield is required to calculate an accurate nitrogen budget for irrigated wheat. When targeting a high yield, all management factors must be adequately addressed including varietal selection, sowing time and irrigation scheduling.
After sowing and throughout the growing season, the crop needs a higher level of monitoring to ensure the target yield is still achievable. Having an adequate plant population is a key consideration in achieving a high yield. If the plant population falls below the general recommendation (150–200 plants/m2; minimum 120 plants/m2) the target yield may need to be lowered. See the Crop establishment chapter for detailed information on crop establishment.
Low and uncertain irrigation water availability is a widespread factor limiting irrigated wheat grain yields. A high yielding wheat crop requires approximately 5.5 ML/ha (from rain and irrigation) to avoid moisture stress throughout the growing season. If irrigation water is unavailable or the allocation is reduced during the growing season, growers should consider lowering the target yield and change inputs accordingly to ensure profitability.

Nutri
tion
IRRIGATED WHEAT IN SOUTHERN CROPPING SYSTEMS 2017 | 27
Figure 10 A nitrogen stressed irrigated wheat plot being topdressed with urea at the first node stage in a crop nutrition experiment at Hillston (Image source: Rachael Whitworth).
Preparing a nitrogen budgetFor the nitrogen budget, allow approximately 40 kg N/ha for every tonne of wheat grain yield. Therefore, if the target yield is 8 t/ha, the crop needs a total of 320 kg N/ha. The nitrogen will come from three sources including nitrogen already in the soil at sowing (pre-sowing soil test), nitrogen mineralised during the growing season and the amount of nitrogen applied as fertiliser during the growing season (Table 8).
A pre-sowing soil test (0–60 cm deep) should be conducted to determine the amount of nitrogen in the soil prior to sowing. Soil tests need to be conducted early enough to have the results back before sowing commences. Soil nitrogen levels can vary considerably depending on farming practices and cropping history. Experience has shown nitrogen levels range from 20 to 400 kg N/ha with levels commonly in the range of 50–100 kg N/ha (Angus 2015).
The amount of nitrogen mineralised during the growing season also varies but not as much as the variation in the level of nitrogen in the soil at sowing. The mineralisation rate is influenced by the level of organic carbon and available moisture in the soil. In irrigated wheat crops, the amount of nitrogen mineralised ranges from 60 kg N/ha in soils with low organic carbon up to 100 kg N/ha in soils with high organic carbon (Angus 2015).
An irrigated wheat crop requires approximately 100–120 kg N/ha at sowing which includes starting soil nitrogen and nitrogen fertiliser applied at sowing. Therefore, if the soil test indicates 90 kg N/ha prior to sowing and 145 kg/ha of MAP (15 kg N/ha) is applied at sowing the crop will have a total of 105 kg N/ha (and 32 kg P/ha). If the pre-sowing soil test indicates a lower level of nitrogen in the soil of 75 kg N/ha, applying 160 kg/ha of DAP will supply 29 kg N/ha giving a total of 104 kg N/ha (and 32 kg P/ha). Where the starting nitrogen is even lower, the addition of another nitrogen fertiliser will be required at sowing to achieve the base requirements of 100–120 kg N/ha.
The first decision regarding topdressing of irrigated wheat is made when the crop is approaching stem elongation (GS31, first node visible). If the number of tillers is 500–800 tillers/m2 the crop is on target to yield 8 t/ha plus and a minimum of 30–50 kg N/ha should be applied. If establishment was poor and the tiller count is below 500 tillers/m2 a yield of 8 t/ha is unlikely and a new lower yield target should be considered. If the tiller count is above 800 tillers/m2 (sown with high levels of soil N available) there is no need to topdress. The first topdressing is generally applied between the first and second node stage. In situations where the starting N levels are low, topdressing can commence a few weeks earlier during mid tillering.

28 | NSW Department of Primary Industries
The second decision regarding topdressing is made between flag leaf emergence and booting (GS41–GS47). Topdressing at this stage with 60–90 kg N/ha is usually required to achieve 8 t/ha with a grain protein concentration above 11.5%. Delaying topdressing after this time will reduce the effectiveness of the application. It is especially important to time the application of this topdressing so that it occurs before an irrigation event or rainfall event to minimise nitrogen losses through volatilisation. The nitrogen topdressing strategy in Tasmania is to have more regular topdressing applications through the tillering and stem elongation period. The strategy of smaller and more regular applications is to minimise leaching and reduce denitrification losses in higher rainfall zones on lighter soils.
Table 8 An example nitrogen budget for a high yielding (8 t/ha) irrigated wheat crop.
Target grain yield 8 t/ha
Total nitrogen required during season 8 t/ha x 40 kg N/ha = 320 kg N/ha
Mineral nitrogen in soil at sowing 75 kg N/ha
Fertiliser at sowing – DAP 160 kg/ha 29 kg N/ha
Estimated mineralisation during the season 80 kg N/ha
First topdressing – Urea 100 kg/ha 46 kg N/ha
Second topdressing – Urea 180 kg/ha 83 kg N/ha
Total nitrogen budget 313 kg N/ha
When preparing a nitrogen budget, the crops phosphorus (P) requirements also need to be considered. The general recommendation for phosphorus is to apply 4 kg P/ha for every tonne of wheat grain produced. Therefore, if the target yield is 8 t/ha the crop requires a total of 32 kg P/ha. The phosphorus requirements are commonly applied as MAP or DAP at the time of sowing. A rate of 160 kg/ha of DAP or 145 kg/ha of MAP will supply sufficient P for an 8 t/ha crop, unless soil P levels are low.
Potassium is an important element to produce high yielding wheat crops. Most heavy soils in south eastern Australia contain adequate amounts of naturally occurring potassium for optimum crop growth. Cropping zones on light sandy soils with high rainfall are prone to potassium deficiency and may need an application of a potassium fertiliser. A soil test prior to sowing will establish the potassium status in the soil and if remedial action is required. Wheat forage has a high potassium content, therefore it is especially important to consider the potassium budget where crops are to be grazed.
Soil testing and plant tissue testing is also important to help with trace element monitoring in case remedial action is required.
Fertiliser efficiency and nitrogen lossesNitrogen topdressing can be inefficient with an average recovery of only 50%. Recovery can be as low as 20% or as high as 80% depending on application method and the crop environment. Losses due to volatilisation after topdressing are usually low when applied at the beginning of stem elongation as the weather is cooler at that time. Losses can be much higher at booting when temperatures are significantly higher. To minimise nitrogen losses through volatilisation it is recommended that nitrogen topdressing is applied just before an irrigation event or rainfall event.

IRRIGATED WHEAT IN SOUTHERN CROPPING SYSTEMS 2017 | 29
Irrigated and dryland wheat crops face many of the same disease challenges. However, in an irrigated system the disease pressures are significantly greater due to a number of reasons:1. Increase in crop canopy biomass driven by high plant available water and fertiliser use,
resulting in the humidity of the canopy being consistently elevated. This creates ideal conditions for infection and development of foliar diseases.
2. Irrigation prolongs the ‘green leaf retention’ period of the crop which increases the temporal opportunity for disease infection.
3. The tendency to continuously crop results in elevated inoculum loads carried over between cereal crops.
Integrated disease management toolsThere are many integrated management tools that growers can use to assist reduction in disease pressure from foliar, soil and stubble-borne diseases.
1 Risk identification prior to sowingBe proactive instead of reactive. If the rotation includes wheat-on-wheat crops consult paddock notes from previous years to identify potential disease issues, analyse stubble and soil using the PreDictaB™ DNA based testing method, review extension material or disease bulletins and assess stubble for disease indicators i.e. fruiting bodies of yellow leaf spot.
Assess the ‘green bridge’ risk. The ‘green bridge’ is the presence of grass weeds and volunteers between crops that host wheat pathogens.
2 Crop rotationSow break crops for one or more years between wheat crops. Break crops include pulses, oil seeds, grass free pastures or any other crop type that is not a winter cereal. This allows the breakdown of any inoculum present. Grass weed control is vital in break crops as most grass weeds are alternate hosts of winter cereal pathogens.
3 Variety selectionSelect varieties that provide the best resistance ratings to a known disease issue. This gives the wheat crop the best chance of optimising yield in the presence of a pathogen whilst limiting the buildup of inoculum.
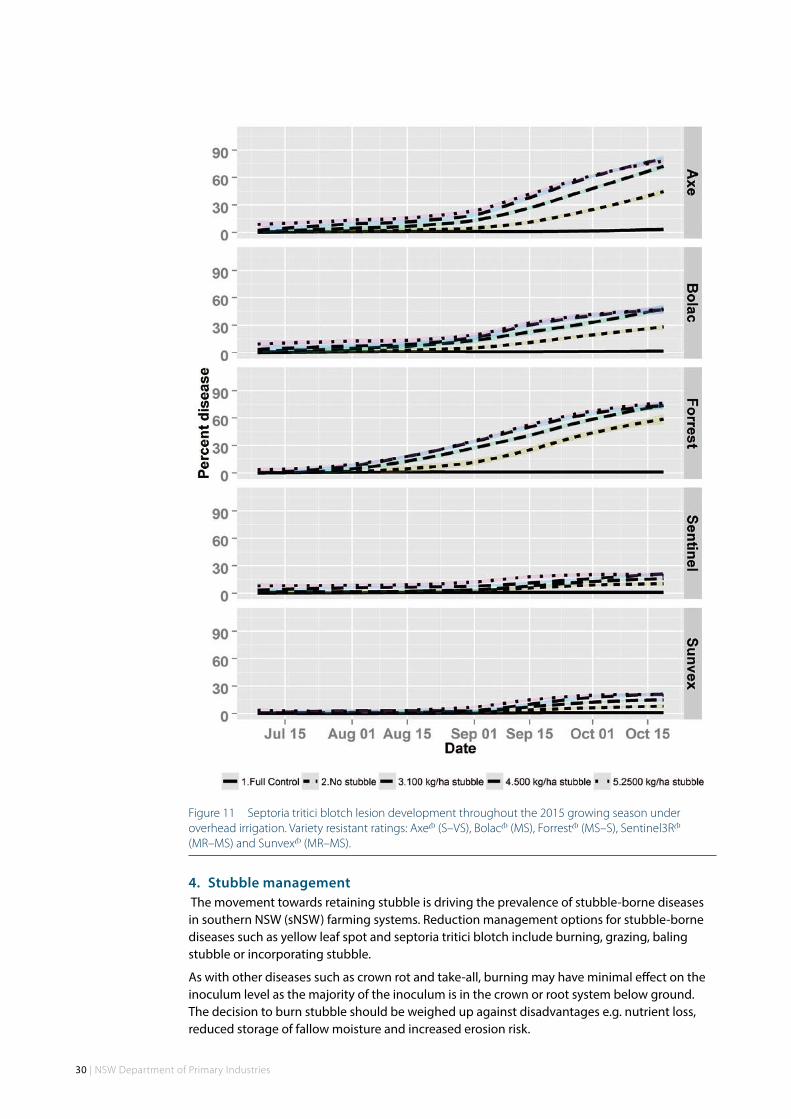
Figure 11 shows how variety selection can influence disease development. The results of a septoria tritici blotch experiment conducted in 2015 under overhead irrigation demonstrate the susceptible to very susceptible (S–VS) variety AxeA had significant infection of approximately 80% closely followed by the moderately susceptible to susceptible (MS–S) variety ForrestA. Selecting a variety with moderately susceptible (MS) or better resistance rating significantly reduced the total infection with BolacA (MS) at approximately 50% infection, and Sentinel3RA (MR–MS) and SunvexA (MR-MS) at 30%.
Effective varietal selection will reduce the likelihood of requiring repeated in crop fungicide applications.
Disease managementBrad Baxter, NSW DPI Wagga Wagga, Dr Steven Simpfendorfer, NSW DPI Tamworth and Dr Andrew Milgate, NSW DPI Wagga Wagga
30 | NSW Department of Primary Industries
Figure 11 Septoria tritici blotch lesion development throughout the 2015 growing season under overhead irrigation. Variety resistant ratings: AxeA (S–VS), BolacA (MS), ForrestA (MS–S), Sentinel3RA (MR–MS) and SunvexA (MR–MS).
4 Stubble management The movement towards retaining stubble is driving the prevalence of stubble-borne diseases in southern NSW (sNSW) farming systems. Reduction management options for stubble-borne diseases such as yellow leaf spot and septoria tritici blotch include burning, grazing, baling stubble or incorporating stubble.
As with other diseases such as crown rot and take-all, burning may have minimal effect on the inoculum level as the majority of the inoculum is in the crown or root system below ground. The decision to burn stubble should be weighed up against disadvantages e.g. nutrient loss, reduced storage of fallow moisture and increased erosion risk.

Dise
ase m
anag
emen
t
IRRIGATED WHEAT IN SOUTHERN CROPPING SYSTEMS 2017 | 31
5 Weed controlChemical or mechanical control of weeds (‘green bridges’) is critical in a fallow rotation to reduce the hosts for foliar, stubble-borne and soil-borne diseases. Control of volunteer cereals and grasses in the preceding break crops and non-crop areas such as fence lines is critical.
6 Fungicide use (seed, fertiliser and foliar)The use of fungicides is important in the control of some cereal diseases. However, they should be used in an integrated approach with other cultural practices and not be relied upon alone. Fungicide application falls into four categories: applied on the seed, in the furrow, to fertiliser and to the leaf (foliar). When applying foliar fungicide, timing of the application with the right mode of action is more important than the selection of an individual product.
Due to the evolution of fungicide resistance in some cereal pathogens (e.g. septoria tritici blotch) and the risk of further resistance development, it is essential that multiple modes of action are used if there is going to be more than one fungicide application per year. Strobulurins, triazoles and succinate dehydrogenase inhibitor (SDHI) fungicides should all be rotated to reduce the risk of resistance development.
7 Inter-row sowingInter-row sowing, particularly in wheat-on-wheat rotations, is advisable to reduce potential impacts of some stubble-borne diseases (e.g. crown rot).
8 Adequate nutritionEnsure adequate nutrition is applied to allow for optimal crop health and that it is balanced to meet seasonal conditions. Application of too much nitrogen can cause the development of excessive canopy biomass resulting in increased risk of foliar disease. Increased nitrogen can also exacerbate moisture stress during anthesis and grain fill if it is not balanced with soil water content at sowing along with seasonal conditions.
9 In-crop monitoringInspection of the wheat crop for the presence and extent of diseases, and the resulting management decisions are vital to crop health. It is essential that inspections are undertaken regularly as some diseases such as yellow leaf spot can sporulate every seven days. The septoria tritici blotch latent period from infection to disease expression can be 2–3 weeks. Irregular inspections may miss the expression of disease after an infection event. Fungicides are considerably more effective when used as a preventative measure rather than curative strategy. Early disease detection through regular monitoring is therefore important.
10 Irrigation schedulingUnder or over watering the crop can promote disease development. Over watering with low soil temperature, particularly while the crop is small, allows root diseases such as pythium, rhizoctonia and take-all to proliferate and irreversibly affect yield. Additionally, moisture stress at anthesis and grain fill caused by under watering will promote the expression of diseases such as crown rot.
Wheat diseasesFoliar diseases are most likely to cause yield loss when there is increased biomass, humidity and prolonged green leaf retention. Stubble-borne and soil-borne diseases are likely to occur in retained stubble systems. The diseases below are heavily favoured by wheat-on-wheat rotations and growers should be particularly mindful of these diseases in irrigated farming systems.
Leaf rust (Puccinia triticina)Leaf rust requires moisture on the leaves and temperatures between 15–20 °C for the spores to develop. The pustules are small, round and red-orange in colour. Under ideal conditions,

32 | NSW Department of Primary Industries
pustule expression may be visible 7–10 days after an infection event. The pustules are found on the upper side of the leaf as opposed to stem rust which is found on both the upper and lower side of the leaf. Wheat varieties vary in their levels of resistance but leaf rust has re-emerged as a significant disease in recent seasons due to the introduction of an exotic pathotype into South Australia in 2014. This pathotype has now spread to other regions.
There are seed, fertiliser and foliar fungicides available for the control and suppression of leaf rust. Seed and in-furrow fertiliser options are generally less effective against leaf rust than stripe rust. This is due to the epidemic development of leaf rust when the activity of the fungicides products is waning. Foliar fungicides should be applied to protect the top three leaves – Flag (F), F-1 and F-2.
Controlling volunteer wheat plants over the summer–autumn period is a key strategy to break the ‘green bridge’ between seasons and reduce inoculum levels.
Stem rust (Puccinia graminis F.sp. tritici)Stem rust requires moisture on the leaves and temperatures between 18–30 °C for the spores to develop. Under ideal conditions, pustule expression may be visible 7–10 days after an infection event. The pustules are a reddish brown in colour and occur on the stem, leaf (both sides) and leaf sheath. There are foliar fungicides available for the control of stem rust. Grower uptake of varieties with improved resistance has increased and significant losses from stem rust are not common.
Note that later fungicide application beyond flag leaf emergence (GS39) may still be economical in susceptible varieties under moderate to high stem rust pressure. This is due to the later onset of the disease.
Controlling volunteer wheat plants over the summer–autumn period is a key strategy to break the ‘green bridge’ between seasons and reduce inoculum levels.
Stripe rust (Puccinia striiformis)Stripe rust requires temperatures between 10–15 °C and moisture on the leaf for the spores to develop. Under ideal conditions, pustule expression may be visible 10 –14 days after an infection event. The pustules are yellow-orange in colour and occur parallel to the leaf venation, producing the characteristic stripe appearance. Under heavy disease pressure, stripe rust may move into the glumes of the wheat head. To limit infection and spread of stripe rust, sow varieties with a resistance rating of MR–MS or better.
There are seed and fertiliser treatments available to suppress stripe rust on wheat plants at earlier growth stages until adult plant resistance (APR) develops around heading. Foliar fungicides should be applied to protect the top three leaves – Flag (F), F-1 and F-2. Generally this would occur at GS39 (flag leaf emergence). Under high disease pressure, an earlier application at GS31 (first node) and then GS39 might be warranted.
Controlling volunteer wheat plants over the summer–autumn period is a key strategy to break the ‘green bridge’ between seasons and reduce inoculum.
Septoria tritici blotch (Zymoseptoria tritici)Septoria tritici blotch (STB) is a stubble-borne disease spread by two mechanisms. Firstly, through the release of ascospores which are then spread by wind and secondly, once an infection event has occurred, lesions produce conidia which are then dispersed by rain splash infecting leaves higher up the plant. Septoria tritici blotch has a latent period of 2–3 weeks between infection and lesion development. Lesions are irregular in shape, tan to brown in colour and will have distinctive black ‘dots’ in them called pycnidia.
There are seed and fertiliser applied fungicides available for the suppression or control of STB. Foliar fungicides should be applied at GS31 and GS39 to protect the F, F-1 and F-2 leaves which contribute most to yield. It is documented that some pathotypes of STB have developed resistance to triazole fungicides in Australia hence rotation of modes of action is essential to

Dise
ase m
anag
emen
t
IRRIGATED WHEAT IN SOUTHERN CROPPING SYSTEMS 2017 | 33
avoid further resistance development. Sowing varieties with higher levels of resistance and crop rotation are key strategies to reduce reliance of fungicide applications as the primary control measure.
Yellow leaf spot (Pyrenophora tritici-repentis)Yellow leaf spot (YLS) is a stubble-borne disease. Primary infection of YLS occurs from black fruiting bodies on the stubble called pseudothecia. Under the right conditions, the fruiting bodies release air-borne ascospores which infect nearby plants. Infection can occur over a range of temperatures but needs moisture on the leaf for at least six hours. Secondary infection events occur throughout the season from the production of conidia from older lesions on infected leaves which are air-borne and spread by wind over long distances. Sporulation can occur every seven days.
Yellow leaf spot appears as tan blotches with yellow margins. The distinguishing factor between YLS and STB is the absence of the black fruiting bodies (pycnidia) with YLS.
Wheat varieties vary in their level of resistance to YLS and varieties with a rating of VS–S should be avoided. Burning or removing stubble reduces inoculum levels. Crop rotation to non-host oilseed, pulse or barley crops reduce inoculum loads between wheat crops. Avoid wheat-on-wheat crop sequences.
There are foliar fungicides registered for suppression of YLS but need to be applied at critical growth stages (GS30 and GS39) in susceptible varieties prior to rainfall events as a preventative action. In most growing seasons, YLS does not extend up the plant high enough to cause significant yield loss. In most cases fungicide application is not economically viable or warranted.
Fusarium head blight (Fusarium graminearum, Fusarium pseudograminearum and Fusarium culmorum)Fusarium head blight (FHB) is a stubble-borne disease. It appears as premature ripening of individual spikelets within infected heads and during warm humid weather may produce orange spore masses on heads. Infection results in the production of white or pink grains within infected heads. FHB is spread by wind dispersal and the inclusion of maize as a summer crop favours FHB development in the following wheat crop as it is a preferred host of F. graminearum. In wet seasons (e.g. 2010 and 2016) FHB can also arise from spore masses produced around lower nodes on stem infected with crown rot (F. pseudograminearum) which are rained splashed into heads around flowering.
Irrigation, especially overhead, can favour the development of FHB by providing high humidity around heads during anthesis which is when the infection occurs.
A foliar fungicide is registered for control of FHB but the timing of the application at early flowering (anthesis), water volume and nozzle angle are extremely critical to efficacy as coverage of the flower head is important.
The most common way to avoid FHB is to include break crops in the rotation and avoid durum crops in close succession as they are very susceptible to FHB. Be wary of sowing into maize stubble, irrigating during flowering (to limit periods over 80% humidity) and consider fungicide application at the start of anthesis in high risk situations.
Powdery mildew (Blumeria graminis F.sp. tritici)Powdery mildew affects all parts of the wheat plant. It appears as white to grey fluffy masses of spores which reduce the photosynthetic (green leaf ) area. Black resting structures then develop on infected leaves during the season. The spores are easily spread over large distances via wind dispersal from infected stubble or plants. Crops with a high biomass canopy that reduces air circulation and builds humidity are susceptible to powdery mildew infection. Infection occurs with humidity between 85–100% and temperatures between 15–22 °C.

34 | NSW Department of Primary Industries
Powdery mildew can be managed by the use of resistant varieties, seed or in-furrow fungicides at sowing or application of foliar fungicides in crop. Powdery mildew is generally not an issue in dryland wheat crops but irrigated crops, especially with higher nitrogen status, can be more prone to disease development.
Crown rot (Fusarium pseudograminearum and Fusarium culmorum)Crown rot is a stubble-borne disease that restricts the flow of water and nutrients through the xylem resulting in stress during the critical grain fill stage. This can result in pinched grain or heads without grain, otherwise known as ‘whiteheads’. Crown rot is favoured by wet, cool winters and dry, hot spring conditions. It may be identified early in the growing season as browning on the outer leaf sheathes at the base of infected tillers.
More reliable identification can occur in periods of moisture stress. Typically, honey coloured stem browning extending from the sub-crown internode upwards to the first or second node on stems and the presence of scattered prematurely ripened ‘whiteheads’ on individual tillers within a plant. White mycelium could be present inside the stem or pink hyphae under the leaf sheath in periods of higher humidity.
Crown rot is most effectively managed by including non-host break crops into the rotation for one or more years, good grass weed control programs, inter-row sowing, sowing varieties with the best resistance rating and supplying adequate zinc nutrition.
There is a fungicide registered for suppression of crown rot in the form of a seed treatment. It has shown limited efficacy as a standalone management option and must be used in an integrated approach to disease management. There are no foliar fungicides registered for crown rot.
The expression of crown rot as ‘whiteheads’ and the associated yield loss can, to some extent, be reduced by effective irrigation scheduling to minimise water stress during anthesis and grain fill.
Take-all (Gaeumannomyces graminis var tritici)Take-all is a stubble-borne disease but the primary inoculum source is from infected wheat and grass weed roots left in the soil profile. Take-all appears in-crop as stunted pale yellow plants with few tillers. The sub-crown internode, stem base crown and root stele will appear blackened. In extreme cases, the black colouration will extend up the stem known as ‘black socks’. A more reliable indicator of take-all is the presence of ‘whiteheads’ during grain fill. As opposed to crown rot, take-all tends to affect all tillers on a plant rather than scattered tillers. Take-all is favoured by wet winters and springs.
Take-all can be managed by including non-host break crops in the rotation for one or more years, good weed control programs, supplying adequate nutrition and some seed and in-furrow fungicides applied to fertiliser that provide a level of suppression. There are no foliar fungicides registered for the control of take-all in crop.
Common root rot (Bipolaris sorokiniana)Common root rot (CRR) is a soil-borne and stubble-borne disease. CRR appears in the crop as single or small patches of stunted plants, pale in colour with reduced tillering and small sized heads. Infection is characterised by browning of the coleoptiles, sub-crown internode and roots. Brown or black lesions on the sub crown internode are a key diagnostic feature.
CCR can be managed by introducing non-host crops in the rotation for two or more years, good control of grass weed hosts, adequate nutrition (especially phosphorus), careful seed placement when sowing as deeper sowing exacerbates infection and sowing more resistant varieties. There are no fungicides registered for use.

Dise
ase m
anag
emen
t
IRRIGATED WHEAT IN SOUTHERN CROPPING SYSTEMS 2017 | 35
Pythium (Pythium spp )Pythium is a soil-borne disease that appears in the crop as areas of decreased vigour, stunted plants and reduced tillering. Roots have yellow-brown lesions, short root systems with the outer layer rotted. Pythium is common in high rainfall areas, favoured by cold wet soils and wheat–canola rotations.
Pythium can be managed through good weed control programs, adequate nutrition, diverse crop rotations and the use of seed treatments. There are no foliar fungicides registered for the control of Pythium in-crop.
Rhizoctonia barepatch (Rhizoctonia solani)Rhizoctonia is a soil-borne disease that appears in the crop similarly to Pythium, but as patches (barepatches) of reduced vigour from an early growth stage. The barepatches vary in size, appear stunted and the root system will have brown ‘spear tip’ shaped roots where they have rotted away. The affected crop cannot access water and nutrients from the surrounding soil due to the damaged root system. Rhizoctonia is commonly found in soils with low fertility and is most damaging when water is not freely available to the plant. Rhizoctonia is favoured by cold soil temperatures at sowing.
Rhizoctonia can be managed by good grass weed control, adequate nutrition, sowing less sensitive crop types such as oil seed or pulse crops and soil disturbance to a depth of 5–10 cm below the sowing depth at, or 2–4 weeks before, sowing. Avoid the buildup of Group B herbicides within paddocks that can cause root pruning and exacerbate Rhizoctonia.
Some in-furrow and seed treatment fungicides are available for the suppression of Rhizoctonia. There are no foliar fungicides registered for the control of Rhizoctonia in-crop.
Bunts and smuts (Telletia and Ustilago spp )Bunts and smuts appear as powdery heads (loose smuts) or seeds within heads that are black and smell foul (bunts). Both are effectively controlled by using clean seed and treating with a registered seed-applied fungicide. However, good coverage of seed treatments is important to maximise efficacy of these products.
Barley yellow dwarf virus (BYDV) and cereal yellow dwarf virus (CYDV)Infected plants have yellowing or reddening of leaf tips with plants appearing stunted and often in patches in crop. Infection can result in floret sterility and hence reduced seed set. Disease is most common near perennial grass pastures which host both the virus and aphid vectors. It is most prevalent in early sown crops.
BYDV and CYDV can be controlled by sowing resistant or more tolerant wheat varieties. Seed treatments (e.g. Imidacloprid) that control feeding by aphids early in the crop reduce early viral infections. In-crop application of aphicides may need to be considered to prevent spread in infected crops early in the growing season.
Wheat streak mosaic virus (WSMV)Infection appears as light green streaks and blotches on leaves of stunted plants. These plants then have reduced seed set. WSMV may appear as individual infected plants scattered across a paddock if caused by low levels of seed transmission. Infected plants may also appear as waves extending into the paddock along borders with grass pastures or grass weed areas such as water ways or rocky out crops when spread by the wheat curl mite (WCM). WSMV has occurred in southern irrigation areas and generally no control is required. However, in irrigation areas it is advised to spray out grasses in adjoining paddocks four weeks prior to sowing wheat.
Insecticides do not control WCM as they are protected within the curled leaves. Do not retain seed from infected crops for planting as there can be low level (<1%) seed transmission of WSMV.

36 | NSW Department of Primary Industries
Insect managementJo Holloway, NSW DPI Wagga Wagga
Insect pests found in irrigated wheat are the same as those that attack dryland wheat. However, irrigated wheat crops may be less prone to attack, or vulnerable to damage, due to the plants being less stressed by lack of moisture. Water-stressed plants are known to emit volatiles which can draw insects to them leading to greater feeding damage. Furthermore, damage, particularly from sucking pests such as aphids that remove fluids from plant cells, is exacerbated when water supply is limited.
Wheat crops are most vulnerable to economic damage from insects during establishment. Significant crop damage can also occur between heading and maturity. While this is often linked to pest abundance, other contributing factors include climate, soil type, nutrients and sowing depth. These can influence germination rate and seedling emergence, and consequently the ability of young plants to outgrow any damage caused by pests.
Primary pests of irrigated wheatIn irrigated wheat crops, only a few insects cause severe damage. Primary pests include:
Mites• Blue oat (Figure 12) and balaustium mites are primary attackers of wheat• Redlegged and bryobia mites may also cause damage but their preference is for other crops• The mites lacerate leaf cells and suck sap leaving distinguishable damage marks which can
be used to identify the different mites• A high risk period is establishment of crops following pasture.
Figure 12 Blue oat mite (Image source: cesar Australia).
Aphids• Oat (Figure 13) and corn aphids are the most common in southern Australia. Rose-grain
aphid is an occasional pest and Russian wheat aphid is a recent incursion into Australia• The aphids pierce the leaves and suck sap. Direct damage can result in yield losses of up to
10%. Russian wheat aphid injects a toxin and yield losses may be much higher• The amount of damage caused by aphids is related to aphid abundance and duration of
infestation• The aphids vector viruses such as barley yellow dwarf virus (BYDV). The virus damage is
wider spread with earlier infections• High risk periods are in seasons with late summer/autumn rainfall and warm growing
conditions.

IRRIGATED WHEAT IN SOUTHERN CROPPING SYSTEMS 2017 | 37
Inse
ct m
anag
emen
t
Figure 13 Oat aphids (winged and non-winged forms) on the back of a wheat leaf (Image source: DAFWA).
Caterpillars• Armyworm and heliothis are the primary pests but only occasionally cause economic
damage• Most damage occurs when armyworms lop off heads or are in large numbers during the
seedling stage, or when heliothis caterpillars feed in grain heads. There is minimal yield loss due to leaf feeding
• Crops are at higher risk following heavy rain or flooding, and in paddocks adjacent to fallowed pastures.
Beetles• Cockchafers and wireworms (Figure 14) are seedling pests generally localised to small areas
within the paddock• They damage plants below-ground causing bare patches in the crop that may require re-
sowing• Crops sown into high stubble loads with no prior tillage may be at risk.
Figure 14 Wireworm larvae (Image source: GRDC).

38 | NSW Department of Primary Industries
Slugs• Slugs (Figure 15) are primarily a problem during crop establishment and early growth stages• They typically feed at night and hide in residue or soil during the day• Damage is caused by slugs feeding and hollowing out newly planted seeds and scraping or
rasping on leaves. Slime trails may be visible near the damage to assist in identifying slugs as the culprit
• There are several species which each have different feeding habits and ecology• No single control method will work and an integrated approach is required to manage them• Winter crops sown into paddocks with high stubble loads and low soil disturbance are most
at risk, particularly following a cool, wet summer.
Figure 15 Reticulated (top) and black keeled slugs (Image source: DAFWA).
Key factors of good pest management1 IdentificationIt is important to ensure you know the species you are dealing with. Different species may have different tolerances to pesticides (e.g. certain blue oat mite populations are more tolerant than redlegged earth mites) or require different chemistry (certain chemicals are effective against armyworm, but not heliothis); while other species may not even be pests but predators such as carabid beetle larvae that are often mistaken for wireworm larvae (Figure 16).
Identification also provides knowledge of the ecology and life cycle of the pest. This can assist in knowing when and where to target sampling. Furthermore, certain chemical methods may work for one pest but not for another: e.g. Timerite® (IPM tool for growers) targets redlegged earth mites but is not effective against blue oat mites.
Take advantage of resources such as PestFacts South-eastern (website: http://cesaraustralia.com/sustainable-agriculture/pestfacts-south-eastern) for alerts and information on pests that are likely to be present and how to deal with them.
Figure 16 Carabid larvae, a predator that may be mistaken for a wireworm (Image source: Jo Holloway, NSW DPI).
2 MonitoringFrequent, accurate and timely crop monitoring maximises the chances of effective and timely pest control. Ensure samples are taken from a number of random sites rather than targeting damaged areas. A larger number of small samples is better than fewer large samples.
When sampling, make notes on number of pests, damage estimates and any beneficial species present (including mummified aphids which indicate parasitoids are active). Recording the findings provides information on trends which will indicate if the beneficial species are

IRRIGATED WHEAT IN SOUTHERN CROPPING SYSTEMS 2017 | 39
Inse
ct m
anag
emen
t
controlling pest numbers or if chemical intervention is warranted. These notes also provide a paddock history that can be used in following years rather than relying on memory.
Visual inspections, sweep netting and suction sampling are the most common sampling methods post-sowing. Soil samples should be taken pre-sowing to look for beetle pests.
Know when and where to sample. Blue oat mites are more active in the mornings and can be found on the leaves and on the ground, whereas balaustium mites are more frequently found feeding near the tips of the plants during the warmer parts of the day. Checking the borders of the crop may be all that is required, for example aphids often fly in on prevailing winds. Early checks in these areas may indicate potential threats.
3 Economic thresholdsIn order for the cropping enterprise to be profitable, outputs must be greater than inputs. Crops can tolerate some damage and still be profitable. Where thresholds do exist, very few are current and take into account the fluctuating cost of chemicals, fuel and crop values. In addition, no cereal economic thresholds include any benefit from natural enemies. Therefore, most economic thresholds should only be used as a guide to determine if chemical control is required.
With frequent monitoring, trends of pest numbers in relation to natural enemies can emerge. Control action should be considered when pest numbers are increasing and there is no coincidental response in natural enemy abundance.
Other factors to consider for thresholds are upcoming weather events (heavy rain can wash off some pests), stage of the crop (mite damage is generally minimal during vegetative and flowering stages), life stage of the pest (small armyworms take 8–10 days to reach a size capable of head lopping therefore control may not be required in crops nearing maturity).
4 Control measuresKnowing if and where there is a risk is the key component of effective insect management. This knowledge can be used to indicate measures that may minimise that risk, for example, crop rotations to avoid cereals following pasture to reduce damage from mites. The presence of BYDV in the previous year, especially when combined with warm conditions and early aphid flights, indicates a risk where an insecticide seed treatment would be a valid preventative measure.
Chemical control of insect pests should be the last option. When used, chemicals should be strategic and target the pest with effective application techniques. Where available, use selective insecticides. Rotate different chemical classes to delay or prevent resistance developing. Insurance sprays may appear to save money on application costs but can result in a pest outbreak later in the season due to the loss of natural enemies.
Seed treatments are still chemicals but limit the effect of that chemical to a small area. They are a useful tool to deter attack from pests such as wireworms and aphids until the plants are established. However, their effect is limited when large numbers of pests are present.
Useful resourcesI Spy Manual• Provides in-depth coverage of insect management in broadacre crops in southern Australia• https://grdc.com.au/resources-and-publications/all-publications/bookshop/2012/11/i-spy
PestFacts South-east and South Australia• Alerts and notifications of pests causing damage during the current cropping season. Both
tools rely on input from local agronomists and growers• http://cesaraustralia.com/sustainable-agriculture/pestfacts-south-eastern• http://www.pir.sa.gov.au/research/services/reports_and_newsletters/pestfacts_newsletter

40 | NSW Department of Primary Industries
Crop Insects – the Ute Guides• Information on pest and beneficial species• Hard copies only
Back Pocket Guides• Information on specific pest species (aphids, mites, slugs) or beneficials• Search: https://grdc.com.au/resources-and-publications/all-publications
Websites• www.dpi.nsw.gov.au• www.agriculture.vic.gov.au

IRRIGATED WHEAT IN SOUTHERN CROPPING SYSTEMS 2017 | 41
Weed managementAaron Preston, NSW DPI Wagga Wagga
Irrigation adds new elements to weed management in farming systems. There is the added need to manage aquatic and channel bank weeds as well as broadacre weeds within the dynamics of irrigation. Good weed management requires accurate and early identification of weeds present, treatment and planning.
It is important to know your weeds, including summer weeds as irrigation might trigger the early emergence of summer weeds.
How can they be controlled?Effective and sustainable weed control can be achieved with a balance of herbicide and non-herbicide options. Irrigated wheat is very vulnerable during the first six weeks of development; therefore it is imperative to have targeted herbicide strategies pre- and post-sowing to prevent significant crop losses.
Weed burdens should be reduced by the use of a pre-emergent herbicide before sowing, and can be combined with autumn tickle and delayed sowing strategies for increased efficacy. Preceding this with control of fallow weeds will preserve soil moisture and nutrition, and has been shown to result in higher yields. When considering a suitable pre-emergent herbicide, evaluate the weeds to be controlled, the conditions of the paddock (soil type, moisture) as well as the irrigation schedule. Poor timing of pre-emergent herbicides will result in low herbicide efficacy and ineffective weed control.
Early weed control is imperative as weeds that have survived, escaped or weren’t targeted by pre-emergent herbicide application will compete for vital nutrients and moisture during this period, and will be harder to remove later in the season. Following up a pre-emergent herbicide (e.g. chlorsulfuron, clopyralid/diuron) with a post-emergent herbicide (e.g. fenoxaprop or pinoxaden) in this period will offer better weed control than pre-emergent herbicide alone.
Grass weed control with imidazolinone based herbicides (IMIs) are another option when paired with herbicide tolerant Clearfield wheat varieties such as Elmore CL PLUSA or Grenade CL PLUSA. Consideration should be made with the use of IMIs and the necessary plant-back restraints and appropriate rotation of Clearfield crops to preserve their use and prevent herbicide resistance.
Suspected survivors of pre or post-emergent herbicide application should be tested for herbicide resistance by a suitable testing service for confirmation (e.g. Charles Sturt University, or Plant Science Consulting), followed by a change in control strategies to prevent its spread. Careful stewardship is required to preserve the efficacy of herbicides and herbicide tolerant varieties.
Ideally, herbicides should be used in conjunction with non-chemical options for more effective weed control and to preserve herbicides. These include:• Agronomic practices – Increasing sowing rate, decreasing row spacing, competitive varieties
(especially those with early vigour) to create a more competitive environment utilising crop competition to outcompete weeds. Plant populations of 150–200 plants/m2 (90–110 kg/ha sowing rate) creates a competitive environment against weeds. Note that irrigated wheat has a significant lodging risk which will be increased by increasing plant population.

42 | NSW Department of Primary Industries
• Managing weed seeds – Harvest seed set control with chaff lines, narrow windrow burning, and harvest weed seed destructors to destroy seed before it can enter the seed bank.
• Farming practices – Autumn tickle/false break combined with delayed sowing allows for treatment of weeds after a break but before sowing.
• Farm hygiene – On-farm hygiene includes ensuring that vehicles and equipment are cleaned to prevent transfer of weed seeds from dirty to clean paddocks.
• Managing weed sources – Manage channel banks and fencelines. Weed seeds can be introduced into paddocks by incursions from irrigation channels and fencelines. It is therefore important to control these weeds to prevent them getting into the crop. These weeds can be controlled by slashing, mowing, cultivation or an application of a knockdown herbicide. The development of glyphosate resistant weeds, particularly annual ryegrass, on fencelines is of significant concern as it can quickly spread into paddocks.
• Wheat seed quality – Use high quality seed or seed that has been cleaned or sourced from clean paddocks. If you are using retained seed, it may be worth having it cleaned to remove any unnoticed weed seeds to prevent a future infestation. Contaminated seed from weeds can result in rejection or penalty when delivered.
• Farm chemicals – As always, rotate herbicides and crops to keep weeds in a spin.
Develop a planOnce weeds have been identified on-farm, it is important to develop a long-term management plan. Know your paddocks, pair weedy paddocks with herbicide tolerant varieties and suitable integrated weed management strategies. Develop a clear objective for the effective treatment and continuing management of weeds.

IRRIGATED WHEAT IN SOUTHERN CROPPING SYSTEMS 2017 | 43
Case studyImproving irrigation efficiency through infrastructure improvements in northern Victoria
Grower Stuart Hodge
Farm location Numurkah, Victoria
Rainfall 450 mm
Enterprise Irrigated continuous cropping
Farm area 1234 ha
Irrigated area 1234 ha
Water source Murray River via Goulburn Murray Water’s ‘Murray Valley’ gravity system
The enterpriseStuart Hodge operates a continuous cropping enterprise 2 km west of Numurkah in northern Victoria (Figure 17). Despite being a dairy farm until recently (2008), Stuart is achieving high irrigated wheat yields by investing in infrastructure and actively seeking out ways to improve yields and efficiency.
One hundred percent of the farm is irrigated using border check layout. The core enterprise is continuous cropping with equal areas of faba beans, canola and wheat each year. Sheep are agisted on the farm every summer. The average annual rainfall is 450 mm and the predominant soil type is grey loam.
Figure 17 Location of Stuart Hodge’s property, Numurkah, Victoria.

44 | NSW Department of Primary Industries
Water is sourced from the Murray River at the Mulwala off-take and is distributed through a gravity-fed channel system to the farm. Stuart buys all irrigation water on a season-by-season basis. The first water package is purchased at the beginning of the season and the quantity is determined by autumn water requirements. The second water package is purchased during the season and is determined by spring water requirements.
A common winter crop sequence is canola – wheat – faba beans – canola – wheat. The average yield of irrigated wheat (prior to the irrigation layout upgrades) is 6.5 t/ha and the target yield is 7 t/ha. The average yield of irrigated canola is 2.5 t/ha and the target yield is 3 t/ha. The average yield of faba beans is 2.5–3 t/ha and the target yield is 4 t/ha.
There are no summer crops currently included in the rotation. However, to maximise production and profitability, summer crops and double cropping are included in future plans.
Stuart monitors soil moisture levels with MAIT tensiometers and uses a combination of data from the tensiometers, weather forecasts and experience to schedule irrigation. The constant monitoring from the tensiometers produces a graph over time that depicts the gradient of water usage and soil moisture decline to predict the irrigation point.
The challengesPrior to implementation of the irrigation layout upgrades, a major challenge on Stuart’s property was irrigation efficiency. It was impossible to get the water over the land quick enough with the old layout which was also very labour intensive. This impacted on irrigation scheduling and often crops were not watered at the ideal time, or not enough irrigations were applied, affecting yields. This challenge prompted the layout changes outlined below.
Another factor limiting irrigated wheat production on Stuart’s farm is annual ryegrass. Herbicide resistant populations are difficult to manage, especially when coupled with early autumn irrigation to enable timely crop establishment as this also establishes the ryegrass population. He combats annual ryegrass with a combination of chemical control, crop rotation, stubble burning and control in non-crop areas such as fencelines, channel banks and check banks.
Quality of sowing and subsequent crop establishment is another notable challenge to production. Stuart is planning on refining sowing accuracy with machinery improvements in the future.
Management adaptationsThe property was a dairy farm until 2008 when the entire dairy herd was sold, and it is now a continuous cropping enterprise. The enterprise switch was made because of the dairy’s high labour requirement and lack of available labour, and changes within the dairy industry. Stuart has invested a significant amount of time and money into upgrading layouts and converting his farm to fast-flow irrigation.
The infrastructure improvements were facilitated by two on-farm water efficiency programs. The first, facilitated by Goulburn Murray Water, occurred during the development of the pipeline from the Goulburn River to Melbourne water storage facilities. Funding was provided to farmers to complete various on-farm works including the filling-in of inefficient sections of the GMW channel system and develop a more efficient channel system on their farm.
The second was the federal government’s On–Farm Efficiency scheme in which farmers were paid above-market rates to transfer some water entitlement to the Commonwealth in return for completing on-farm irrigation infrastructure improvements to increase water efficiency. Stuart has combined the funding from both sources and redeveloped large sections of the property
“Our old layout was so difficult to get water on and off quick enough that we often didn’t irrigate at the right
time, and sometimes not at all”

Case
stud
y
IRRIGATED WHEAT IN SOUTHERN CROPPING SYSTEMS 2017 | 45
into new wide irrigation bays in a straight, square format (Figure 18 and Figure 19). New high-capacity channels with 600 mm piped bay outlets and automatic doors that drain out between irrigations have also been constructed as part of the works.
The most significant benefits from the infrastructure improvements are increased water use efficiency and decreased labour demand. The new system is automated, has increased gradient and increased water height, all allowing watering to occur on time and being able to push the water over the paddocks faster. Water required for the first irrigation event of the Autumn has decreased significantly from 1.3 ML/ha to 0.8 ML/ha.
Figure 18 The farm prior to the irrigation layout changes (08/03/2011).
Figure 19 The farm after the irrigation layout changes (24/10/2015).
“The new improved layouts have
significantly increased water use efficiency
and decreased labour demands”

46 | NSW Department of Primary Industries
One of the major challenges associated with the improvement projects was the deadlines imposed by the schemes, and the demand on farmers to complete required works in the timeframe.
Future plans include full development of fast flow irrigation and achieving higher yields on a consistent basis. Summer crops are also likely to be introduced to increase overall productivity and profitability.
Disclaimer: The case study is based on one grower’s experience only and the information contained herein should not be taken as recommendations or advice. Independent professional advice should be sought on a case-by-case basis.
“We will consider double cropping in the future to increase overall
productivity”

IRRIGATED WHEAT IN SOUTHERN CROPPING SYSTEMS 2017 | 47
Case studyHigh-yielding irrigated wheat in the Lachlan Valley, NSW
Grower Scott Laird
Farm ‘Mount View Station’, Hillston, New South Wales
Rainfall 312 mm (annual average)
Enterprise Continuous cropping, fat lambs
Farm area 30,000 ha
Irrigated area 1049 ha
Water source Lachlan River, groundwater
The enterpriseMount View Station is a 30,000 ha property located 56 km north-west of Hillston, NSW (Figure 20). The soils are predominantly red and grey cracking clays that rise to red sandy loams to the north-west of the property. The average annual rainfall is 312 mm.
Figure 20 Location of ‘Mount View Station’, Hillston, New South Wales.
“The layout upgrades have cut watering
times from 12 hours to 6–7
hours”

48 | NSW Department of Primary Industries
There are two core enterprises on Mount View Station – continuous cropping (cotton and winter cereals in rotation) and dorper fat lambs. On average, 450 ha of cotton, 350 ha of wheat, 100 ha of milling oats, 70 ha of grazing oats and 35 ha of vetch for hay (all irrigated) are grown each year (Table 9). In addition, the property carries 6,500 dorper ewes plus lambs at foot.
The primary focus at Mount View Station is on growing irrigated cotton. Wheat was only introduced into the rotation in 2015 following major irrigation layout upgrades.
Table 9 Common crop sequences on Mount View Station.
Year 1 Year 2 Year 3 Year 4 Year 5
Summer Winter Summer Winter Summer Winter Summer Winter Summer WinterCotton Wheat Fallow Fallow Cotton Wheat Fallow Fallow Cotton WheatCotton M Oats Fallow Fallow Cotton Wheat Fallow Fallow Cotton WheatFallow Oats Fallow Oats Fallow Vetch Fallow Oats Fallow Oats
A total of 1049 ha is under irrigation – 934 ha of bankless channels and 115 ha of syphons with 2 m beds. Irrigation water is sourced from lower Lachlan groundwater via irrigation bores, and the Lachlan River via Willandra Creek.
Data logging probes and in-field monitoring are used to monitor soil moisture levels throughout the growing season. The probe data, field inspections, crop growth and development, and weather forecasts are used in combination to schedule irrigation.
The average irrigated wheat yield is 7 t/ha and the best yield achieved so far is 8 t/ha (in 2016 with no irrigation water applied due to above average in-crop rainfall). The best water efficiency achieved in an irrigated wheat crop was 1.5 t/ML of applied irrigation water. The target irrigated wheat grain yield is 7 t/ha.
The challengesThe main production/yield constraints at Mount View Station are:1. Seedbed preparation so that good seed to soil contact can be achieved after mulching/
rootcutting the cotton. Each year presents different issues to overcome making it difficult to implement an effective strategy.
2. Spring irrigation timing coinciding with watering up of cotton presenting a labour resource issue. Cotton watering is always prioritised over spring irrigation of winter crops.
Management adaptationsSignificant investment into the infrastructure at Mount View Station has been ongoing since 2011. Fallow fields (out of cotton, the primary crop) were redesigned from 960 m long siphon irrigated fields to bankless bay fields 400 m long, with earthworks occurring when the winter crops would normally be grown.
As a result, watering time has been reduced from 12 hours to 6–7 hours, labour requirements have reduced dramatically and machinery trafficability is now more efficient. Despite only having a couple of years’ experience with irrigated wheat, yields of up to 8 t/ha have already been achieved. An irrigation design consultant was utilised during the planning process, as well as expertise from other irrigation farmers.
“Converting 960 m siphon irrigation fields to 400 m bankless bay fields has
increased water use efficiency, decreased labour and
increased machine trafficability”

Case
stud
y
IRRIGATED WHEAT IN SOUTHERN CROPPING SYSTEMS 2017 | 49
GoalsIn the short-term, Scott is planning on completing the development of the irrigation layout and fine-tuning his farming system to be the most efficient and profitable per hectare. In the longer term, he is aiming to be at the cutting edge of cropping in Australia by making Mount View Station a sustainable and profitable farming system utilising modern techniques and machinery.
Scott utilised a number of sources for technical information and advice including agronomists, consultants, fellow farmers, events such as field days, newsletters and the internet.
Disclaimer: The case study is based on one grower’s experience only and the information contained herein should not be taken as recommendations or advice. Independent professional advice should be sought on a case-by-case basis.

50 | NSW Department of Primary Industries
Appendix 1: project overview‘Southern irrigated cereal and canola varieties achieving target yields’
ObjectivesThe objective of the ‘Southern irrigated cereal and canola varieties achieving target yields’ project was to demonstrate an increase in irrigated cereal and canola production, and ultimately water use efficiency, through improvement of grower and adviser knowledge of high yielding cereal and canola varieties and specific agronomy management that will increase production and improve profitability under irrigation. The project area extended from the Lachlan Valley in NSW to Victoria, Tasmania and across to south-eastern South Australia.
The project comprised a series of research experiments to identify the cereal and canola varieties, and agronomic management practices, best suited to irrigated farming systems in each region. Specific research questions were tailored to each research node (geographical area) based on surveys of targeted primary producers (Table 11).
Project outputsThe outputs of the project include:1. Database – comprised of three years’ data from irrigated cereal and canola experiments
conducted throughout south-eastern Australia from 2014–2017.2. Variety specific agronomy packages (VSAPs) – regionally specific technical information based
on the research experiments undertaken in each research node.3. Best management practice manuals – a wheat manual and a canola manual outlining best
management practice guidelines for irrigated wheat and irrigated canola production in south-eastern Australia.

Appe
ndix
IRRIGATED WHEAT IN SOUTHERN CROPPING SYSTEMS 2017 | 51
Table 11 The research nodes, organisations undertaking the research and research questions (treatments).
Research node Organisation Research questions
Murrumbidgee Valley(Leeton)
NSW DPI Variety Plant population Nitrogen managementSowing date Irrigation frequency
Murrumbidgee Valley(Coleambally)
NSW DPI Variety Nitrogen managementPlant population
Murray Valley(Jerilderie, Finley, Deniliquin)
NSW DPI VarietyNitrogen managementPlant populationSowing date
Northern Victoria(Kerang)
Victorian Irrigated Cropping Council VarietyNitrogen managementPlant growth regulatorsFungicides
Lachlan Valley(Condobolin)
Central West Farming Systems Variety Plant population Nitrogen management
Lachlan Valley(Hillston)
Ag Grow Agronomy and Research Variety Nitrogen managementSowing date
SE South Australia(Naracoorte, Bool Lagoon)
MacKillop Farm Management Group VarietyNitrogen managementGrazingSowing dateFungicides
Tasmania(Cressy, Hagley)
Southern Farming Systems Variety FungicidesPlant growth regulatorsGrazingIrrigation frequency

52 | NSW Department of Primary Industries
Experiment locationsMurrumbidgee ValleyThe Murrumbidgee Valley in NSW covers 84,000 km2 and has a river length of 1,600 km (Figure 21). The major dams in the Murrumbidgee Valley are Burrinjuck Dam near Yass and Blowering Dam near Tumut. The annual natural flow averages 4,400,000 ML with a diversion of 2,200,000 ML (Anon. 2017).
The Murrumbidgee Valley is the major rice growing region in Australia producing 50% of Australia’s rice. The annual farm-gate value of irrigated production in the valley is $98 million for rice, $190 million for horticulture and other crops and $20 million for livestock products (Anon. 2015). The catchment also produces 25% of NSW’s fruit and vegetables, and 42% of NSW’s grapes (Anon. 2017).
There are two main irrigation areas within the Murrumbidgee Valley – the Murrumbidgee Irrigation Area (MIA) and the Coleambally Irrigation Area (CIA).
The MIA covers 660,000 ha of which 170,000 ha are irrigated. The primary offtake from the Murrumbidgee River to the MIA is at Berembed Weir which is 386 km, or five days flow time, from Burrinjuck Dam. It is then fed into the irrigation canal system owned and maintained by Murrumbidgee Irrigation Limited (MI). The dam to farm flow time is approximately seven days (Anon. 2017).
The CIA is located in the southern Riverina between Darlington Point and Jerilderie, south of Griffith. It has approximately 491 irrigation farms of about 200 ha each in size. The farms generally have sophisticated layouts and recycling systems to maximise water efficiencies. The major crops produced in this region are rice, wheat, corn, cotton, barley, soybeans and canola as well as a variety of fruit and vegetables. Coleambally Irrigation Co-operative Limited is wholly owned by farmer members and is Australia’s fourth largest irrigation company. It delivers water across 400,000 ha of which 79,000 ha is intensively irrigated (Coleambally Irrigation Co-operative Limited 2017).
• Griffith
•Darlington Point
• Swan Hill
Coleambally •
• Moulamein
• Narrandera
• Leeton
Gundagai •
•Yarrawonga
Albury•
•Wagga Wagga
Hay•
Hume Dam
Blowering Dam
Tantangara Dam
Burrinjuck Dam
Eucumbene
Jindabyne
Murrumbidgee River
Murray River
LachlanRiver
Snowy River
Berembed WeirBundidgerry
Storage
Gogeldrie Weir
Balranald•
Murrumbidgee Irrigation Area
Coleambally Irrigation Area
Other irrigation areas
Figure 21 Map of the Murrumbidgee Valley irrigation catchment (Murrumbidgee Irrigation 2017).

Appe
ndix
IRRIGATED WHEAT IN SOUTHERN CROPPING SYSTEMS 2017 | 53
Murray ValleyThe Murray Valley irrigation region in southern NSW expands from Mulwala in the East to Moulamein in the West (Figure 22). It covers approximately 748,000 ha of farmland and over 2,300 farms. Water is supplied through almost 3,000 km of energy efficient, gravity-fed channels. The Murray River is the main river system supplying the area via the Mulwala Canal from Lake Mulwala. Branches of the Murray River including the Edward River and Wakool River also supply water to irrigation farms located along their paths.
Majority of the water in the Murray Valley is managed by Murray Irrigation Limited, the largest private irrigation company in Australia. Other smaller irrigation schemes include West Corurgan and Moira. Production in the Murray Valley is diverse. Cereals, legumes, rice, pasture and hay, maize, tomatoes, potatoes, onions, fruit, milk, beef cattle, prime lambs and wool all significantly contribute to irrigated agricultural production in the area (Murray Irrigation 2017).
Moulamein•
Albury•
Finley •
Cobram •
• Conargo
Hay•
•Wagga Wagga
Wakool• Deniliquin
•• Berrigan
Mulwala•
Tocumwal•Mathoura •
• Caldwell
• Wentworth
•Echuca
Barham •
Swan Hill•
New South Wales New South Wales
Victoria
Victoria
Murray Irrigation Limited
Murrumbidgee River
Murray River
LachlanRiver
Dar
ling
Rive
r
The
Gre
at A
nabr
anch
of t
he D
arlin
g
HumeReservoir
• Jerilderie
Figure 22 Map of the Murray Valley irrigation catchment (Murray Irrigation 2017).

54 | NSW Department of Primary Industries
Lachlan ValleyThe Lachlan Valley encompasses 84,700 km2 (8,470,000 ha) from Crookwell and Gunning in the East to Oxley and Ivanhoe in the West (Figure 23). The Lachlan River stretches from Yass in the East to near Hay in the West. Wyangala Dam near Cowra is the main water storage on the Lachlan River with a capacity of 1,217,000 ML. Other storages include Lake Cargelligo (36,000 ML), Carcoar Dam (36,000 ML) and Lake Brewster (153,000 ML) (Lachlan Valley Water 2017).
Approximately 1% of the Lachlan Valley land area is under irrigation. The region is renowned for producing high quality lucerne hay and also grows a range of irrigated crops including cereals, cotton, canola, grapes, potatoes, citrus, vegetables and other horticultural crops. Dairying, feedlots and piggeries also depend on river water. The peak body representing irrigators in the Lachlan Valley is Lachlan Valley Water (Lachlan Valley Water 2017).
• West Wyalong
• Forbes
• Parkes
• Temora
• Hillston
• Lake Cargelligo
• Goolgowi
• Ivanhoe
• Gunning
• Young
Condobolin•
• Gilgunnia
Wyangala Dam
Bumbuggan Ck. Weir
Great Cumbung Swamp
Carcoar Dam
• Booligal
Lake Brewster
Island Creek Weir
Condobolin Weir
Kiacatoo Weir
Micabil Weir
Booberoi Weir
Gonowia Weir
Lake Cargelligo Weir
Willandra Weir
Hillston Weir
Torriganny Weir
Booligal Weir
Lake Brewster Weir
Jemalong Weir Cottons
Weir
Lake Cargelligo
Lake Brewster
Belubula River
Lachlan River
Abercrombie River
River flow direction
N
Schematic map not to scale• towns major dam weir water body river system Lachlan catchment
Locality map
Figure 23 Map of the Lachlan Valley irrigation catchment (Lachlan Valley Water 2017).

Appe
ndix
IRRIGATED WHEAT IN SOUTHERN CROPPING SYSTEMS 2017 | 55
North-west VictoriaNorthern Victoria’s water supply is stored, managed and delivered by Goulburn-Murray Water (GMW), in the Goulburn-Murray Irrigation District (GMID). They service a region of 68,000 km2 (6,800,000 ha) from Corryong in the east to Nyah in the west, and the Great Dividing Range in the south to the Murray River in the north (Figure 24). GMW provides water for more than 39,000 customers (surface water and ground water). Approximately 95% of the water supplied by GMW in northern Victoria is used for irrigation (environment 3%; regional towns and communities 2%) (Goulburn-Murray Water 2017).
The western GMID is subdivided into irrigation areas including Torrumbarry (where most experiments for the ‘Southern irrigated cereal and canola varieties achieving target yields’ project were conducted), Pyramid-Boort, Normanville, West Loddon and East Loddon.
The irrigation areas in the northern irrigation areas have a high proportion of dairy operations but also broadacre cropping, livestock, intensive animal production (pigs, poultry and eggs) and horticulture (stone fruit, grapes and vegetables) (Goulburn-Murray Water 2017).
CattanachCanal
Scale (km)
0 50 100 150
N
TorrumbarryWeir
Kerang
Pyramid Hill
Shepparton
Cobram
Wangaratta
Lake Eildon
LakeWilliam
Hovell
LakeEppalock
LakeBuffalo
DartmouthDam
HumeDam
LakeNillahcootie
KOWSWAMP
GoulburnWeir
LaanecoorieReservoir
TullaroopReservoir
NewlynReservoir
Mitta Mitta
River
Kiewa River
Ovens River
King River
Broken
Broken
Creek
River
Goulburn River
Rive
r
Cam
pasp
e
Lodd
on
Rive
r
Macorna Channel
Stuart Murray Canal
East
Gou
lbur
nM
ain
Chan
nel
YarrawongaMain Channel
Yarrawonga Weir
River Murray
River Murray
MilduraWeir
WoorinenIrrigation District
NyahIrrigation
District
TrescoIrrigation District
Great Dividing Range
SugarloafPipeline
GoldfieldsSuperpipe
Cairn CurranReservoir
HepburnsLagoon
Albury
Swan Hill
Kinglake
Tatura
NationalChannel
Waranga Western
Channel
Shepparton
Rochester Campaspe
Loddon Valley
Murray Valley
Central Goulburn
Gravity irrigation (channels)
Torrumbarry, Nyah, Tresco and Woorinen
Pumped irrigation systems
Stock and domestic supply
Rochester
WarangaBasin
Echuca
Loch Garry flood protection
Figure 24 Map of the Goulburn-Murray irrigation district (Goulburn-Murray Water 2017).

56 | NSW Department of Primary Industries
South-east South AustraliaThe Limestone Coast region in the south-east of South Australia is bordered by the South Australian coastline in the west and south, the Victorian border in the east and the South Australian Mallee (township of Keith) in the north (Figure 25). It is supplied with high quality groundwater, the primary (and in some locations the only) source of water. Irrigation uses 90% of water in the Upper Limestone Coast and 56% in the Lower Limestone Coast region (where experiments for the ‘Southern irrigated cereal and canola varieties achieving target yields’ project were conducted). The remaining water is used for forestry, domestic, recreational, industrial, stock and environmental purposes (Primary Industries and Regions SA 2017).
The groundwater is contained in two aquifer systems – the upper unconfined aquifer and a deeper confined aquifer. Water used for irrigation is generally sourced from both aquifers. Groundwater extraction is regulated by regional Water Allocation Plans.
Approximately 82,000 ha of irrigated crops in the Limestone Coast region utilised the groundwater resource in 2008–09. The resource has enabled the expansion of crop and fodder production, as well as the viticulture and horticulture industries.
Tatiara
Padthaway
Lower Limestone Coast
Mallee
Tintinara–Coonalpyn
Wolseley •
• Naracoorte• Lucindale
• Robe
Coonawarra •
• Kingston SE
• Beachport
• Willalooka
• Keith
Bordertown •
• Padthaway
Mt Gambier •
Penola •
• Millicent
0 10 20kilometeres
Vict
oria
South Australia
Figure 25 Map of the Limestone Coast irrigation catchment (Primary Industries and Regions SA).

Appe
ndix
IRRIGATED WHEAT IN SOUTHERN CROPPING SYSTEMS 2017 | 57
TasmaniaTasmania covers a total of 68,000 ha and has several irrigation schemes (Figure 26). The northern region, where the experiments for the project were conducted, includes the Meander River, the Caveside Dairy Plains, Quamby-Osmaston, Rubicon and Hagley pipelines, and the Whitemore, Cressy Longford, North Esk and Lower South Esk irrigation schemes. The main agricultural products from this region are dairy, poppies, potatoes, pyrethrum, vegetables, cereals, canola, pasture seed, berries, hazelnuts and livestock.
Having 13% of the nation’s total annual water run-off, there is potential to significantly increase irrigated agricultural production in Tasmania. A number of water development projects have been undertaken in recent years (and continue currently) to improve the reliability of irrigation water as this is the major factor limiting growth of the primary production sector in Tasmania (Water Connects Us 2017).
Lower South Esk
Midlands
SassafrasWesley Vale
Whitemore
Winnaleah
South East Stage 1
South East Stage 2
Cressy Longford
Kindred North Motton
UpperRingarooma
Dial Blythe
Scottsdale
Great Forester
North Esk
South East Stage 3
Southern Highlands
Greater Meander Valley
Swan Valley
Duck
Adapted from Map No: GEN-M0432-012Date: 10/02/2016Updated by: N. StevensBase data from theLIST,© State of Tasmania
Burnie
Hobart
Sorell
Bothwell
Queenstown
LauncestonDeloraine
Devonport
Smithton
Scottsdale
Key
Tranche 1 Schemes
Tranche 2 Schemes
Existing Schemes
Figure 26 Map of the Tasmanian irrigation catchments (Water Connects Us 2017).

58 | NSW Department of Primary Industries
Appendix 2: constraintsCurrent irrigated cropping production constraints – the growers’ perspective
In 2014, a survey of irrigation farmers in south-eastern Australia (southern NSW and northern Victoria) identified the most common irrigation layouts, crop types and constraints to irrigated farming systems in this region. The survey had a total of 129 respondents.
Irrigation layoutsIrrigation farmers in south-eastern Australia use diverse irrigation layouts to deliver water to crops from flood or surface irrigation to overhead sprinkler systems such as centre pivot or lateral move irrigators.
A major focus for survey respondents is to further improve irrigation layouts utilising terraced/bankless channels, spray irrigation and border check layouts. The infrastructure developments will improve timeliness of crop establishment, reduce opportunity time (water on/off time), improve water use efficiency, increase productivity and reduce labour requirements. Furthermore, it adds dimension to the farming system including enabling the introduction of double cropping.
There has been a dramatic increase in the area irrigated by overhead lateral move or centre pivot irrigators and subsurface drip irrigation across all irrigation areas. In the survey this comprised up to 25% of the area reported by participants. Additionally, more on-farm dams are being constructed to increase bay flow rates and importantly to shorten drainage time.
Irrigated crop typesThe survey identified winter grains (wheat, barley, oats, canola, pulses) as the dominant crop(s) in farming systems in southern NSW and northern Victoria for 49% of respondents, followed by rice (23%) and fodder (12%) across all irrigation areas (Figure 27). When the irrigation areas were separated, the Murray Valley followed a similar trend with winter grains at 54% followed by rice (36%) and fodder (8%). Northern Victoria had an even higher proportion of winter grains (69%) followed by fodder (25%). In contrast, the Murrumbidgee Irrigation Area (MIA) and Coleambally Irrigation Area (CIA) combined had approximately equal proportions of cotton (28%) and rice (26%), closely followed by winter grains (23%).
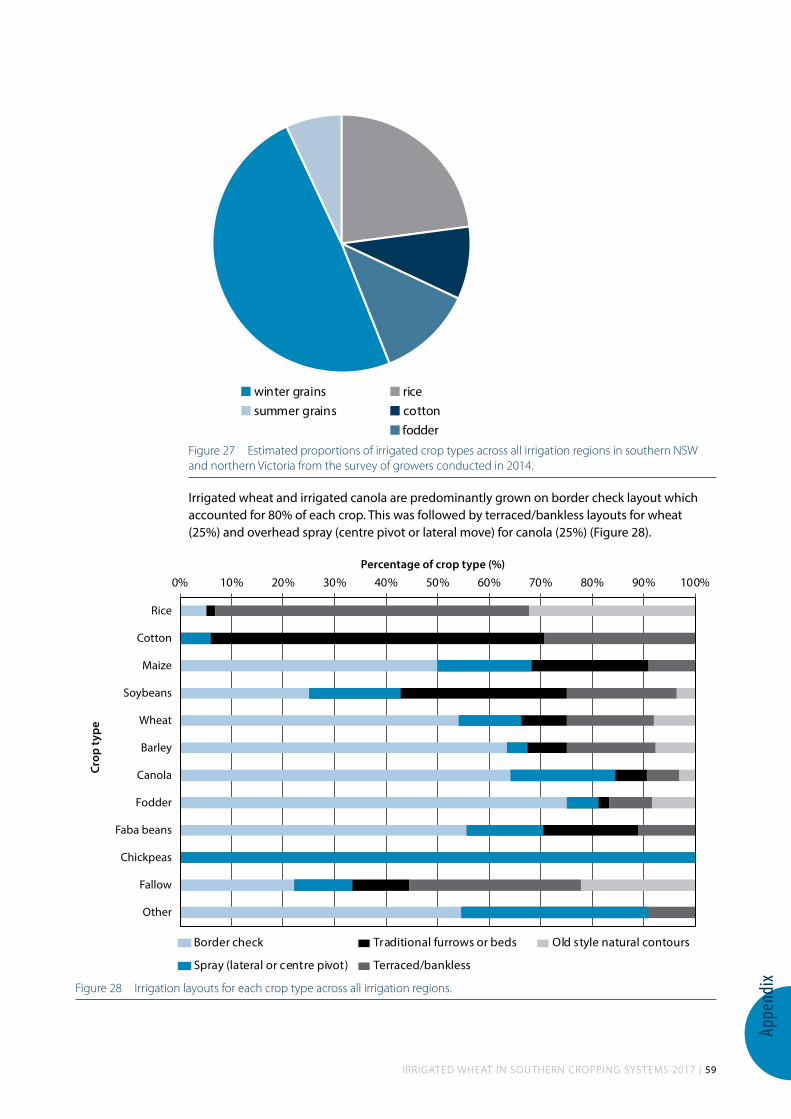
Appe
ndix
IRRIGATED WHEAT IN SOUTHERN CROPPING SYSTEMS 2017 | 59
ricecottonfodder
winter grainssummer grains
Figure 27 Estimated proportions of irrigated crop types across all irrigation regions in southern NSW and northern Victoria from the survey of growers conducted in 2014.
Irrigated wheat and irrigated canola are predominantly grown on border check layout which accounted for 80% of each crop. This was followed by terraced/bankless layouts for wheat (25%) and overhead spray (centre pivot or lateral move) for canola (25%) (Figure 28).
0% 10% 20% 30% 40% 50% 60% 70% 80% 90% 100%
Rice
Cotton
Maize
Soybeans
Wheat
Barley
Canola
Fodder
Faba beans
Chickpeas
Fallow
Other
Percentage of crop type (%)
Crop
type
Border check
Spray (lateral or centre pivot)
Traditional furrows or beds
Terraced/bankless
Old style natural contours
Figure 28 Irrigation layouts for each crop type across all irrigation regions.

60 | NSW Department of Primary Industries
Constraints to irrigated cropping systemsThe survey identified water availability and price as the main constraint to irrigated farming systems with 65% of respondents stating it is a major constraint or severe constraint. This was closely followed by input costs (which may include water costs) with 58% of respondents stating it is a major constraint or severe constraint (Figure 29).
Other significant production constraints identified include plant nutrition, weed control, stubble management and soil constraints.
100 80 60 40 20 0 20 40 60 80
minor constraintno constraint moderate constraint major constraint severe constraint
Water availability/price
Input costs
Nutrition
Weeds
Stubble management
Soil constraints
Irrigation infrastructure
Equipment
Marketing options
Labour availability
Timeliness of sowing
Disease
Technical skills/capacity
Crop maturity
Pests
Variety
Insects
Waterlogging
Herbicide carryover
Figure 29 Constraints to irrigated cropping systems in southern NSW and northern Victoria identified by the survey of growers conducted in 2014 presented as a percentage of total survey respondents (figures rounded to whole numbers).


www.dpi.nsw.gov.au
Irrigated wheat
I N S O U T H E R N C R O P P I N G S Y S T E M S