Embed Size (px)
Citation preview
applied sciences
Article
Iron Recovery from Bauxite Tailings Red Mud byThermal Reduction with Blast Furnace Sludge
Davide Mombelli * , Silvia Barella , Andrea Gruttadauria and Carlo Mapelli
Dipartimento di Meccanica, Politecnico di Milano, via La Masa 1, Milano 20156, Italy;[email protected] (S.B.); [email protected] (A.G.); [email protected] (C.M.)* Correspondence: [email protected]; Tel.: +39-02-2399-8660
Received: 26 September 2019; Accepted: 9 November 2019; Published: 15 November 2019 �����������������
Abstract: More than 100 million tons of red mud were produced annually in the world over theshort time range from 2011 to 2018. Red mud represents one of the metallurgical by-products moredifficult to dispose of due to the high alkalinity (pH 10–13) and storage techniques issues. Up tonow, economically viable commercial processes for the recovery and the reuse of these waste werenot available. Due to the high content of iron oxide (30–60% wt.) red mud ranks as a potentialraw material for the production of iron through a direct route. In this work, a novel process at thelaboratory scale to produce iron sponge (≤ 1300 ◦C) or cast iron (> 1300 ◦C) using blast furnacesludge as a reducing agent is presented. Red mud-reducing agent mixes were reduced in a mufflefurnace at 1200, 1300, and 1500 ◦C for 15 min. Pure graphite and blast furnace sludges were usedas reducing agents with different equivalent carbon concentrations. The results confirmed the blastfurnace sludge as a suitable reducing agent to recover the iron fraction contained in the red mud.For all the conditions tested, the metallization degree was higher than 70%, and the best conditionto reduce red mud through blast furnace sludge was identified at 1:1 red mud/blast furnace (B.F.)sludges equal to 0.85 C/Fe2O3.
Keywords: red mud; blast furnace sludge; reduction; environmental impact; circulareconomy; recycling
1. Introduction
Red muds, or red sludges, are the most concerning and produced industrial waste from primaryaluminum production, i.e., the Bayer process. Depending on the quality of the raw material processed,1–2.5 tons of red mud is generated per ton of alumina produced [1–3]. From 2000 to 2018 aluminaproduction increased from approximately 55 Mt to 130 Mt, mainly due to a fast growth in Chineseproduction capacity [4]. This means about 130–325 Mt of red mud produced in only 2018. This amountof hazardous waste still continues to be one of the most important disposal problems in the miningindustry [5]. Red mud is composed of a mixture of metal oxides. The red color arises from iron oxides,which comprise up to 60% of the mass of the red mud. In addition, the other components includesilica, unleached residual aluminum, titanium oxide [5,6], and rare earth traces [7,8].
Red muds are classified by the EEA (European Environment Agency) as special non-hazardouswaste (EWC 01 03 09), however, a mirror entry exists in the European waste list (EWC 01 03 10 *) [9].This means that the red muds can be classified as absolutely hazardous or not as a function of theirchemical composition, further complicating their management.
Due to their high alkalinity, with a pH ranging from 10 to 13 [2,10,11], red mud cannot be disposedeasily and in most countries where red muds are produced, the cheapest method is to pump them intoholding ponds or lagoons [10,11].
Appl. Sci. 2019, 9, 4902; doi:10.3390/app9224902 www.mdpi.com/journal/applsci

Appl. Sci. 2019, 9, 4902 2 of 23
Unfortunately, only 2–3% of plants dispose of the muds in the sea [12], posing risks to themarine ecosystem.
An alternative and more expensive method consists of repeatedly rinsing the red mud. This redmud suspension, with a density between 1.2 and 1.3 g/cm3 and a dry matter concentration from 250 to350 g/L, is then dried and stacked (dry stacking or dry cake). However, this technique still leads toserious problems, as the cakes take up a large land area that can neither be built on nor farmed, evenwhen the mud is completely dry. The liquid phase of the suspension contains about 7 g/L of Na2O, aserious pollutant due to its high alkalinity, which is dumped in selected and prepared areas, usuallyopen fields, and convoyed to water treatment plants [3,12,13].
The recent ecological disaster occurred in October 2010 at Ajka (Hungary) has drawn attentionto the worrying situation of the red mud basin owned by Eurallumina in Portovesme (Italy). There,20 Mm3 of bauxite residues are lagooned on an area of 120 ha. Even if the Italian red mud is naturallyinertized by the sea water (thanks to the MgO content that neutralizes the caustic soda through theprecipitation of “Bayer” hydrotalcite Mg7Al2OH18(CO32
−, SO42−)·xH2O [14,15]) its polluting footprint
must be considered, especially related to toxic metal leaching. In fact, in Hungary, non-negligibleconcentrations of CrVI into water supplies and surface waters were detected in a large contaminatedarea [16] from the Marcal and Danube rivers [17], as well as high concentrations of biologically availableAl [18].
Many studies focusing on the red mud are mainly oriented to the recovery of alumina andsoda [19–21] or iron, titanium dioxide, and other minor elements, such as vanadium and rareearths [7,22–29]. However, these processes could not be economically justified, leading to economicloss. In general, chemical processes aimed at recovering a constituent of red mud have sufferedfrom inadequate revenues and the creation of further disposal problems. In particular, attempts for autilization of red mud for iron production have a long history [30]. For instance, before and during theSecond World War, the red mud was dried by the German iron and steel industry on deck ovens andsold as a catalyst for the liquid phase of the coal hydrogenation. The active component thereby formedfinely divided iron hydroxide. Until the 1950s, the residues in dried form in quantities of about 3000t/y were returned to the ironworks as iron containing residues. From the 1950s different approachestried to make the iron content of the red mud usable for the steel industry. Rotary kiln process for theprocessing of red mud to obtain sintered iron ore was developed by Krupp. However, the high contentof alkali and the low concentration of iron oxide made the process not sustainable. The endeavor tomake the iron content of the red mud usable was further pursued by other companies. In example,through a variant of the Halomet process (developed for continuous liquid titanium production [31]),direct reduction was achieved with a threefold carbon excess in the form of lignite dust, wherebya drop-shaped deposition of the metallic iron was achieved. The slag still containing 20% carboncould be separated by sieving from the iron. However, the decisive question was whether or not thisprocedure can compete economically with conventional ones. Further attempts were conducted by theLurgi company in 1963, through enrichment experiments using the method of magnetic roasting. Theresidues were treated at 750 ◦C with a CO/CO2 mixture, then ground and separated by wet magnetism.This resulted in a highly enriched fraction with about 52% iron, but their proportion was so low thatthe iron output in the concentrate was only 20% to 25%. A variant of this process was implemented byGiulini GmbH [32]: the drying and sintering of the red mud takes place with the addition of waste coalin rotary kilns, with partial reduction of the Fe2O3 to the metallic iron. A subsequent smelting and theresidual reduction of the sinter is achieved in the hearth melting furnace; the final products are pig ironand granulated slag. The prerequisite for the application of this method is a 45% Fe2O3 content of thestarting material. The process was developed to industrial maturity but stopped for economic reasons.
Red mud as such could be actually used in the manufacture of ceramic materials such as tiles,bricks and insulating materials due to its clay-like structure, however the residue must be thoroughlywashed and dried prior to use, increasing the cost of the recycling process [2,8,33]. Other attemptshave been made for the production of Al2O3-Fe2O3 ceramic fibers [34]. Very recently, a group of

Appl. Sci. 2019, 9, 4902 3 of 23
designers started the production of ceramics made by red muds that can be used to make designobjects like plates, bowls, and vases (the pieces are now undergoing certification for food safety andnon-toxicity) [35]. Also, the chemical industry has made attempts to use bauxite residue as a pHmodifier in the heap leaching of gold ores, in the removal of sulfur compounds from kerosene oil, andthe hydrogenation of anthracene, coals, and aromatic compounds [3,36–41]. Finally, in agriculture redmud have been used for wastewater treatment [42–47]. Unfortunately, despite this ongoing research,economic uses for bauxite residue are virtually non-existent.
In this work a novel attempt is presented, employing the red muds from Portovesme (Italy) asa raw material for the production of iron-based secondary raw material (Direct Reduced Iron (DRI)or cast iron). Unlike what has been proposed in the literature [26,30,48–52], red mud reduction willbe carried out by exploiting another sub-product of the steel industry, the blast furnace sludge as areducing agent. Blast furnace sludge has proven to be able to replace carbon coke in the reduction ofsteelworks dust, zinc, blended iron ore, and jarosite [53–57], thanks to the residual content of unburntcoke [53]. To determine the correct ratio of red mud/blast furnace sludge; the reducibility of thered mud is evaluated using graphite in different proportions. Both the starting raw materials andthe reduction products are characterized from the chemical and metallurgical point of view by XRF,TG-DSC, XRD and scanning electron microscope (SEM). Furthermore, the possibility of obtaining inaddition to the metallic fraction a slag that is easily manageable is also investigated.
2. Materials and Methods
To assess the reducibility of red mud (RM), different blends with variable carbon (C) content wereprepared, keeping the basicity indexes of the slag (BBI = Binary Basicity Index, CBI = Complex BasicityIndex, OB = Optical Basicity) constant, controlled by the addition of lime (CaO). The best conditionsidentified in the first set of experiments (control batch) were replicated by mixing red mud (RM), blastfurnace sludge (B.F. sludge) and lime, keeping the C/Fe2O3 ratio and the basicity indexes constant.By controlling the basicity, the concentration of the different slag-forming oxides can be assumed to beconstant. Thus, the thermal behavior of both the batches (graphite and B.F. sludges) only depends bythe C/Fe2O3 ratio. In this way it is possible to compare the reducibility of the two batches excludinginterferences from other compounds.
2.1. Red Muds Description
The dried red muds (EurAllumina S.p.A., Portovesme (SU), Italy) were employed for the reductiontrials in form of powder, with a particle size ranging from 2 µm to 5 µm, characterized by 21% wt. of ironoxide and Ti oxides (5% wt.). They also contained alkaline oxide, especially Na2O (10% wt.) and CaO(5.5%wt.). Other major constituents were Al2O3 and SiO2 (16%wt. and 10% wt., respectively). From acrystallographic point of view, the raw red mud was mainly formed by gibbsite (γ-Al(OH)3), sodalite(Na4Al3Si3O12Cl), and hematite (Fe2O3) with traces of boehmite (AlOOH), and calcium and sodiumcarbonates. Loss of ignition (LOI) was very high in this kind of waste, reaching approximately the 30%wt., meaning that almost one third of the initial mass is composed by volatile species (i.e., H2O, CO2).
Before proceeding with the red mud/reducing agent blend preparation, the red muds were calcinedin a laboratory muffle furnace at 1000 ◦C for 60 min. This preliminary treatment had the purpose ofeliminating all hydroxide and carbonate species and some dangerous impurities, to make the materialeasier to reduce. After calcining, most of the gibbsite and boehmite decomposed into Al2O3, while thehematite remained unaltered. Al2O3 reacted with the decomposition products of sodalite and SiO2 toform gehlenite. Calcining enabled the concentration of iron oxide, now approximately 30% wt. of theremaining mass. The complete and detailed red mud and its calcine characterization has already beenpublished elsewhere [58]. Chemical composition before and after pre-treatment is reported in Table 1.

Appl. Sci. 2019, 9, 4902 4 of 23
Table 1. ED-XRF chemical composition of the red muds before and after calcining (% by weight).Red mud (RM).
Fe2O3 Al2O3 Na2O SiO2 CaO TiO2 C SO3 ZnO Cl ZrO2 MgO P2O5 PbO Cr2O3 V2O5 K2O MnO LOI
FreshRM 20.89 16.30 10.39 9.80 5.54 5.20 4.01 0.30 0.30 0.27 0.24 0.15 0.15 0.14 0.12 0.10 0.08 0.05 29.78
CalcinedRM 28.26 21.05 13.44 15.69 7.69 7.26 0.02 0.37 0.46 0.39 0.31 0.22 0.20 0.31 0.17 0.13 0.10 0.07 3.78
2.2. Samples Preparation
Two different reducing agents were used: pure graphite (as a control batch) and blast furnacesludges (ILVA S.p.A. in AS, Taranto, Italy). The chemical composition of the blast furnace sludges wasmeasured through energy dispersive X-ray fluorescence (ED-XRF) and the elemental analysis for C arepresented in Table 2.
Table 2. ED-XRF chemical composition of the blast furnace sludges used as reducing agent (% by weight).
MgO Al2O3 SiO2 P2O5 S Cl K2O CaO TiO2 V2O5 Cr2O3 MnO Fe2O3 ZnO PbO Na2O C
0.74 2.62 8.09 0.14 0.64 0.09 0.91 3.60 0.13 0.01 0.01 0.12 30.29 2.08 2.32 1.13 48.9
Lime (Unicalce S.p.A., Lecco, Italy) was added as fluxing material to lower the melting temperatureand favour the formation of slag. The purpose was to keep the same basicity values both for the samplewith graphite and for those with blast furnace sludges so as to have two compounds with similarproperties. To check this hypothesis, the Binary Basicity Index (1), the Complex Basicity Index (2), andthe Optical Basicity (3) were computed [59]. The chemical composition of the lime used in this work isreported in Table 3.
BBI =CaOSiO2
(1)
CBI =Na2O + CaO
Al2O3 + SiO2 + TiO2(2)
OB =∑
iXi · λi where Xi =
ni ·N◦ossi∑i ni ·N◦ossi
. (3)
ni = number of moles of the pure species-i,N◦ossi = number of oxygen atoms composing the pure species-i,λi = optical basicity of the pure species-i.
The optical basicity concept relies on the Lewis approach to acids and bases and was developedfor dealing with chemical problems in non-aqueous, non-protonic media such as silicates, phosphates,and borates which are important in glass making and (as slags) for refining steel. Basic oxides suchas Na2O or CaO are ionic while SO3, P4O10, or SiO2 are covalent, and it is the magnitude of negativecharge borne by the oxygen atoms or ions which governs the degree of acidity or basicity. The oxygenatoms of sulphates, phosphates, or network systems such as silicates bear charges which are betweenthose of their parent oxides. Optical basicity accounts for the physical and chemical behaviour ofphases and gives indications, for example, on the structural modifications in glasses, on the effectiveelectronic charge carried by ions in an oxide, on the M-O bond lengths or on redox equilibria in meltedglasses. This parameter is a measure of the donating electron power of O2
− to the Mn+ cation in MOy
oxide [59,60].
Table 3. Chemical composition of the lime used as a flux agent (% by weight).
CaO MgO C as CO2 S as SO3 SiO2 + Fe2O3 + Al2O3 LOI
96.78 0.46 0.21 0.15 2.01 1.15
Appl. Sci. 2019, 9, 4902 5 of 23
Six different mixes were prepared, four with graphite and two with blast furnace as reducing agent,respectively. Once determined the most promising mixes in term of reduction yield, the C/Fe2O3 ratiowas used as a point of comparison to prepare the red mud/blast furnace sludges mixes. The summaryof the properties of the mixes are reported in Table 4.
Table 4. Chemical composition (% weight), C/Fe2O3 ratio, and basicity indexes of red mud/reducingagent mixes. BBI = Binary Basicity Index, CBI = Complex Basicity Index, OB = Optical Basicity.
Mixes Sample ID RM (% wt.) C Added (% wt.) CaO Lime (% wt.) C/Fe2O3 BBI CBI OB
15% C + 0.3% CaO C1 84.75 12.71 2.54 0.51 0.67 0.55 0.68
25% C + 0.3% CaO C2 78.13 19.53 2.34 0.85 0.67 0.55 0.68
35% C + 0.3% CaO C3 72.46 25.36 2.17 1.19 0.67 0.55 0.67
45% C + 0.3% CaO C4 67.57 30.41 2.03 1.53 0.67 0.55 0.67
25% C + 0.3% CaO A2 51.28 46.15 2.56 0.84 0.69 0.57 0.67
35% C + 0.3% CaO A3 34.84 62.72 2.44 1.18 0.70 0.59 0.66
2.3. Thermal Reduction Tests
Reduction trials were carried out by means of a TG-DSC (thermogravimetry-differential scanningcalorimetry) instrument, both in argon and air atmosphere (flow rate: 2 Nl/h), in order to understand thechemical/phase transformations and mass loss that take place during the reduction process. The sampleswere heated up to 1200 ◦C (with a ramp of 10 ◦C/min) and then cooled to room temperature with aramp of 30 ◦C/min. A muffle furnace was used to carry out the tests on massive samples (2 to 5 g).The samples were brought to 1200, 1300, and 1500 ◦C respectively, and maintained at those temperaturefor 15 min and then cooled to 40 ◦C in a furnace. Graphite crucibles were used to contain the blends.
At the end of the tests, the mass loss was measured. For each condition, three repetitions wereperformed for its subsequent characterization.
To verify the assumptions derived from thermal reduction tests, theoretical mass loss wascalculated, based on stoichiometric reduction reactions. The reliability of each reaction was evaluatedthrough the Ellingham diagram in standard conditions, as a function of the reference temperature(1200 or 1500 ◦C) [61]. The main reactions considered are:
a. 2C + O2 → 2COb. 2Fe2O3 + CO→ 2Fe3O4 + CO2
c. Fe2O3 + 3CO→ 2Fe + 3CO2
d. ZnO + CO → Zn + CO2
e. PbO + CO → Pb + CO2
f. P2O5 + 5CO→ 2P + 5CO2
g. SO3 + 3CO → S + 3CO2
h. Cr2O3 + 3CO → 2Cr + 3CO2
i. MnO + CO→Mn + CO2
j. V2O5 + 5CO→ 2V + 5CO2 .
Potassium, chlorine, zinc and lead were considered lost for evaporation, whereas Na2O, beingblind in complex phases, was assumed staying in the slag [62]. All the remaining oxides having anoxygen potential below V-V2O5 equilibrium (SiO2, TiO2, Al2O3, MgO, CaO) were considered notreducible and passing integrally to the slag.
Specific boundary conditions are reported in the Results and Discussion session.
2.4. Chemical, Crystallographic, and Microstructural Characterization
The morphology of the sludges (red mud and B.F. sludge) and the six mixes before and afterthe roasting cycles, as well as the evaluation of the local chemical composition, were analyzed
Appl. Sci. 2019, 9, 4902 6 of 23
using an electronic scanning microscope (SEM, Zeiss EVO50, Carl Zeiss AG, Oberkochen, Germany)equipped with an energy dispersive spectroscopy (EDS) probe (Oxford INCA, Oxford Instruments,High Wycombe, UK).
The crystallographic analysis was carried out by means of a Bruker D8 Advance inθ-θ configuration(Cu-Kα radiation: λ = 1.54 Å) on 2 g of ground sample (size <100 µm). The samples were analysedbetween 0 and 80 ◦2θ with a Lynks-eye-1 detector and fixed 0.6◦ divergence slit. The qualitative analysiswas performed by Crystal Impact Match! software (version is 3.8.3.151) based on the CrystallographicOpen Database (COD, revision 218120, September 10, 2019).
Sample grinding (<100 µm) was performed using a Retsch PM 400 planetary ball mill (RetschTechnology GmbH, Haan, Germany), using a 100 mL grinding jar and 10 mm zirconia sphering balls.Grinding was carried out at 350 rpm for different times depending on the hardness of the sample.
Iron metallization degree (MD) in the reduced samples was determined by dissolution analysis.Total iron (metallic iron (FeMet) plus unreduced residual iron oxide (FeTot)) was determined in accordancewith ISO 2597 while metallic iron was determined in accordance with ISO 5416. The dissolution of0.4 g of powdered sample (<100 µm) occurs in an alkaline solution of 30 mL of hydrochloric acid(HCl), subject to subsequent thermal cycles and to the addition of other substances such as waterand ammonia. The degree of metallization is determined as the ratio between metallic iron and totaliron (4).
MD =%FeMet
%FeTot. (4)
Due to a hard capacity of separation between metal and slag, both the samples (slag and magneticfraction) were investigated by scanning electron microscope (SEM) equipped with an EDS probe.
3. Results and Discussion
In this paragraph the results of the current investigation are presented, discussing what wasobtained by TG-DSC analysis and muffle furnace reduction tests. Characterization of the slag andmetal fraction are reported at the end of the paragraph.
The best mixing conditions with graphite as reducing agent were defined as 0.85 and 1.19 C/Fe2O3
ratios. Thus, only these two conditions were replicated with blast furnace sludge. In this section thischoice is discussed.
3.1. Thermogravimetric Analysis in Argon
Several endothermic valleys Figure 1, associated to mass variation, can be observed. The reactions,associated to each valley, are:
• 200–400 ◦C
◦ 2Al(OH)3 → Al2O3 + 3H2O◦ 2AlOOH → Al2O3 + H2O◦ Ca(OH)2 → CaO + H2O
• 650 ◦C: MgCO3 →MgO + CO2 (higher for the sample with blast furnace sludges)• 900 ◦C–1100 ◦C:
◦ 3Fe2O3 + C→ 2Fe3O4 + CO◦ Fe3O4 + C→ 3FeO + CO◦ FeO + C→ Fe + CO
• in total: Fe2O3 + 3C → 2Fe + 3CO
Appl. Sci. 2019, 9, 4902 7 of 23
Appl. Sci. 2019, 9, x FOR PEER REVIEW 7 of 23
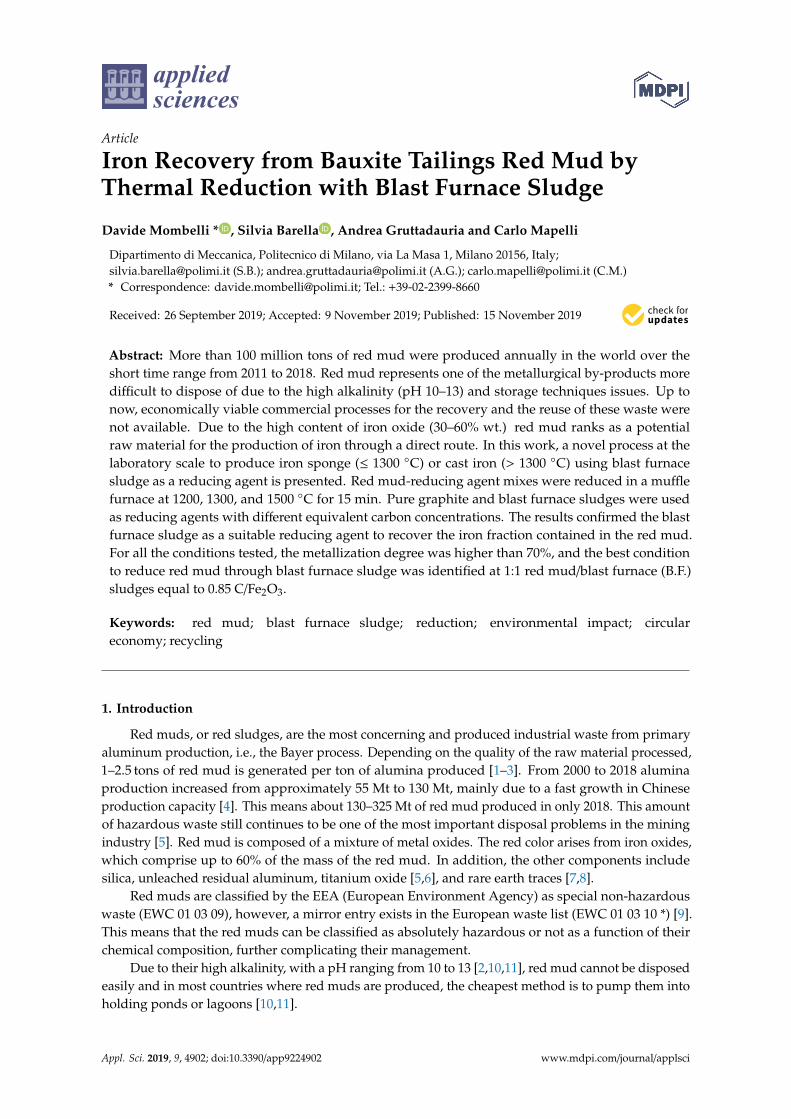
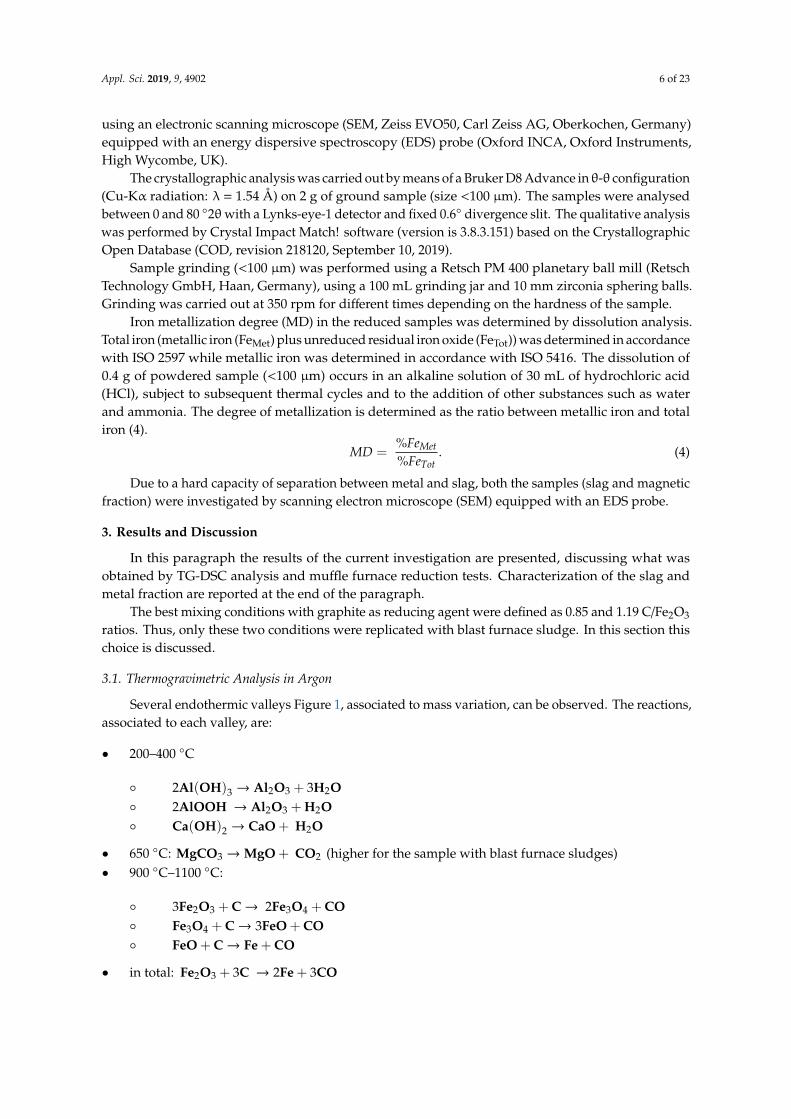
Figure 1. Example of heat flow, thermogravimetry (TG) and first order derivate of thermogravimetry
(dTG) curves for the sample with pure graphite (sample C2—0.85 C/Fe2O3) (a) and with blast furnace
sludges (sample A3—1.18 C/Fe2O3) as reducing agent (b), argon atmosphere. Full line: heat flow;
dash-dot line: TG; dotted line: dTG.
The two valleys, in the range 200–400 °C, are due to the complete dihydroxylation of the residual
gibbsite and boehmite from the previous red mud roasting step. The second peak also belongs to
portlandite dihydroxylation, and is due to the lime that was hydrated after the preparation of the
mixes. The valley at 650 °C, more intense in the sample with blast furnace sludges, is related to the
liming of the magnesite. Magnesite can come from the contact of the red mud with the sea water, and
is capable of significantly reducing the alkalinity of the muds. In blast furnace sludge blends, this
peak appears more intense because MgO was intentionally added to the mix. The weak valley at
about 900 °C and intense one at 1000 °C belong to the first reduction step of Fe2O3 to Fe3O4, and to the
completing reduction and melting of the newly reduced iron [63,64]. The aforementioned peaks are
also detected in the dTG graphs whereas the TG clearly shows as a mass variation when the reduction
process begins.
From the TG-DSC data, some calculations were made. Specific energy of iron melting, overall
mass loss, iron melting temperature, and kinetics parameters were analysed as a function of C/Fe2O3
ratio Figure 2. The analysis of these trends allowed us to highlight the best mixing condition (C/Fe2O3)
that lead to the optimum reduction conditions. Specific energy and mass loss maximization were
considered as the main aspects for optimum definition.
With regard to the iron melting, the area of the ideal triangle formed by the valley at 1000 °C
represents the total specific energy associated to the melting of the iron. The integral was computed
with the trapezium method, and the results are reported in Figure 2a.
Figure 1. Example of heat flow, thermogravimetry (TG) and first order derivate of thermogravimetry(dTG) curves for the sample with pure graphite (sample C2—0.85 C/Fe2O3) (a) and with blast furnacesludges (sample A3—1.18 C/Fe2O3) as reducing agent (b), argon atmosphere. Full line: heat flow;dash-dot line: TG; dotted line: dTG.
The two valleys, in the range 200–400 ◦C, are due to the complete dihydroxylation of the residualgibbsite and boehmite from the previous red mud roasting step. The second peak also belongs toportlandite dihydroxylation, and is due to the lime that was hydrated after the preparation of themixes. The valley at 650 ◦C, more intense in the sample with blast furnace sludges, is related to theliming of the magnesite. Magnesite can come from the contact of the red mud with the sea water,and is capable of significantly reducing the alkalinity of the muds. In blast furnace sludge blends,this peak appears more intense because MgO was intentionally added to the mix. The weak valley atabout 900 ◦C and intense one at 1000 ◦C belong to the first reduction step of Fe2O3 to Fe3O4, and to thecompleting reduction and melting of the newly reduced iron [63,64]. The aforementioned peaks arealso detected in the dTG graphs whereas the TG clearly shows as a mass variation when the reductionprocess begins.
From the TG-DSC data, some calculations were made. Specific energy of iron melting, overallmass loss, iron melting temperature, and kinetics parameters were analysed as a function of C/Fe2O3
ratio Figure 2. The analysis of these trends allowed us to highlight the best mixing condition (C/Fe2O3)that lead to the optimum reduction conditions. Specific energy and mass loss maximization wereconsidered as the main aspects for optimum definition.
With regard to the iron melting, the area of the ideal triangle formed by the valley at 1000 ◦Crepresents the total specific energy associated to the melting of the iron. The integral was computedwith the trapezium method, and the results are reported in Figure 2a.
Appl. Sci. 2019, 9, 4902 8 of 23
Appl. Sci. 2019, 9, x FOR PEER REVIEW 8 of 23
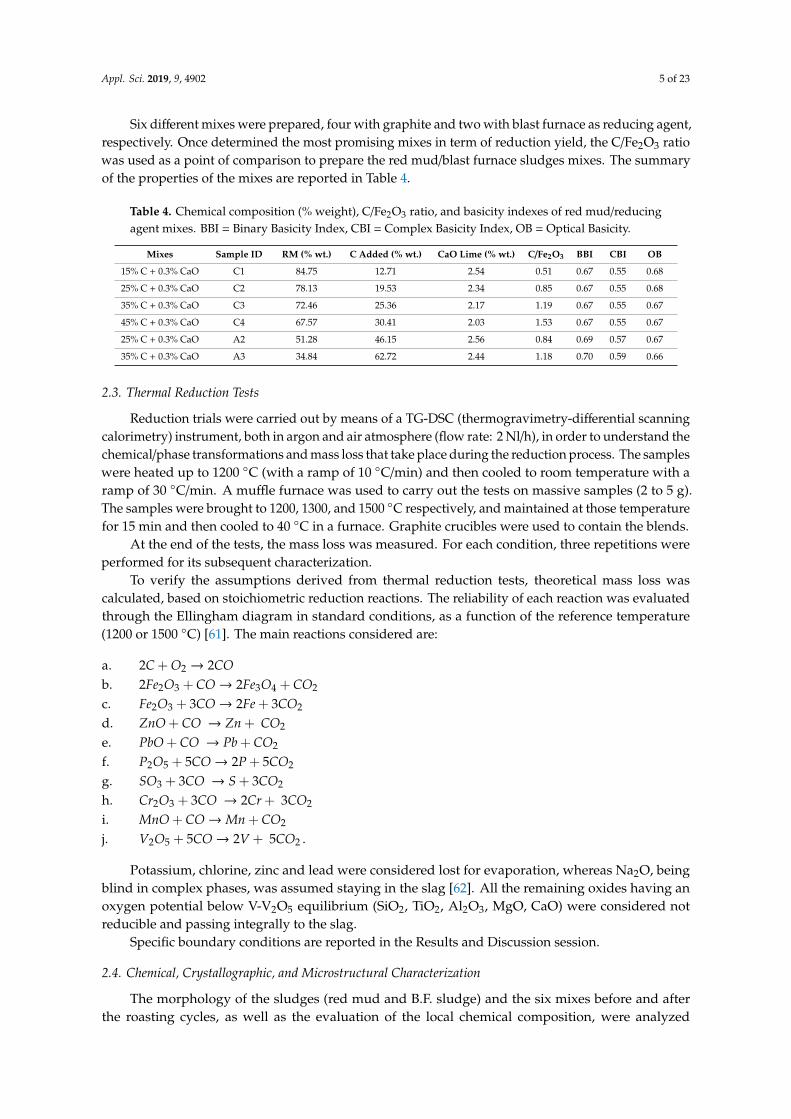
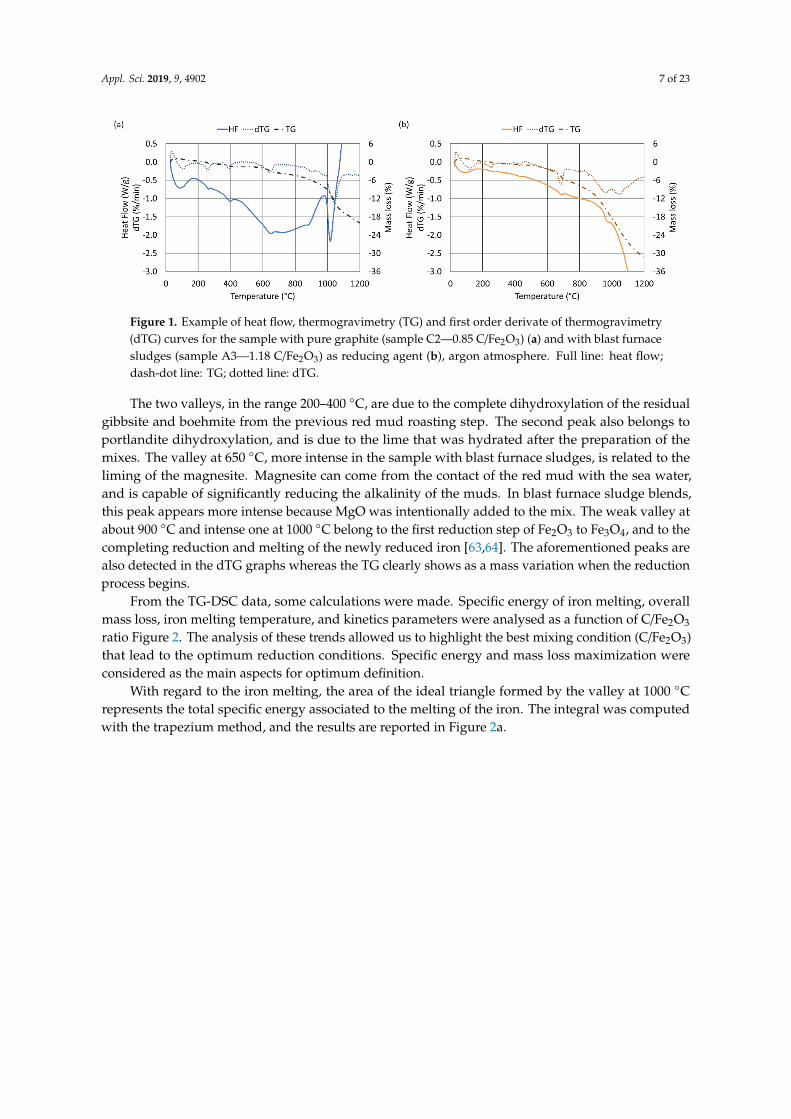
Figure 2. Specific energy of the cast iron melting peak (a), total mass loss (b), temperature of the iron
melting, (c) and transformation rate parameters (d) as a function of C/Fe2O3 ratio. Argon atmosphere.
TG-DSC results show different behaviour in samples with graphite and B.F. sludges. Increasing
the C/Fe2O3 ratio, the specific energy associated to the melting of iron increases up to 1.19 C/Fe2O3
Figure 2a. The sample at 1.53 C/Fe2O3 (C4) shows a value, similar to that observed for 0.51 C/Fe2O3
ratio (sample C1). This behaviour is probably because in sample C1 the carbon is not enough to
reduce all the hematite, while in samples with 1.53 C/Fe2O3 there is an excess of carbon. The excess of
C in sample C4, being the test in Ar and the mass constant for all the tests, reduces the amount of
Fe2O3 available for reduction. Fe2O3 is totally reduced to Fe but the absolute amount is so small that
it results in a weak endothermic valley. In other words, the formed iron is so in low amount that it
gives a low energy associated with its formation. Therefore, the best result in terms of amount of
attained iron seems obtained in the sample with 1.19 C/Fe2O3. However, the behaviour relating to the
loss of mass as a function of C/Fe2O3 Figure 2b does not comply with the expected trend as reported
in Figure 2a, and as observed during the reduction of jarosite [57]. The highest mass loss (~20% wt.)
was registered for 0.85 C/Fe2O3, for the sample with 1.19 (~18.5% wt.). The lowest mass loss observed
for 1.53 C/Fe2O3 (~16.5% wt.) confirms the hypothesis that in this sample the excess of carbon
negatively affects the yield of the reduced product. Therefore, in relation to mass loss, the 0.85 C/Fe2O3
sample seems to have the best conditions to maximize the reduction yield. For this reason, these two
C/Fe2O3 (0.85 and 1.19) were replicated by using B.F. sludges as a reducing agent.
It is worth mentioning that the value of the specific energy for the sample with blast furnace
sludges follows a similar trend to the graphite reduced sample in Figure 2a. This is the first suggestion
that it is possible to recover the iron in the red mud using blast furnace sludges in the same way as
with C, which has already been demonstrated in other papers by the same authors [53,57]. Another
aspect that plays in favour to the use of B.F. sludges as a reducing agent is that the amount of specific
energy involved in the reduction and melting of iron is lower for samples A2 and A3 than for C2 and
C3. This means, from an industrial scale up point-of-view, that the treatment of red muds by B.F.
sludges will be less energy demanding than the same process with a conventional reducing agent.
The mass loss for B.F. sludges reduced samples (A2, A3) in Figure 2b, increases concordantly
with the specific energy and for 1.19 C/Fe2O3 sample, the final mass loss was higher than 31% wt., a
Figure 2. Specific energy of the cast iron melting peak (a), total mass loss (b), temperature of the ironmelting, (c) and transformation rate parameters (d) as a function of C/Fe2O3 ratio. Argon atmosphere.
TG-DSC results show different behaviour in samples with graphite and B.F. sludges. Increasingthe C/Fe2O3 ratio, the specific energy associated to the melting of iron increases up to 1.19 C/Fe2O3
Figure 2a. The sample at 1.53 C/Fe2O3 (C4) shows a value, similar to that observed for 0.51 C/Fe2O3
ratio (sample C1). This behaviour is probably because in sample C1 the carbon is not enough to reduceall the hematite, while in samples with 1.53 C/Fe2O3 there is an excess of carbon. The excess of C insample C4, being the test in Ar and the mass constant for all the tests, reduces the amount of Fe2O3
available for reduction. Fe2O3 is totally reduced to Fe but the absolute amount is so small that it resultsin a weak endothermic valley. In other words, the formed iron is so in low amount that it gives alow energy associated with its formation. Therefore, the best result in terms of amount of attainediron seems obtained in the sample with 1.19 C/Fe2O3. However, the behaviour relating to the lossof mass as a function of C/Fe2O3 Figure 2b does not comply with the expected trend as reported inFigure 2a, and as observed during the reduction of jarosite [57]. The highest mass loss (~20% wt.) wasregistered for 0.85 C/Fe2O3, for the sample with 1.19 (~18.5% wt.). The lowest mass loss observed for1.53 C/Fe2O3 (~16.5% wt.) confirms the hypothesis that in this sample the excess of carbon negativelyaffects the yield of the reduced product. Therefore, in relation to mass loss, the 0.85 C/Fe2O3 sampleseems to have the best conditions to maximize the reduction yield. For this reason, these two C/Fe2O3
(0.85 and 1.19) were replicated by using B.F. sludges as a reducing agent.It is worth mentioning that the value of the specific energy for the sample with blast furnace
sludges follows a similar trend to the graphite reduced sample in Figure 2a. This is the first suggestionthat it is possible to recover the iron in the red mud using blast furnace sludges in the same way as withC, which has already been demonstrated in other papers by the same authors [53,57]. Another aspectthat plays in favour to the use of B.F. sludges as a reducing agent is that the amount of specific energyinvolved in the reduction and melting of iron is lower for samples A2 and A3 than for C2 and C3. Thismeans, from an industrial scale up point-of-view, that the treatment of red muds by B.F. sludges willbe less energy demanding than the same process with a conventional reducing agent.

Appl. Sci. 2019, 9, 4902 9 of 23
The mass loss for B.F. sludges reduced samples (A2, A3) in Figure 2b, increases concordantlywith the specific energy and for 1.19 C/Fe2O3 sample, the final mass loss was higher than 31% wt., a70% more than the mutual sample reduced by graphite. This means that by the use of B.F. sludges asreducing agent, the yield of reduction can be higher.
The TG-DSC results allow to state that the temperate at the melting of the iron takes place Figure 2cdecreases as increasing the carbon concentration. Moreover, in samples mixed with B.F. sludges, themelting temperature of iron is 50 ◦C lower than the samples mixed with graphite. This is probably dueto the coke contained in this sludge, which has a better reactivity than pure graphite. This is anotherelement that highlights how B.F. sludges are a performant reducing agent. These results are consistentwith the research from Rao et al. [65].
From a kinetic point of view, the maximum transformation rate during iron melting and itstemperature were plotted as a function of C/Fe2O3 ratio in Figure 2d. A similar trend for the maximumtransformation rate was observed for graphite reduced samples with respect to the specific energy.The fastest reduction rate (1.08%/min) was, indeed, observed for the 0.85 C/Fe2O3 ratio. Also, thetemperature at which the maximum transformation rate takes place decreases as the C/Fe2O3 ratioincreases, as well as already observed for the temperature associated to the iron melting. Likely, moreavailable C favours both the thermodynamics and the kinetics of iron reduction and melting.
Again, samples reduced using B.F. sludges show slightly different behaviour, in agreement withprevious observations. For instance, the maximum transformation rate was observed at 1.19 C/Fe2O3.However, it seems that the reduction promoted by B.F. sludges is a bit slower than the pure graphite(1.08 and 0.9 at 1.19 C/Fe2O3 for graphite and B.F. sludges, respectively). Likely, this is because thereduction and melting of iron in samples A2 and A3 occur at lower temperature, thus requiring moretime to be completed. This hypothesis seems supported by the fact that the temperature correspondingto the maximum transformation rate is 15 ◦C higher for the B.F. sludge reduced samples with respectto the mutual ones reduced by graphite.
3.2. Thermogravimetric Analysis in Air
The same analysis was led on TG-DSC test results in air atmosphere. The samples reducedthrough blast furnace sludges show the same behaviour as the one reduced though graphite.
Figure 3 reports the DSC, TG and dTG lines. From Figure 3a,b, four peaks can be determined.The reactions related to each peak are:
• 200–400 ◦C
◦ Al(OH)2→Al2O3+3H2O◦ AlOOH→Al2O3+H2O◦ Ca(OH)2→CaO+ H2O.
• 600 ◦C–800 ◦C:
◦ C+ O2→CO2
◦ 2C+ O2→2CO◦ but also 3Fe2O3+CO→ 2Fe3O4+ CO2.
Appl. Sci. 2019, 9, 4902 10 of 23
Appl. Sci. 2019, 9, x FOR PEER REVIEW 9 of 23
70% more than the mutual sample reduced by graphite. This means that by the use of B.F. sludges as
reducing agent, the yield of reduction can be higher.
The TG-DSC results allow to state that the temperate at the melting of the iron takes place Figure
2c decreases as increasing the carbon concentration. Moreover, in samples mixed with B.F. sludges,
the melting temperature of iron is 50 °C lower than the samples mixed with graphite. This is probably
due to the coke contained in this sludge, which has a better reactivity than pure graphite. This is
another element that highlights how B.F. sludges are a performant reducing agent. These results are
consistent with the research from Rao et al. [65].
From a kinetic point of view, the maximum transformation rate during iron melting and its
temperature were plotted as a function of C/Fe2O3 ratio in Figure 2d. A similar trend for the maximum
transformation rate was observed for graphite reduced samples with respect to the specific energy.
The fastest reduction rate (1.08%/min) was, indeed, observed for the 0.85 C/Fe2O3 ratio. Also, the
temperature at which the maximum transformation rate takes place decreases as the C/Fe2O3 ratio
increases, as well as already observed for the temperature associated to the iron melting. Likely, more
available C favours both the thermodynamics and the kinetics of iron reduction and melting.
Again, samples reduced using B.F. sludges show slightly different behaviour, in agreement with
previous observations. For instance, the maximum transformation rate was observed at 1.19 C/Fe2O3.
However, it seems that the reduction promoted by B.F. sludges is a bit slower than the pure graphite
(1.08 and 0.9 at 1.19 C/Fe2O3 for graphite and B.F. sludges, respectively). Likely, this is because the
reduction and melting of iron in samples A2 and A3 occur at lower temperature, thus requiring more
time to be completed. This hypothesis seems supported by the fact that the temperature
corresponding to the maximum transformation rate is 15 °C higher for the B.F. sludge reduced
samples with respect to the mutual ones reduced by graphite.
3.2. Thermogravimetric Analysis in Air
The same analysis was led on TG-DSC test results in air atmosphere. The samples reduced
through blast furnace sludges show the same behaviour as the one reduced though graphite.
Figure 3 reports the DSC, TG and dTG lines. From Figure 3a,b, four peaks can be determined.
The reactions related to each peak are:
200–400 °C
o 𝑨𝒍(𝑶𝑯)𝟐 → 𝑨𝒍𝟐𝑶𝟑 + 𝟑𝑯𝟐𝑶
o 𝑨𝒍𝑶𝑶𝑯 → 𝑨𝒍𝟐𝑶𝟑 + 𝑯𝟐𝑶
o 𝐂𝐚(𝐎𝐇)𝟐 → 𝐂𝐚𝐎 + 𝐇𝟐𝐎.
600 °C–800 °C:
o 𝑪 + 𝑶𝟐 → 𝑪𝑶𝟐
o 𝟐𝑪 + 𝑶𝟐 → 𝟐𝑪𝑶
o but also 𝟑𝑭𝒆𝟐𝑶𝟑 + 𝑪𝑶 → 𝟐𝑭𝒆𝟑𝑶𝟒 + 𝑪𝑶𝟐.
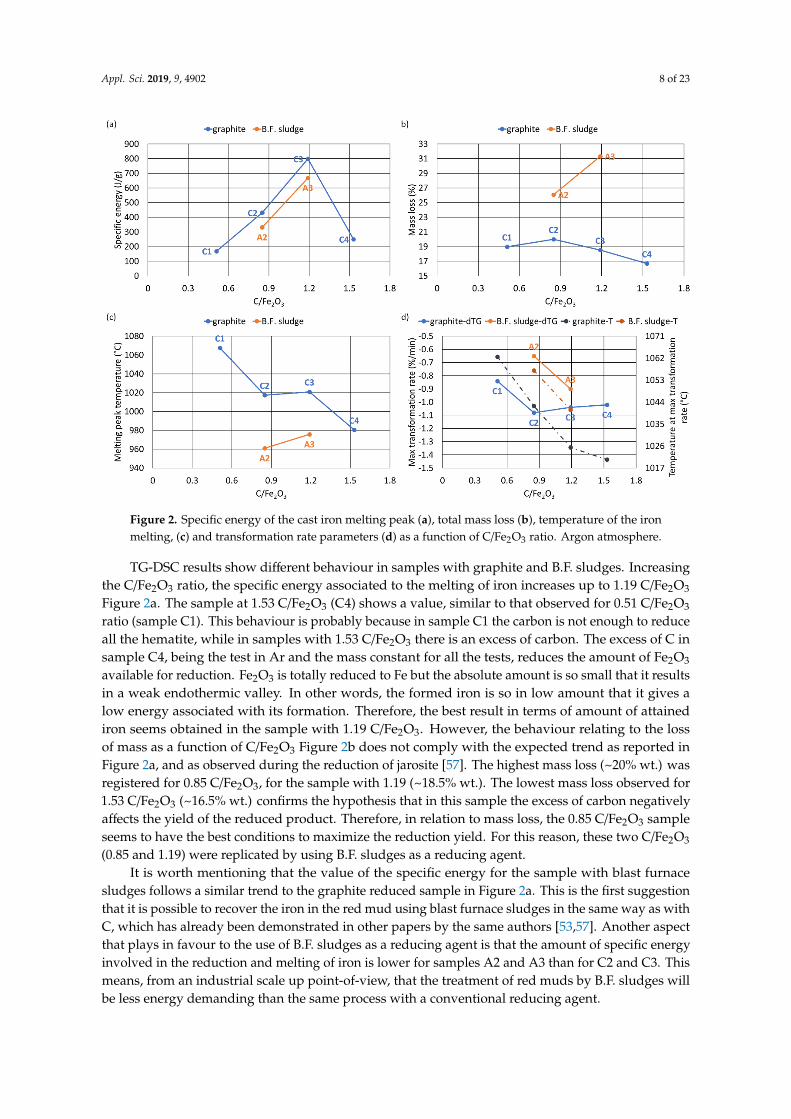
Figure 3. Example of heat flow, TG and dTG curves for the sample with pure graphite (sample C2—
0.85 C/Fe2O3) (a) and example of heat flow, TG and dTG curves for the sample with blast furnace
Figure 3. Example of heat flow, TG and dTG curves for the sample with pure graphite (sample C2—0.85C/Fe2O3) (a) and example of heat flow, TG and dTG curves for the sample with blast furnace sludges(sample A3—1.18 C/Fe2O3) as reducing agent (b). Air atmosphere. Full line: heat flow; dash-dot line:TG; dotted line: dTG.
The two valleys at 200–400 ◦C in the heat flow lines (not well defined in TG and dTG signals)are the same already discussed for TG-DSC experiments in Ar. A great exothermic peak, starting ataround 600 ◦C and ending at 800 ◦C is visible in Figure 3, for both graphite and B.F. sludges reducedsamples. The first reaction that takes place is the formation of CO2, however at 700 ◦C, CO2 is unstableand reacts with C to form CO, in addition C directly reacts with oxygen, giving CO.
At this temperature also trace of hematite to magnetite reduction can happen as detected in similarexperiments [53,57]. Complete reduction of magnetite to iron is not possible in this experimentalcondition due to the fact that the CO formed was carried away by the continuously renewed airatmosphere. Thus, only a partial reduction of hematite into magnetite would be expected since thisreaction can develop completely at 750 ◦C with few ppm of CO.
To validate the previous deductions, the theoretical loss of mass was computed, taking intoaccount the following assumptions, as the sum of:
• the loss of all the carbon contained in each sample (reaction a, Section 2.3);• the loss of the all oxygen contained in the Fe2O3 content when it is reduced to Fe3O4 (reaction b,
Section 2.3);• no further reductions to FeO or Fe were counted, as the CO atmosphere was not enough to carry
out such reactions;• the loss of all the oxygen contained in the oxides owing a standard oxygen potential higher than
CO at 1200 ◦C (ZnO, PbO, P2O5, SO3, and Cr2O3) (reactions d to h, Section 2.3).
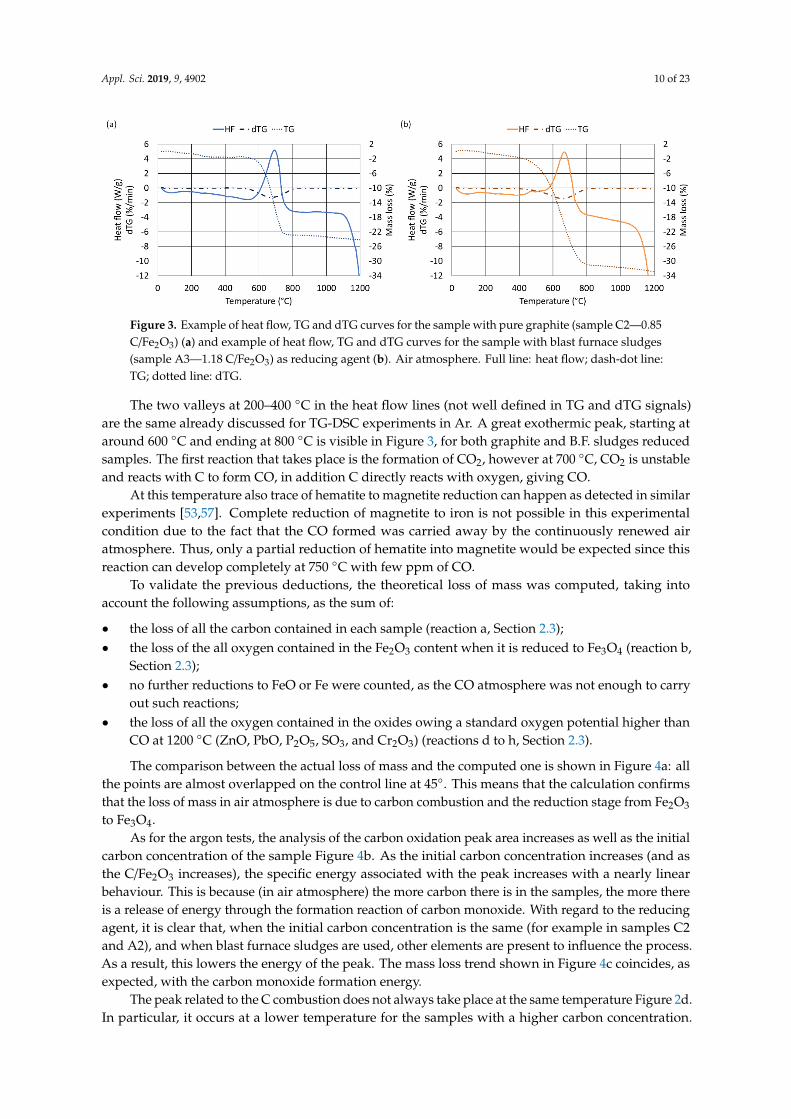
The comparison between the actual loss of mass and the computed one is shown in Figure 4a: allthe points are almost overlapped on the control line at 45◦. This means that the calculation confirmsthat the loss of mass in air atmosphere is due to carbon combustion and the reduction stage from Fe2O3
to Fe3O4.As for the argon tests, the analysis of the carbon oxidation peak area increases as well as the initial
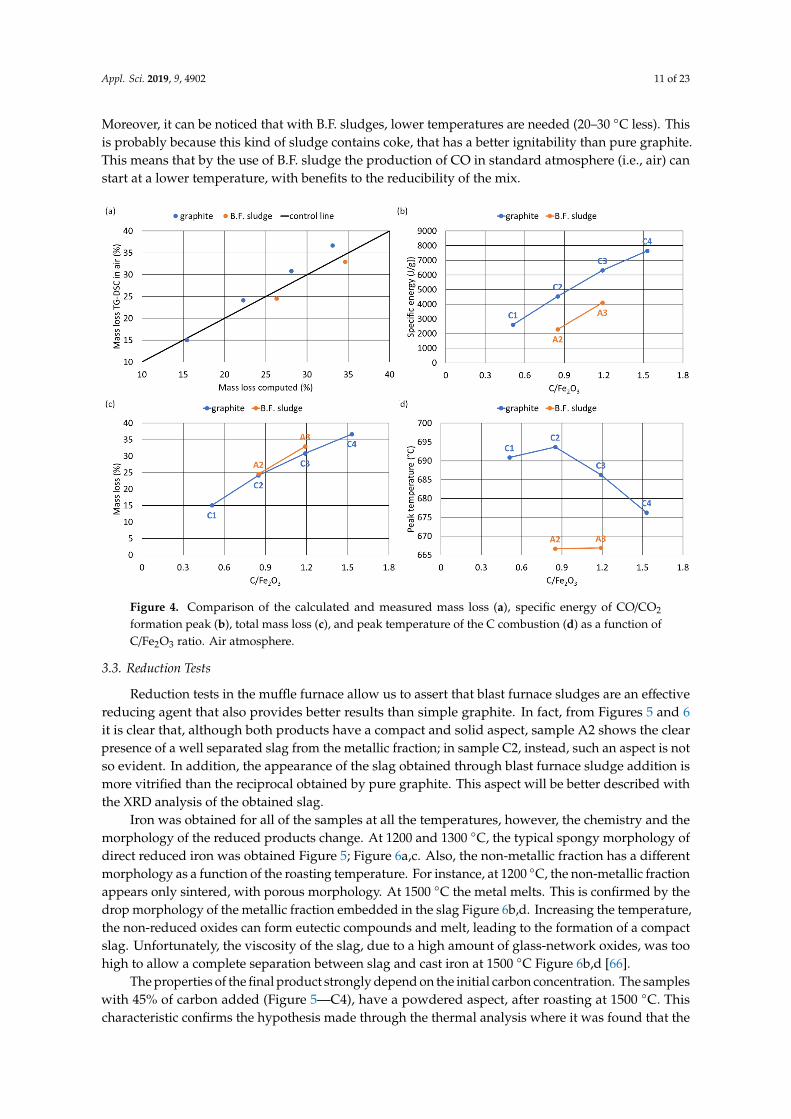
carbon concentration of the sample Figure 4b. As the initial carbon concentration increases (and asthe C/Fe2O3 increases), the specific energy associated with the peak increases with a nearly linearbehaviour. This is because (in air atmosphere) the more carbon there is in the samples, the more thereis a release of energy through the formation reaction of carbon monoxide. With regard to the reducingagent, it is clear that, when the initial carbon concentration is the same (for example in samples C2and A2), and when blast furnace sludges are used, other elements are present to influence the process.As a result, this lowers the energy of the peak. The mass loss trend shown in Figure 4c coincides, asexpected, with the carbon monoxide formation energy.
The peak related to the C combustion does not always take place at the same temperature Figure 2d.In particular, it occurs at a lower temperature for the samples with a higher carbon concentration.
Appl. Sci. 2019, 9, 4902 11 of 23
Moreover, it can be noticed that with B.F. sludges, lower temperatures are needed (20–30 ◦C less). Thisis probably because this kind of sludge contains coke, that has a better ignitability than pure graphite.This means that by the use of B.F. sludge the production of CO in standard atmosphere (i.e., air) canstart at a lower temperature, with benefits to the reducibility of the mix.Appl. Sci. 2019, 9, x FOR PEER REVIEW 11 of 23
Figure 4. Comparison of the calculated and measured mass loss (a), specific energy of CO/CO2
formation peak (b), total mass loss (c), and peak temperature of the C combustion (d) as a function of
C/Fe2O3 ratio. Air atmosphere.
3.3. Reduction Tests
Reduction tests in the muffle furnace allow us to assert that blast furnace sludges are an effective
reducing agent that also provides better results than simple graphite. In fact, from Figures 5 and 6 it
is clear that, although both products have a compact and solid aspect, sample A2 shows the clear
presence of a well separated slag from the metallic fraction; in sample C2, instead, such an aspect is
not so evident. In addition, the appearance of the slag obtained through blast furnace sludge addition
is more vitrified than the reciprocal obtained by pure graphite. This aspect will be better described
with the XRD analysis of the obtained slag.
Iron was obtained for all of the samples at all the temperatures, however, the chemistry and the
morphology of the reduced products change. At 1200 and 1300 °C, the typical spongy morphology
of direct reduced iron was obtained Figure 5; Figure 6a,c. Also, the non-metallic fraction has a
different morphology as a function of the roasting temperature. For instance, at 1200 °C, the non-
metallic fraction appears only sintered, with porous morphology. At 1500 °C the metal melts. This is
confirmed by the drop morphology of the metallic fraction embedded in the slag Figure 6b,d.
Increasing the temperature, the non-reduced oxides can form eutectic compounds and melt, leading
to the formation of a compact slag. Unfortunately, the viscosity of the slag, due to a high amount of
glass-network oxides, was too high to allow a complete separation between slag and cast iron at 1500
°C Figure 6b,d [66].
The properties of the final product strongly depend on the initial carbon concentration. The
samples with 45% of carbon added (Figure 5—C4), have a powdered aspect, after roasting at 1500 °C.
This characteristic confirms the hypothesis made through the thermal analysis where it was found
that the aforementioned mix has the lowest values of specific energy and therefore would show few
metallic fractions with high unburned graphite and not compacted slag. Also, the samples with the
highest specific energy associate to the melting of iron (C3 and A3) showed a less compact
morphology, whereas the samples at 25% of equivalent C (A2, C2) showed a good compromise
between reduction and compactness.
Figure 4. Comparison of the calculated and measured mass loss (a), specific energy of CO/CO2
formation peak (b), total mass loss (c), and peak temperature of the C combustion (d) as a function ofC/Fe2O3 ratio. Air atmosphere.
3.3. Reduction Tests
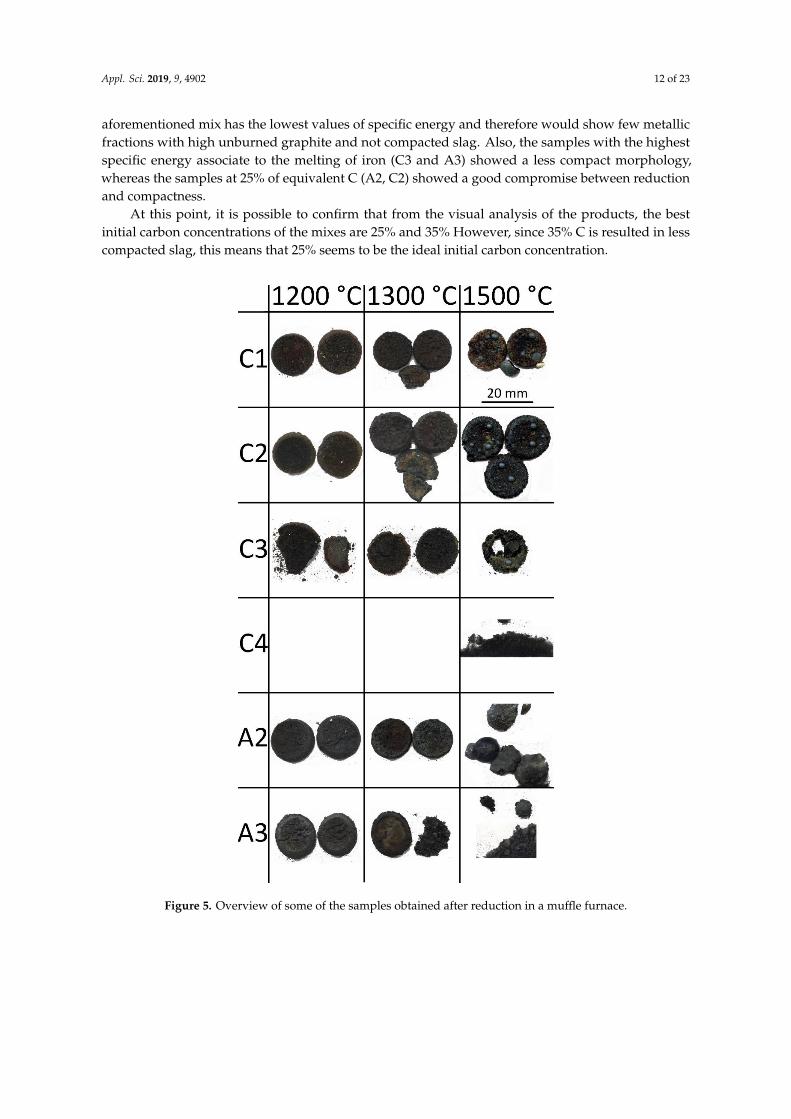
Reduction tests in the muffle furnace allow us to assert that blast furnace sludges are an effectivereducing agent that also provides better results than simple graphite. In fact, from Figures 5 and 6it is clear that, although both products have a compact and solid aspect, sample A2 shows the clearpresence of a well separated slag from the metallic fraction; in sample C2, instead, such an aspect is notso evident. In addition, the appearance of the slag obtained through blast furnace sludge addition ismore vitrified than the reciprocal obtained by pure graphite. This aspect will be better described withthe XRD analysis of the obtained slag.
Iron was obtained for all of the samples at all the temperatures, however, the chemistry and themorphology of the reduced products change. At 1200 and 1300 ◦C, the typical spongy morphology ofdirect reduced iron was obtained Figure 5; Figure 6a,c. Also, the non-metallic fraction has a differentmorphology as a function of the roasting temperature. For instance, at 1200 ◦C, the non-metallic fractionappears only sintered, with porous morphology. At 1500 ◦C the metal melts. This is confirmed by thedrop morphology of the metallic fraction embedded in the slag Figure 6b,d. Increasing the temperature,the non-reduced oxides can form eutectic compounds and melt, leading to the formation of a compactslag. Unfortunately, the viscosity of the slag, due to a high amount of glass-network oxides, was toohigh to allow a complete separation between slag and cast iron at 1500 ◦C Figure 6b,d [66].
The properties of the final product strongly depend on the initial carbon concentration. The sampleswith 45% of carbon added (Figure 5—C4), have a powdered aspect, after roasting at 1500 ◦C. Thischaracteristic confirms the hypothesis made through the thermal analysis where it was found that the
Appl. Sci. 2019, 9, 4902 12 of 23
aforementioned mix has the lowest values of specific energy and therefore would show few metallicfractions with high unburned graphite and not compacted slag. Also, the samples with the highestspecific energy associate to the melting of iron (C3 and A3) showed a less compact morphology,whereas the samples at 25% of equivalent C (A2, C2) showed a good compromise between reductionand compactness.
At this point, it is possible to confirm that from the visual analysis of the products, the bestinitial carbon concentrations of the mixes are 25% and 35% However, since 35% C is resulted in lesscompacted slag, this means that 25% seems to be the ideal initial carbon concentration.
Appl. Sci. 2019, 9, x FOR PEER REVIEW 12 of 23
At this point, it is possible to confirm that from the visual analysis of the products, the best initial
carbon concentrations of the mixes are 25% and 35% However, since 35% C is resulted in less
compacted slag, this means that 25% seems to be the ideal initial carbon concentration.
Figure 5. Overview of some of the samples obtained after reduction in a muffle furnace. Figure 5. Overview of some of the samples obtained after reduction in a muffle furnace.

Appl. Sci. 2019, 9, 4902 13 of 23
Appl. Sci. 2019, 9, x FOR PEER REVIEW 13 of 23
Figure 6. Stereo microscope images of the sample reduced through graphite (C2) at (a) 1200 °C; (b)
1500 °C and blast furnace sludges (A2) (c) 1200 °C; (d) 1500 °C.
The amount of metallic material that can be obtained from each sample is of great importance.
A comparison between the theoretical maximum amount of cast iron that should be obtained at 1500
°C and the actual fraction measured according to ISO 2597 was performed Figure 7a. For the
computation of the expected amount of metal, all the Fe2O3 (reaction c) and reducible oxides
(reactions d to j) were considered completely reduced to metal (by considering the carbon available).
The comparison was made for the samples roasted at 1500 °C. At this temperature Mn and V oxides
were considered completely reduced. Through computation, the metallic fraction was overestimated
by a systematic difference between measured and calculated of about 5%. This is likely due to the
inability to forecast the amount of post-oxidized metal that actually forms during the cooling step of
the roasting cycle. Moreover, the amount of non-reacted carbon cannot be estimated, because the
partial pressure of CO and CO2 cannot be measured in the furnace.
By observing the trend of FeMet as a function of C/Fe2O3, it can be noted that it agrees with the
variation of the specific energy Figure 7b. For instance, at 1200 °C, it proportionally increases with
the C/Fe2O3 ratio whereas at 1500 °C, the final amount of metallic fraction is weakly lower, confirming
that at higher temperature a part of the new formed iron reoxidizes during the cooling step.
The residual C amount was determined through elemental analysis and plotted in Figure 7c.
The figure confirms the results derived from TG-DSC analysis and visual inspection. Increasing the
amount of C available, the amount of residual C in the reduced product increases. In addition,
increasing the temperatures lead to an increase of the residual carbon mass in the reduced material.
Probably, this happen because the exceeding carbon cannot completely burn out due to a sort of
protection of the already formed CO. In addition, during the cooling step of the roasting treatment,
part of the unreacted CO decomposes again, below 700 °C, depositing C. This behaviour was evident
in the control batch samples (C series) whereas for the B.F. sludge reduced samples, the residual C
was almost constant and at a very low concentration. Probably, since in the B.F. sludge the C-bearing
material is coke, it starts to form CO at a lower temperature than graphite (as stated in Figure 4d)
giving time to completely reacts with reducible oxides thus, by consuming itself more homogenously
during the heating step.
Figure 6. Stereo microscope images of the sample reduced through graphite (C2) at (a) 1200 ◦C;(b) 1500 ◦C and blast furnace sludges (A2) (c) 1200 ◦C; (d) 1500 ◦C.
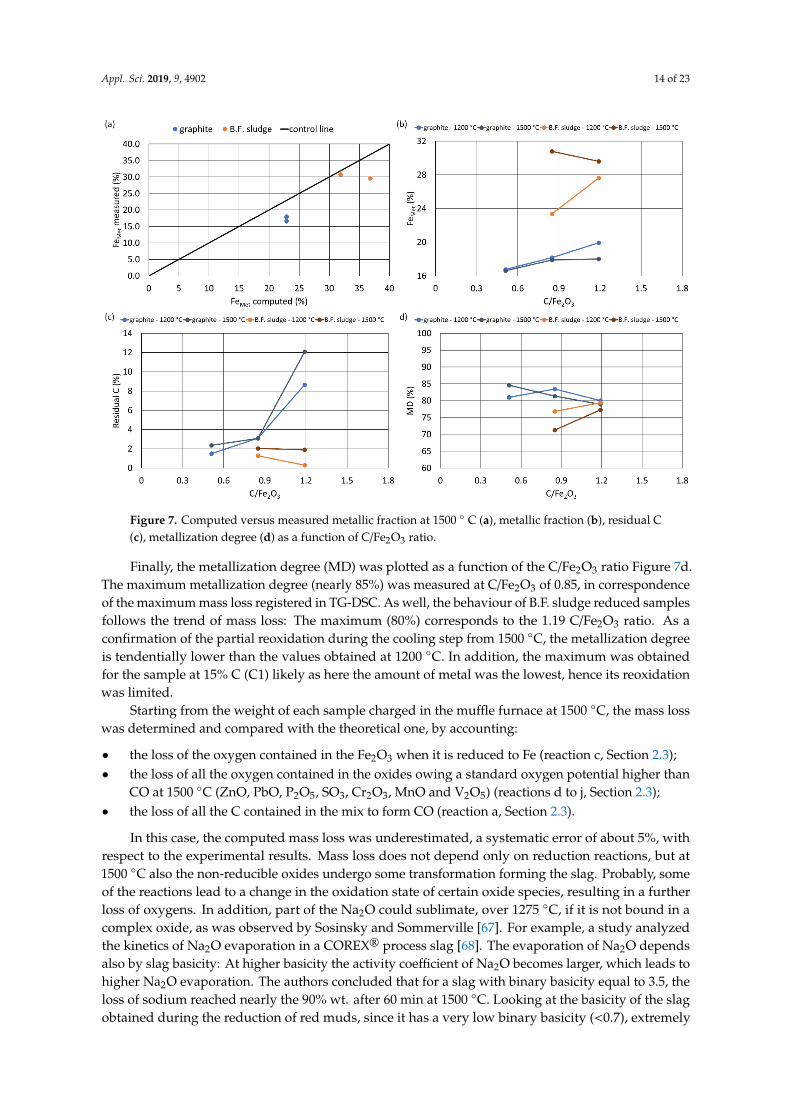
The amount of metallic material that can be obtained from each sample is of great importance.A comparison between the theoretical maximum amount of cast iron that should be obtained at 1500 ◦Cand the actual fraction measured according to ISO 2597 was performed Figure 7a. For the computationof the expected amount of metal, all the Fe2O3 (reaction c) and reducible oxides (reactions d to j)were considered completely reduced to metal (by considering the carbon available). The comparisonwas made for the samples roasted at 1500 ◦C. At this temperature Mn and V oxides were consideredcompletely reduced. Through computation, the metallic fraction was overestimated by a systematicdifference between measured and calculated of about 5%. This is likely due to the inability to forecastthe amount of post-oxidized metal that actually forms during the cooling step of the roasting cycle.Moreover, the amount of non-reacted carbon cannot be estimated, because the partial pressure of COand CO2 cannot be measured in the furnace.
By observing the trend of FeMet as a function of C/Fe2O3, it can be noted that it agrees with thevariation of the specific energy Figure 7b. For instance, at 1200 ◦C, it proportionally increases with theC/Fe2O3 ratio whereas at 1500 ◦C, the final amount of metallic fraction is weakly lower, confirmingthat at higher temperature a part of the new formed iron reoxidizes during the cooling step.
The residual C amount was determined through elemental analysis and plotted in Figure 7c. Thefigure confirms the results derived from TG-DSC analysis and visual inspection. Increasing the amountof C available, the amount of residual C in the reduced product increases. In addition, increasing thetemperatures lead to an increase of the residual carbon mass in the reduced material. Probably, thishappen because the exceeding carbon cannot completely burn out due to a sort of protection of thealready formed CO. In addition, during the cooling step of the roasting treatment, part of the unreactedCO decomposes again, below 700 ◦C, depositing C. This behaviour was evident in the control batchsamples (C series) whereas for the B.F. sludge reduced samples, the residual C was almost constant andat a very low concentration. Probably, since in the B.F. sludge the C-bearing material is coke, it starts toform CO at a lower temperature than graphite (as stated in Figure 4d) giving time to completely reactswith reducible oxides thus, by consuming itself more homogenously during the heating step.
Appl. Sci. 2019, 9, 4902 14 of 23
Appl. Sci. 2019, 9, x FOR PEER REVIEW 14 of 23
Figure 7. Computed versus measured metallic fraction at 1500 ° C (a), metallic fraction (b), residual C
(c), metallization degree (d) as a function of C/Fe2O3 ratio.
Finally, the metallization degree (MD) was plotted as a function of the C/Fe2O3 ratio Figure 7d.
The maximum metallization degree (nearly 85%) was measured at C/Fe2O3 of 0.85, in correspondence
of the maximum mass loss registered in TG-DSC. As well, the behaviour of B.F. sludge reduced
samples follows the trend of mass loss: The maximum (80%) corresponds to the 1.19 C/Fe2O3 ratio.
As a confirmation of the partial reoxidation during the cooling step from 1500 °C, the metallization
degree is tendentially lower than the values obtained at 1200 °C. In addition, the maximum was
obtained for the sample at 15% C (C1) likely as here the amount of metal was the lowest, hence its
reoxidation was limited.
Starting from the weight of each sample charged in the muffle furnace at 1500 °C, the mass loss
was determined and compared with the theoretical one, by accounting:
the loss of the oxygen contained in the Fe2O3 when it is reduced to Fe (reaction c, Section 2.3);
the loss of all the oxygen contained in the oxides owing a standard oxygen potential higher than
CO at 1500 °C (ZnO, PbO, P2O5, SO3, Cr2O3, MnO and V2O5) (reactions d to j, Section 2.3);
the loss of all the C contained in the mix to form CO (reaction a, Section 2.3).
In this case, the computed mass loss was underestimated, a systematic error of about 5%, with
respect to the experimental results. Mass loss does not depend only on reduction reactions, but at
1500 °C also the non-reducible oxides undergo some transformation forming the slag. Probably, some
of the reactions lead to a change in the oxidation state of certain oxide species, resulting in a further
loss of oxygens. In addition, part of the Na2O could sublimate, over 1275 °C, if it is not bound in a
complex oxide, as was observed by Sosinsky and Sommerville [67]. For example, a study analyzed
the kinetics of Na2O evaporation in a COREX® process slag [68]. The evaporation of Na2O depends
also by slag basicity: At higher basicity the activity coefficient of Na2O becomes larger, which leads
to higher Na2O evaporation. The authors concluded that for a slag with binary basicity equal to 3.5,
the loss of sodium reached nearly the 90% wt. after 60 min at 1500 °C. Looking at the basicity of the
slag obtained during the reduction of red muds, since it has a very low binary basicity (<0.7),
extremely low Na evaporation rates are expected. The small amount of lost Na2O could explain the
difference between the measured and calculated loss of mass. In addition, the reducing conditions
Figure 7. Computed versus measured metallic fraction at 1500 ◦ C (a), metallic fraction (b), residual C(c), metallization degree (d) as a function of C/Fe2O3 ratio.
Finally, the metallization degree (MD) was plotted as a function of the C/Fe2O3 ratio Figure 7d.The maximum metallization degree (nearly 85%) was measured at C/Fe2O3 of 0.85, in correspondenceof the maximum mass loss registered in TG-DSC. As well, the behaviour of B.F. sludge reduced samplesfollows the trend of mass loss: The maximum (80%) corresponds to the 1.19 C/Fe2O3 ratio. As aconfirmation of the partial reoxidation during the cooling step from 1500 ◦C, the metallization degreeis tendentially lower than the values obtained at 1200 ◦C. In addition, the maximum was obtainedfor the sample at 15% C (C1) likely as here the amount of metal was the lowest, hence its reoxidationwas limited.
Starting from the weight of each sample charged in the muffle furnace at 1500 ◦C, the mass losswas determined and compared with the theoretical one, by accounting:
• the loss of the oxygen contained in the Fe2O3 when it is reduced to Fe (reaction c, Section 2.3);• the loss of all the oxygen contained in the oxides owing a standard oxygen potential higher than
CO at 1500 ◦C (ZnO, PbO, P2O5, SO3, Cr2O3, MnO and V2O5) (reactions d to j, Section 2.3);• the loss of all the C contained in the mix to form CO (reaction a, Section 2.3).
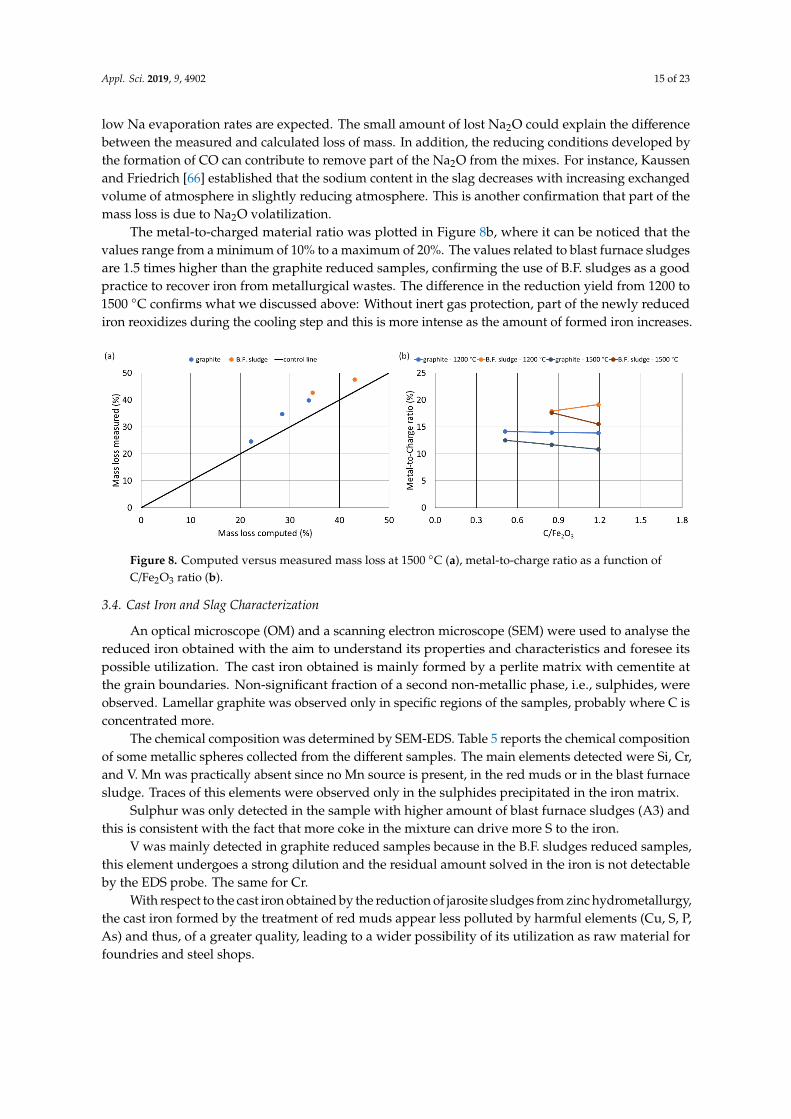
In this case, the computed mass loss was underestimated, a systematic error of about 5%, withrespect to the experimental results. Mass loss does not depend only on reduction reactions, but at1500 ◦C also the non-reducible oxides undergo some transformation forming the slag. Probably, someof the reactions lead to a change in the oxidation state of certain oxide species, resulting in a furtherloss of oxygens. In addition, part of the Na2O could sublimate, over 1275 ◦C, if it is not bound in acomplex oxide, as was observed by Sosinsky and Sommerville [67]. For example, a study analyzedthe kinetics of Na2O evaporation in a COREX® process slag [68]. The evaporation of Na2O dependsalso by slag basicity: At higher basicity the activity coefficient of Na2O becomes larger, which leads tohigher Na2O evaporation. The authors concluded that for a slag with binary basicity equal to 3.5, theloss of sodium reached nearly the 90% wt. after 60 min at 1500 ◦C. Looking at the basicity of the slagobtained during the reduction of red muds, since it has a very low binary basicity (<0.7), extremely
Appl. Sci. 2019, 9, 4902 15 of 23
low Na evaporation rates are expected. The small amount of lost Na2O could explain the differencebetween the measured and calculated loss of mass. In addition, the reducing conditions developed bythe formation of CO can contribute to remove part of the Na2O from the mixes. For instance, Kaussenand Friedrich [66] established that the sodium content in the slag decreases with increasing exchangedvolume of atmosphere in slightly reducing atmosphere. This is another confirmation that part of themass loss is due to Na2O volatilization.
The metal-to-charged material ratio was plotted in Figure 8b, where it can be noticed that thevalues range from a minimum of 10% to a maximum of 20%. The values related to blast furnace sludgesare 1.5 times higher than the graphite reduced samples, confirming the use of B.F. sludges as a goodpractice to recover iron from metallurgical wastes. The difference in the reduction yield from 1200 to1500 ◦C confirms what we discussed above: Without inert gas protection, part of the newly reducediron reoxidizes during the cooling step and this is more intense as the amount of formed iron increases.
Appl. Sci. 2019, 9, x FOR PEER REVIEW 15 of 23
developed by the formation of CO can contribute to remove part of the Na2O from the mixes. For
instance, Kaussen and Friedrich [66] established that the sodium content in the slag decreases with
increasing exchanged volume of atmosphere in slightly reducing atmosphere. This is another
confirmation that part of the mass loss is due to Na2O volatilization.
The metal-to-charged material ratio was plotted in Figure 8b, where it can be noticed that the
values range from a minimum of 10% to a maximum of 20%. The values related to blast furnace
sludges are 1.5 times higher than the graphite reduced samples, confirming the use of B.F. sludges as
a good practice to recover iron from metallurgical wastes. The difference in the reduction yield from
1200 to 1500 °C confirms what we discussed above: Without inert gas protection, part of the newly
reduced iron reoxidizes during the cooling step and this is more intense as the amount of formed iron
increases.
Figure 8. Computed versus measured mass loss at 1500 °C (a), metal-to-charge ratio as a function of
C/Fe2O3 ratio (b).
3.4. Cast Iron and Slag Characterization
An optical microscope (OM) and a scanning electron microscope (SEM) were used to analyse
the reduced iron obtained with the aim to understand its properties and characteristics and foresee
its possible utilization. The cast iron obtained is mainly formed by a perlite matrix with cementite at
the grain boundaries. Non-significant fraction of a second non-metallic phase, i.e., sulphides, were
observed. Lamellar graphite was observed only in specific regions of the samples, probably where C
is concentrated more.
The chemical composition was determined by SEM-EDS. Table 5 reports the chemical
composition of some metallic spheres collected from the different samples. The main elements
detected were Si, Cr, and V. Mn was practically absent since no Mn source is present, in the red muds
or in the blast furnace sludge. Traces of this elements were observed only in the sulphides
precipitated in the iron matrix.
Sulphur was only detected in the sample with higher amount of blast furnace sludges (A3) and
this is consistent with the fact that more coke in the mixture can drive more S to the iron.
V was mainly detected in graphite reduced samples because in the B.F. sludges reduced samples,
this element undergoes a strong dilution and the residual amount solved in the iron is not detectable
by the EDS probe. The same for Cr.
With respect to the cast iron obtained by the reduction of jarosite sludges from zinc
hydrometallurgy, the cast iron formed by the treatment of red muds appear less polluted by harmful
elements (Cu, S, P, As) and thus, of a greater quality, leading to a wider possibility of its utilization
as raw material for foundries and steel shops.
Figure 8. Computed versus measured mass loss at 1500 ◦C (a), metal-to-charge ratio as a function ofC/Fe2O3 ratio (b).
3.4. Cast Iron and Slag Characterization
An optical microscope (OM) and a scanning electron microscope (SEM) were used to analyse thereduced iron obtained with the aim to understand its properties and characteristics and foresee itspossible utilization. The cast iron obtained is mainly formed by a perlite matrix with cementite atthe grain boundaries. Non-significant fraction of a second non-metallic phase, i.e., sulphides, wereobserved. Lamellar graphite was observed only in specific regions of the samples, probably where C isconcentrated more.
The chemical composition was determined by SEM-EDS. Table 5 reports the chemical compositionof some metallic spheres collected from the different samples. The main elements detected were Si, Cr,and V. Mn was practically absent since no Mn source is present, in the red muds or in the blast furnacesludge. Traces of this elements were observed only in the sulphides precipitated in the iron matrix.
Sulphur was only detected in the sample with higher amount of blast furnace sludges (A3) andthis is consistent with the fact that more coke in the mixture can drive more S to the iron.
V was mainly detected in graphite reduced samples because in the B.F. sludges reduced samples,this element undergoes a strong dilution and the residual amount solved in the iron is not detectableby the EDS probe. The same for Cr.
With respect to the cast iron obtained by the reduction of jarosite sludges from zinc hydrometallurgy,the cast iron formed by the treatment of red muds appear less polluted by harmful elements (Cu, S, P,As) and thus, of a greater quality, leading to a wider possibility of its utilization as raw material forfoundries and steel shops.
Appl. Sci. 2019, 9, 4902 16 of 23
Table 5. SEM-EDS general chemical composition of some samples of obtained cast iron (% by weight)and microhardness value of the perlitic matrix.
Sample Si S V Cr Fe
C1 0.48 0.45 0.48 98.59
C2 0.59 0.46 0.46 98.48
C3 0.75 0.53 0.43 98.29
A2 0.67 99.33
A3 0.82 0.66 98.52
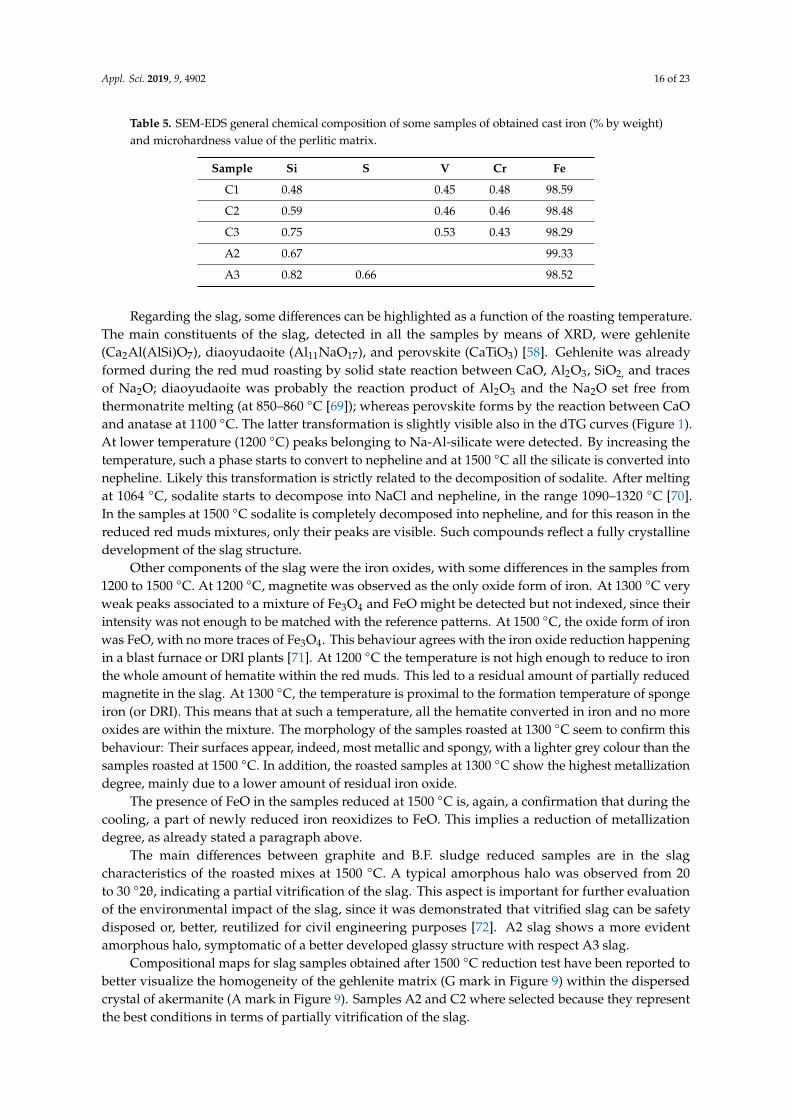
Regarding the slag, some differences can be highlighted as a function of the roasting temperature.The main constituents of the slag, detected in all the samples by means of XRD, were gehlenite(Ca2Al(AlSi)O7), diaoyudaoite (Al11NaO17), and perovskite (CaTiO3) [58]. Gehlenite was alreadyformed during the red mud roasting by solid state reaction between CaO, Al2O3, SiO2, and tracesof Na2O; diaoyudaoite was probably the reaction product of Al2O3 and the Na2O set free fromthermonatrite melting (at 850–860 ◦C [69]); whereas perovskite forms by the reaction between CaOand anatase at 1100 ◦C. The latter transformation is slightly visible also in the dTG curves (Figure 1).At lower temperature (1200 ◦C) peaks belonging to Na-Al-silicate were detected. By increasing thetemperature, such a phase starts to convert to nepheline and at 1500 ◦C all the silicate is converted intonepheline. Likely this transformation is strictly related to the decomposition of sodalite. After meltingat 1064 ◦C, sodalite starts to decompose into NaCl and nepheline, in the range 1090–1320 ◦C [70].In the samples at 1500 ◦C sodalite is completely decomposed into nepheline, and for this reason in thereduced red muds mixtures, only their peaks are visible. Such compounds reflect a fully crystallinedevelopment of the slag structure.
Other components of the slag were the iron oxides, with some differences in the samples from1200 to 1500 ◦C. At 1200 ◦C, magnetite was observed as the only oxide form of iron. At 1300 ◦C veryweak peaks associated to a mixture of Fe3O4 and FeO might be detected but not indexed, since theirintensity was not enough to be matched with the reference patterns. At 1500 ◦C, the oxide form of ironwas FeO, with no more traces of Fe3O4. This behaviour agrees with the iron oxide reduction happeningin a blast furnace or DRI plants [71]. At 1200 ◦C the temperature is not high enough to reduce to ironthe whole amount of hematite within the red muds. This led to a residual amount of partially reducedmagnetite in the slag. At 1300 ◦C, the temperature is proximal to the formation temperature of spongeiron (or DRI). This means that at such a temperature, all the hematite converted in iron and no moreoxides are within the mixture. The morphology of the samples roasted at 1300 ◦C seem to confirm thisbehaviour: Their surfaces appear, indeed, most metallic and spongy, with a lighter grey colour than thesamples roasted at 1500 ◦C. In addition, the roasted samples at 1300 ◦C show the highest metallizationdegree, mainly due to a lower amount of residual iron oxide.
The presence of FeO in the samples reduced at 1500 ◦C is, again, a confirmation that during thecooling, a part of newly reduced iron reoxidizes to FeO. This implies a reduction of metallizationdegree, as already stated a paragraph above.
The main differences between graphite and B.F. sludge reduced samples are in the slagcharacteristics of the roasted mixes at 1500 ◦C. A typical amorphous halo was observed from 20to 30 ◦2θ, indicating a partial vitrification of the slag. This aspect is important for further evaluationof the environmental impact of the slag, since it was demonstrated that vitrified slag can be safetydisposed or, better, reutilized for civil engineering purposes [72]. A2 slag shows a more evidentamorphous halo, symptomatic of a better developed glassy structure with respect A3 slag.
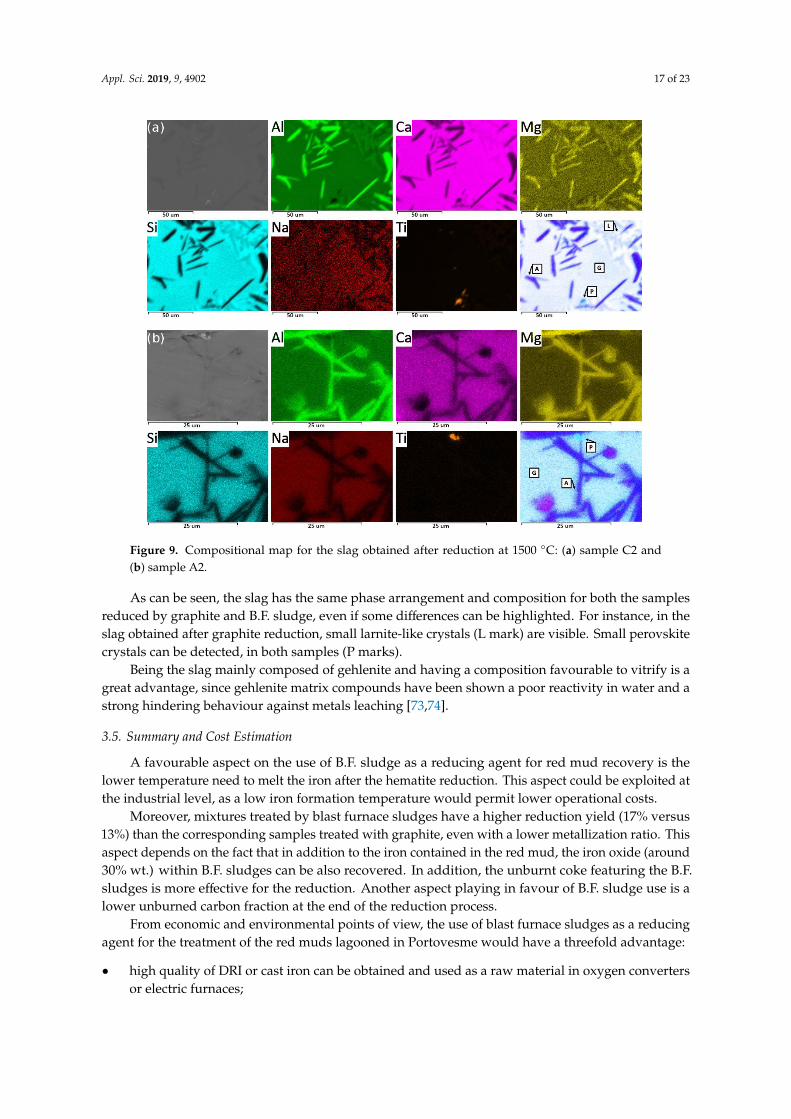
Compositional maps for slag samples obtained after 1500 ◦C reduction test have been reported tobetter visualize the homogeneity of the gehlenite matrix (G mark in Figure 9) within the dispersedcrystal of akermanite (A mark in Figure 9). Samples A2 and C2 where selected because they representthe best conditions in terms of partially vitrification of the slag.
Appl. Sci. 2019, 9, 4902 17 of 23
Appl. Sci. 2019, 9, x FOR PEER REVIEW 17 of 23
Figure 9. Compositional map for the slag obtained after reduction at 1500 °C: (a) sample C2 and (b)
sample A2.
As can be seen, the slag has the same phase arrangement and composition for both the samples
reduced by graphite and B.F. sludge, even if some differences can be highlighted. For instance, in the
slag obtained after graphite reduction, small larnite-like crystals (L mark) are visible. Small
perovskite crystals can be detected, in both samples (P marks).
Being the slag mainly composed of gehlenite and having a composition favourable to vitrify is
a great advantage, since gehlenite matrix compounds have been shown a poor reactivity in water and
a strong hindering behaviour against metals leaching [73,74].
3.5. Summary and Cost Estimation
A favourable aspect on the use of B.F. sludge as a reducing agent for red mud recovery is the
lower temperature need to melt the iron after the hematite reduction. This aspect could be exploited
at the industrial level, as a low iron formation temperature would permit lower operational costs.
Moreover, mixtures treated by blast furnace sludges have a higher reduction yield (17% versus
13%) than the corresponding samples treated with graphite, even with a lower metallization ratio.
This aspect depends on the fact that in addition to the iron contained in the red mud, the iron oxide
(around 30% wt.) within B.F. sludges can be also recovered. In addition, the unburnt coke featuring
the B.F. sludges is more effective for the reduction. Another aspect playing in favour of B.F. sludge
use is a lower unburned carbon fraction at the end of the reduction process.
From economic and environmental points of view, the use of blast furnace sludges as a reducing
agent for the treatment of the red muds lagooned in Portovesme would have a threefold advantage:
high quality of DRI or cast iron can be obtained and used as a raw material in oxygen converters
or electric furnaces;
the stockpiled waste amount would be reduced, for both the iron and the aluminum
metallurgies, with a clear benefit for the environment;
the reduction residue (slag) has mineralogical characteristics that can assure safe disposal or
virtuous recycling for civil engineering applications.
Figure 9. Compositional map for the slag obtained after reduction at 1500 ◦C: (a) sample C2 and(b) sample A2.
As can be seen, the slag has the same phase arrangement and composition for both the samplesreduced by graphite and B.F. sludge, even if some differences can be highlighted. For instance, in theslag obtained after graphite reduction, small larnite-like crystals (L mark) are visible. Small perovskitecrystals can be detected, in both samples (P marks).
Being the slag mainly composed of gehlenite and having a composition favourable to vitrify is agreat advantage, since gehlenite matrix compounds have been shown a poor reactivity in water and astrong hindering behaviour against metals leaching [73,74].
3.5. Summary and Cost Estimation
A favourable aspect on the use of B.F. sludge as a reducing agent for red mud recovery is thelower temperature need to melt the iron after the hematite reduction. This aspect could be exploited atthe industrial level, as a low iron formation temperature would permit lower operational costs.
Moreover, mixtures treated by blast furnace sludges have a higher reduction yield (17% versus13%) than the corresponding samples treated with graphite, even with a lower metallization ratio. Thisaspect depends on the fact that in addition to the iron contained in the red mud, the iron oxide (around30% wt.) within B.F. sludges can be also recovered. In addition, the unburnt coke featuring the B.F.sludges is more effective for the reduction. Another aspect playing in favour of B.F. sludge use is alower unburned carbon fraction at the end of the reduction process.
From economic and environmental points of view, the use of blast furnace sludges as a reducingagent for the treatment of the red muds lagooned in Portovesme would have a threefold advantage:
• high quality of DRI or cast iron can be obtained and used as a raw material in oxygen convertersor electric furnaces;
Appl. Sci. 2019, 9, 4902 18 of 23
• the stockpiled waste amount would be reduced, for both the iron and the aluminum metallurgies,with a clear benefit for the environment;
• the reduction residue (slag) has mineralogical characteristics that can assure safe disposal orvirtuous recycling for civil engineering applications.
By taking in consideration all the aspects associated with the reduction process, such as residual C,reduction yield, metallization ratio, and slag characteristics, the best mix to have a good compromisebetween reduction yield and metallization degree is a 1:1 red mud/B.F. sludges, equivalent to 0.85C/Fe2O3.
In order to give a cost estimation of the process, the energy balance of the main involved reductionreaction was conducted in Equation (5). Thus, the enthalpy of reaction was calculated in Equation (6),based on the NIST Chemistry WebBook data for hematite, iron, and carbon monoxide [75–77].
Fe2O3 + 3C→ 2Fe + 3CO (5)
∆Hr =∑ν∆ ·Hr−products −
∑ν∆ ·Hr−reagents =
∑ν ·
(H0
r−products −∫ T
T0 cp−productsdT)
−∑ν ·
(H0
r−reagents −∫ T
T0 cp−reagentsdT) (6)
where ∆Hr is the reaction enthalpy, Hr0 is the reaction enthalpy in standard conditions (25 ◦C, 1 atm),
cp is the specific heat capacity, T0 is the standard temperature (298.15 K), T is the current temperatureand ν is the stoichiometric coefficient.
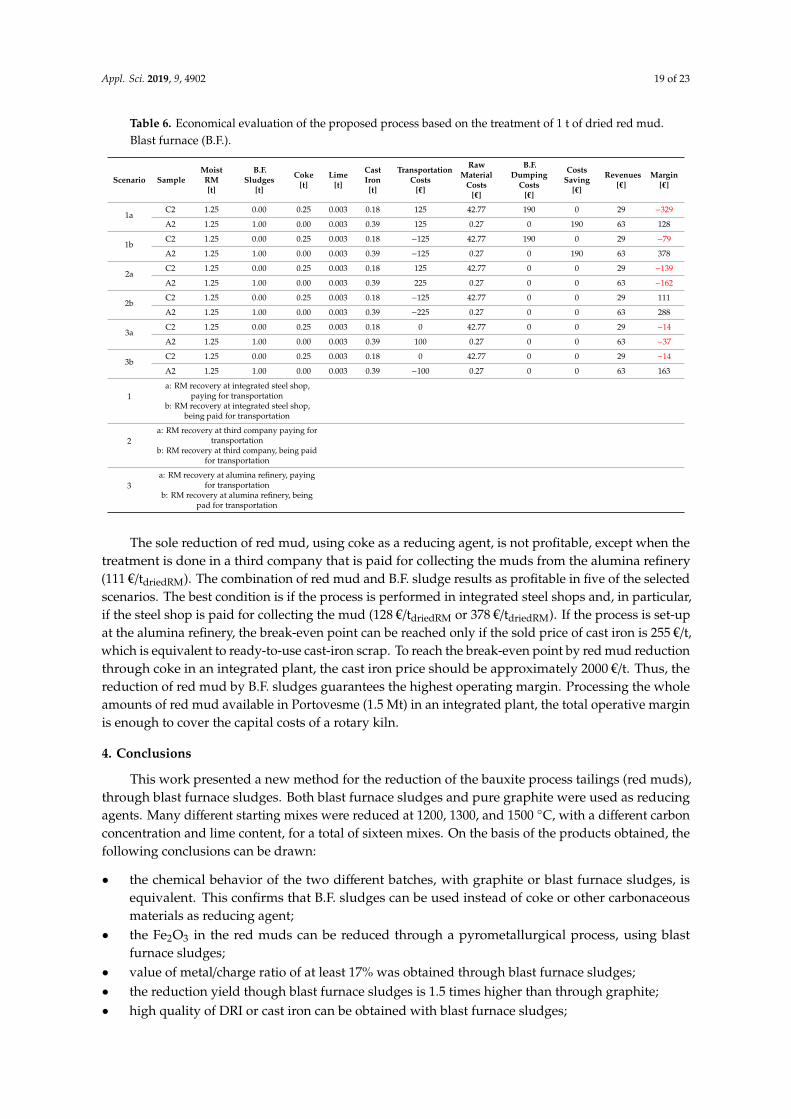
The iron melting temperatures defined through TG-DSC analysis in an Ar atmosphere, wereused in the computation (1020 ◦C for sample C2, 960 ◦C for sample A2). Approximately 522.5 kJ/molwas obtained for Fe2O3 reduction by graphite, instead of 520 kJ/mol for reduction by B.F. sludges.The overall reduction reaction of hematite to iron, being endothermic, requires thermal energy to befulfilled. The required energy can be supplied by methane combustion (802–889 kJ/mol [78]) in a rotarykiln or by the use of air plasma in an arc transferred plasma furnace. In Table 6, a raw estimation ofthe process profitability is reported referring to three different scenarios: an integrated steel shop (1),a third company (2), or an alumina refinery (3) as possible industrial sites where the process couldbe conducted. For each site, two options were analysed in relation to the transportation costs; theyare supported by the treating plant or by the waste producer. Hazardous waste disposal costs wereestimated on the basis of the average costs of Italian waste disposers and they account for 190 €/t(100 €/t for transportation and 90 €/t for dumping) [79]. Raw materials (coke, lime, and cast iron) pricesare 170 €/t, 90 €/t, and 160 €/t, respectively [80,81]. Cast iron price is referred to cast iron turnings(cat. E5G) and represents the lowest price at which cast iron can be sold.
Appl. Sci. 2019, 9, 4902 19 of 23
Table 6. Economical evaluation of the proposed process based on the treatment of 1 t of dried red mud.Blast furnace (B.F.).
Scenario SampleMoistRM[t]
B.F.Sludges
[t]
Coke[t]
Lime[t]
CastIron[t]
TransportationCosts
[€]
RawMaterial
Costs[€]
B.F.Dumping
Costs[€]
CostsSaving
[€]
Revenues[€]
Margin[€]
1aC2 1.25 0.00 0.25 0.003 0.18 125 42.77 190 0 29 −329
A2 1.25 1.00 0.00 0.003 0.39 125 0.27 0 190 63 128
1bC2 1.25 0.00 0.25 0.003 0.18 −125 42.77 190 0 29 −79
A2 1.25 1.00 0.00 0.003 0.39 −125 0.27 0 190 63 378
2aC2 1.25 0.00 0.25 0.003 0.18 125 42.77 0 0 29 −139
A2 1.25 1.00 0.00 0.003 0.39 225 0.27 0 0 63 −162
2bC2 1.25 0.00 0.25 0.003 0.18 −125 42.77 0 0 29 111
A2 1.25 1.00 0.00 0.003 0.39 −225 0.27 0 0 63 288
3aC2 1.25 0.00 0.25 0.003 0.18 0 42.77 0 0 29 −14
A2 1.25 1.00 0.00 0.003 0.39 100 0.27 0 0 63 −37
3bC2 1.25 0.00 0.25 0.003 0.18 0 42.77 0 0 29 −14
A2 1.25 1.00 0.00 0.003 0.39 −100 0.27 0 0 63 163
1a: RM recovery at integrated steel shop,
paying for transportationb: RM recovery at integrated steel shop,
being paid for transportation
2a: RM recovery at third company paying for
transportationb: RM recovery at third company, being paid
for transportation
3a: RM recovery at alumina refinery, paying
for transportationb: RM recovery at alumina refinery, being
pad for transportation
The sole reduction of red mud, using coke as a reducing agent, is not profitable, except when thetreatment is done in a third company that is paid for collecting the muds from the alumina refinery(111 €/tdriedRM). The combination of red mud and B.F. sludge results as profitable in five of the selectedscenarios. The best condition is if the process is performed in integrated steel shops and, in particular,if the steel shop is paid for collecting the mud (128 €/tdriedRM or 378 €/tdriedRM). If the process is set-upat the alumina refinery, the break-even point can be reached only if the sold price of cast iron is 255 €/t,which is equivalent to ready-to-use cast-iron scrap. To reach the break-even point by red mud reductionthrough coke in an integrated plant, the cast iron price should be approximately 2000 €/t. Thus, thereduction of red mud by B.F. sludges guarantees the highest operating margin. Processing the wholeamounts of red mud available in Portovesme (1.5 Mt) in an integrated plant, the total operative marginis enough to cover the capital costs of a rotary kiln.
4. Conclusions
This work presented a new method for the reduction of the bauxite process tailings (red muds),through blast furnace sludges. Both blast furnace sludges and pure graphite were used as reducingagents. Many different starting mixes were reduced at 1200, 1300, and 1500 ◦C, with a different carbonconcentration and lime content, for a total of sixteen mixes. On the basis of the products obtained, thefollowing conclusions can be drawn:
• the chemical behavior of the two different batches, with graphite or blast furnace sludges, isequivalent. This confirms that B.F. sludges can be used instead of coke or other carbonaceousmaterials as reducing agent;
• the Fe2O3 in the red muds can be reduced through a pyrometallurgical process, using blastfurnace sludges;
• value of metal/charge ratio of at least 17% was obtained through blast furnace sludges;• the reduction yield though blast furnace sludges is 1.5 times higher than through graphite;• high quality of DRI or cast iron can be obtained with blast furnace sludges;
Appl. Sci. 2019, 9, 4902 20 of 23
• blast furnace sludges induce a vitrified structure of the slag hindering the toxic element leaching.
By considering all the aspects listed before, the best mix suggested is a 1:1 red mud/B.F. sludge,equivalent to 0.85 C/Fe2O3.
To conclude, all the trials and experiments carried out in this work led to the optimisation of thereducing process which can be implemented in a large-scale plant, i.e., arc transferred plasma furnaceor direct reduction shaft furnaces, by replacing coke with blast furnace sludges.
Author Contributions: Conceptualization, C.M.; methodology, C.M. and D.M.; investigation, D.M.; resources,D.M. and A.G.; writing—original draft preparation and editing, D.M.; writing—review, S.B.; supervision, C.M.
Funding: This research received no external funding.
Acknowledgments: Authors would like to thank Marco Alloni (Prosimet, Filago (BG)) for TG-DSC tests, Eng.Umberto Di Landro (Dilab, Crema (CR)) for iron wet analysis, Gwenn Le Saout and the Centre des Materiaux desMines d’Alès (C2MA) (Ecole des Mines d’Alès) for XRD analysis.
Conflicts of Interest: The authors declare no conflict of interest.
References
1. Paramguru, R.K.; Rath, P.C.; Misra, V.N. Trends in red mud utilization—A review. Miner. Process. Extr.Metall. Rev. 2005, 26, 1–29. [CrossRef]
2. Kurdowski, W.; Sorrentino, F. Red mud and phosphogypsum and their fields of application. In WasteMaterials Used in Concrete Manufacturing; Chandra, S., Ed.; William Andrew Publishing: Norwich, NY, USA,1996; pp. 290–351.
3. Cabllk, V. Characterization and applications of red mud from bauxite processing. Br. Libr. World’s Knowl.2007, 23, 27–38.
4. Alumina Production. Available online: http://www.world-aluminium.org/statistics/alumina-production/
(accessed on 24 June 2019).5. Ayres, R.U.; Anderson, B.; Holmberg, J. Materials and the global environment for the 21st century. MRS Bull.
2001, 26, 477–480. [CrossRef]6. Akinci, A.; Artir, R. Characterization of trace elements and radionuclides and their risk assessment in red
mud. Mater. Charact. 2008, 59, 417–421. [CrossRef]7. Bautista, R.G. Recovery of rare earths from red mud. In Rare Earths: Extraction, Preparation and Applications:
Proceedings of a Symposium Held by TMS and AusIMM during the TMS Annual Meeting in San Diego, CaliforniaMarch 1–5; The Metallurgical Society Inc.: San Diego, CA, USA, 1992; pp. 119–125.
8. Qu, Y.; Lian, B. Bioleaching of rare earth and radioactive elements from red mud using Penicillium tricolorRM-10. Bioresour. Technol. 2013, 136, 16–23. [CrossRef]
9. EuropeanCommission. Commission notice on technical guidance on the classification of waste. Off. J.Eur. Union 2018, C 124, 134.
10. Industrial Minerals & Rocks: Commodities, Markets, and Uses, 7th ed.; Kogel, J.E.; Trivedi, N.C.; Barker, J.M.;Krukowski, S.T. (Eds.) Society for Mining, Metallurgy, and Exploration, Inc.(SME): Littleton, MA, USA, 2006;ISBN 978-0-87335-283-3.
11. Schmitz, C. Red Mud Disposal. In Handbook of Aluminium Recycling; Vurlan-Verlag Gmbh: Munich, Germany,2006; p. 18.
12. Power, G.; Gräfe, M.; Klauber, C. Bauxite residue issues: I. Current management, disposal and storagepractices. Hydrometallurgy 2011, 108, 33–45. [CrossRef]
13. Szépvölgyi, J. A Chemical Engineer’s View of the Red Mud Disaster. Nachrichten aus der Chemie 2011, 59, V.[CrossRef]
14. Rai, S.; Wasewar, K.L.; Lataye, D.H.; Mukhopadhyay, J.; Yoo, C.K. Feasibility of red mud neutralization withseawater using Taguchi’s methodology. Int. J. Environ. Sci. Technol. 2013, 10, 305–314. [CrossRef]
15. Palmer, S.J. Stability of Hydrotalcites Formed From Bayer Refinery Environmental Control Processes.Ph.D. Thesis, Queensland University of Technology, Brisbane, Australia, 2010.
16. David Gura Toxic Red Sludge Spill from Hungarian Aluminum Plant ‘An Ecological Disaster’: The Two-Way:NPR. Available online: https://www.npr.org/sections/thetwo-way/2010/10/05/130351938/red-sludge-from-hungarian-aluminum-plant-spill-an-ecological-disaster?t=1555008683054 (accessed on 22 June 2019).
Appl. Sci. 2019, 9, 4902 21 of 23
17. BBC News Hungarian Chemical Sludge Spill Reaches Danube. Available online: http://www.bbc.com/news/world-europe-11491412 (accessed on 22 June 2019).
18. Milacic, R.; Zuliani, T.; Šcancar, J. Environmental impact of toxic elements in red mud studied by fractionationand speciation procedures. Sci. Total Environ. 2012, 426, 359–365. [CrossRef]
19. Li, X.; Xiao, W.; Liu, W.; Liu, G.H.; Peng, Z.H.; Zhou, Q.S.; Qi, T.G. Recovery of alumina and ferric oxide fromBayer red mud rich in iron by reduction sintering. Trans. Nonferrous Met. Soc. China (English Ed.) 2009, 19,1342–1347. [CrossRef]
20. Hudson, L.K. Alumina Production; The Aluminium Company of America: Pittsburgh, PA, USA, 1982.21. Mishra, B.; Staley, A.; Kirkpatrick, D. Recovery of value-added products from red mud. Min. Metall. Explor.
2002, 19, 87–94. [CrossRef]22. Das, B.; Singh, B.P.; Bhima Rao, R. Recovery of iron values form red mud. Trans. Indian Inst. Met. 1992, 45,
173.23. Patel, M.; Padhi, B.K.; Vidyasagar, P.; Pattnaik, A.K. Extraction of titanium, dioxide and production of
building bricks from red mud. Res. Ind. 1992, 37, 154–157.24. Fofana, M.; Kmet, S.; Jakabsky, S.; Hredzak, S.; Kunhalmi, G. Treatment of red mud from alumina production
by high-intensity magnetic separation. Magn. Electr. Sep. 1995, 6, 243–251. [CrossRef]25. Mukherjee, T.K.; Gupta, C.K. Extraction of Vanadium from an Industrial Waste. High Temp. Mater. Process.
1993, 11, 189–206. [CrossRef]26. Piga, L.; Pochetti, F.; Stoppa, L. Recovering metals from red mud generated during alumina production.
Jom 1993, 45, 54–59. [CrossRef]27. Liu, W.; Yang, J.; Xiao, B. Application of Bayer red mud for iron recovery and building material production
from alumosilicate residues. J. Hazard. Mater. 2009, 161, 474–478. [CrossRef]28. Li, L.Y. A study of iron mineral transformation to reduce red mud tailings. Waste Manag. 2001, 21, 525–534.
[CrossRef]29. Mishra, B.; Slavik, M.; Kirkpatrick, D. Recycling of red mud by recovery of value-added products.
In Proceedings of the Global Symposium on Recycling, Waste Treatment and Clean Technology (REWAS1999), San Sebastian, Spain, 5–9 September 1999; Volume 1, pp. 251–260.
30. Muster, F. Rotschlamm: Reststoff aus der Aluminiumoxidproduktion—Ökologischer Rucksack oder Input fürProduktionsprozesse? Kassel university press GmbH: Kassel, Germany, 2007; ISBN 9783899583595.
31. Nowak, R.; Schuster, W. Process for the Production of Metallic Chlorides from Substances Containing MetallicOxides. U.S. Patent 3,466,169, 1969.
32. Bayer, G.; Cherdron, E. Process for Continuous Production of Flocculating Agent from Red Mud. U.S. Patent3,986,975, 1976.
33. Singh, M.; Upadhayay, S.N.; Prasad, P.M. Preparation of special cements from red mud. Waste Manag. 1996,16, 665–670. [CrossRef]
34. Patel, M.; Padhi, B.K. Al2O3-Fe2O3 fibres from bauxite and red mud. Silic. Ind. 1992, 57, 39–43.35. Rikkert, J.O.; Whittembury, G.; Rouff, K.; Bockelmann, L.P. Residue Enabled Design (R.E.D.). Available
online: https://redmud.squarespace.com/ (accessed on 4 November 2019).36. Browner, R.E. The use of bauxite waste mud in the treatment of gold ores. Hydrometallurgy 1995, 37, 339–348.
[CrossRef]37. Singh, A.P.; Singh, P.C.; Singh, V.N. Cyclohexanethiol separation from kerosene oil by red mud. J. Chem.
Technol. Biotechnol. 1993, 56, 167–174. [CrossRef]38. Singh, A.P.; Singh, P.C.; Singh, V.N. Removal of 1-Butanethiol from Diesel Oil by Red Mud. Ind. Eng.
Chem. Res. 1988, 27, 2101–2104. [CrossRef]39. Liano, J.J.; Rosal, R.; Sastre, H.; Diez, F.V. Catalytic hydrogenation with red mud. Fuel 1994, 73, 688–694.
[CrossRef]40. Alvarez, J.; Rosal, R.; Sastre, H.; Díez, F.V. Characterization and deactivation studies of an activated sulfided
red mud used as hydrogenation catalyst. Appl. Catal. A Gen. 1998, 167, 215–223. [CrossRef]41. Eamsiri, A.; Jackson, W.R.; Pratt, K.C.; Christov, V.; Marshall, M. Activated red mud as a catalyst for the
hydrogenation of coals and of aromatic compounds. Fuel 1992, 71, 449–453. [CrossRef]42. Summers, R.N.; Guise, N.R.; Smirk, D.D. Bauxite residue (red mud) increases phosphorus retention in sandy
soil catchments in Western Australia. Fertil. Res. 1993, 34, 85–94. [CrossRef]
Appl. Sci. 2019, 9, 4902 22 of 23
43. Ho, G.E.; Mathew, K.; Gibbs, R.A. Nitrogen and phosphorus removal from sewage effluent in amended sandcolumns. Water Res. 1992, 26, 295–300. [CrossRef]
44. Namasivayam, C.; Ranganathan, K. Treatment of dairy wastewater using waste red mud. Res. Ind. 1992, 37,165–167.
45. Zouboulis, A.I.; Kydros, K.A.; Matis, K.A. Removal of toxic metal ions from solutions using industrial solidbyproducts. Water Sci. Technol. 1993, 27, 83–93. [CrossRef]
46. Zouboulis, A.I.; Kydros, K.A. Use of red mud for toxic metals removal: The case of nickel. J. Chem. Technol.Biotechnol. 1993, 58, 95–101. [CrossRef]
47. Martin, M.H. Heavy metals in the environment (trace metals in the environment, volume 1). Environ. Pollut.1993, 80, 308–309. [CrossRef]
48. Wanchao, L.; Jiakuan, Y.; Bo, X. Review on treatment and utilization of bauxite residues in China. Int. J.Miner. Process. 2009, 93, 220–231.
49. Dobos, G.; Horvath, G.; Felfoldi, Z. Complex utilization of red mud including the production of pig iron.Trav. Com. Etude Bauxites Alum. Alum 1974, 12, 151–159.
50. Grzymek, J.; Derdacka-Grzymek, A.; Konik, Z.; Grzymek, W. Method. In Light Metals 1982: Proceedings oftechnical sessions sponsored by the TMS Light Metals Committee at the 111th AIME annual meeting; Andersen, J.E.,Ed.; Metallurgical Society of AIME: Warrendale, PA, USA, 1982; pp. 143–155.
51. Leontev, L.I.; Kudinov, B.Z.; Derevyankin, V.A.; Kuznetov, S.I. Physical-chemical and technologicalfoundations of complex processing of low grade bauxites and red muds utilizing rotary furnace. Trav. Com.Etude Bauxites Alum. Alum 1974, 12, 159–162.
52. Guccione, E. Red mud’, a solid waste, can now be converted to high-quality steel. Eng. Min. J. 1971, 172,136–138.
53. Mombelli, D.; Di Cecca, C.; Mapelli, C.; Barella, S.; Bondi, E. Experimental analysis on the use of BF-sludgefor the reduction of BOF-powders to direct reduced iron (DRI) production. Process Saf. Environ. Prot. 2016,102, 410–420. [CrossRef]
54. Sista, K.S.; Dwarapudi, S. Iron Powders from Steel Industry by-products: A Review. ISIJ Int. 2018, 58, 1–8.[CrossRef]
55. Rath, S.S.; Rao, D.S.; Tripathy, S.K.; Biswal, S.K. Characterization vis-á-vis utilization of blast furnace fluedust in the roast reduction of banded iron ore. Process Saf. Environ. Prot. 2018, 117, 232–244. [CrossRef]
56. Omran, M.; Fabritius, T. Utilization of blast furnace sludge for the removal of zinc from steelmaking dustsusing microwave heating. Sep. Purif. Technol. 2019, 210, 867–884. [CrossRef]
57. Mombelli, D.; Mapelli, C.; Barella, S.; Gruttadauria, A.; Spada, E. Jarosite wastes reduction through blastfurnace sludges for cast iron production. J. Environ. Chem. Eng. 2019. [CrossRef]
58. Mombelli, D.; Mapelii, C.; Di Cecca, C.; Barella, S.; Gruttadauria, A. Red mud reduction through blast furnacesludge for cast iron production. Metall. Ital. 2016, 108, 23–41.
59. Duffy, J.A. Optical Basicity: A Practical Acid-Base Theory for Oxides and Oxyanions. J. Chem. Educ. 1996, 73,1138. [CrossRef]
60. Bordes-Richard, E.; Courtine, P. Optical basicity: A scale of acidity/basicity of solids and its application tooxidation catalysis. Met. Oxides Chem. Appl. 2006, 108, 319–352.
61. Chirikure, S. Geochemistry of Ancient Metallurgy: Examples from Africa and Elsewhere. In Treatise onGeochemistry; Holland, H.D., Turekian, K.K., Eds.; Elsevier: Amsterdam, The Netherlands, 2014; pp. 169–189.
62. Busè, R.; Mombelli, D.; Mapelli, C. Metals recovery from furnaces dust: Waelz process. La Metall. Ital. 2014,106, 19–27.
63. Ahmed, H.; Persson, A.; Sundqvist, L.; Biorkman, B. Energy Efficient Recycling of in-Plant Fines. Int. J.Environ. Ecol. Eng. 2014, 8, 522–528.
64. Su, F.; Lampinen, H.-O.; Robinson, R. Recycling of Sludge and Dust to the BOF Converter by Cold BondedPelletizing. ISIJ Int. 2008, 44, 770–776. [CrossRef]
65. Rao, Y.K. The kinetics of reduction of hematite by carbon. Metall. Trans. 1971, 2, 1439–1447. [CrossRef]66. Kaußen, F.; Friedrich, B. Reductive Smelting of Red Mud for Iron Recovery. ChemieIngenieurTechnik 2015, 87,
1535–1542. [CrossRef]67. Sosinsky, n.D.J.; Sommerville, I.D. The composition and temperature dependence of the sulfide capacity of
metallurgical slags. Metall. Trans. B 1986, 17, 331–337. [CrossRef]
Appl. Sci. 2019, 9, 4902 23 of 23
68. Tong, Z.F.; Qiao, J.L.; Jiang, X.Y. Kinetics of Na2O evaporation from CaO–Al2O3–SiO2–MgO–TiO2–Na2Oslags. Ironmak. Steelmak. 2017, 44, 237–245. [CrossRef]
69. Hatakeyama, T.; Zhenhai, L. . Handbook of Thermal Analysis; John Wiley & Sons Ltd.: Chichester, UK, 1998;ISBN 978-0-471-98363-7.
70. Sharp, Z.D.; Helffrich, G.R.; Bohlen, S.R.; Essene, E.J. The stability of sodalite in the system NaAlSiO4-NaCl.Geochim. Cosmochim. Acta 1989, 53, 1943–1954. [CrossRef]
71. Turkdogan, E.T. Fundamentals of Steelmaking; Institute of Materials: London, UK, 1996; ISBN 9781861250049.72. Mombelli, D.; Mapelli, C.; Di Cecca, C.; Barella, S.; Gruttadauria, A.; Ragona, M.; Pisu, M.; Viola, A.
Characterization of cast iron and slag produced by jarosite sludges reduction via Arc Transferred Plasma(ATP) reactor. J. Environ. Chem. Eng. 2018, 6, 773–783. [CrossRef]
73. Mombelli, D.; Mapelli, C.; Barella, S.; Gruttadauria, A.; Le Saout, G.; Garcia-diaz, E. The efficiency of quartzaddition on electric arc furnace ( EAF ) carbon steel slag stability. J. Hazard. Mater. 2014, 279, 586–596.[CrossRef] [PubMed]
74. Mombelli, D.; Mapelli, C.; Barella, S.; Di Cecca, C.; Le Saout, G.; Garcia-Diaz, E. The effect of microstructureon the leaching behaviour of electric arc furnace (EAF) carbon steel slag. Process Saf. Environ. Prot. 2016, 102,810–821. [CrossRef]
75. NIST—National Institute of Standards and Technology Hematite (Fe2O3). Available online: https://webbook.nist.gov/cgi/cbook.cgi?ID=C1317608&Mask=2&Type=JANAFS&Plot=on#JANAFS (accessed on4 November 2019).
76. NIST—National Institute of Standards and Technology Carbon Monoxide. Available online: https://webbook.nist.gov/cgi/cbook.cgi?ID=C630080&Units=SI&Mask=1#Thermo-Gas (accessed on 4 November 2019).
77. NIST—National Institute of Standards and Technology Iron. Available online: https://webbook.nist.gov/cgi/cbook.cgi?ID=C7439896&Units=SI&Mask=2#Thermo-Condensed (accessed on 4 November 2019).
78. NIST—National Institute of Standards and Technology Methane. Available online: https://webbook.nist.gov/
cgi/cbook.cgi?Name=methane&Units=SI (accessed on 4 November 2019).79. Bazzucchi, L. La Valutazione del Prezzo dello Smaltimento in Discarica dei Rifiuti Speciali; ISPRA -Istituto Superiore
per la Protezione e la Ricerca Ambientale Cerca nel sito Ricerca: Roma, Italy, 2007.80. Ranocchia, C. I Prezzi Internazionali del Carbone Termico e Siderurgico. Available online: http://www.
pricepedia.it/magazine/article/2019/04/17/i-prezzi-del-carbone/ (accessed on 5 November 2019).81. Camera di Commercio di Milano Metalli Ferrosi. Available online: https://st.ilsole24ore.com/finanza-e-
mercati/indici-e-numeri.shtml?tabellacat=mercati-italia&idtabella=1509 (accessed on 5 November 2019).
© 2019 by the authors. Licensee MDPI, Basel, Switzerland. This article is an open accessarticle distributed under the terms and conditions of the Creative Commons Attribution(CC BY) license (http://creativecommons.org/licenses/by/4.0/).