Embed Size (px)
Citation preview

Supporting Information
Iron Oxide Photoelectrode with Multidimensional Architecture forHighly Efficient Photoelectrochemical Water SplittingJin Soo Kang, Yoonsook Noh, Jin Kim, Hyelim Choi, Tae Hwa Jeon, Docheon Ahn,Jae-Yup Kim, Seung-Ho Yu, Hyeji Park, Jun-Ho Yum, Wonyong Choi, David C. Dunand,Heeman Choe,* and Yung-Eun Sung*
ange_201703326_sm_miscellaneous_information.pdf

1
Experimental Section
Preparation of AFF Photoelectrodes and Their Applications in Photoelectrochemical
Water Spitting: Slurry was prepared by mixing deionized water with 14.1 vol% iron oxide
powder (mean particle size < 5 m, purity ≥ 99%, Sigma-Aldrich) and 4 wt% binder
(polyvinyl alcohol, Mm = 89,00098,000, purity 99+%, Sigma-Aldrich). In particular, slurry
dispersion was assisted by a stirring and sonication process. The slurry was then poured into a
Teflon mold (28 mm inner diameter, 70 mm height) placed onto a Cu rod cooled using liquid
nitrogen. The temperature of the top surface of the Cu rod was fixed at -15 ˚C and was
controlled by a heater. After freezing, the frozen slurry was dried at a temperature of -90 ˚C
and pressure of 5 mTorr for 48 h. The green body was reduced and sintered in a tube furnace
in a 5% H2–95% Ar gas mixture with a heating rate of 5 ˚C min-1. The reduction was carried
out by using a double step process at 300 ˚C for 2 h and then at 500 ˚C for 2 h, whereas
sintering was carried out by using a single step process at 950 ˚C for 14 h. The Fe foam was
cut and polished into a uniform thickness of 500 m, and was potentiostatically anodized
with the assistance of ultrasonication at 80 V for 5 min at 25 ˚C using an ethylene glycol
electrolyte containing 0.25 wt% NH4F and 2 vol% H2O. Anodized samples were carefully
washed with deionized water and ethanol, and were used as photoanodes after thermal
annealing at 500 ˚C for 4 h to increase crystallinity.
Characterization and Physical Measurements of Materials: XRD data was measured
using a Rigaku D-MAX2500-PC. SEM images were taken with Carl Zeiss AURIGA, and
TEM analysis was performed using JEOL JEM-2100F. Absorbance, transmittance, and
reflectance were measured by using a UV-Vis-NIR spectrophotometer (V-670, Jasco). Cell
performances were characterized using a solar simulator (Oriel) at AM 1.5G condition (light
intensity: 100 mW cm-2), which was adjusted by the Si reference cell certified by the National
Institute of Advanced Industrial Science and Technology (AIST, Japan). A potentiostat
Autolab PGSTAT128N was used for J-V measurements of AFFs, which were carried out in a
three-electrode system with a Pt mesh counter electrode and a Ag/AgCl reference electrode at
a constant scan rate of 50 mV s-1. Standard 1 M NaOH solution was used as the electrolyte
after 30 min of Ar purging. IPCE spectra were obtained by using a monochromator (Newport
74125). Sheet resistance was measured by a four-point probe (CMT-SP 2000N, AIT). GC
analysis was performed with Agilent HP6890A.

2
Table S1. Electrolyte compositions used for the fabrication of nanostructured anodic iron
oxide displayed in Figure 2a (Electrolyte 1), 2b (Electrolyte 2), 2c (Electrolyte 3), and 2d
(Electrolyte 4).
Electrolyte 1 Electrolyte 2 Electrolyte 3 Electrolyte 4
NH4F (wt%) 0.125 0.250 0.500 1.000
H2O (vol%) 1.0 2.0 3.0 4.0
3
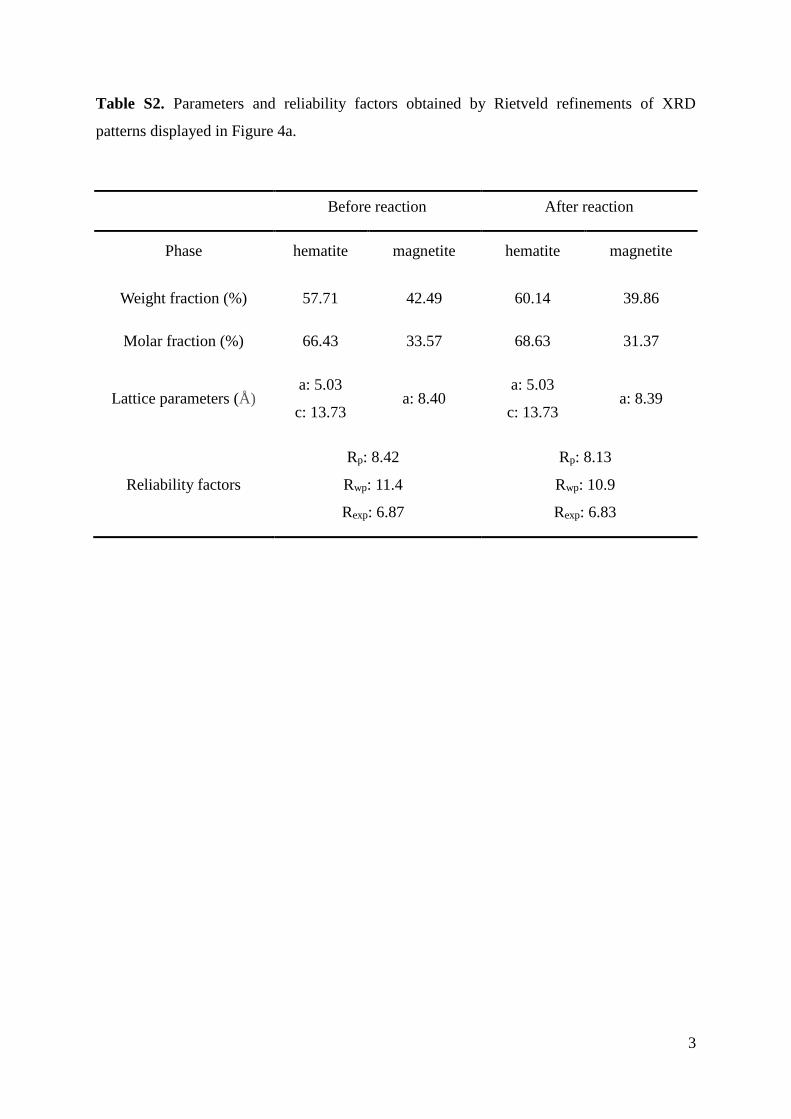
Table S2. Parameters and reliability factors obtained by Rietveld refinements of XRD
patterns displayed in Figure 4a.
Before reaction After reaction
Phase hematite magnetite hematite magnetite
Weight fraction (%) 57.71 42.49 60.14 39.86
Molar fraction (%) 66.43 33.57 68.63 31.37
Lattice parameters (Å ) a: 5.03
c: 13.73 a: 8.40
a: 5.03
c: 13.73 a: 8.39
Reliability factors
Rp: 8.42
Rwp: 11.4
Rexp: 6.87
Rp: 8.13
Rwp: 10.9
Rexp: 6.83

4
Figure S1. (a,b) High-magnification SEM images of iron oxide nanoflakes on the surface of
AFFs.

5
Figure S2. (a) SEM image and elemental EDS mapping results for (b) oxygen and (c) iron at
the innermost region (near the center) of AFF.

6
Figure S3. High-magnification SEM image of the AFF’s surface.
7
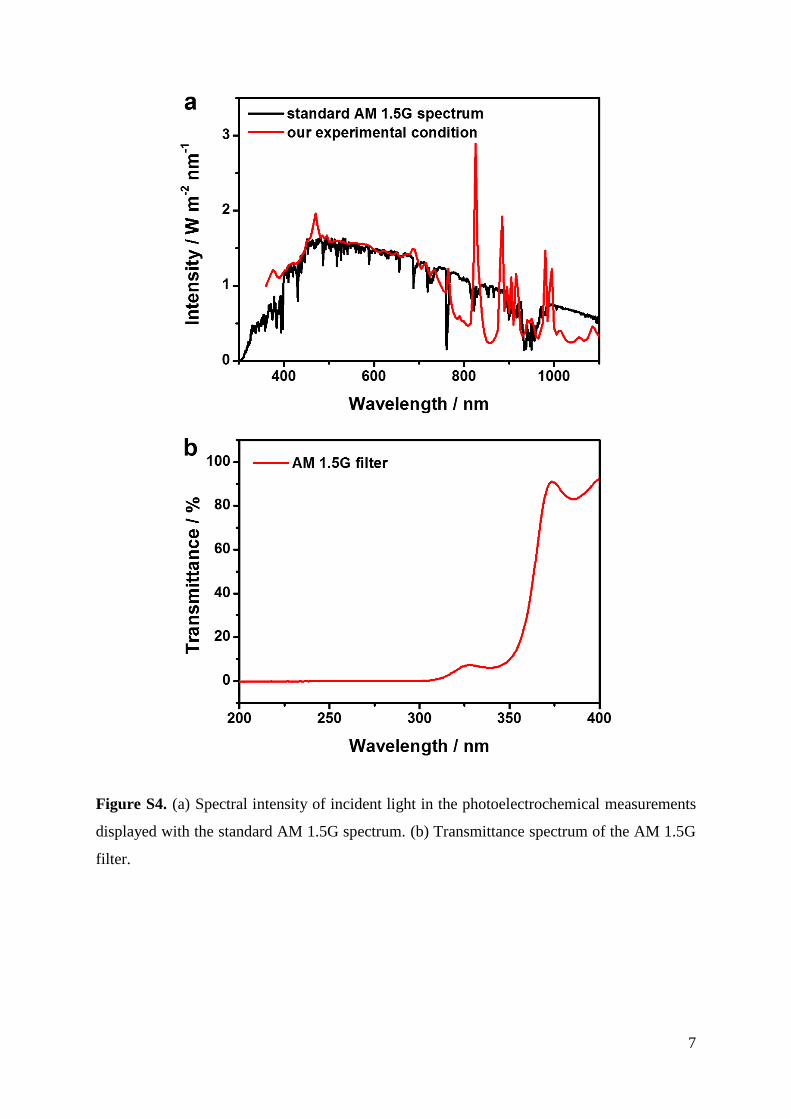
Figure S4. (a) Spectral intensity of incident light in the photoelectrochemical measurements
displayed with the standard AM 1.5G spectrum. (b) Transmittance spectrum of the AM 1.5G
filter.
8
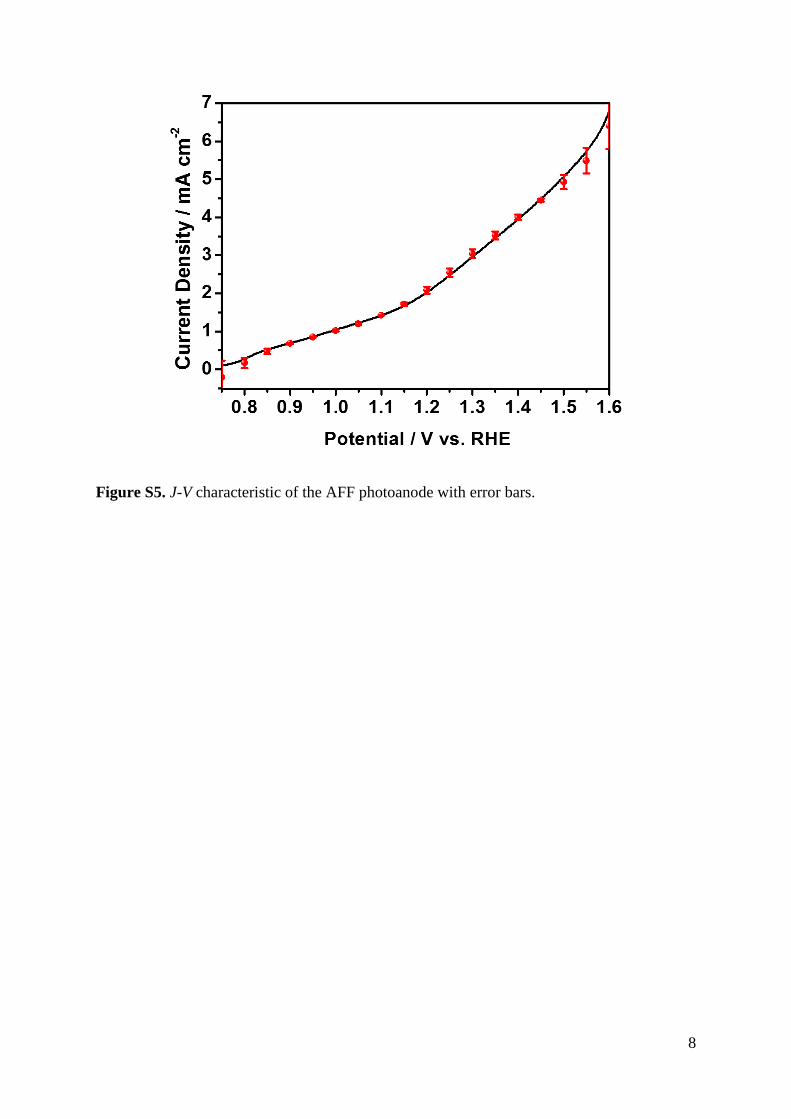
Figure S5. J-V characteristic of the AFF photoanode with error bars.

9
Figure S6. Transmittance spectrum of AFF in UV-visible light region and digital photograph
images of pristine Fe foam and AFF with spot-welded Fe rod in charge of electrical contact
during the anodization and photoelectrochemical water splitting.

10
Figure S7. XPS (a) survey and (b) Fe 2p spectra of AFFs before and after
photoelectrochemical water splitting at 1.23 V vs. RHE for 8 h.

11
Figure S8. High-magnification TEM images of AFF (a) before and (b-d) after the 8 h of
photoelectrochemical water splitting at 1.23 V vs. RHE.

12
Figure S9. J-V characteristic of the AFF photoanode with Co oxygen evolution catalysts with
error bars.


![10-1 Lesson 10 Objectives Chapter 4 [1,2,3,6]: Multidimensional discrete ordinates Chapter 4 [1,2,3,6]: Multidimensional discrete ordinates Multidimensional](https://img.pdfslide.us/doc/110x75/5697bff81a28abf838cbf777/10-1-lesson-10-objectives-chapter-4-1236-multidimensional-discrete-ordinates.jpg)