Embed Size (px)
Citation preview
Iron Overload and Its Management in Non–Transfusion-Dependent
Thalassaemia (NTDT)
Ali Taher, MD, FRCP
ProfessorDepartment of Internal Medicine
American University of Beirut Medical CenterBeirut, Lebanon
Definition
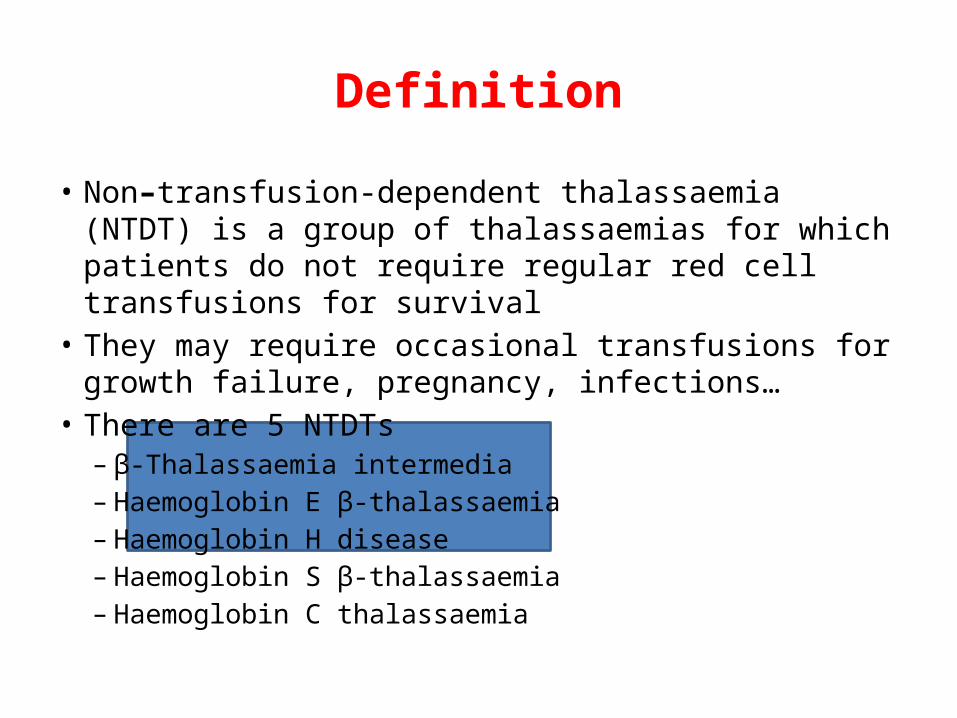
• Non–transfusion-dependent thalassaemia (NTDT) is a group of thalassaemias for which patients do not require regular red cell transfusions for survival
• They may require occasional transfusions for growth failure, pregnancy, infections…
• There are 5 NTDTs– β-Thalassaemia intermedia– Haemoglobin E β-thalassaemia – Haemoglobin H disease– Haemoglobin S β-thalassaemia – Haemoglobin C thalassaemia

Varying Severity
• These diseases form a spectrum, with 1 end being non–transfusion-dependent
• Early recognition is vital to prevent placing children on lifelong transfusion therapy
• Presentation at younger ages• Transfusion dependency
• Completely asymptomatic until adult life• Non–transfusion-dependent
SevereMild
Taher A, et al. Br J Haematol. 2011;152:512-523.
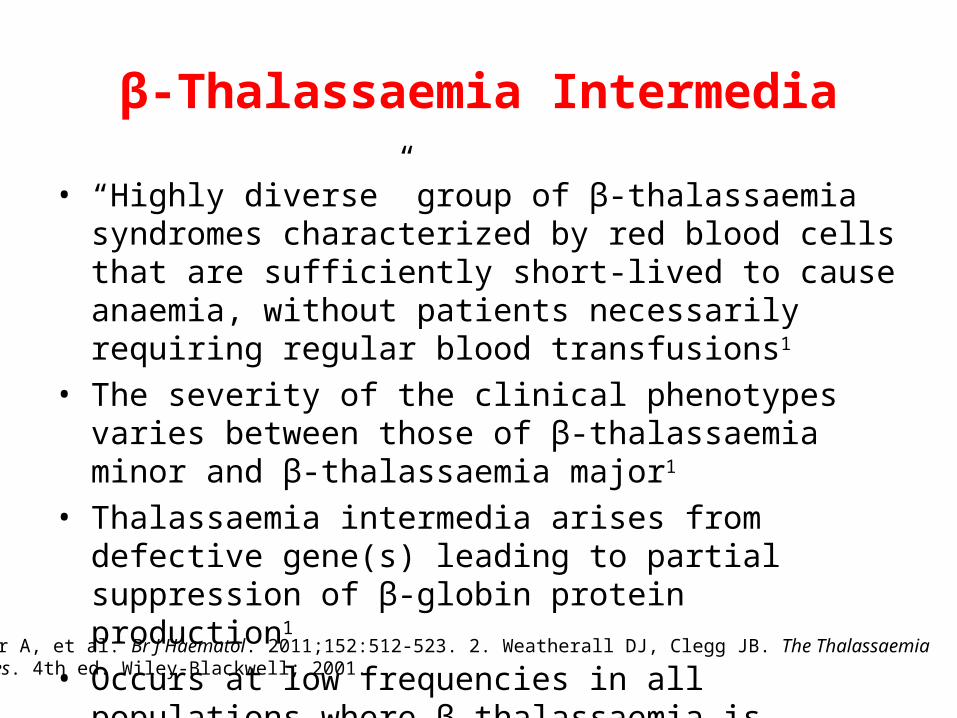
• “Highly diverse” group of β-thalassaemia syndromes characterized by red blood cells that are sufficiently short-lived to cause anaemia, without patients necessarily requiring regular blood transfusions1
• The severity of the clinical phenotypes varies between those of β-thalassaemia minor and β-thalassaemia major1
• Thalassaemia intermedia arises from defective gene(s) leading to partial suppression of β-globin protein production1
• Occurs at low frequencies in all populations where β-thalassaemia is common, particularly in the Mediterranean and Middle East2
β-Thalassaemia Intermedia
1. Taher A, et al. Br J Haematol. 2011;152:512-523. 2. Weatherall DJ, Clegg JB. The ThalassaemiaSyndromes. 4th ed. Wiley-Blackwell; 2001.
Determinants of Disease Severityin β-Thalassaemia Intermedia
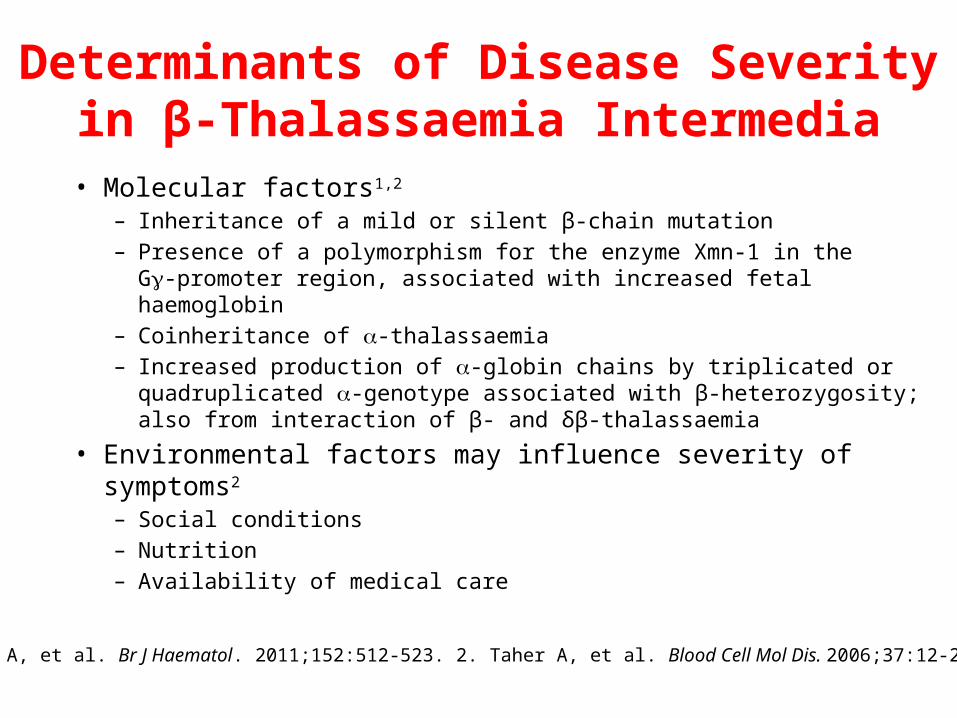
• Molecular factors1,2
– Inheritance of a mild or silent β-chain mutation– Presence of a polymorphism for the enzyme Xmn-1 in the
G-promoter region, associated with increased fetal haemoglobin– Coinheritance of -thalassaemia– Increased production of -globin chains by triplicated or quadruplicated
-genotype associated with β-heterozygosity; also from interaction of β- and δβ-thalassaemia
• Environmental factors may influence severity of symptoms2
– Social conditions– Nutrition– Availability of medical care
1. Taher A, et al. Br J Haematol. 2011;152:512-523. 2. Taher A, et al. Blood Cell Mol Dis. 2006;37:12-20.
Haemoglobin E β-Thalassaemia
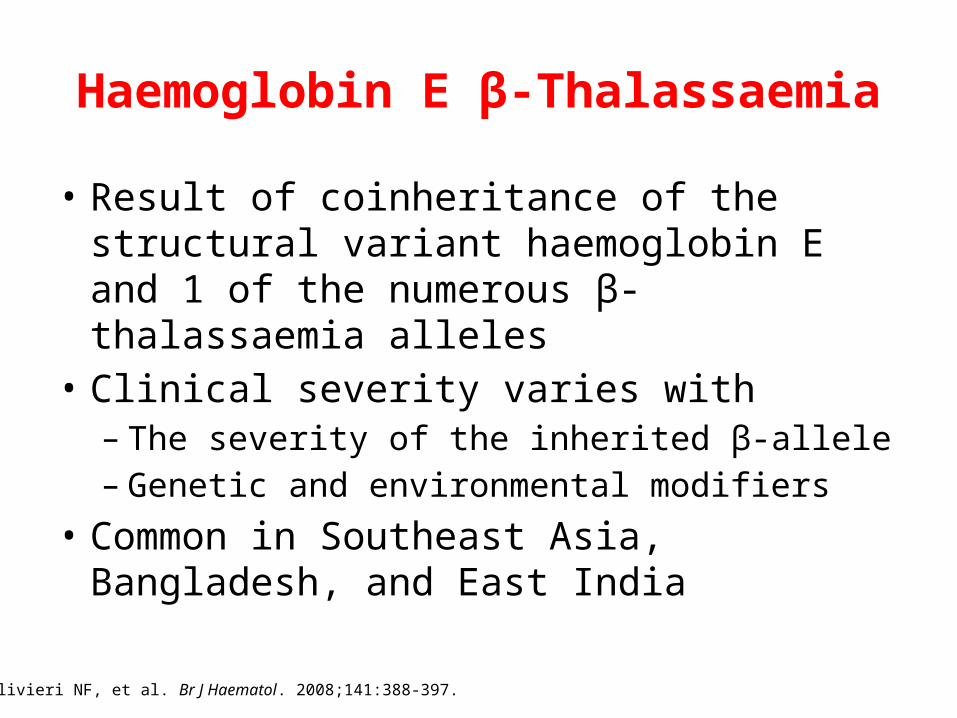
• Result of coinheritance of the structural variant haemoglobin E and 1 of the numerous β-thalassaemia alleles
• Clinical severity varies with– The severity of the inherited β-allele– Genetic and environmental modifiers
• Common in Southeast Asia, Bangladesh, and East India
Olivieri NF, et al. Br J Haematol. 2008;141:388-397.
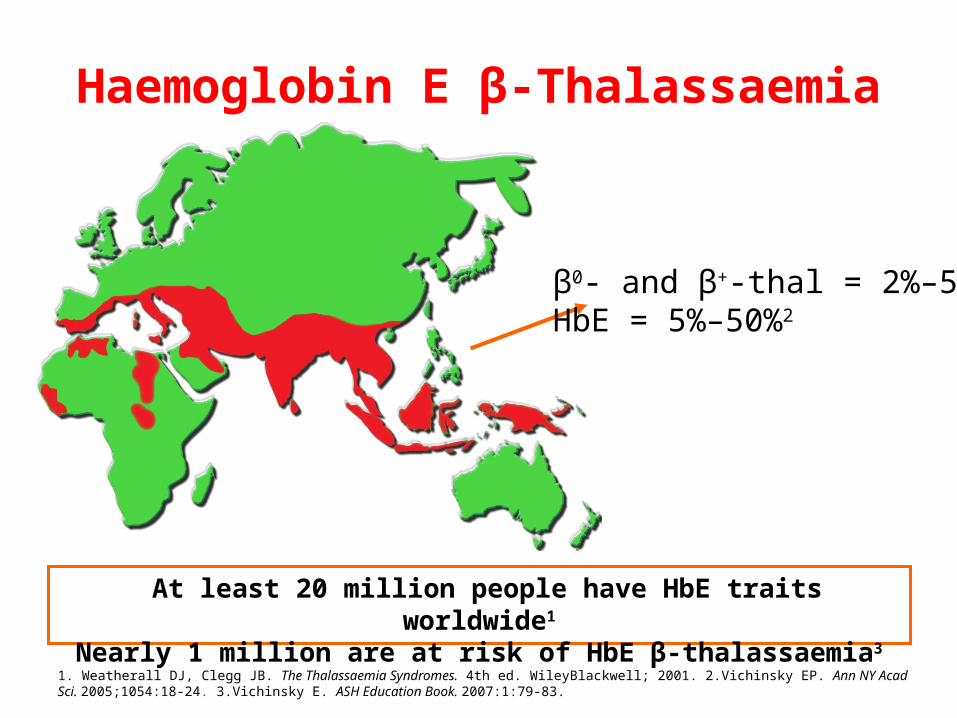
Haemoglobin E β-Thalassaemia
At least 20 million people have HbE traits worldwide1
Nearly 1 million are at risk of HbE β-thalassaemia3
β0- and β+-thal = 2%–5%1
HbE = 5%–50%2
1. Weatherall DJ, Clegg JB. The Thalassaemia Syndromes. 4th ed. WileyBlackwell; 2001. 2.Vichinsky EP. Ann NY Acad Sci. 2005;1054:18-24. 3.Vichinsky E. ASH Education Book. 2007:1:79-83.
Haemoglobin H Disease
• Result of inactivation of 3 out of 4 α-globin genes1
• Variable severity depending on molecular pathology2
– Deletional forms (-α/--) are mild and non–transfusion-dependent2
– 1 deletional and 1 nondeletional allele (αND/--) manifest a severe phenotype, sometimes requiring regular transfusion2
• Common in Southeast Asia2
Chui D, et al. Blood. 2003; 101:791-800. Higgs DR, Weatherall DL. Cell Mol Life Sci. 2009;66:1154-1162
1. Chui D, et al. Blood. 2003;101:791-800. 2. Higgs DR, Weatherall DJ. Cell Mol Life Sci. 2009;66:1154-1162.
Iron Overload in NTDT
• Despite no regular transfusion therapy, NTDT patients accumulate iron with age
• The mechanism is mainly increased iron absorption from the gastrointestinal tract
• Occasional transfusion therapy can also increase iron loading
• Due to variability, iron overload in NTDT requires regular monitoring and a tailored approach to management
Taher A, et al. Br J Haematol. 2009;147:634-640.
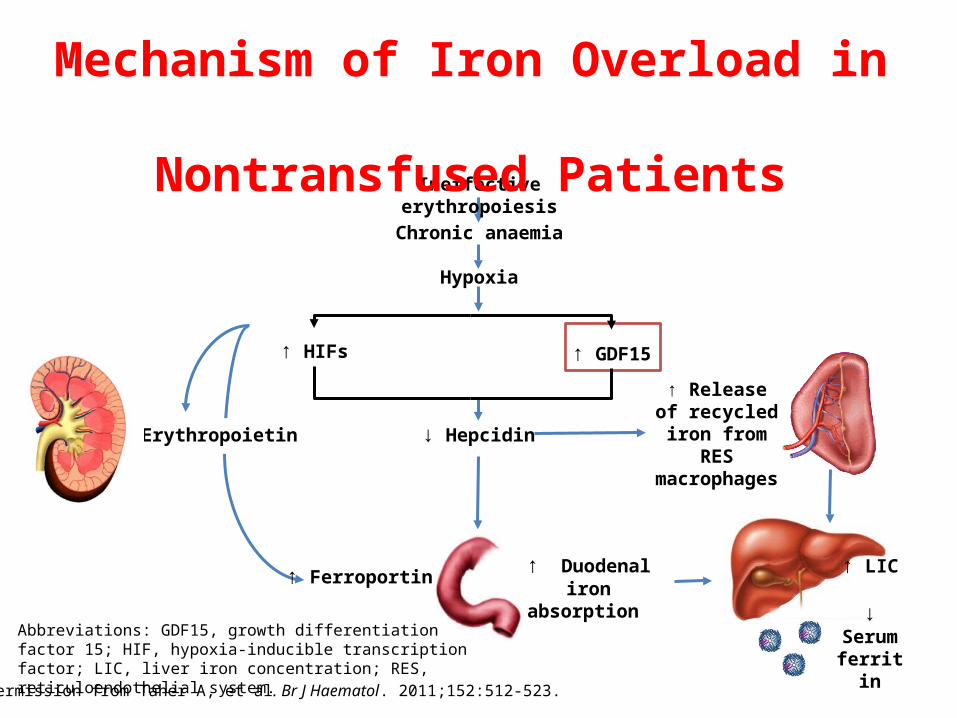
Abbreviations: GDF15, growth differentiation factor 15; HIF, hypoxia-inducible transcription factor; LIC, liver iron concentration; RES, reticuloendothelial system.With permission from Taher A, et al. Br J Haematol. 2011;152:512-523.
↑ Erythropoietin
↑ Duodenal iron absorption
↑ Ferroportin
↑ Release of recycled iron
from RES macrophages
↑ GDF15↑ HIFs
↓ Hepcidin
↑ LIC
↓ Serum ferritin
Ineffective erythropoiesis
Chronic anaemia
Hypoxia
Mechanism of Iron Overload in Nontransfused Patients
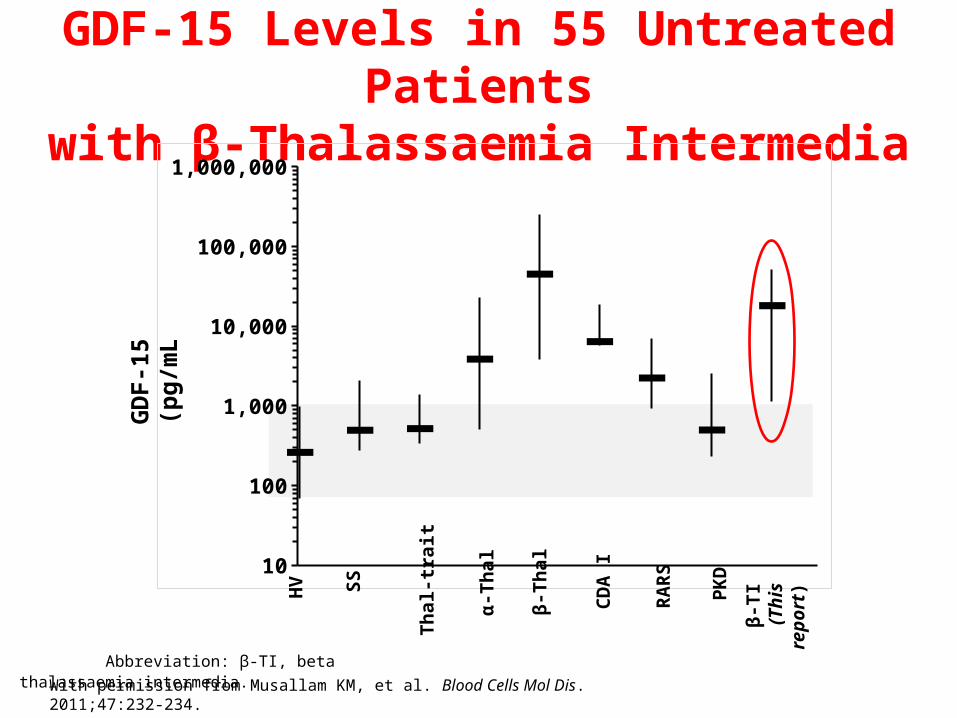
GDF-15 Levels in 55 Untreated Patientswith β-Thalassaemia Intermedia
10
100
1,000
10,000
100,000
1,000,000
- - --
-- - -
HV SS
Thal
-tra
it
α-Th
al
β-Th
al
CDA
I
RARS
PKD
β-TI
(Thi
s re
port
)
GD
F-15
(p
g/m
L
-
With permission from Musallam KM, et al. Blood Cells Mol Dis. 2011;47:232-234. Abbreviation: β-TI, beta thalassaemia intermedia.

GDF-15 Levels Correlated with Clinical Severity Score in β-TI
0 1 2 3 4 5 6 7 8 9 10 11 12 13 14 15 16 17 180
10,000
20,000
30,000
40,000
50,000
60,000
Clinical Severity Score
GD
F-15
(pg/
mL)
r = .830P <.001
Mild Moderate Severe
With permission from Musallam KM, et al. Blood Cells Mol Dis. 2011;47:232-234.
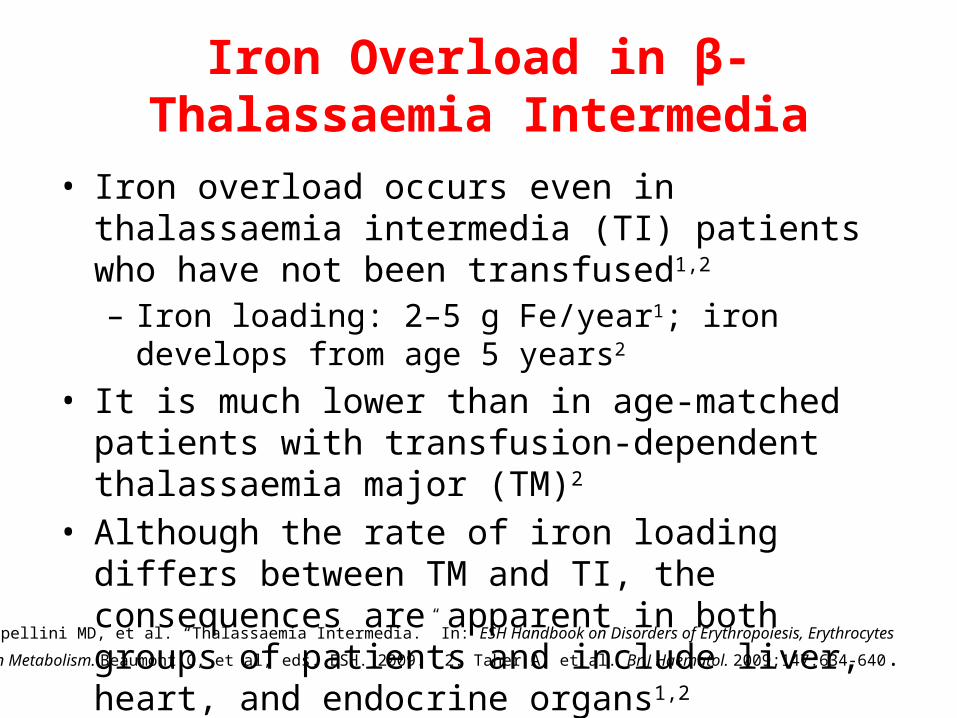
Iron Overload in β-Thalassaemia Intermedia
• Iron overload occurs even in thalassaemia intermedia (TI) patients who have not been transfused1,2
– Iron loading: 2–5 g Fe/year1; iron develops from age 5 years2
• It is much lower than in age-matched patients with transfusion-dependent thalassaemia major (TM)2
• Although the rate of iron loading differs between TM and TI, the consequences are apparent in both groups of patients and include liver, heart, and endocrine organs1,2
1. Cappellini MD, et al. “Thalassaemia Intermedia.” In: ESH Handbook on Disorders of Erythropoiesis, Erythrocytes
and Iron Metabolism. Beaumont C, et al, eds. ESH. 2009. 2. Taher A, et al. Br J Haematol. 2009;147:634-640.
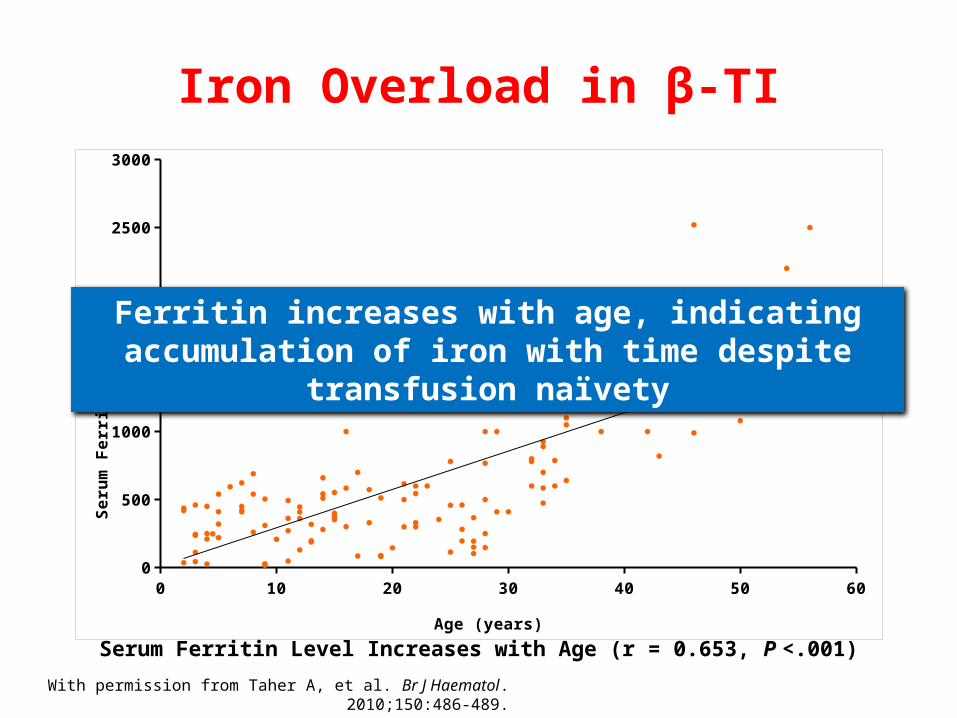
Iron Overload in β-TI
0 10 20 30 40 50 600
500
1000
1500
2000
2500
3000
Age (years)
Se
rum
Fe
rrit
in (
µg
/L)
Serum Ferritin Level Increases with Age (r = 0.653, P <.001)
With permission from Taher A, et al. Br J Haematol. 2010;150:486-489.
Ferritin increases with age, indicating accumulation of iron with time despite transfusion naïvety
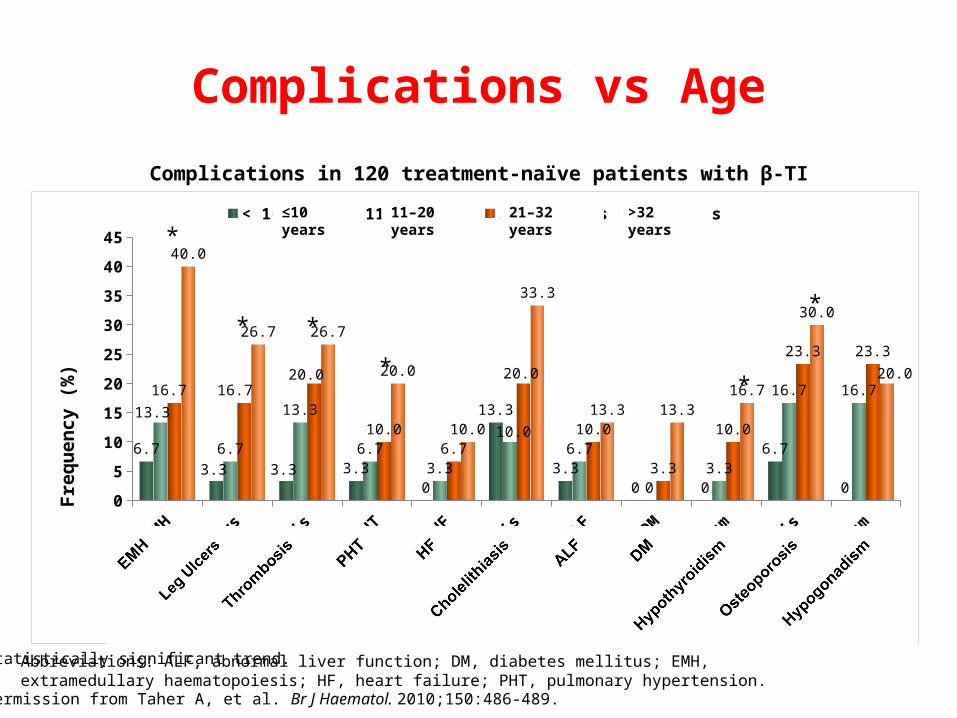
Complications vs Age
EMH
Leg u
lcer
s
Throm
bosis
PHT HF
Cholelit
hiasi
sALF
DM
Hypoth
yroid
ism
Osteo
porosi
s
Hypogonad
ism
0
5
10
15
20
25
30
35
40
45
6.7
3.3 3.3 3.3
0
13.3
3.3
0 0
6.7
0
13.3
6.7
13.3
6.7
3.3
10.06.7
0
3.3
16.7 16.716.7 16.720.0
10.0
6.7
20.0
10.0
3.3
10.0
23.3 23.3
40.0
26.7 26.7
20.0
10.0
33.3
13.3 13.3
16.7
30.0
20.0
< 10 years 11-20 years 21-32 years >32 years
Fre
qu
en
cy
(%
)
*
* *
**
*
≤10 years 11–20 years 21–32 years >32 years
Complications in 120 treatment-naïve patients with β-TI
With permission from Taher A, et al. Br J Haematol. 2010;150:486-489.
* Statistically significant trend.Abbreviations: ALF, abnormal liver function; DM, diabetes mellitus; EMH, extramedullary haematopoiesis; HF, heart failure; PHT, pulmonary hypertension.
Iron Overload in HbE β-Thalassaemia
• Variable non–transfusional iron accumulation• Early studies found substantial iron overload
and evidence of end-organ damage• Results of follow-up studies show highly
variable rates of iron accumulation from periods ranging from 3 to 11 years
Olivieri NF, et al. J Pediatr Hematol Oncol. 2000;22:593-597.
Iron Overload in HbH
• High serum ferritin levels observed in older haemoglobin H α-thalassaemia patients1
• Serum ferritin levels increase with age and correlate with liver iron concentration2
1. Chui DH, et al. Blood. 2003;101:791-800.2. Lal A, et al. N Engl J Med. 2011;364:710-718.
Iron Overload in HbH
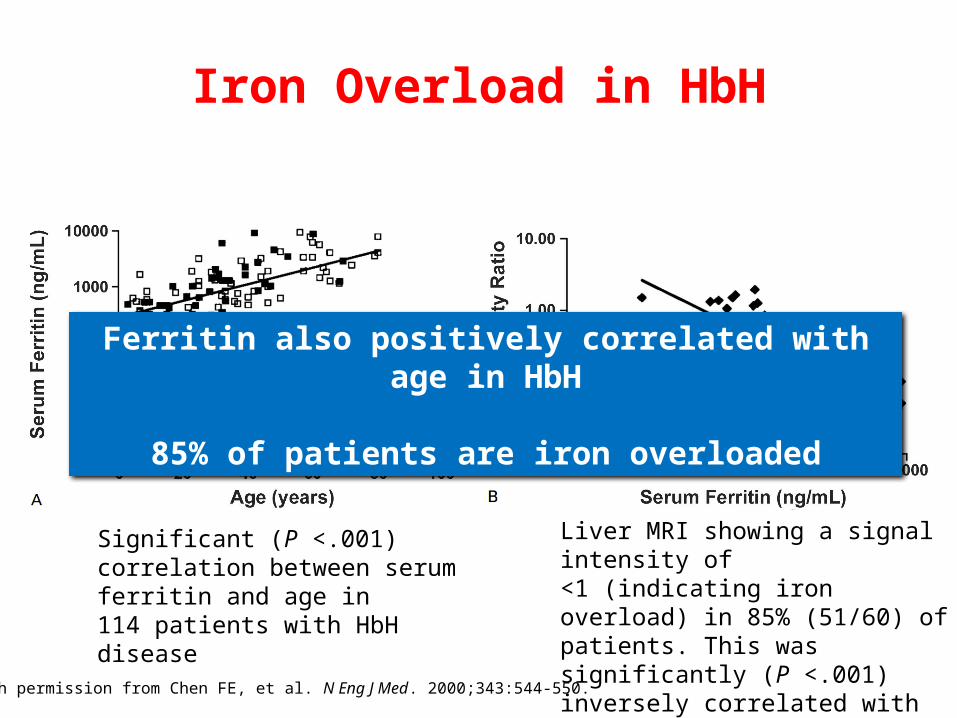
Significant (P <.001) correlation between serum ferritin and age in 114 patients with HbH disease
Liver MRI showing a signal intensity of<1 (indicating iron overload) in 85% (51/60) of patients. This was significantly (P <.001) inversely correlated with serum ferritin levels
With permission from Chen FE, et al. N Eng J Med. 2000;343:544-550.
Ferritin also positively correlated with age in HbH
85% of patients are iron overloaded
Assessment of Iron Overload
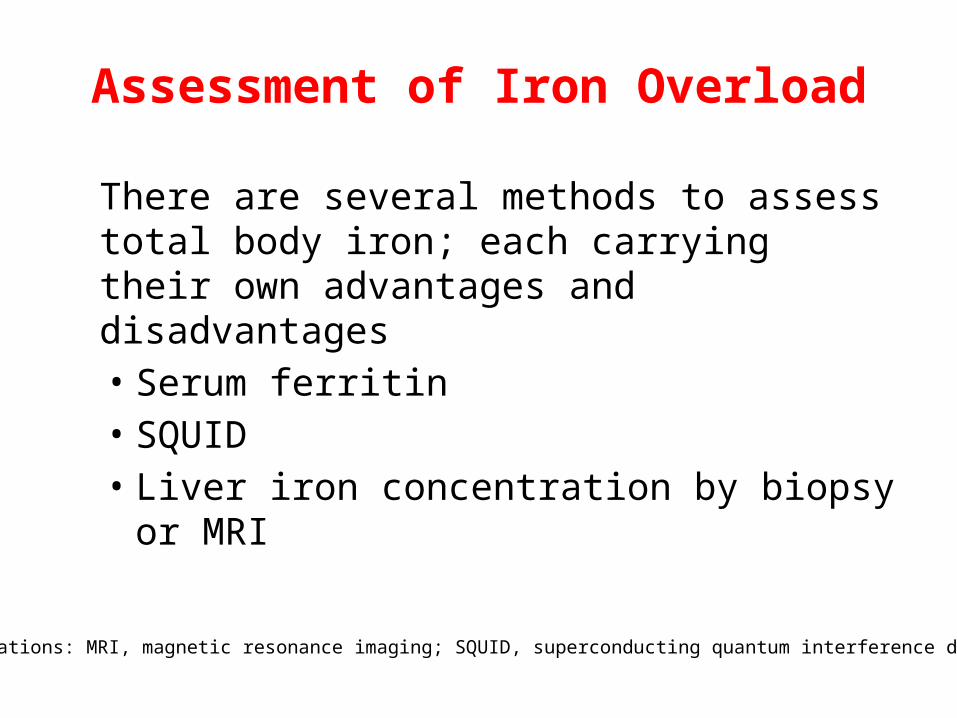
There are several methods to assess total body iron; each carrying their own advantages and disadvantages• Serum ferritin• SQUID• Liver iron concentration by biopsy or MRI
Abbreviations: MRI, magnetic resonance imaging; SQUID, superconducting quantum interference device.
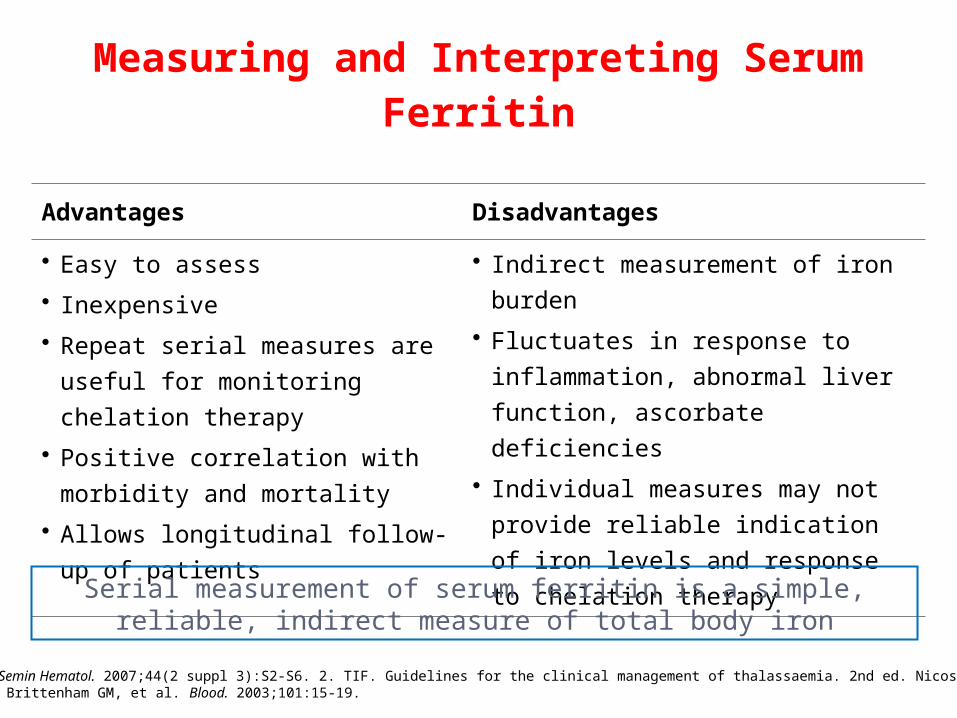
Advantages Disadvantages
• Easy to assess• Inexpensive• Repeat serial measures are useful
for monitoring chelation therapy• Positive correlation with morbidity
and mortality• Allows longitudinal follow-up of
patients
• Indirect measurement of iron burden• Fluctuates in response to inflammation,
abnormal liver function, ascorbate deficiencies
• Individual measures may not provide reliable indication of iron levels and response to chelation therapy
Measuring and Interpreting Serum Ferritin
Serial measurement of serum ferritin is a simple, reliable, indirect measure of total body iron
Taher A, et al. Semin Hematol. 2007;44(2 suppl 3):S2-S6. 2. TIF. Guidelines for the clinical management of thalassaemia. 2nd ed. Nicosia, Cyprus; 2008. 3. Brittenham GM, et al. Blood. 2003;101:15-19.
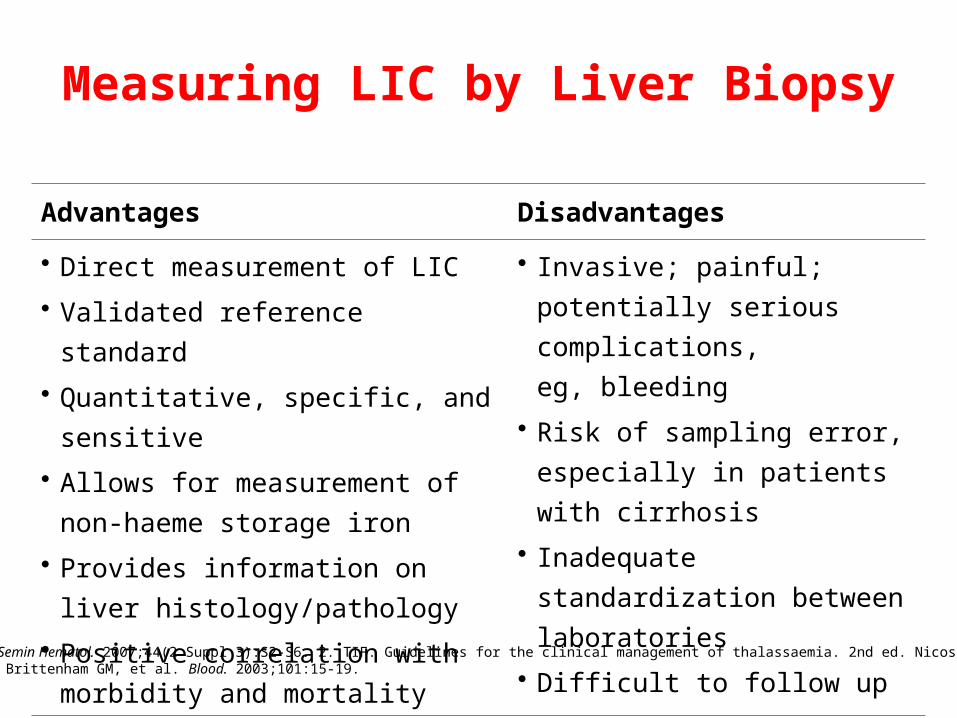
Measuring LIC by Liver Biopsy
Advantages Disadvantages
• Direct measurement of LIC• Validated reference standard• Quantitative, specific, and sensitive• Allows for measurement of non-haeme
storage iron • Provides information on liver
histology/pathology• Positive correlation with morbidity and
mortality
• Invasive; painful; potentially serious complications, eg, bleeding
• Risk of sampling error, especially in patients with cirrhosis
• Inadequate standardization between laboratories
• Difficult to follow up
Taher A, et al. Semin Hematol. 2007;44(2 Suppl 3):S2-S6. 2. TIF. Guidelines for the clinical management of thalassaemia. 2nd ed. Nicosia, Cyprus; 2008. 3. Brittenham GM, et al. Blood. 2003;101:15-19.
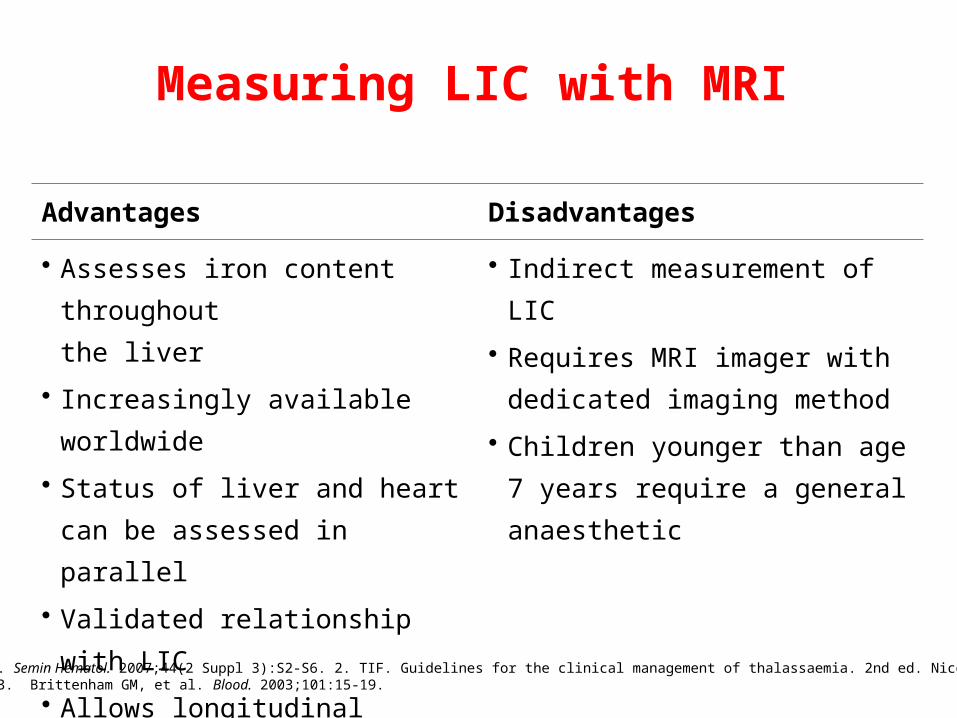
Measuring LIC with MRI
Advantages Disadvantages
• Assesses iron content throughout the liver
• Increasingly available worldwide• Status of liver and heart can be
assessed in parallel• Validated relationship with LIC• Allows longitudinal patient follow-up
• Indirect measurement of LIC• Requires MRI imager with dedicated
imaging method• Children younger than age 7 years
require a general anaesthetic
Taher A, et al. Semin Hematol. 2007;44(2 Suppl 3):S2-S6. 2. TIF. Guidelines for the clinical management of thalassaemia. 2nd ed. Nicosia, Cyprus; 2008. 3. Brittenham GM, et al. Blood. 2003;101:15-19.
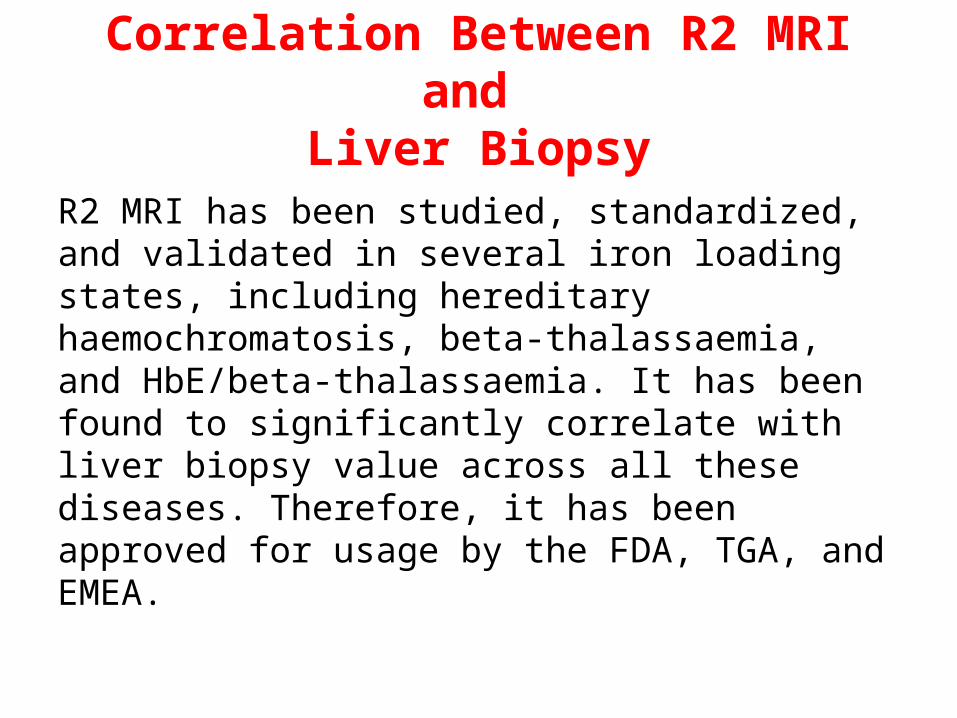
Correlation Between R2 MRI and Liver Biopsy
R2 MRI has been studied, standardized, and validated in several iron loading states, including hereditary haemochromatosis, beta-thalassaemia, and HbE/beta-thalassaemia. It has been found to significantly correlate with liver biopsy value across all these diseases. Therefore, it has been approved for usage by the FDA, TGA, and EMEA.
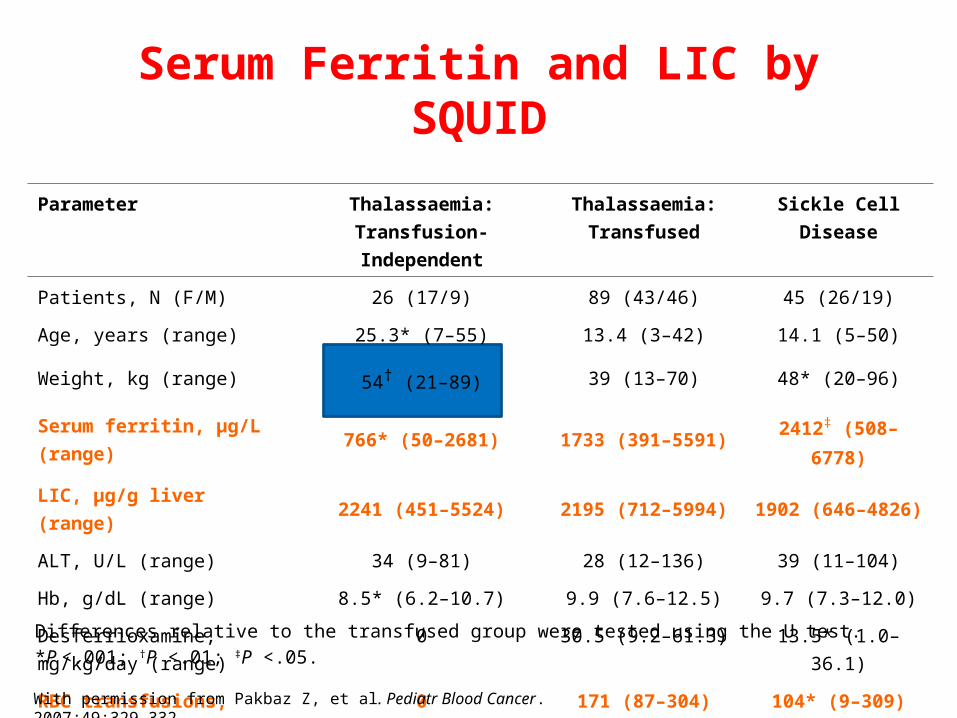
Serum Ferritin and LIC by SQUID
Parameter Thalassaemia:Transfusion-Independent
Thalassaemia:Transfused
Sickle Cell Disease
Patients, N (F/M) 26 (17/9) 89 (43/46) 45 (26/19)
Age, years (range) 25.3* (7–55) 13.4 (3–42) 14.1 (5–50)
Weight, kg (range) 54† (21–89) 39 (13–70) 48* (20–96)
Serum ferritin, μg/L (range) 766* (50–2681) 1733 (391–5591) 2412‡ (508–6778)
LIC, μg/g liver (range) 2241 (451–5524) 2195 (712–5994) 1902 (646–4826)
ALT, U/L (range) 34 (9–81) 28 (12–136) 39 (11–104)
Hb, g/dL (range) 8.5* (6.2–10.7) 9.9 (7.6–12.5) 9.7 (7.3–12.0)
Desferrioxamine, mg/kg/day (range)
0 30.5 (9.2–61.3) 13.5* (1.0–36.1)
RBC transfusions, mL/kg/year (range)
0 171 (87–304) 104* (9–309)
With permission from Pakbaz Z, et al. Pediatr Blood Cancer. 2007;49:329-332.
Differences relative to the transfused group were tested using the U test.*P <.001; †P <.01; ‡P <.05.
*LIC normal range is .03–1.04 mg/g dry wt.
With permission from Origa R, et al. Haematologica. 2007;92:583-588.
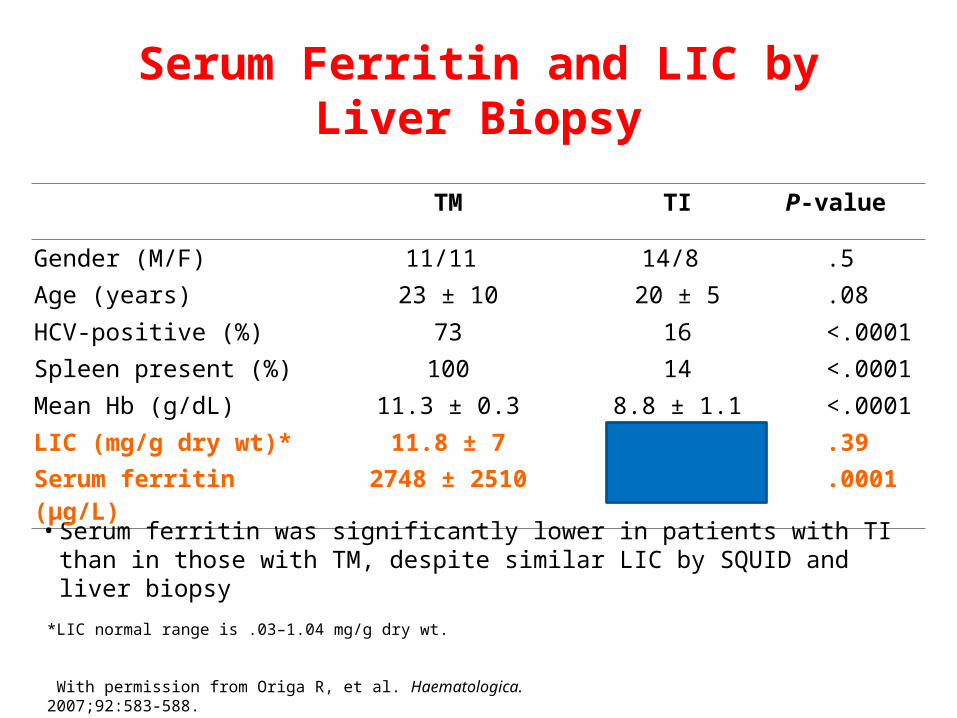
Serum Ferritin and LIC by Liver Biopsy
• Serum ferritin was significantly lower in patients with TI than in those with TM, despite similar LIC by SQUID and liver biopsy
TM TI P-value
Gender (M/F) 11/11 14/8 .5
Age (years) 23 ± 10 20 ± 5 .08
HCV-positive (%) 73 16<.0001
Spleen present (%) 100 14<.0001
Mean Hb (g/dL) 11.3 ± 0.3 8.8 ± 1.1<.0001
LIC (mg/g dry wt)* 11.8 ± 7 11.3 ± 6 .39
Serum ferritin (μg/L) 2748 ± 2510 627 ± 309.0001
10002000
30004000
500060007000
8000
900010000
0 5 10 15 20 25 30 35 40 45 50
LIC (mg Fe/g dry wt)
Seru
m F
erriti
n Le
vel (
μg/L
)
TI TMLinear (TI) Linear (TM)
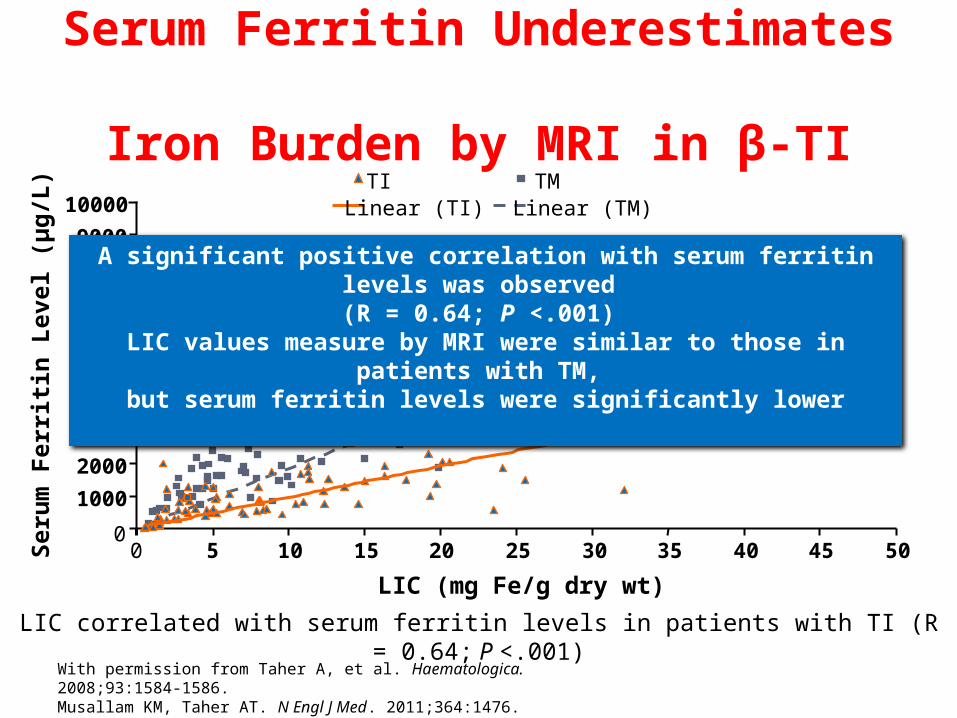
Serum Ferritin Underestimates Iron Burden by MRI in β-TI
With permission from Taher A, et al. Haematologica. 2008;93:1584-1586.Musallam KM, Taher AT. N Engl J Med. 2011;364:1476.
LIC correlated with serum ferritin levels in patients with TI (R = 0.64; P <.001)
0
A significant positive correlation with serum ferritin levels was observed (R = 0.64; P <.001)
LIC values measure by MRI were similar to those in patients with TM, but serum ferritin levels were significantly lower
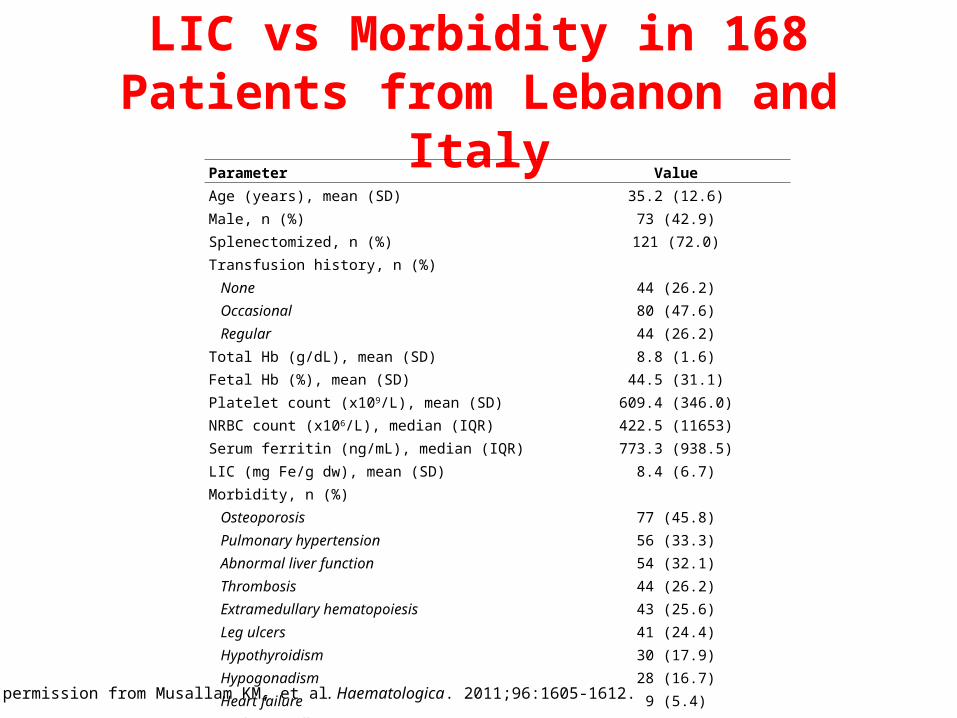
LIC vs Morbidity in 168 Patients from Lebanon and Italy
Parameter Value
Age (years), mean (SD) 35.2 (12.6)Male, n (%) 73 (42.9)Splenectomized, n (%) 121 (72.0)Transfusion history, n (%)
None 44 (26.2)Occasional 80 (47.6)Regular 44 (26.2)
Total Hb (g/dL), mean (SD) 8.8 (1.6)Fetal Hb (%), mean (SD) 44.5 (31.1)Platelet count (x109/L), mean (SD) 609.4 (346.0)NRBC count (x106/L), median (IQR) 422.5 (11653)Serum ferritin (ng/mL), median (IQR) 773.3 (938.5)LIC (mg Fe/g dw), mean (SD) 8.4 (6.7)Morbidity, n (%)
Osteoporosis 77 (45.8)Pulmonary hypertension 56 (33.3)Abnormal liver function 54 (32.1)Thrombosis 44 (26.2)Extramedullary hematopoiesis 43 (25.6)Leg ulcers 41 (24.4)Hypothyroidism 30 (17.9)Hypogonadism 28 (16.7)Heart failure 9 (5.4)Diabetes mellitus 6 (3.6)
With permission from Musallam KM, et al. Haematologica. 2011;96:1605-1612.
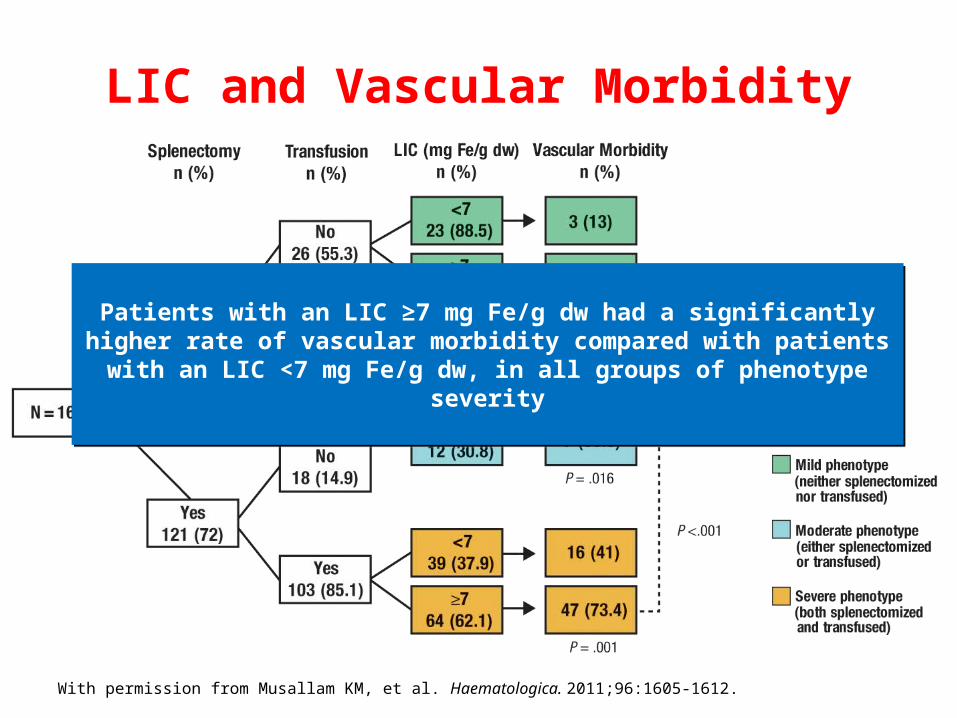
LIC and Vascular Morbidity
With permission from Musallam KM, et al. Haematologica. 2011;96:1605-1612.
Patients with an LIC ≥7 mg Fe/g dw had a significantly higher rate of vascular morbidity compared with patients with an LIC <7 mg Fe/g dw, in all groups of
phenotype severity
Patients with an LIC ≥7 mg Fe/g dw had a significantly higher rate of vascular morbidity compared with patients with an LIC <7 mg Fe/g dw, in all groups of
phenotype severity
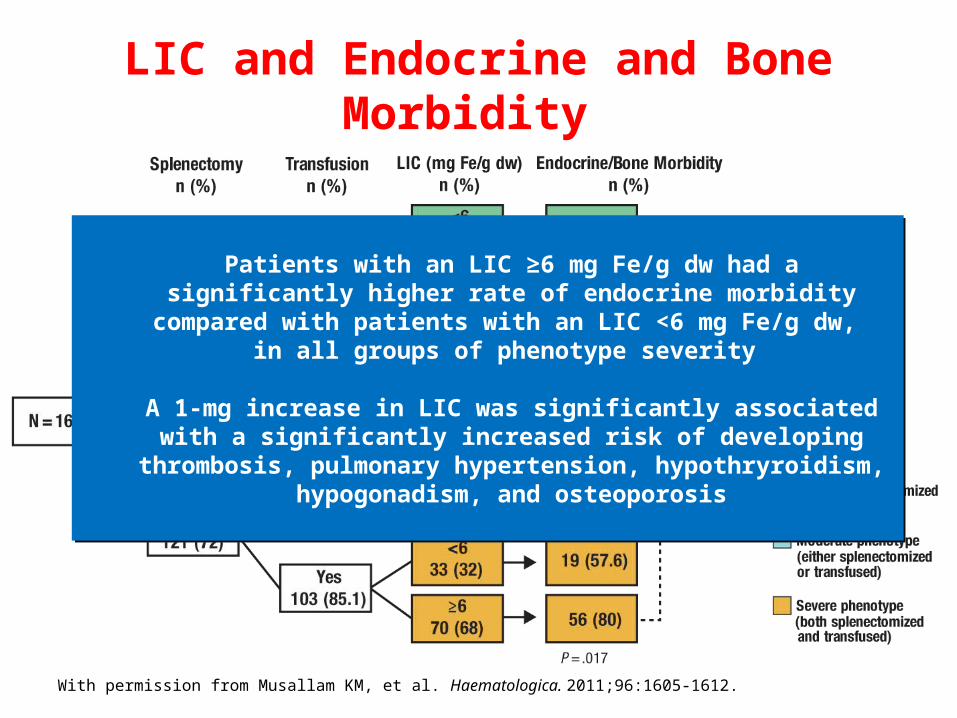
LIC and Endocrine and Bone Morbidity
With permission from Musallam KM, et al. Haematologica. 2011;96:1605-1612.
Patients with an LIC ≥6 mg Fe/g dw had a significantly higher rate of endocrine morbidity compared with patients with an LIC <6 mg Fe/g dw,
in all groups of phenotype severity
A 1-mg increase in LIC was significantly associated with a significantly increased risk of developing thrombosis, pulmonary hypertension,
hypothryroidism, hypogonadism, and osteoporosis
Iron Chelation
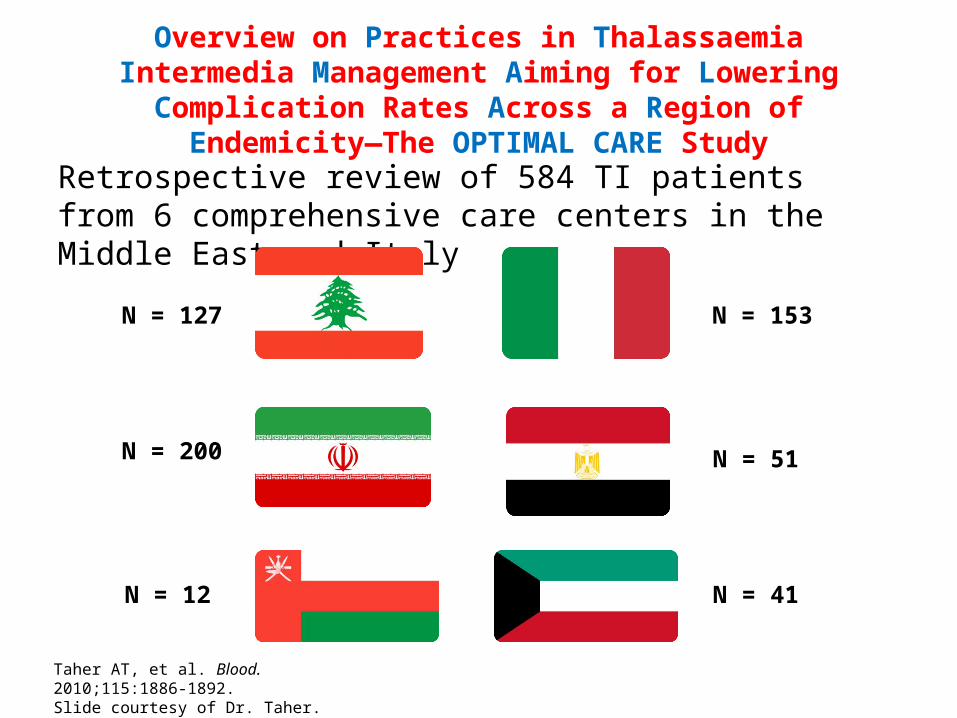
Overview on Practices in Thalassaemia Intermedia Management Aiming for Lowering Complication Rates Across a Region of
Endemicity—The OPTIMAL CARE Study
Retrospective review of 584 TI patients from 6 comprehensive care centers in the Middle East and Italy
Taher AT, et al. Blood. 2010;115:1886-1892.Slide courtesy of Dr. Taher.
N = 12
N = 127
N = 51
N = 153
N = 200
N = 41
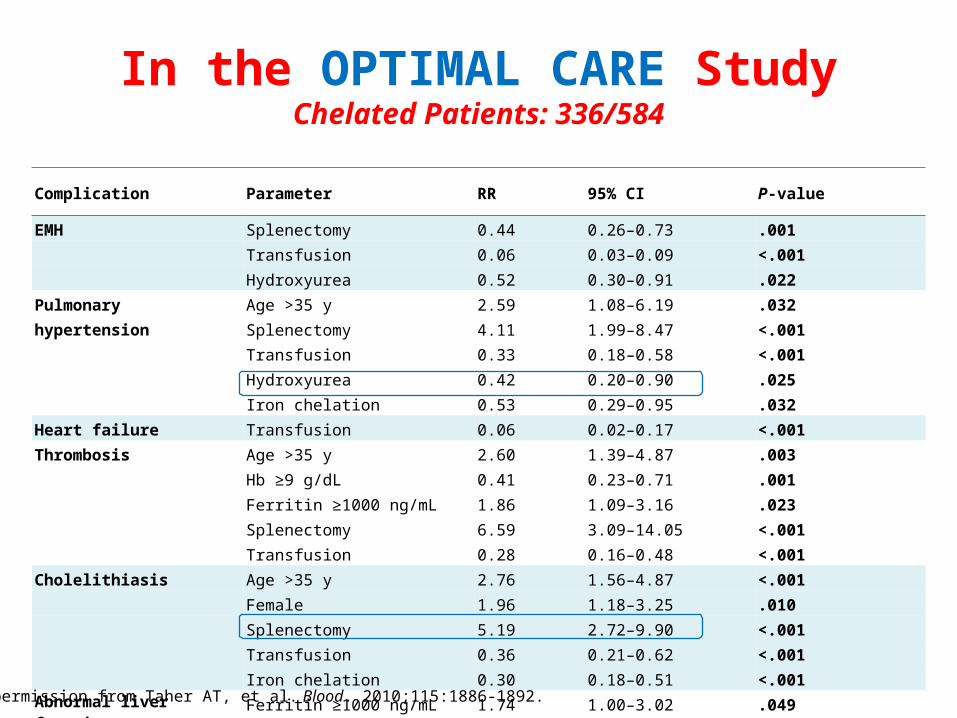
Complication Parameter RR 95% CI P-value
EMH Splenectomy 0.44 0.26–0.73 .001Transfusion 0.06 0.03–0.09 <.001Hydroxyurea 0.52 0.30–0.91 .022
Pulmonary hypertension Age >35 y 2.59 1.08–6.19 .032Splenectomy 4.11 1.99–8.47 <.001Transfusion 0.33 0.18–0.58 <.001Hydroxyurea 0.42 0.20–0.90 .025Iron chelation 0.53 0.29–0.95 .032
Heart failure Transfusion 0.06 0.02–0.17 <.001Thrombosis Age >35 y 2.60 1.39–4.87 .003
Hb ≥9 g/dL 0.41 0.23–0.71 .001Ferritin ≥1000 ng/mL 1.86 1.09–3.16 .023Splenectomy 6.59 3.09–14.05 <.001Transfusion 0.28 0.16–0.48 <.001
Cholelithiasis Age >35 y 2.76 1.56–4.87 <.001Female 1.96 1.18–3.25 .010Splenectomy 5.19 2.72–9.90 <.001Transfusion 0.36 0.21–0.62 <.001Iron chelation 0.30 0.18–0.51 <.001
Abnormal liver function Ferritin ≥1000 ng/mL 1.74 1.00–3.02 .049
In the OPTIMAL CARE StudyChelated Patients: 336/584
With permission from Taher AT, et al. Blood. 2010;115:1886-1892.
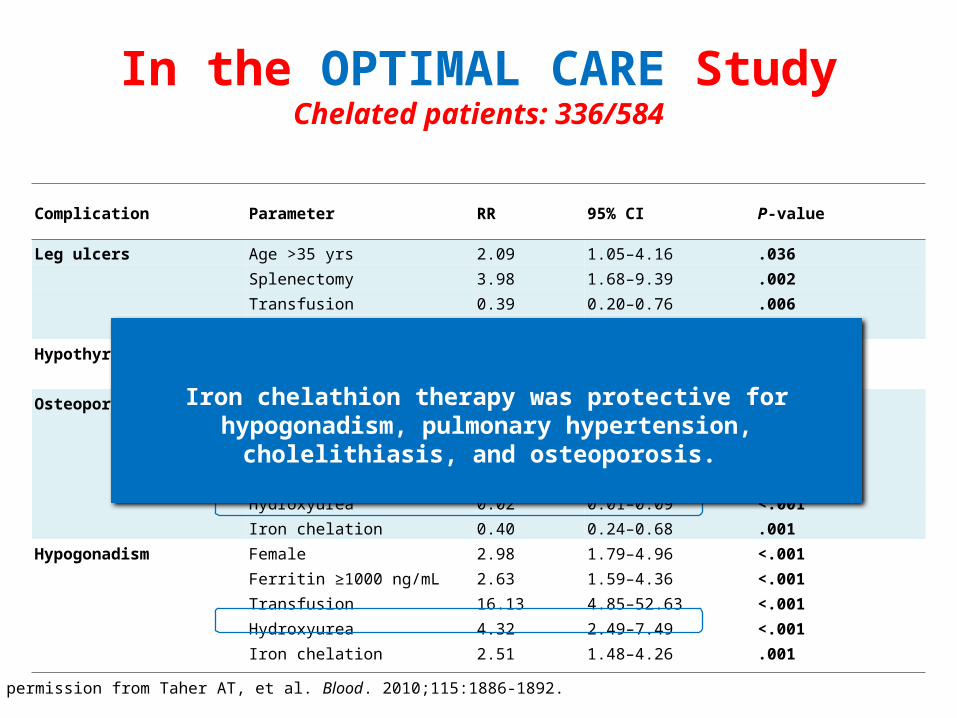
Complication Parameter RR 95% CI P-value
Leg ulcers Age >35 yrs 2.09 1.05–4.16 .036Splenectomy 3.98 1.68–9.39 .002Transfusion 0.39 0.20–0.76 .006Hydroxyurea 0.10 0.02–0.43 .002
Hypothyroidism Splenectomy 6.04 2.03–17.92 .001Hydroxyurea 0.05 0.01–0.45 .003
Osteoporosis Age >35 yrs 3.51 2.06–5.99 <.001Female 1.97 1.19–3.27 .009Splenectomy 4.73 2.72-8.24 <.001Transfusion 3.10 1.64–5.85 <.001Hydroxyurea 0.02 0.01–0.09 <.001Iron chelation 0.40 0.24–0.68 .001
Hypogonadism Female 2.98 1.79–4.96 <.001Ferritin ≥1000 ng/mL 2.63 1.59–4.36 <.001Transfusion 16.13 4.85–52.63 <.001Hydroxyurea 4.32 2.49–7.49 <.001Iron chelation 2.51 1.48–4.26 .001
In the OPTIMAL CARE StudyChelated patients: 336/584
With permission from Taher AT, et al. Blood. 2010;115:1886-1892.
Iron chelathion therapy was protective for hypogonadism, pulmonary hypertension, cholelithiasis, and osteoporosis.
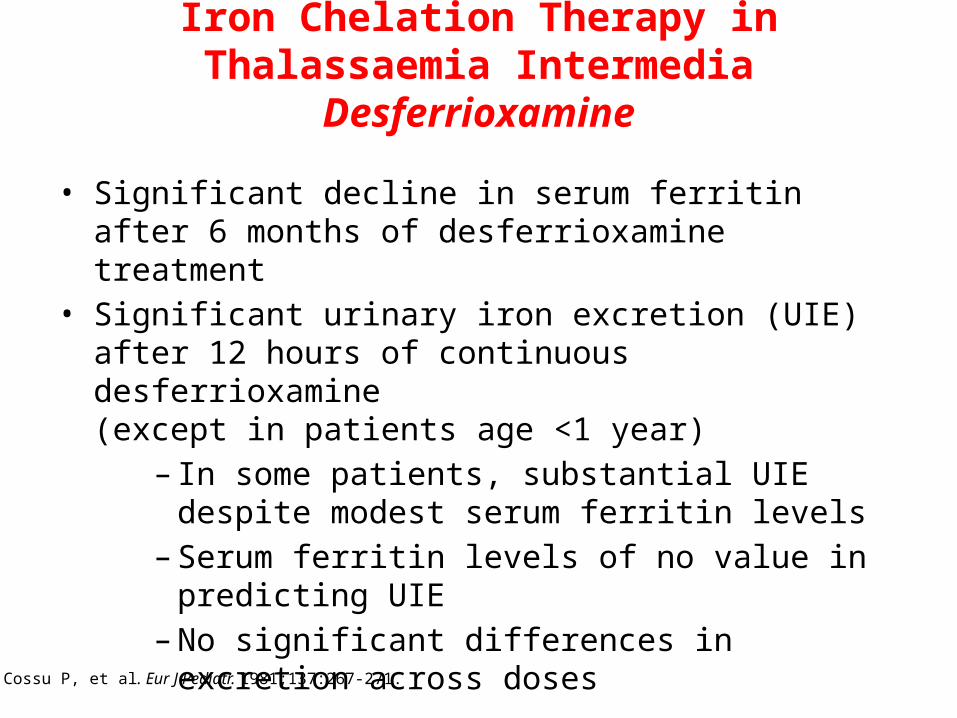
Iron Chelation Therapy in Thalassaemia IntermediaDesferrioxamine
• Significant decline in serum ferritin after 6 months of desferrioxamine treatment
• Significant urinary iron excretion (UIE) after 12 hours of continuous desferrioxamine (except in patients age <1 year)
– In some patients, substantial UIE despite modest serum ferritin levels
– Serum ferritin levels of no value in predicting UIE– No significant differences in excretion across doses
Cossu P, et al. Eur J Pediatr. 1981;137:267-271.
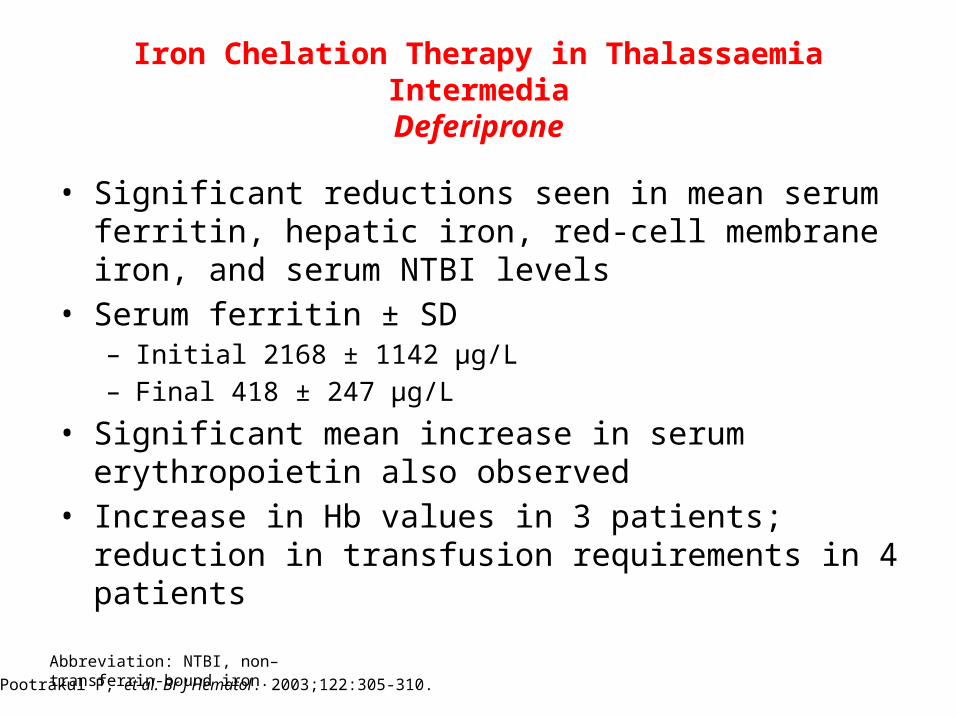
Iron Chelation Therapy in Thalassaemia IntermediaDeferiprone
• Significant reductions seen in mean serum ferritin, hepatic iron, red-cell membrane iron, and serum NTBI levels
• Serum ferritin ± SD – Initial 2168 ± 1142 μg/L– Final 418 ± 247 μg/L
• Significant mean increase in serum erythropoietin also observed
• Increase in Hb values in 3 patients; reduction in transfusion requirements in 4 patients
Pootrakul P, et al. Br J Hematol. 2003;122:305-310.Abbreviation: NTBI, non–transferrin-bound iron.
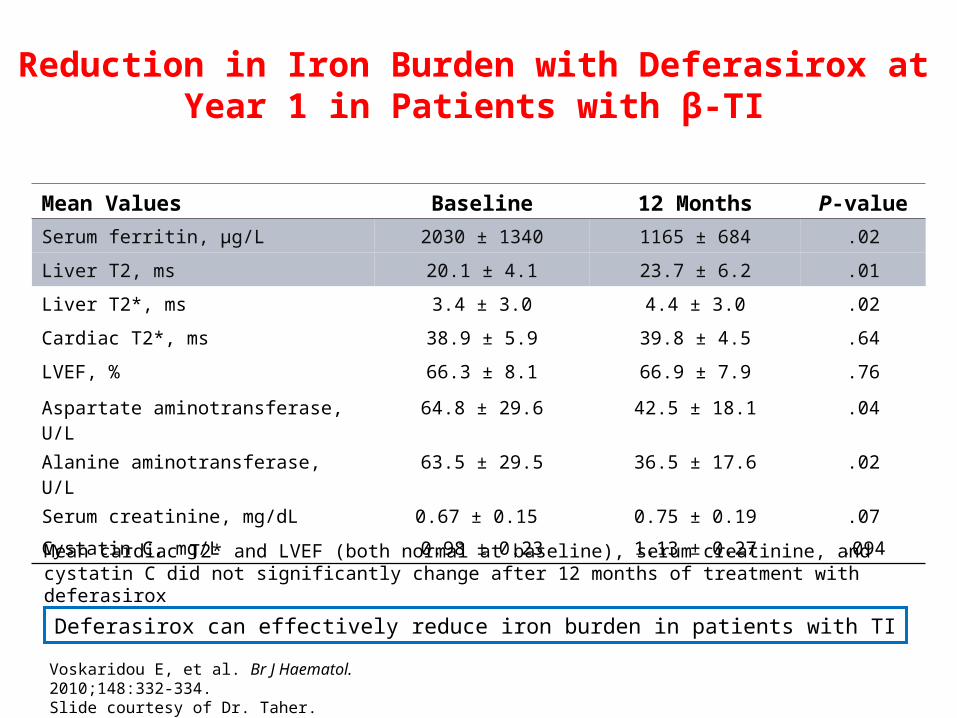
Reduction in Iron Burden with Deferasirox at Year 1 in Patients with β-TI
Mean cardiac T2* and LVEF (both normal at baseline), serum creatinine, and cystatin C did not significantly change after 12 months of treatment with deferasirox
Mean Values Baseline 12 Months P-value
Serum ferritin, µg/L 2030 ± 1340 1165 ± 684 .02
Liver T2, ms 20.1 ± 4.1 23.7 ± 6.2 .01
Liver T2*, ms 3.4 ± 3.0 4.4 ± 3.0 .02
Cardiac T2*, ms 38.9 ± 5.9 39.8 ± 4.5 .64
LVEF, % 66.3 ± 8.1 66.9 ± 7.9 .76
Aspartate aminotransferase, U/L 64.8 ± 29.6 42.5 ± 18.1 .04
Alanine aminotransferase, U/L 63.5 ± 29.5 36.5 ± 17.6 .02
Serum creatinine, mg/dL 0.67 ± 0.15 0.75 ± 0.19 .07
Cystatin C, mg/L 0.98 ± 0.23 1.13 ± 0.27 .094
Deferasirox can effectively reduce iron burden in patients with TI
Voskaridou E, et al. Br J Haematol. 2010;148:332-334.Slide courtesy of Dr. Taher.
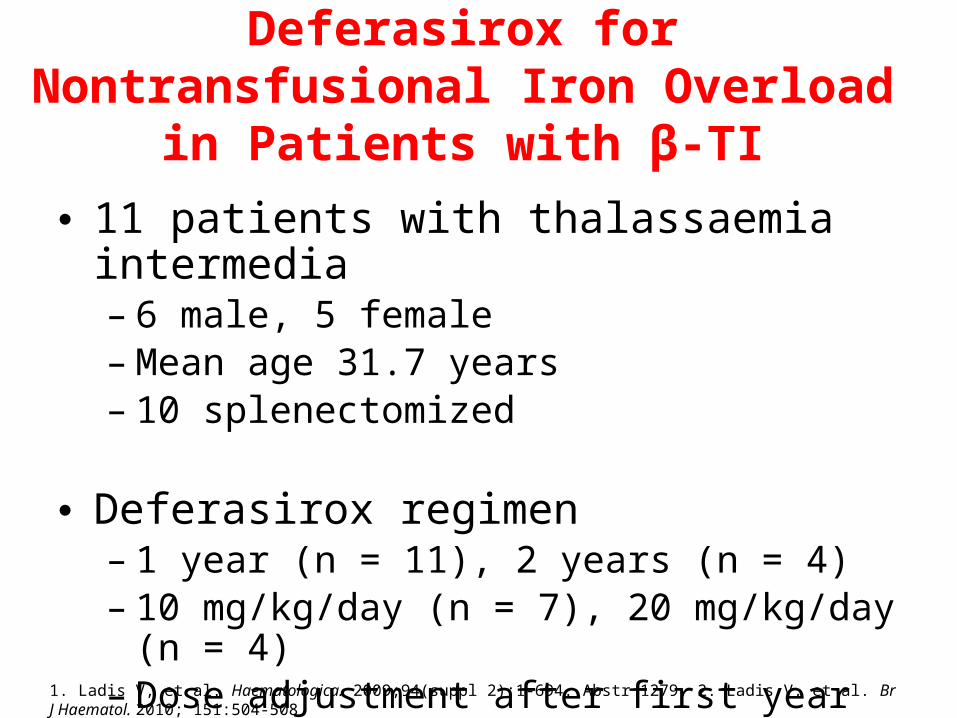
Deferasirox for Nontransfusional Iron Overload in Patients with β-TI
● 11 patients with thalassaemia intermedia– 6 male, 5 female– Mean age 31.7 years– 10 splenectomized
● Deferasirox regimen– 1 year (n = 11), 2 years (n = 4)– 10 mg/kg/day (n = 7), 20 mg/kg/day (n = 4)– Dose adjustment after first year
1. Ladis V, et al. Haematologica. 2009;94(suppl 2):1-694. Abstr 1279. 2. Ladis V, et al. Br J Haematol. 2010; 151:504-508.
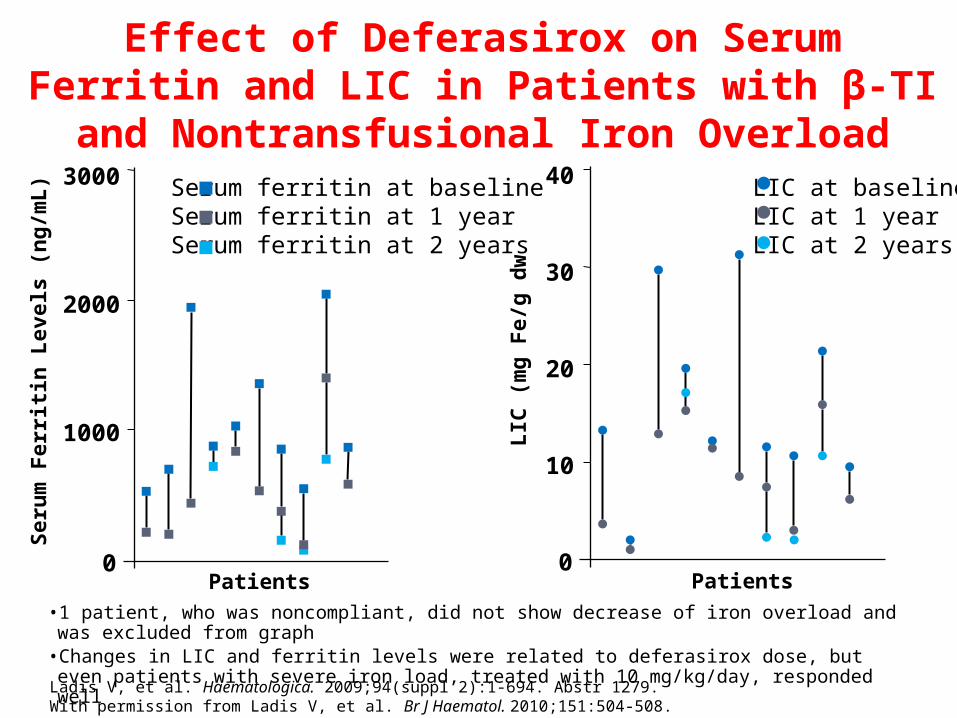
Effect of Deferasirox on Serum Ferritin and LIC in Patients with β-TI and Nontransfusional Iron Overload
Serum ferritin at baselineSerum ferritin at 1 yearSerum ferritin at 2 years
LIC at baselineLIC at 1 yearLIC at 2 years
0
1000
2000
3000
Seru
m F
erriti
n Le
vels
(ng/
mL)
Patients0
10
20
40
LIC
(mg
Fe/g
dw
30
Patients• 1 patient, who was noncompliant, did not show decrease of iron overload and was excluded from graph• Changes in LIC and ferritin levels were related to deferasirox dose, but even patients with severe iron load,
treated with 10 mg/kg/day, responded well
Ladis V, et al. Haematologica. 2009;94(suppl 2):1-694. Abstr 1279. With permission from Ladis V, et al. Br J Haematol. 2010;151:504-508.
Safety of Deferasirox During Treatment of Up to 2 Years
• Treatment was well tolerated – No serious adverse events were noted
• Creatinine and cystatin C levels did not change during treatment
• Transaminase levels significantly decreased in year 1 (P = .0002) and year 2 (P = .024) of treatment– This improvement probably due to decreased
hepatic siderosis1. Ladis V, et al. Haematologica. 2009;94(suppl 2):1-694. Abstr 1279. 2. Ladis V, et al. Br J Haematol. 2010;151:504-508.
Deferasirox Significantly Reduces Liver Iron Concentration In Non–Transfusion-Dependent Thalassaemia Patients with
Iron Overload
Results from the 1-Year Randomized, Double-Blind, Placebo-Controlled
Phase II THALASSA Study

Aim of the THALASSA Study
Primary objective: To assess the efficacy of 2 deferasirox regimens (starting doses 5 and 10 mg/kg/day) in patients with NTDT, based on the change in LIC from baseline after 1 year of treatment compared with placebo-treated patients
Other objectives• To compare change from baseline in serum ferritin (SF) over 1 year of treatment between
deferasirox and placebo treatment groups• To evaluate the safety of both regimens of deferasirox vs placebo• To evaluate the relationship between SF and LIC• To evaluate the iron accumulation rate based on LIC assessment in patients treated with
placebo
Taher AT, et al. Presented at: 53rd ASH Annual Meeting; Dec 13, 2011: Abstr 902.
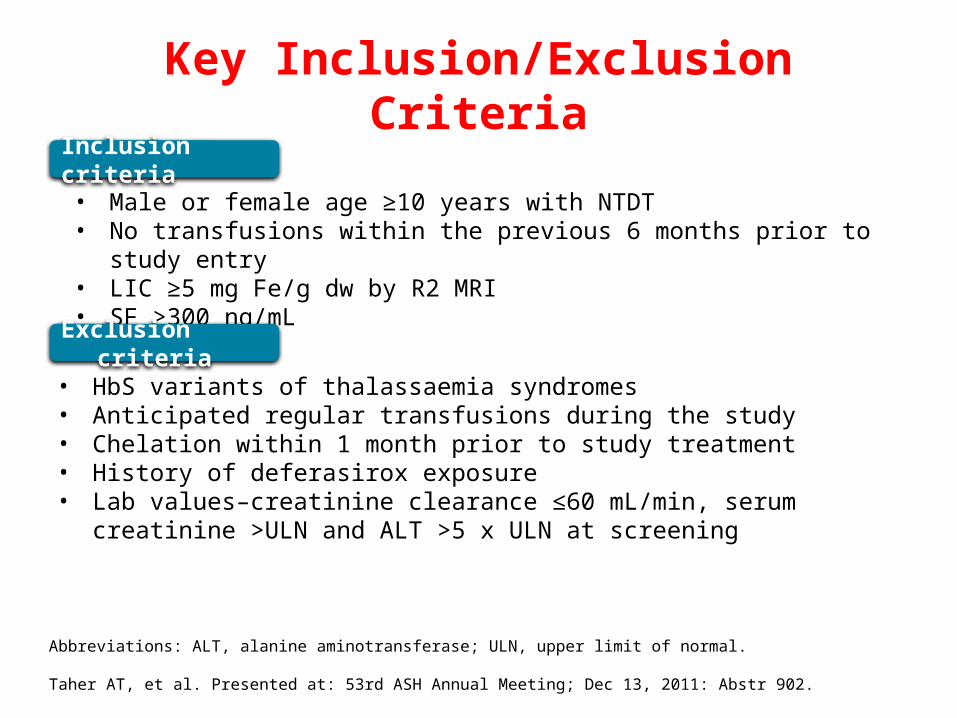
• Male or female age ≥10 years with NTDT• No transfusions within the previous 6 months prior to study entry• LIC ≥5 mg Fe/g dw by R2 MRI• SF >300 ng/mL
Exclusion criteria
Inclusion criteria
Key Inclusion/Exclusion Criteria
• HbS variants of thalassaemia syndromes• Anticipated regular transfusions during the study• Chelation within 1 month prior to study treatment• History of deferasirox exposure• Lab values–creatinine clearance ≤60 mL/min, serum creatinine >ULN and ALT >5 x
ULN at screening
Abbreviations: ALT, alanine aminotransferase; ULN, upper limit of normal.
Taher AT, et al. Presented at: 53rd ASH Annual Meeting; Dec 13, 2011: Abstr 902.
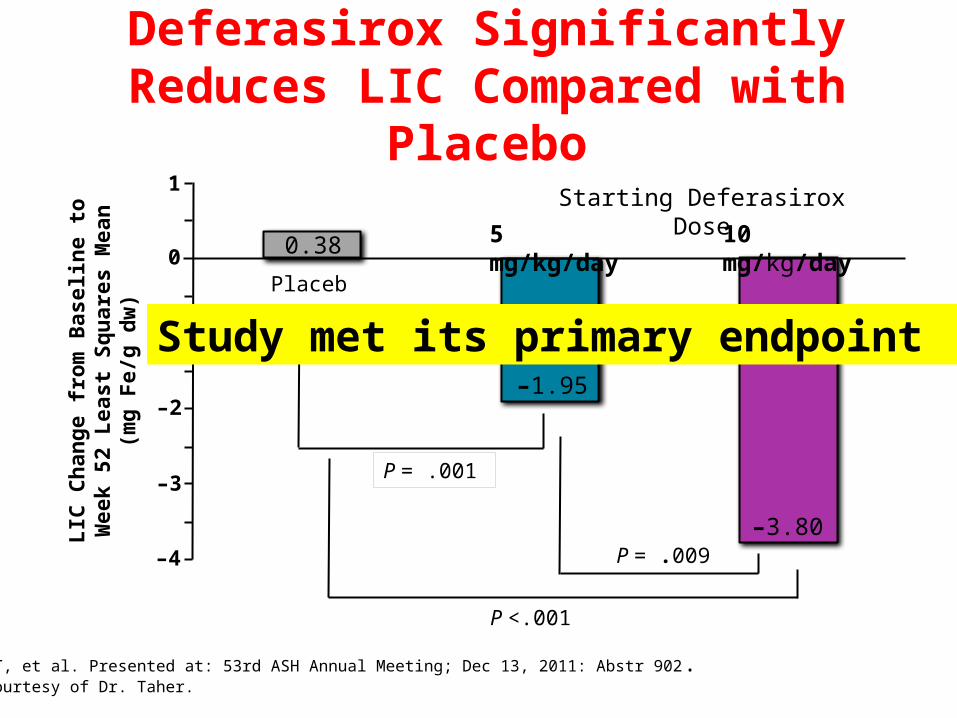
Deferasirox Significantly Reduces LIC Compared with Placebo
–1.95
–3.80
0.38
Placebo
5 mg/kg/day 10 mg/kg/day
Starting Deferasirox Dose1
0
–1
–2
–3
–4
LIC
Ch
ang
e fr
om
Bas
elin
e to
W
eek
52 L
east
Sq
uar
es M
ean
(m
g
Fe/
g d
w)
P = .001
P <.001
P = .009
Study met its primary endpoint
Taher AT, et al. Presented at: 53rd ASH Annual Meeting; Dec 13, 2011: Abstr 902.Slide courtesy of Dr. Taher.
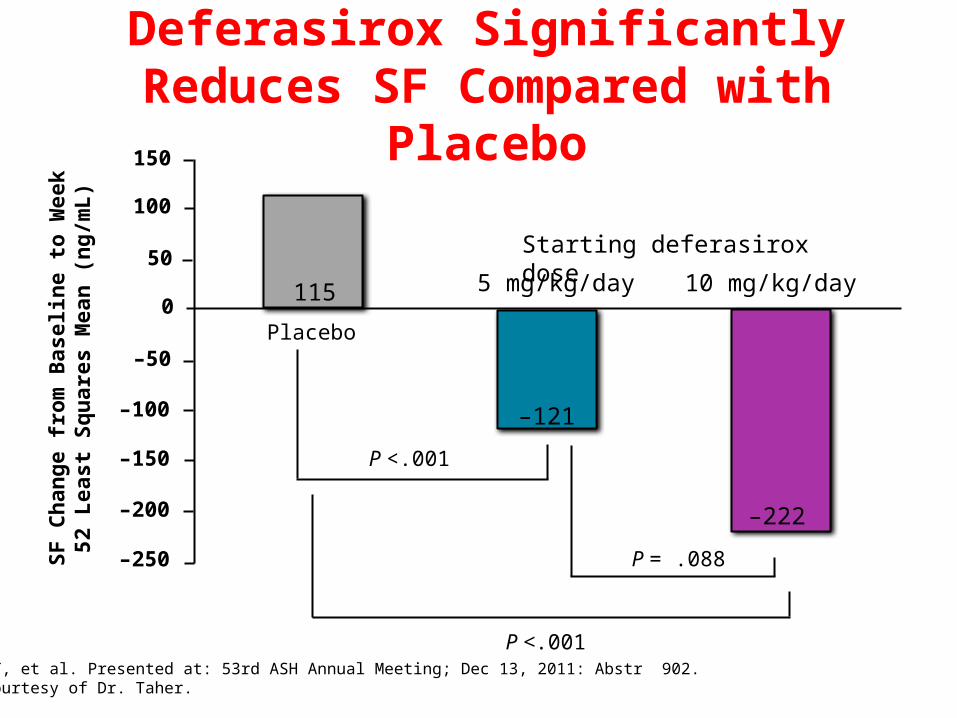
Deferasirox Significantly Reduces SF Compared with Placebo
–121
–222
115
Placebo
5 mg/kg/day 10 mg/kg/day
Starting deferasirox dose
SF
Ch
ang
e fr
om
Bas
elin
e to
Wee
k 52
L
east
Sq
uar
es M
ean
(n
g/m
L)
P <.001
P <.001
P = .088
150
100
50
0
–50
–100
–150
–200
–250
Taher AT, et al. Presented at: 53rd ASH Annual Meeting; Dec 13, 2011: Abstr 902.Slide courtesy of Dr. Taher.
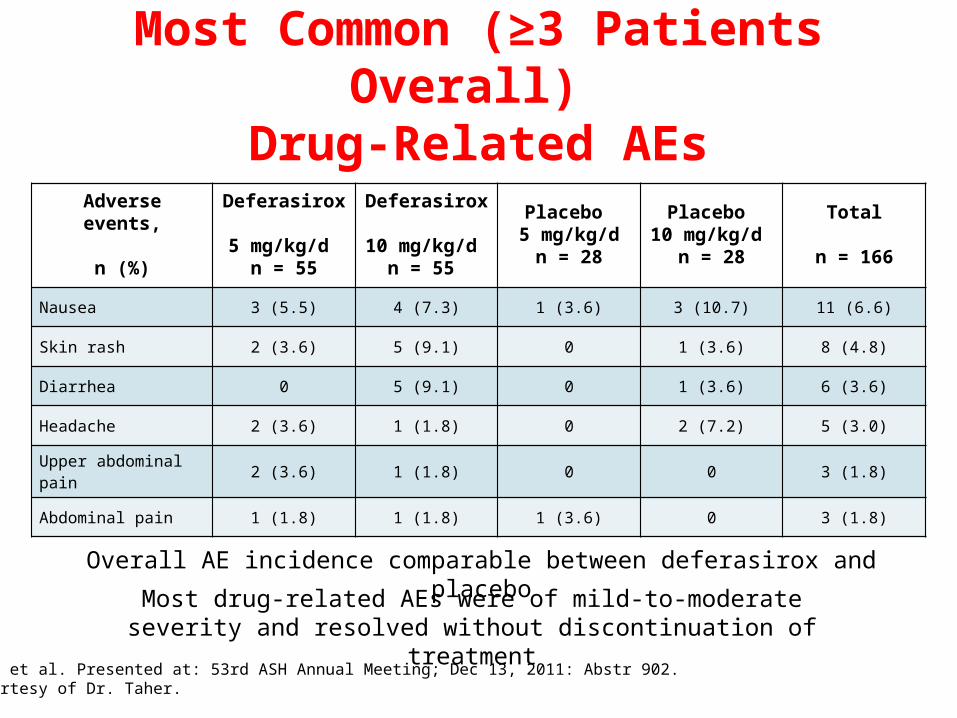
Most Common (≥3 Patients Overall) Drug-Related AEs
Adverse events,
n (%)
Deferasirox 5 mg/kg/d
n = 55
Deferasirox 10 mg/kg/d
n = 55
Placebo 5 mg/kg/d
n = 28
Placebo 10 mg/kg/d
n = 28
Total
n = 166
Nausea 3 (5.5) 4 (7.3) 1 (3.6) 3 (10.7) 11 (6.6)
Skin rash 2 (3.6) 5 (9.1) 0 1 (3.6) 8 (4.8)
Diarrhea 0 5 (9.1) 0 1 (3.6) 6 (3.6)
Headache 2 (3.6) 1 (1.8) 0 2 (7.2) 5 (3.0)
Upper abdominal pain 2 (3.6) 1 (1.8) 0 0 3 (1.8)
Abdominal pain 1 (1.8) 1 (1.8) 1 (3.6) 0 3 (1.8)
Most drug-related AEs were of mild-to-moderate severity and resolved without discontinuation of treatment
Overall AE incidence comparable between deferasirox and placebo
Taher AT, et al. Presented at: 53rd ASH Annual Meeting; Dec 13, 2011: Abstr 902.Slide courtesy of Dr. Taher.
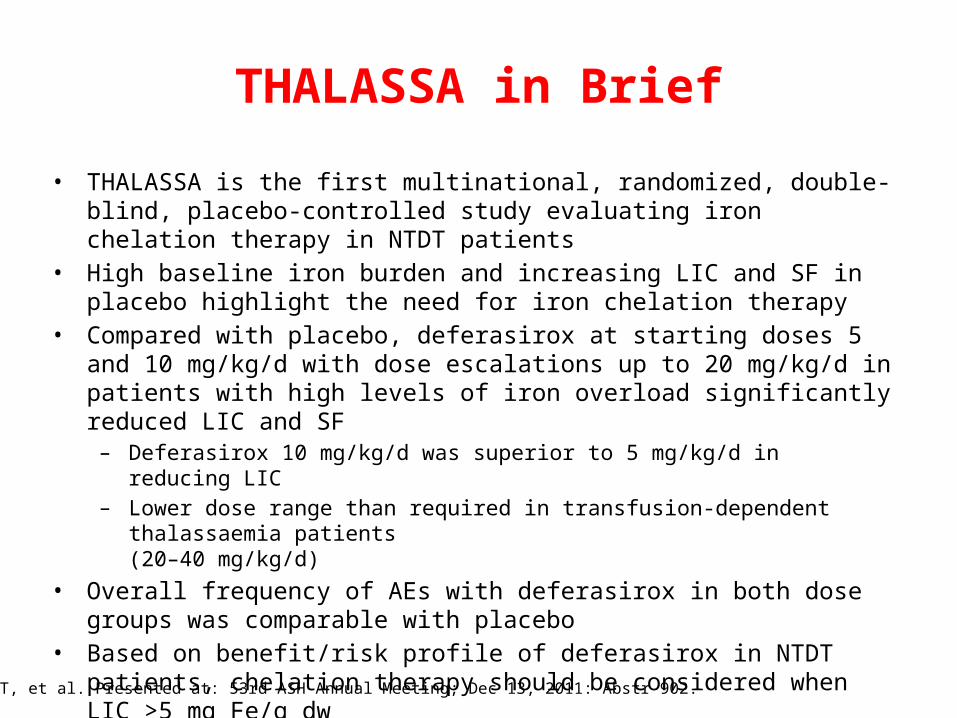
THALASSA in Brief
• THALASSA is the first multinational, randomized, double-blind, placebo-controlled study evaluating iron chelation therapy in NTDT patients
• High baseline iron burden and increasing LIC and SF in placebo highlight the need for iron chelation therapy
• Compared with placebo, deferasirox at starting doses 5 and 10 mg/kg/d with dose escalations up to 20 mg/kg/d in patients with high levels of iron overload significantly reduced LIC and SF
– Deferasirox 10 mg/kg/d was superior to 5 mg/kg/d in reducing LIC– Lower dose range than required in transfusion-dependent thalassaemia patients
(20–40 mg/kg/d)• Overall frequency of AEs with deferasirox in both dose groups was comparable
with placebo• Based on benefit/risk profile of deferasirox in NTDT patients, chelation therapy
should be considered when LIC >5 mg Fe/g dw
Taher AT, et al. Presented at: 53rd ASH Annual Meeting; Dec 13, 2011: Abstr 902.
Conclusions
• Despite being non–transfusion-dependent, NTDT patients are still at an increased risk of complications, including iron overload
• Total body iron should be periodically assessed and chelation therapy tailored accordingly
• In the THALASSA study, deferasirox was shown to be safe and efficacious in reducing iron in NTDT and is awaiting approval


![Management of Thalassaemia[1]](https://img.pdfslide.us/doc/110x75/546a51dfb4af9ffa1d8b461b/management-of-thalassaemia1.jpg)