Embed Size (px)
Citation preview

IRON METABOLISMAND ANEMIA
PAN AMERICAN HEALTH ORGANIZATION
Pan American Sanitary Bureau, Regional Office of the
WORLD HEALTH ORGANIZATION
1969

IRON METABOLISM AND ANEMIA
Proceedings of a symposiumheld during the Eighth Meeting
of thePAHO Advisory Committee on Medical Research
9 June 1969
Scientific Publication No. 184
PAN AMERICAN HEALTH ORGANIZATIONPan American Sanitary Bureau, Regional Ofice of the
WORLD HEALTH ORGANIZATION525 Twenty-third Street, N.W.
Washington, D.C. 20037, U.S.A.
1969


PAHO ADVISORY COMMITTEE ON MEDICAL RESEARCH
Dr. Hernán AlessandriEx-Decano, Facultad de MedicinaUniversidad de ChileSantiago, Chile
Dr. Otto G. BierDirector, PAHO/WHO Immunology Research
and Training CenterInstituto ButantanSao Paulo, Brazil
Dr. Roberto Caldeyro-BarciaJefe, Departamento de FisiopatologíaFacultad de MedicinaUniversidad de la RepúiblicaMontevideo, Uruguay
Dr. Philip P. CohenChairman, Department of Physiological ChemistryThe University of WisconsinMadison, Wisconsin, U.S.A.
Dr. René DubosMember and ProfessorThe Rockefeller UniversityNew York, New York, U.S.A.
Dr. Herman E. HilleboeDirector, Division of Public Health PracticeSchool of Public Health and Administrative
MedicineColumbia UniversityNew York, New York, U.S.A.
Dr. Bernardo A. HoussayDirector, Instituto de Biología y Medicina
ExperimentalBuenos Aires, Argentina
Dr. Robert Q. MarstonDirector, National Institutes of HealthBethesda, Maryland, U.S.A.
Dr. Walsh McDermottChairman, Department of Public HealthCornell University Medical CollegeNew York, New York, U.S.A.
Dr. James V. NeelChairman, Department of Human GeneticsUniversity of Michigan Medical SchoolAnn Arbor, Michigan, U.S.A.
Professor Roger RevelleHarvard UniversityCenter for Population StudiesCambridge, Massachusetts, U.S.A.
Dr. Marcel RocheDirector, Instituto Venezolano de Investigaciones
CientíficasCaracas, Venezuela
Dr. John C. WaterlowDirector, Tropical Metabolism Research UnitUniversity of the West IndiesKingston, Jamaica
Professor Abel WolmanEmeritus Professor of Sanitary Engineering and
Water ResourcesThe Johns Hopkins UniversityBaltimore, Maryland, U.S.A.
Dr. Salvador ZubiránDirector, Instituto Nacional de la NutriciónMéxico, D.F., Mexico
Dr. M. Martins da Silva, SecretaryChief, Department of Research Development
and CoordinationPan American Health OrganizationWashington, D.C., U.S.A.
PAN AMERICAN HEALTH ORGANIZATIONPan American Sanitary Bureau
Dr. Abraham Horwitz, Director
iii

Symposium on
IRON METABOLISM AND ANEMIA
Moderator: Dr. Marcel Roche
PARTICIPANTS
Dr. Joginder ChopraDepartment of Health ServicesPan American Health OrganizationWashington, D.C., U.S.A.
Col. Marcel E. ConradDepartment of HematologyWalter Reed Army Institute of ResearchWashington, D.C., U.S.A.
Dr. James CookDepartment of MedicineUniversity of Washington School of MedicineSeattle, Washington, U.S.A.
Dr. William H. CrosbyDepartment of MedicineNew England Medical Center HospitalsBoston, Massachusetts, U.S.A.
Dr. Clement A. FinchDivision of HematologyUniversity of Washington School of MedicineSeattle, Washington, U.S.A.
Dr. Yaro Ribeiro GandraDepartamento de NutricoFaculdade de Higiene e Saúde PúblicaSao Paulo, Brazil
Dr. Pauline M. HarrisonDepartment of BiochemistryThe University of SheffieldSheffield, England
Dr. John J. KevanyDepartment of Health ServicesPan American Health OrganizationWashington, D.C., U.S.A.
Dr. Miguel LayrisseSección de FisiopatologíaInstituto Venezolano de Investigaciones
CientíficasCaracas, Venezuela
Dr. Luis Sánchez-MedalInstituto Nacional de la NutriciónMéxico, D.F., Mexico
Dr. Carl V. MooreDepartment of Internal MedicineWashington University School of MedicineSt. Louis, Missouri, U.S.A.
Dr. Marcel RocheInstituto Venezolano de Investigaciones
CientíficasCaracas, Venezuela
Dr. M. Martins da Silva, SecretaryDepartment of Research Development
and CoordinationPan American Health OrganizationWashington, D.C., U.S.A.
iv

CONTENTS
PageOpening Statement M arcel Roche ..................................................... 1
The Biochemistry of Iron Pauline M. Harrison ........................................ 2
The Control of Iron Balance by theIntestinal Mucosa William H. Crosby ........................................... 21
The Role of Protein in IronAbsorption Marcel E. Conrad .................................................. 27
Intersubject and Intrasubject Variationof Iron Absorption James D. Cook ............................................. 35
Iron Absorption from Food Miguel Layrisse ........................................... 38
Iron Losses Clement A. Finch ....................................................... 43
General Discussion ............................................................... 46
Human Iron Requirements Carl V. Moore ............................................ 50
Iron-Deficiency Anemia in Latin Americanand Caribbean Populations Yaro R. Gandra ..................................... 56
Iron Deficiency in Pregnancyand Infancy Luis Sánchez-Medal ................................................ 65
The Relationship Between Hookworm Infectionand Anemia Marcel Roche ..................................................... 72
Prevention of Iron-DeficiencyAnemia loginder Chopra ...................................................... 78
General Discussion ............................................................... 81
v

OPENING STATEMENT
Marcel Roche, Moderator
It would be safe to say, without any statistics at hand, that 1,000 millionpeople in the world are iron deficient, and many of them actually haveanemia. The problem is most acute in tropical areas, and anemias,particularly iron-deficiency anemias, are rampant in all the tropicaland subtropical zones of the Americas.
The attempt in this symposium is to present, in a short time, a generalview of iron metabolism, extending from the basic concepts of chemistryand biochemistry to the epidemiological and therapeutic aspects of theproblem.
Specifically, we shall start by taking a look at basic aspects of hemo-globin transferrin-ferritin metabolism on the whole. Next, there will befour papers dealing with the question of absorption of iron-possibly thesingle most important influence on the production of iron-deficiencyanemia. The subject will be approached from the point of view ofmechanisms at the intestinal level; the effect of protein depletion-obviously very important to us, since many of the populations we areinterested in are protein-depleted; intersubject and intrasubject variations;and findings to date on iron absorption from specific staples. After this,the old question of iron requirements will be dealt with.
Turning to epidemiology, the particular aspects of iron deficiency andanemia that bear on the Western Hemisphere will be considered. Also,these matters will be looked at as they affect pregnancy and infancy. Therelationship between anemia and hookworm disease will then be touchedon briefly. The concluding presentation will round out the matter bydealing with the treatment and prophylaxis of iron deficiency.
1

THE BIOCHEMISTRY OF IRON.
Pauline M. Harrison
Structure and function in biologicaliron compounds
The biochemistry of iron may be dividedbroadly into three interrelated aspects: the struc-ture and function of biological iron compounds,their synthesis and turnover, and the metabolicand functional relationships among the variousiron compounds. The present symposium islargely devoted to human iron metabolism: thebody's requirements for iron, its absorption fromfood, the turnover of iron compounds and themaintenance of an iron balance, and the effectsof iron deficiency. This paper will concentrateon the structural and functional aspects of ironcompounds, principally hemrnoglobin and myo-globin, ferritin and hemosiderin, and transferrin.Their syntheses and metabolic interrelationshipswill be touched on briefly.
Free ionic iron does not occur to any signifi-cant extent in living organisms because of itstendency to form complexes with many organiccompounds. Since quite low concentrations ofionic iron are toxic, this has the biological ad-vantage of enabling iron to be stored, trans-ported, or utilized in nontoxic forms. The bio-chemistry of iron is therefore the biochemistryof the complexes of which it forms a part. Thepresence of iron atoms may confer on thesecomplexes certain properties, such as the capacityto combine reversibly with oxygen or the abilityto accept and donate electrons. These propertiesacquired through the presence of iron atoms mayin turn be profoundly modified by the environ-ment provided for the iron by the complex-
reversible combination with oxygen being a casein point. The effect of the complex may be toallow the iron to function in a specific andcontrolled manner.
A neutral iron atom contains 26 electrons, 18of which occur in the closed shells of the argoncore. When ionized, two (ferrous) or three(ferric) of the outer electrons are removed, leav-ing the inner electrons unchanged. The spins ofthe outer electrons may be aligned in a varietyof different ways, giving rise to differences inmagnetic properties. Thus ferric iron, Fe3+, hasfive outer electrons. In high-spin compounds,these have all their spins parallel to one another,giving a large magnetic moment. In low-spincompounds, four of the electrons are aligned intwo antiparallel pairs, leaving a single unpairedelectron and hence a small magnetic moment.Ferric iron with three unpaired electrons is lesscommon. Ferrous iron normally has either fouror no electrons unpaired.
The biological properties of iron complexesmay depend not only on the presence of a local-ized center of positive charge but also on thetendency of iron to form directional covalentbonds with organic ligands. These ligands areoften, but not always, arranged in the form ofan octahedron around the iron atom. The natureand arrangement of the ligands affect the distri-bution of the outer electrons in the iron atomand, in particular, the way their spins are paired,enabling the iron to play a variety of roles. Thecorrelation between electronic configuration andfunction has been discussed by Eichhorn (43).The atoms that are commonly linked to iron are
2

N (e.g. histidine or pyrrole), O (e.g. 02 or
tyrosine) and S (e.g. thiol). The nature of the
chemical groups not in the immediate coordina-
tion sphere of the iron atom, but surrounding
it, may also be of functional importance. This
is shown dramatically by the difference in be-
havior of the heme iron in hemoglobin as com-
pared with that in free heme. The protein in
myoglobin and hemoglobin provides the heme
group with a nonpolar environment, whichallows the ferrous iron at its center to combine
with molecular oxygen without itself becoming
oxidized, a property not shared by free heme
groups (87, 128) or by free Fe2+ .
The iron atoms may also affect the properties
of the compounds to which they are attached.
Thus iron-transferrin (47) and ferritin (104)
are more stable to heat and other denaturing
agents and more resistant to attack by proteolyticenzymes than are their apoproteins. This may
help to prevent a build-up in the cell of the
protein moiety in amounts greatly in excess of
the available iron. The increased stability con-
ferred by iron-binding may result from confor-mational changes in the protein. This is prob-
ably true for transferrin (47, 94) and for the
bacterial nonheme iron protein, rubredoxin, in
which an iron atom, coordinated to four thiol
groups, forms a bridge between remote parts of
the primary structure in a manner analagous to
that of a disulphide bond (11). The addition
of heme to globin alters the conformation of thelatter, increasing its helix content by 10 to 20
per cent (26, 76). The binding of a gaseous
ligand to hemoglobin iron causes a physiologi-
cally significant change in quaternary structure
(116), as discussed below. Conformational
changes in the protein of transferrin induced by
iron-binding and by binding of the protein to
cell membranes may play a role in the control
of iron metabolism (53). On the other hand,
the addition of 4,000 or more iron atoms to the
molecule has little effect on the structure of
apoferritin (51, 68).
Biological iron compounds form a very diverse
group, both structurally and functionally. It is
convenient to classify them into those that con-
(proto)heme IX
(a)
z
,N-- -- - N
ZC
y '
2
1- - - --
11
(c)
FIG. 1. (a) The structure of the heme group (ferro-protoporphyrin IX) as found in hemoglobin, myoglobin,catalase, and peroxidase. In cytochrome c a similar groupis attached to the protein by addition of two cysteinethiol groups to the two vinyl groups of the protopor-phyrin. The four protoporphyrin nitrogen atoms form asquare planar arrangement to which the iron is coordi-nated. The iron atom may also be attached to othergroups on either side of this plane. In deoxymyoglobinand deoxyhemoglobin the ferrous iron atom is coordi-nated only to five ligands in a square pyramidal arrange-ment, as shown in (b), with histidine nitrogen occupy-ing position Z. The iron atom is displaced at least 0.3Afrom the protoporphyrin plane in the direction of thehistidine nitrogen. In oxymyoglobin and oxyhemoglobinthe oxygen molecule occupies a position on the side ofthe plane opposite to Z (like Z' in (c)). In cytochromec the iron atom is attached to six ligands arranged at thecorners of an octahedron and is probably centered in theplane of the nitrogens as shown in (c) (31).
tain heme (27, 30, 31, 45, 90, 101, 119) and
those that do not (29, 47, 89, 100, 118, 147).
Free heme (Figure 1) does not occur in quantityin animal tissues; it becomes incorporated intoproteins or is broken down.
Heme proteins include the very widely dis-
tributed proteins of the cytochrome system (90,
101), which occur in virtually all organisms
except anaerobic bacteria, and function as an
electron transport chain associated with oxidative
phosphorylation in mitochondria. Of the cyto-
chromes, c, a protein of molecular weight 12,400
containing a single heme, is the best character-
ized. Unlike that of hemoglobin, its proto-
3
porphyrin ring system is covalently linked to theprotein (by thioether links with two cysteineresidues). The fifth and sixth sites of the octa-hedrally coordinated heme iron are occupied byhistidine, and probably methionine, and theheme group is situated in a deep crevice normalto the surface of the molecule (38). Cytochrome caccepts electrons from cytochrome b and trans-fers them to cytochrome oxidase, with which itforms an active complex, the iron atoms beingalternately oxidized and reduced. Other hemeproteins include myoglobin and hemoglobin, dis-cussed below, and the catalases and peroxidasesthat catalyze the breakdown of peroxides in thepresence of a reducing agent (85, 89, 119, 125).It has been suggested that an intermediate in theperoxidase reaction may be one in which thefifth and sixth iron coordination sites are empty(127).
Nonheme iron compounds vary in size fromthe small ferric hydroxamic acid chelates foundin aerobic bacterial cells, which appear to beinvolved in heme synthesis (130) and also pos-sibly as iron carriers (118), to the large iron-storage complexes ferritin and hemosiderin. Andthey vary in function from electron transfer inthe ferredoxins (29) (found in plants and micro-organisms but not in animals) and in a numberof iron-flavoproteins (89, 147) to oxygen carriers,as in the hemerythrins of sipunculids, and ironcarriers, as in transferrins. The nature of theiron ligands is often difficult to determine in theabsence of an easily recognizable group suchas heme, and they may be sulphur (in ferredoxinand rubredoxin), oxygen (in ferrioxamine), ornitrogen (both nitrogen and oxygen in trans-ferrin).
The present symposium is largely concernedwith the metabolism of iron compounds inhumans. Quantitatively, the most importantiron compound in man is hemoglobin (111),which accounts for some 70 per cent of the totaliron (about 4 g in a man weighing 70 kg), ascompared to the related muscle protein, myo-globin, which constitutes about 3 per cent. Nextto hemoglobin comes storage iron, located inferritin and hemosiderin and accounting for
about 26 per cent (111). Transferrin, at about0.1 per cent, is quantitatively less important, butit plays a vital role in iron transport betweensites of iron absorption and storage and hemo-globin synthesis, and probably in the control ofiron absorption. The remainder of this paperwill be confined to a discussion of these com-pounds. For other iron compounds the readeris referred to recent reviews (27, 29, 30, 31, 45,47, 89, 90, 100, 101, 111, 118, 119, 147).
Oxygen carriers:Hemoglobin and myoglobin
Hemoglobin occurs in the red cells of all verte-brates. In higher vertebrates it is typically atetramer of four polypeptide chains and fourheme groups. The molecule is a compact ellip-soid measuring 64 x 55 x 50 A (129) and havinga molecular weight of about 65,000. Hemoglo-bin also occurs in many invertebrates, althoughits polymeric form may vary, e.g. a monomerwith a single heme is found in the marine anne-lid worm Glycera dibranchíata (122) and inlarvae of the insect Chironomus thumni (78),while polymeric forms with molecular weightsof 3,000,000-the erythrocruorins-occur in theworms Lumbricus terrestis and Arenicola marina(97). A leghemoglobin has been reported inthe root nodules of leguminous plants (138).
The importance of a supply of oxygen forthe survival of man and other animals needhardly be emphasized. Since the body has alimited capacity for storing oxygen, a steadysupply and an efficient means of circulating itto the tissues are vital. Hemoglobin fulfills thelatter role efficiently both by increasing the ca-pacity of the blood for oxygen by a factor ofsome seventyfold, and by binding oxygenstrongly at the partial pressure of alveolar oxygenand unloading it readily at the reduced PO2 ofthe tissues (144).
The relative ease with which tetrameric hemo-globin yields its oxygen at lower oxygen tensionsas compared with monomeric myoglobin andmonomeric forms of hemoglobin is illustrated bythe oxygen dissociation curves in Figure 2. Thesecurves suggest that the combination of oxygen
4

1ool
60~
40 A NORMAL UMAN UOOec 20 MYOGLOSIN
t 20 ,I / .0 20 40 60 a0 100 120
OXYGEN PRESSURE mm Hg
FIG. 2. A: Oxyhemoglobin dissociation curve of humanblood at 38°C, pH 7.40. B: Oxygen dissociation curveof myoglobin under similar conditions. Reproduced bypermission of F. J. W. Roughton (144, p. 775).
with the iron atoms in the two proteins is notsimply a function of the presence of iron in aparticular local environment. The iron atoms inthe two proteins are combined in the same pro-toporphyrin ring system, and the hemes havevery similar surroundings (87, 128). The sig-moid dissociation curve for hemoglobin asagainst the hyperbolic curve for myoglobin isattributed to the presence of a "heme-heme in-teraction" in tetrameric hemoglobin and the lackof it in monomeric myoglobin. That is to say,in hemoglobin, combination with the four oxy-gen molecules does not occur independently.Another physiologically important property ofhemoglobin not shared by myoglobin is that anincreased partial pressure of carbon dioxide fa-cilitates the unloading of its oxygen-the oxy-gen dissociation curve is shifted to the right(Bohr effect).
The configuration of deoxymyoglobin basedon X-ray diffraction studies of Kendrew and hiscolleagues (88,120) is shown in Figure 3. Thecoordination of the iron atom is approximatelyoctahedral, but the sixth coordination site isunoccupied by any ligand. The ferrous ironatom is situated about 0.4 A from the center ofthe protoporphyrin ring, which supplies fourpyrrole nitrogen ligands. A fifth nitrogen ligandis supplied by a histidine side chain (F8) of theprotein, while another histidine (E7) is situatedclose to the empty sixth coordination site. In
FiGo. 3. a-carbon skeleton diagram of myoglobin mole-cule showing helical and nonhelical regions and thelocation of the heme group. Reproduced by permissionof R. E. Dickerson, from H. Neurath (ed.), The Proteins,2d ed., vol. 2, New York, Academic Press, 1964, p. 634.
oxymyoglobin, an oxygen molecule occupies thissixth site without altering the valence of the ironatom, although it changes from high-spin tozero-spin state. In vitro, the iron atom is readilyoxidized, giving ferrimyoglobin, in which thesixth site is occupied by a water molecule orother ligands, while the position of the ironatom remains as in ferromyoglobin. The ar-rangement of ligands around the heme ironatom in deoxymyoglobin is identical with thatin a-chlorohemin (92). Figure 3 shows theheme group in a crevice in the protein. Ananalysis of the protein side chains in proximityto the heme in myoglobin and hemoglobinshows that the protein provides it with a non-polar surrounding (87,128).
Hemoglobin consists of two pairs of chainswith different primary structures (25) and cantherefore be designated as a tetramer a2,/6. Eachchain, with its attached heme, has a tertiarystructure very similar to that of myoglobin. Thechains are situated roughly at the corners of atetrahedron. Models of oxyhemoglobin and de-oxyhemoglobin molecules are shown in Figure 4.These structures show three important features:the chain conformations are unaffected by com-
5
Reduced
12 Pi
oxy__
Oa)
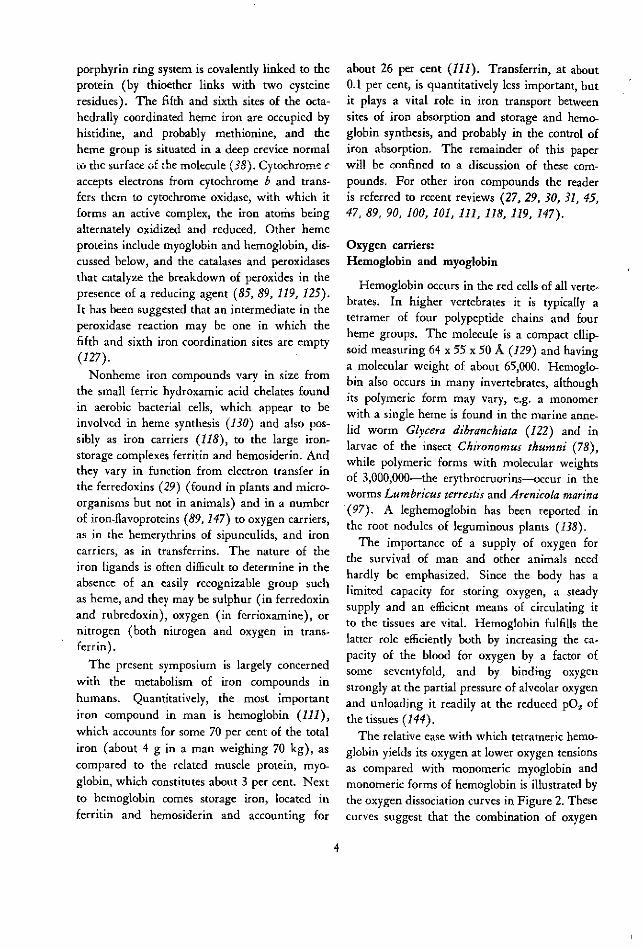
FIG. 4. Models of (a) deoxy and (b) oxyhemoglobin at
5.5A resolution. The heme groups are represented by
grey discs. The a chains are white and the f, chains
black. The a. chain lies at the back of the molecule
behind the a, chain. The contact areas between chains
are marked as boxes. On combination with oxygen the
chains shift relatively by a few A units along the alfiS2
and a2gfl contacts, while contacts aifi, and a2f,82 alter
very little. The P chains move closer together on oxy-
genation. Photographs kindly supplied by M. F. Perutz.
bination with oxygen (at least at the resolution,
5.5A, of the models); the relative orientations
of the four chains change on combination with
oxygen; and the heme groups are not close
enough for direct interaction, their iron atoms
being 25A or more apart (21, 115, 116).
Much experimental and theoretical work has
been carried out in attempts to explain the sig-
moid shape of the hemoglobin oxygen dissocia-
tion curve (7, 8, 142, 171). Kinetic measurements
have shown that, while the rates of combi-
nation of hemoglobin with the first three oxy-
gens are approximately the same, combination
with the fourth oxygen is much more rapid
(145). This suggests that the structural change
associated with the deoxy-oxy transformation
may have occurred before the fourth ligand com-bines. Most of this change occurs along thecontact between the a, and fi2 chains shown inFigure 4, some of the atoms at the contact beingdisplaced relatively by as much as 6A, althoughdistances between the heme iron atoms in thesechains are very little affected. The iron atomsin the two f8-chains, however, move about 6Acloser together on oxygenation (115). How thestructural change is triggered off and relayedacross the protein is not yet apparent, althoughthis may become clearer when the conforma-tions of both deoxy and oxyhemoglobin havebeen determined at atomic resolution. Thetransformation in quaternary structure seemsto be a consequence of the change from 5- to6-coordination of the iron atom rather than ofthe change in its spin state.
Structure-function relationships in hemoglo-bin are complicated by the fact that in solutiona dynamic tetramer-dimer-monomer equilibriumexists (8, 9, 142). Symmetrical splitting intoa/3 dimers probably occurs along the afi2 con-tact and also along the a2fl (141), while thea1,f1 and a2,
82 contacts remain unchanged (Fig-
ure 4). It has been suggested that conforma-tional changes in the af3 dimer are of prime im-portance in hemoglobin oxygenation and thatthe oxy-dimers induce a transformation to amore reactive conformation in any deoxy-dimerswith which they combine (10, 13, 64, 117). Re-cent kinetic evidence, however, suggests that thetetramer and not the dimer is the prime unit offunction, since combination with at least threeligands is necessary to produce a transformationto the rapidly reacting form (56). The X-raycrystallographic studies also support the tetra-meric molecule as the functional unit in coop-eration binding effects (128). In any event, thefunctional importance of the protein as well asthe iron is evident. This is also shown by thefact that modifications in the protein may reduceor destroy both heme-heme interaction and theBohr effect. Interestingly, these effects are absenton the reaction of ferrihemoglobin with ligands(8), and ferrihemoglobin has a conformationsimilar to that of oxyhemoglobin.
6

The effect of iron salts as stimulators of bothheme and globin synthesis de novo from aminoacids by reticulocytes in vitro is well known(95), while the rate of globin synthesis is de-creased in the absence of heme or heme pre-cursors such as iron (131). The observationthat heme and globin are synthesized at approxi-mately the same rates argues for a mechanismcoordinating their syntheses (95, 131). Thismay be achieved by an inhibitory effect of heminon its own synthesis coupled with a stimulatoryeffect of heme on the formation of globin (28).Oxygen concentration also plays a regulatory rolein hemoglobin synthesis. Globin synthesis wasfound to be stimulated by low oxygen tensionsand inhibited at the higher levels (67). Inhibi-tion is relieved by the addition of heme, andthe effect is believed to occur at the level ofheme synthesis.
The regulatory effect of heme (and of iron asa heme precursor) on hemoglobin synthesis ap-pears to be twofold. It is found to stabilizereticulocyte polyribosomes (131, 162, 163), andit also appears to promote the assembly of newlysynthesized a and , globin chains (156).
Iron stores:Ferritin and hemosiderin
Storage iron, amounting to about 700 to 1,000mg in a normal man (111), represents a mobilereserve that can be drawn upon in iron de-ficiency or after hemorrhage, thus allowing sup-plies of "functional" iron compounds, such ashemoglobin, to be maintained or rapidly re-placed (22). Iron deficiency in a clinical senseoccurs only when iron stores are depleted. Iniron overload, storage iron is increased, whilehemoglobin iron usually remains normal. Ironreleased from hemoglobin in the normal break-down of red cells is also stored temporarily inreticuloendothelial cells from which it can sub-sequently be released and reutilized for hemo-globin synthesis (121). Iron is stored in twoforms, ferritin and hemosiderin, and can bemobilized from both (22, 150). The formationof ferritin, which occurs in response to the pres-ence of iron (48, 58), may play a part in the
mechanism regulating iron absorption in mu-cosal cells (33, 37).
In ferritin, the iron is associated with a well-defined protein moiety, apoferritin, forming asoluble red-brown complex (57, 61). The termhemosiderin was first applied to microscopicallyvisible, Prussian-blue-staining, insoluble gran-ules isolated from the liver and the spleen (35,59, 106). It has also been used to denote massiveiron-rich deposits seen in the electron micro-scope (16,132). The need for a soluble and alsonontoxic form of iron store seems to be gener-ally widespread among living organisms. Ferri-tin has been found not only in many vertebrates(109) and invertebrates (140, 160) but also inthe plant kingdom (79, 139, 148), includingfungi (126). It would therefore seem to be ofancient evolutionary origin. Hemosiderin or he-mosiderin-like deposits have been found in bothvertebrates and invertebrates (35, 159). Undernormal conditions in man and in experimentalanimals, most storage iron is in the form of ferri-tin, but in iron overload the amount of hemo-siderin may greatly outstrip that of ferritin (108,149,154).
Ferritin isolated from tissues (principallyliver, spleen, and bone marrow) may contain avariable amount of iron, although this is usuallyaround 20 per cent of its dry weight (57), orabout 3,000 iron atoms per molecule. Eachpreparation contains a spectrum of molecules ofdifferent iron content (143), ranging from iron-free molecules to those containing up to 4,000 or5,000 iron atoms (50, 70). The distribution ofiron content among the molecules varies fromone individual to another and depends on thestate of iron-loading. In anemic animals, how-ever, iron-free apoferritin is not present in quan-tity (59, 60). It is apparently degraded whennot required to store iron, whereas iron stimu-lates its synthesis. Ferritin preparations consistmainly of monomeric molecules, but some poly-mers are also present-about 10 to 15 per centby weight of the preparation (39, 155, 166). Onion-exchange chromatography (155, 157), hetero-geneity has been observed in ferritin, but notin apoferritin (155). No differences could be
7

The iron of ferritin occurs in a "micelle" witha maximal diameter of about 70. (46, 50, 69,91), or less in molecules of low iron content(50, 66). Its composition corresponds roughly tothe formula (FeOOH)8 (FeO:OPO lH2) (70,110), but the phosphate present does not seem tobe an integral part ofu the "icelle and may belargely confined to its surface (51, 72). Ferri-tin and its protein-free micelles give X-ray (51,72, 158) and electron diffraction patterns (65)typical of crystalline material of small particlesize. The micelles, which can be seen withoutstaining in the electron microscope, sometimeshave the appearance of being subdivided into afew smaller crystallites (46), although this couldpossibly be an artifact. The appearance of fourcrystallites or "tetrads" in a micelle of averageover-all diameter of about 60Á is taken by manyelectron microscopists to be diagnostic of ferri-tin. Ferritin can also be recognized-and dis-tinguished from hemosiderin-by its tendencyto form close-packed monolayers on electronmicroscope grids and by the fact that its micellesare surrounded by protein shells, which are notelectron dense, and which prevent the micellesfrom coming into contact (Figures 5 and 6).
FIG. 5. Electron micrographs of ferritin (a) and hemo-siderin (b) prepared from the same horse spleen by themethods of Granick (57) and McKay and Fineberg(106), respectively. The samples were unstained andunshadowed. The iron-containing micelles can be seenas electron-dense (grey) areas. Magnification X 250,000(F. A. Fischbach, D. W. Gregory, P. M. Harrison andT. G. Hoy).
detected in the amino acid compositions of thechromatographic fractions (155). The hetero-geneity may therefore be due to differences insurface conformation, or in bound ferric or otherions. Variations in the electrophoretic mobili-ties of ferritins isolated from different tissueswithin the same animal have also been found(5,54,55).
Flo. 6. Electron micrograph of ferritin negatively stainedwith sodium phosphotungstate kindly supplied by G. H.Haggis (unpublished). The ferritin iron-cores are sur-rounded by protein shells, which appear light against a
background of negative stain. Magnification X 250,000-
8

Several different structures have been proposedto fit the "tetrad" appearance (46, 114). How-ever, these fit only a small proportion of theviews seen in the electron microscope, while inelectronmicrographs taken close to true focusmany of the micelles look rather uniform in ap-pearance (65). In ferritin solutions (50) andin wet crystals (69), the micelles closely ap-proximate spheres or polyhedra and are of uni-form density.
The ferritin micelle diffraction patterns differfrom those of the well-known ferric oxide oroxyhydroxide minerals (65, 72). Three alterna-tive atomic structures have been proposed forthe ferritin iron cores (72) or for closely relatedsynthetic "hydrous ferric oxides," which givesimilar diffraction patterns (24, 158). Thesevary in the coordination of the oxygen atoms(O=, OH- or H20) around the ferric iron-theymay be all octahedral (158), all tetrahedral (24),or mixed octahedral and tetrahedral (72). Ow-ing to the poor quality of the diffraction patterns,it is not easy to decide between these alterna-tives. From measurements of the magnetic sus-ceptibility of ferritin iron, values of about 3.8Bohr magnetons were obtained for the magneticmoment. This value is close to that expectedfor ferric iron with three unpaired electrons(instead of the more usual five or one unpairedelectron) and a square planar arrangement forthe iron oxygen ligands (59, 110). Recently,however, a value of 5.08 ^gt has been reported(20), with evidence for antiferromagnetic order-ing in the crystallites at low temperatures. Thisvalue is closer to that normally observed forhigh-spin ferric compounds with five unpaired
electrons (5.9 ,t).
The protein shell that surrounds the iron-con-
taining core of ferritin is roughly spherical, withan average outer diameter of about 122AÁ (maxi-mum 130A) and an inner diameter of about73A under conditions in which the protein ishydrated (19, 50, 69). In the electron micro-scope these dimensions may be reduced by about15 per cent (166) (Figure 6). Sedimentationstudies and X-ray measurements of the molecu-lar weight of apoferritin give values in the range
460,000 to 480,000 (69, 143), using the measuredpartial specific volume, 0.747 (143), or 440,000 to
460,000, using V calculated from the amino acidcomposition (166). The molecular weight basedon the tryptophan content (75, 153) is 420,000 to460,000, and on light scattering 430,000 (137).Ferritin containing its full complement of ironhas a molecular weight of about 900,000 (50,70). The protein shell is divided into abouttwenty subunits (74, 77), probably arranged atthe apexes of a pentagonal dodecahedron (69)(Figure 7). This arrangement allows for thepresence of channels connecting the inside andoutside of the molecule. These channels areabout 10A to 15A wide (134, and T. G. Hoyand P. M. Harrison, unpublished observations),thus allowing for the passage of hydrated ironatoms in and out of the molecule. Properties thatdepend on the size and/or external surface ofthe molecule-viscosity (104), electrophoreticmobility (105), crystal packing (68), gel filtra-tion (6), antigenicity (105)-show that the pro-tein is essentially unchanged on binding iron in
FIG. 7. Model of an apoferritin molecule, reproduced bypermission of G. H. Haggis (66). It shows the arrange-ment of twenty protein subunits at the apexes of apentagonal dodecahedron (69) with a pentagon face atthe front of the model. At the center of each face thereis a channel that connects the outside of the moleculewith the central cavity in the protein and allows thepassage of iron in and out of the molecule. The centralcavity, which occupies about 22% of the total volume,is not visible in the model, but it can be seen in Fig. 6.
9

its interior, and this is borne out by a compari-son of X-ray diffraction patterns of ferritin andapoferritin (51, 68, 71). Nevertheless, the pres-ence of the iron-containing core renders the pro-tein less susceptible to denaturation (104) andto attack by proteolytic enzymes (104). Theatomic structure of the iron core is not spe-cifically orientated with respect to the protein(51). It appears that the cores can grow indifferent directions inside the protein shell, theirexternal shape complementing that of the pro-tein when the latter is essentially full (51, 65).
The biosynthesis of ferritin has received con-siderable attention since it was discovered thatde novo synthesis of ferritin protein from aminoacids was induced by administration of ironsalts (48, 49). Several workers have confirmedthis finding in whole animals (41, 99, 103), intissue slices (146, 172, 173), and in tissue cul-tures (136). Tracer experiments with `4C-labeledamino acids show that apoferritin, or possibly aferritin of very low iron content, is formed first,and that with time the radioactivity passes toiron-rich species, suggesting that the empty shellsare gradually being filled (41). Reconstituted"fcrritin" can also be produced in vitro fromintact apoferritin molecules, ferrous salts, andoxygen or other oxidizing agents (17, 72, 98).The product resembles ferritin in electron micro-scopic appearance and in its diffraction pattern,despite the absence of phosphate (72). This ob-servation, together with the results of the tracerexperiments, suggests that ferritin may beformed from apoferritin by a similar mechanismin vivo (40), rather than by aggregation of apo-ferritin subunits around a preformed iron-coretemplate (123). The protein shell may itselfassist in the removal of electrons from the Fe2+
ions entering the molecule. Some "isoferritins"may be more active in incorporating iron thanothers in vivo (54).
The mechanism of induction of ferritin byiron is not yet known, although it seems fairlycertain that it does not occur through control oftranscription, but .rather at some subsequentstage (41). Drysdale and Munro (39, 41, 42)conclude that messenger RNA for ferritin is
stable and that the iron either causes it to beused more efficiently or assists in the release ofapoferritin subunits from the ribosomes or theiraggregation to completed shells. Iron, however,is not essential for aggregation of apoferritinsubunits in vitro (39, 73). Since both ferritinand hemoglohin are induced by iron and bothare found in erythroid cells, it seems likely thattheir biosynthetic control mechanisms are inter-connected in these cells (44, 103, 161, 174).
Little is known about the mechanism of re-lease of iron from ferritin in vivo. It can be re-moved as Fe2+ from intact molecules by reduc-ing agents in vitro (18, 61), or, slowly, as Fe3+
by iron chelating agents (124, 169). An in vivorelease mechanism involving xanth;ne oxidasehas been proposed (62). Iron that has been morerecently deposited as ferritin following red-cellbreakdown is more easily mobilized than ironfrom older ferritin deposits (121). Possibly thisis because the more recently formed ferritin hasa lower iron content and the iron can be morereadily removed from only partially filled mole-cules, or it might be due to conformational dif-ferences in the protein. Iron can apparently bereleased both from intact molecules and fromthose in which the protein has been degraded(154).
Hemosiderin is both chemically and metaboli-cally related to ferritin. This term has beenused to describe both amorphous and crystallineintracellular deposits seen in the electron micro-scope (16, 133), but it seems certain that thelatter are ferritin. It has been suggested that theterm hemosiderin should be restricted to thosegranules that are water insoluble (151). Whilethis is a useful means of distinguishing hemo-siderin from ferritin at a preparative level, itobviously cannot apply to iron-rich deposits seenin electron micrographs of tissue sections. Herethe term should perhaps be restricted to depositsthat are amorphous and in which the iron mi-celles are not clearly surrounded by well-definedprotein shells. Such deposits are, however, ofvariable appearance, sometimes, but not always,membrane-bound (14, 15, 132). On the basis ofmorphological appearance alone, it may not al-
10

ways be possible to decide whether they containferritin or not.
Isolated hemosiderin granules have variablecomposition. Their iron, phosphorus, and sul-phur contents are higher than those found inferritin (35, 106, 107, 135, 150, 168), and theycontain a number of different organic constitu-ents, including protein and small amounts ofapoferritin (107, 135). The magnetic momentof the iron in hemosiderin is similar to that inferritin, but with a greater range of values (3.5to 4.7 , o (150, 154). X-ray diffraction patternsobtained from ferritin and hemosiderin extractedfrom the same normal horse spleen show thatthe atomic structures of the two mineral com-ponents are similar, although the average par-ticle size observed in hemosiderin is smaller(F. A. Fischbach, D. W. Gregory, P. M. Harri-son, and T. G. Hoy, unpublished observations).
The biological origin of hemosiderin is ofsome interest. There is evidence that in liverparenchymal cells it is a breakdown product offerritin (154), presumably resulting from di-gestion of the protein with intracellular prote-ases. The X-ray diffraction results mentionedabove would be consistent with this conclusion.Hemosiderin-like material can also be producedfrom ferritin by denaturation followed by trypsindigestion (102). Studies on human sideroticlivers show that above a certain level of iron-loading the ratio of hemosiderin to ferritin isnearly constant, thus suggesting a dynamic equi-librium between the two storage forms (108).In rabbits, the ferritin level reached a maximumlimiting value in response to massive doses ofiron, whereas the hemosiderin content appearedto be able to rise continuously (154). The im-plication in this case would be that the rate offerritin turnover was increased at high ironlevels, or that some of the hemosiderin was notformed from ferritin and possibly differed from"normal" hemosiderin. Thus, there may be twomechanisms for "hemosiderin" formation, oneoperating when the iron-level exceeds the cell'sability for ferritin synthesis and turnover. Sinceferritin-like colloidal "iron oxide hydrates" canbe produced in vitro in the absence of ferritin
protein (24, 158), two such mechanisms appearto be plausible.
Iron transport and delivery:Transferrin
A group of closely related iron-binding glyco-proteins occurs in vertebrate blood serum (trans-ferrin), in mammalian milk (lactotransferrin),and in avian egg white (ovotransferrin or conal-bumin) (47). These proteins are similar in sizeand iron-binding properties, although they differin amino acid composition and carbohydratecontent (47). The discussion that follows willbe principally concerned with serum transferrin.
Transferrin accounts for 2 to 3 per cent of thedry weight of vertebrate sera. This representsabout 100 times the amount of free iron inserum, but only 0.1 per cent of the total bodyiron (3 to 4 mg transferrin-bound iron inhumans). Human serum transferrin has a mo-lecular weight of about 86,000 [86,000-93,000based on physical measurements (12, 47), 86,000from iron-binding (82)]. It contains several di-sulphide bridges but no free thiol groups (47).Its attached carbohydrate, the function of whichis uncertain, consists of four moles of sialic acid,eight moles of N-acetylglucosamine, four molesof galactose, and eight moles of mannose forevery 90,000 molecular weight, joined to theprotein as two branched glycopeptide chains(80). This suggests the presence in the proteinof two peptide chains. Only one N-terminal resi-due (valine) has been found until recently (12),but Jeppsson and Sjoquist have observed N-terminal serine in addition to valine (84), andthey have also reported the splitting of trans-ferrin into two subunits in 8M urea (83). Greeneand Feeney were unable to obtain evidence fordissociation under similar conditions and thinkthat probably all transferrins are monomers(63.)
Metal-free transferrin is colorless, but whenferric iron is bound in the presence of bicarbon-ate a salmon-pink complex is formed. It alsocomplexes less firmly with other metals, such ascopper. Two metal ions are bound per moleculeof transferrin. At physiological pH, transferrin
11

has a very high affinity for iron, the equilibriumbinding constants being of the order of 10° forboth iron atoms (2). Electron spin resonancestudies have shown that the iron is bound asFe' +, and that the two binding sites are approxi-mately equivalent and at least 9A apart (2, 4,167)TT. Ane ph-ysiologialoions, three pro-
tons are displaced and one mole of bicarbonateis bound per iron atom (4). The bicarbonatewas previously thought to be coordinated to theiron atoms (167), but recent evidence suggestsit is probably attached to groups on the protein(3) and not directly to the iron. The metalligands are probably three tyrosine oxygens andtwo nitrogens fromn the imidazole or guanidylgroups of histidine or arginine, respectively (2,93, 167). Transferrin will bind iron or copperslowly in the absence of bicarbonate. Electronspin resonance studies suggest that more pro-tein ligands are available for binding (three orfour N and three O ligands) when bicarbonateis absent (1). Evidence of heterogeneity in thetwo binding sites in the pH range of 4 to 6 hasbeen obtained in the absence of bicarbonate (1),although at pH 7 to 11 the sites were indistin-guishable. Kinetic evidence indicates that thebinding of the two atoms is cooperative, chela-tion of the first ion facilitating that of the sec-ond, presumably as a result of a conformationalchange in the protein (170). The two bindingsites also appear to be functionally different. Re-lease of bound iron to immature red cells oc-curred more readily from one site than fromthe other (52). Exchange of iron atoms betweenthe two sites occurs only very slowly or not atall (4, 52, 113). As already noted, iron-bindingstabilizes the protein (47) without substantiallyaltering its shape. However, in the course ofbinding, alterations occur in the antigenic struc-ture (94), indicating that some conformationalchange has taken place. Possibly the metalstabilizes the protein by forming crosslinks be-tween separated regions of the primary struc-ture.
The physiological function of transferrin is totransport iron. Most of the body's iron is con-served and reused after the erythrocytes and
other iron-containing cells have been destroyed.Little iron is excreted and only a small propor-tion of dietary iron is absorbed. Transferrinacquires iron, derived from hemoglobin break-down or entering the body through the in-testinal mucosa, and delivers it to the erythro-n i ti, INnn MrIMrnx fnr ;nnr~npoietic bone marro for incorporation into newhemoglobin molecules, to other tissues requiringphysiologically "active" iron, and to the storagedepots. Transferrin also transfers iron from theplacenta to the fetus. This protein has beenregarded as having an essentially passive role,i.e. it simply provides a convenient means ofcarrying iron in a nontoxic form. Recent work,however, suggests that it may play an activepart in the mechanisms regulating both absorp-tion and delivery of iron (53, 86). These con-trol mechanisms appear to depend on structuralchanges in the protein, which result both fromits chelation with iron and from its attachmentto specific receptor sites on cell surfaces.
Every day plasma transferrin delivers from30 to 40 mg of iron to the erythropoietic bonemarrow-the tissue with by far the highest ironrequirement. The protein is not consumed whenits iron is released. It becomes available for fur-ther iron transport and is able to deliver aboutsix to ten times its weight of iron in a day. Un-like free iron, which is taken up indiscriminately,transferrin iron is passed selectively to immaturered cells, which are still actively synthesizinghemoglobin, rather than to mature cells in whichhemoglobin synthesis has ceased (81, 82, 86).This suggests there are receptor sites on the sur-faces of immature cells that become lost as thecell ages. These sites must be specific for trans-ferrin protein and not for its iron. The rela-tive ease with which transferrin iron can betransferred to reticulocytes, as compared withits removal in vitro, suggests that a confor-mational change in the protein occurs on bind-ing. The uptake of iron by reticulocytes seemsto occur as a three-stage process (82, 112,113): (1) physical absorption of transferrin toreceptor sites; (2) the formation of a tighterunion between the transferrin molecule and thereceptor site, probably involving an alteration in
12

the tertiary structure of the protein; and (3)transfer of iron to the cell.
Stage 1 is reversible, the molecules being com-paratively easily displaced competitively by othermolecules. At stage 2, iron-bound molecules
have a greater affinity for the receptors than doesapotransferrin (82), suggesting that iron-bindingfacilitates the conformational change required
for attachment to the receptor. Transferrinmolecules containing two bound iron atoms re-lease their iron more readily than do those with
only one (52). Probably only one of these atoms
is taken up at a time, iron from one site being
preferred over that from the other (52). Stages 2
and 3 are dependent on the active metabolism ofthe cell (81, 112). The iron does not becomefree during transfer and cannot be eluted by
apotransferrin or other chelators (81).
The conformational changes associated with
the binding of iron to transferrin and its de-
livery to reticulocyte receptors is summarizeddiagrammatically in Figure 8. As already indi-cated, these changes, and the ways in which thetransferrin-binding sites are occupied by iron,
may be factors controlling the rate at which ironis released into the serum from intestinal muco-sal cells, and hence iron absorption from the gut,
as well as the rate of delivery (53). Undernormal physiological conditions, transferrin is
only about one third saturated with iron (22).
At high levels of saturation (above 60 per cent),much of the iron is deposited in the liver. The
saturation may be normally kept at 30 to 60 percent, so that the marrow, which has a high
affinity for iron, can obtain an adequate supplywhile other tissues are not overloaded (22).
Neither the percentage saturation of transferrin
nor the level of iron in the stores appear to have
a controlling influence on iron absorption (34,
164).Absorption of iron is related to the rate of
erythropoiesis, even under conditions in which
iron-loading is abnormally high (23, 164) or
low (164), and to the rate of plasma iron turn-
over (165). Not all the iron in the mucosa finds
its way into the serum. At high iron levels some
of this iron is sequestered in the mucosa in the
(a)
(e) (f (g)FiG. 8. The apotransferrin molecule TF, (a), has twoiron-binding sites, A and B. On binding a single ironatom, *, at either site A or B, as in (b) and (c), themolecule undergoes conformational changes, which allowthe first iron atom to be firmly bound and which facili-tate the binding of a second atom (170). A moleculewith both sites occupied is shown in (d). The shape ofthe molecule is not much affected by iron-binding (47).Iron, once bound, cannot easily be removed from trans-ferrin molecules in solution, but the molecules can readilydeliver their iron to receptor sites on red cell precursors,depicted in (e), (f), and (g), as a result of conforma-tional changes on binding to the receptors (81). Mole-cules with two bound irons, (d), can transfer an ironatom (one at a time) more readily than those with asingle iron atom (52), as can be seen by comparing (f)with (e) or (g). Iron atoms from site A can be rathermore readily transferred, (e), than can those from siteB, (g), (53).
form of ferritin (32, 33, 37), which is synthe-sized in response to the presence of iron (152).Much of this iron is lost to the body when thecells are exfoliated. Mucosal cells can both re-
lease iron to the serum and acquire iron fromit, depending on the body's requirements. Con-rad, Weintraub, and Crosby (34) proposed that
absorption is controlled by the concentration of
iron in the intestinal mucosa and that this in
turn depends on the amount of "messenger" iron
from the plasma entering these cells. This
messenger iron would be free to enter the in-
testinal cells when not required elsewhere. When
13
VíY

erythropoiesis is stimulated, much of the mucosal
iron would pass to the plasma and absorption
would then be increased.
These ideas have been interpreted by Fletcher
and Huehns (53) in terms of the distribution ofiron on plasma transferrin. They point out that
transferrin consists of four molecular species, two
with a single iron atom at different sites (A and
B), one with no iron atoms, and one with two
iron atoms occupying both sites. The suggested
order of ability to deliver iron to the erythro-
blasts (52, 53) would be as follows:
/ AFeTF
BFe
/AFe
>TF
B0
/Ao>TF
BFe
They propose that "messenger" iron is repre-
sented by those molecules that have two bound
iron atoms. The amount of this species presentwould tend to be decreased during high marrow
activity and increased when the body's iron
stores are large. The quantity of iron enteringthe mucosa from the plasma would be deter-mined by the number of transferrin moleculescarrying two iron atoms, of which that at site B
might be the more easily incorporated. Iron re-leased from the mucosal cells to the plasma
would, however, have a preference for site A on
the transferrin molecule-that is, the same site
from which iron is preferentially delivered to the
red cell precursors.These ideas offer a simple explanation of the
link between absorption and the body's need
for iron. The degree to which transferrin mole-
cules are saturated with iron also depends on
the rate at which the protein is synthesized and
catabolized, both of which have been found to be
related to the erythropoietic rate (36, 96). Sup-
pression of transferrin synthesis seems to be
FIG. 9. Diagram of the central role of transferrin iniron metabolism. Plasma transferrin is represented bythree species, TF(o)2, TF(Fe,o), and TF(Fe)2, whichhave their two binding sites occupied by no, one, or twoiron atoms, respectively. Differences between the natureof the binding sites (see Fig. 8) have been ignored. Thearrows represent the directions of flow of iron atoms inand out of the various compartments. The sizes of thecompartments are in no way related to the amounts ofiron they contain.
associated with iron-loading, high hepatic ferri-
tin formation, and low erythropoiesis. In iron
deficiency, the concentration of transferrin inthe plasma is abnormally high (22, 96). Thus,
iron influences the synthesis of transferrin in a
way that is different from its effect on ferritin
formation and in a way that ensures that the
body's main requirement for iron will be met.
The central role of transferrin in the metabo-
lism of iron is illustrated schematically in Fig-
ure 9.
REFERENCES
1. AASA, R., and P. AISEN. Electron paramagneticresonance study of iron and copper complexes oftransferrin. 1 Biol Chem 243: 2399-2404, 1968.
2. AASA, R., B. G. MALMSTROM, P. SALTMAN, andT. VANNGARD. The specific binding of iron (III)
and copper (II) to transferrin and conalbumin.Biochim Biophys Acta 75: 203-222, 1963.
3. AISEN, P., R. AASA, B. G. MALMSTROM, andT. VANNGARD. Bicarbonate and the binding of ironto transferrin. I Biol Chem 242: 2484-2490, 1967.
14

4. AisEN, P., A. LIEBMAN, and H. A. REICH.Studies on the binding of iron to transferrin andconalbumin. 1 Biol Chem 241: 1666-1671, 1966.
5. ALFREY, C. P., E. C. LYNCH, and C. E. WHIT-
LEY. Characterization of ferritin isolated from hu-man marrow, spleen, liver, and reticulocytes. 1 LabClin Med 70: 419-428, 1967.
6. ANDREWS, P. The gel-filtration behaviour ofproteins related to their molecular weights over awide range. Biochem 1 96: 595-606, 1965.
7. ANTONINI, E. Interrelationship between struc-ture and function in hemoglobin and myoglobin.Physiol Rev 45: 123-170, 1965.
8. ANTONINI, E. Hemoglobin and its reactionwith ligands. Science 158: 1417-1425, 1967.
9. ANTONINI, E., M. BRUNORI, and S. ANDERSON.
Studies on the relations between molecular andfunctional properties of hemoglobin. VII. Kineticeffects of the reversible dissociation of hemoglobininto single chain molecules. 1 Biol Chem 243: 1816-1822, 1968.
10. ANTONINI, E., E. CHIANCONE, and M. BRUNORI.
Studies on the relations between molecular and func-tional properties of hemoglobin. VI. Observationson the kinetics of hemoglobin reactions in concen-trated salt solutions. 1 Biol Chem 242: 4360-4366,1967.
11. BACHMAYER, H., A. M. BENSON, K. T. YASU-NOBU, W. T. GARRARD, and H. R. WHITELEY. Non-heme iron proteins. IV. Structural studies of micro-coccus aerogenes rubredoxin. Biochemistry 7: 986-996, 1968.
12. BEARN, A. G., and W. C. PARKER. Transferrin.In Glycoproteins; Their Composition, Structure, andFunction, B.B.A. Library, vol. 5, Amsterdam, Else-vier, pp. 413-433, 1966.
13. BENESCH, R. E., R. BENESCH, and G. MACDUFF.
Subunit exchange and ligand binding; a new hy-pothesis for the mechanism of oxygenation of hemo-globin. Proc Nat Acad Sci USA 54: 535-542, 1965.
14. BEssIS, M., and J. BRETON-GORIUS. Accumula-tion de granules ferrugineux dans les mitochondriesdes érythroblastes. C R Acad Sci 244: 2846-2847,1957.
15. BEssIs, M., and J. BREToN-GoRIus. Trois as-pects du fer dans les coupes d'organes examinées aumicroscope electronique (ferritine et derivé, dansles cellules intestinales, les érythroblastes et les cellu-les réticulaires). C R Acad Sci 245: 1271-1272,1957.
16. BEssIS, M., and J. BRETON-GORIus. Differentsaspects du fer dans l'organisme. 1. Ferritine et mi-celles ferrugineuses. II. Differentes formes de l'hémo-sidérine. 1 Biophys Biochem Cytol 6: 231-240, 1959.
17. BIELIC, H-J., and E. BAYER. Synthetischesferritin, ein Eisen (III)-komplex des apoferritin.Naturwiss. 42: 125-126, 1955.
18. BIELIG, H-J., and E. BAYER. Eisenaustauschzwischen proteinen; Modellversuche zur eisenre-sorption und speicherung im Tierkorper. Naturwiss.42: 466-467, 1955.
19. BIELIG, H-J., O. KRATKY, G. ROHNS, and H.WAWRA. Small-angle scattering of apoferritin insolution. Biochim Biophys Acta 112: 110-118, 1966.
20. BLAISE, A., J. CHAPPERT, and J-L. GIRARDET.
Observation par mesures magnétiques et effet Moss-bauer d'un antiferromagnétism de grains fins dansla ferritine. C R Acad Sci 261: 2310-2313, 1965.
21. BOLTON, W., J. M. Cox, and M. F. PERUTZ.Structure and function of haemoglobin. IV. A three-dimensional fourier synthesis of horse deoxyhaemo-globin at 5.5A resolution. 1 Molec Biol 33: 283-297,1968.
22. BOTHWELL, T. H., and C. A. FINCH. IronMetabolism. Boston, Little, Brown and Co., 1962.
23. BOTHWELL, T. H., G. PIRzIo-BIRoLI, and C. A.FINCH. Iron absorption. I. Factors influencing ab-sorption. 1 Lab Clin Med 51: 24-36, 1958.
24. BRADY, G. W., C. R. KURKJIAN, E. F. X.LYDEN, M. B. ROBIN, P. SALTMAN, T. SpIRO, andA. TERZIS. The structure of an iron core analog offerritin. Biochemistry 7: 2185-2191, 1968.
25. BRAUNITZER, G., K. HILSE, V. RUDLOFF, andN. HILSCHMANN. The hemoglobins. Advances Pro-tein Chem 19: 1-71, 1964.
26. BRESLOW, E., S. BEYCHOK, K. D. HARDMAN,
and F. R. N. GURD. Relative conformation of spermwhale metmyoglobin and apomyoglobin in solution.
1 Biol Chem 240: 304-309, 1965.27. BRILL, A. S., and R. J. P. WILLIAMS. The
absorption spectra, magnetic moments, and thebinding of iron in haemoproteins. Biochem / 78:246-253, 1961.
28. BRUNS, G. P., and 1. M. LONDON. The effectof hemin on the synthesis of globin. Biochem Bio-phys Res Commun 18: 236-242, 1965.
29. BUCHANAN, B. B. The chemistry and functionof ferredoxin. Structure and Bonding 1: 109-148,1966.
30. CAUGHEY, W. S. Porphyrin proteins and en-zymes. Ann Rev Biochem 36: 611-644, 1967.
31. CHANCE, B., R. W. ESTABROOK, and T. YONE-
TANI (eds.), Hemes and Hemoproteins. New York,Academic Press, 1966.
32. CHARLTON, R. W., P. JACOBS, J. D. TORRANCE,and T. H. BOTHWELL. The role of intestinal mucosain iron absorption. 1 Clin Invest 44: 543-554, 1965.
33. CONRAD, M. E., and W. H. CROSBY. Intestinalmechanisms controlling iron absorption. Blood 22:406-415, 1963.
34. CONRAD, M. E., L. R. WEINTRAUB, and W. H.CROSBY. The role of the intestine in iron kinetics.1 Clin Invest 43: 963-974, 1964.
15

35. COOK, S. F. The structure and composition ofhemosiderin. 1 Biol Chem 82: 595-609, 1929.
36. CROMWELL, S. The metabolism of transferrin.Protides Biol Fluids 11: 484-486, 1964.
37. CROSBY, W. H. The control of iron balanceby the intestinal mucosa. Blood 22: 441-449, 1963.
38. DICKERSON, R. E., M. L. KOPKA, J. WEINZIERL,J. VARNUM, D. EISENBEERO, and E. MARGOLIASH.Location of the heme in horse heart ferricyto-chrome c by X-ray diffraction. 1 Biol Chem 242:3015-3017,1967.
39. DRYSDALE, J. W. Regulation of ferritin syn-thesis. In A. San Pietro, M. R. Lamborg, and F. T.Kenney (eds.), Regulatory Mechanisms for ProteinSynthesis in Mammalian Cells, New York, AcademicPress, 1968, pp. 431-466.
40. DRYSDALE, J. W., G. H. HAGGIS, and P. M.HARRISON. Biosynthesis of ferritin molecules. Na-ture 219: 1045-1046, 1968.
41. DRYSDALE, J. W., and H. N. MUNRO. Regula-tion of synthesis and turnover of ferritin in rat liver.1 Biol Chem 241: 3630-3637, 1966.
42. DRYSDALE, J. W., E. OLAFSDOTTIR, and H. N.
MUNRO. Effect of ribonucleic acid depletion onferritin induction in rat liver. 1 Biol Chem 243: 552-555,1968.
43. EICHHORN, G. L. The function of iron inbiochemistry. In F. Gross (ed.), Iron Metabolism;an International Symposium, Berlin, Springer-Ver-lag, 1964, pp. 9-21.
44. EYLAR, E. H., and G. MATIOLI. Apoferritinsynthesis in human erythroid cells in thalassaemia.Nature 208: 661-664,1965.
45. FALK, J. E. Porphyrins and Metalloporphy-rins. Amsterdam, Elsevier, 1964.
46. FARRANT, J. L. An electron microscopic studyof ferritin. Biochim Biophys Acta 13: 569-576, 1954.
47. FEENEY, R. E., and ST. K. KOMATSU. Thetransferrins. Structure and Bonding 1: 149-206,1966.
48. FINEBERG, R. A., and D. M. GREENBERG. Ferri-tin biosynthesis. II. Acceleration of synthesis by theadministration of iron. 1 Biol Chem 214: 97-106,1955.
49. FINEBERG, R. A., and D. M. GREENSERG. Ferri-tin biosynthesis. III. Apoferritin, the initial product.1 Biol Chem 214: 107-113, 1955.
50. FISCHBACH, F. A., and J. W. ANDEREGG. AnX-ray scattering study of ferritin and apoferritin.1 Molec Biol 14: 458-473, 1965.
51. FISCHBACH, F. A., P. M. HARRISON, and T. G.HoY. The structural relationship between ferritinprotein and its mineral core. 1 Molec Biol 39: 235-238,1969.
52. FLETCHER, J., and E. R. HUEHNS. The signifi-cance of the binding of iron by transferrin. Nature215: 584-586, 1967.
53. FLETCHER, J., and E. R. HUEHNS. Function oftransferrin. Nature 218: 1211-1214, 1968.
54. GABUZDA, T. G., and F. H. GARDNER. Obser-vations on Fe59 labelled bone marrow ferritin. Blood29: 770-779,1967.
55. GABUZDA, T. G., and J. PEARSON. Two molecu-lar forms of ferritin in rabbit marrow. Nature 220:1234-1235, i968.
56. GIBsoN, Q. H., and L. J. PARKHURST. Kineticevidence for a tetrameric functional unit in hemo-globin. 1 Molec Biol 243: 5521-5524, 1968.
57. GRANICK, S. Ferritin. I. Physical and chemi-cal properties of horse spleen ferritin. 1 Biol Chem146: 451-461, 1942.
58. GRANICK, S. Ferritin. IX. Increase of proteinapoferritin in the gastrointestinal mucosa as a directresponse to iron feeding. The function of ferritinin the regulation of iron absorption. 1 Biol Chem164: 737-746, 1946.
59. GRANICK, S. Ferritin; its properties and sig-nificance for iron metabolism. Chem Rev 38: 379-403,1946.
60. GRANICK, S. Structure and physiological func-tions of ferritin. Physiol Rev 31: 489-511, 1951.
61. GRANICK, S., and L. MICHAELIS. Ferritin. II.Apoferritin of horse spleen. 1 Biol Chem 147: 91-97,1943.
62. GREEN, S., and A. MAZUR. Relation of uricacid metabolism to release of iron from hepaticferritin. 1 Biol Chem 227: 653-668, 1957.
63. GREENE, F. C., and R. E. FEENEY. Physicalevidence for transferrins as single polypeptide chains.Biochemistry 7: 1366-1371,1968.
64. GUIDOTTI, G. Studies on the chemistry ofhemoglobin. IV. The mechanism of reaction withligands. 1 Biol Chem 242: 3704-3712, 1967.
65. HAGGIS, G. H. The iron oxide core of the ferri-tin molecule. 1 Molec Biol 14: 598-602, 1965.
66. HAGGIS, G. H. The ferritin molecule. In SixthInternational Congress for Electron Microscopy,Kyoto, Maruzen Co., 1966, pp. 127-128.
67. HAMMEL, C. L., and S. P. BESSMAN. Controlof hemoglobin synthesis by oxygen tension in a cell-free system. Arch Biochem 110: 622-627, 1965.
68. HARRISON, P. M. The structures of ferritin andapoferritin; some preliminary X-ray data. 1 MolecBiol 1: 69-80, 1959.
69. HARRISON, P. M. The structure of apoferritin;molecular size, shape, and symmetry from X-raydata. 1 Molee Biol 6: 404-422, 1963.
70. HARRISON, P. M. Ferritin and haemosiderin.In F. Gross (ed.), Iron Metabolism; an InternationalSymposium, Berlin, Springer-Verlag, 1964, pp. 40-56.
71. HARRISON, P. M., and F. A. FISCHBACH. Thestructure of ferritin. Acta Crystallogr 21, Suppl. A:160, 1966.
16

72. HARRISON, P. M., F. A. FISCHBACH, T. G. HoY,and G. H. HAGGIS. Ferric oxyhydroxide core offerritin. Nature 216: 1188-1190, 1967.
73. HARRISON, P. M., and D. W. GREGORY. Re-assembly of apoferritin molecules from subunits.Nature 220: 578-580, 1968.
74. HARRISON, P. M., and T. HOFMANN. Thestructure of apoferritin; evidence for chemical sub-units from "fingerprints" of tryptic digests. 1 MolecBiol 4: 239-250, 1962.
75. HARRISON, P. M., T. HOFMANN, and W. 1. P.MAINWARING. The structure of apoferritin; aminoacid composition and end-groups. 1 Molec Biol 4:251-256, 1962.
76. HARRISON, S. C., and E. R. BLOUT. Reversibleconformational changes of myoglobin and apomyo-globin. ¡ Biol Chem 240: 299-303, 1965.
77. HOFMANN, T., and P. M. HARRISON. The struc-ture of apoferritin; degradation into and molecularweight of subunits. 1 Molec Biol 6: 256-267, 1963.
78. HUBER, R., H. FORMANEK, and O. Epp. Kris-tallstrukturanalyse des Met-Erythrocruorins bei 5.5AAuflosung. Naturwiss. 55: 75-77, 1968.
79. HYDE, B. B., A. J. HODGE, A. KAHN, and M. L.BIRNSTIEL. Study on phytoferritin. 1 UltrastructRes 9: 248-258, 1963.
80. JAMIESON, G. A. Studies on glycoprotein. II.Isolation of the carbohydrate chains of human trans-ferrin. 1 Biol Chem 240: 2914-2920, 1965.
81. JANDL, J. H., J. K. INMAN, R. L. SIMMONS, andD. W. ALLEN. Transfer of iron from serum iron-binding protein to human reticulocytes. 1 Clin Invest38: 161-185, 1959.
82. JANDL, J. H., and J. H. KATZ. The plasma-to-cell cycle of transferrin. 1 Clin Invest 42: 314-326,1963.
83. JEPPssoN, J.-O., and J. SJoQUIST. Subunits ofnormal human transferrin. Sixth Intl Cong Bio-chem 2: 157, 1964 (abstract).
84. JEPPSSON, J.-O., and J. SJoQuIST. Structuralstudies on genetic variants of human transferrin.Protides Biol Fluids 14: 87-91, 1966.
85. JONES, P., and A. SUGGETT. The catalase-hydro-gen peroxide system; a theoretical appraisal of themechanism of catalase action. Biochem / 110: 621-629, 1968.
86. KATZ, J. H., and J. H. JANDL. The role oftransferrin in the transport of iron into the develop-ing red cell. In F. Gross (ed.), Iron Metabolism;an International Symposium, Berlin, Springer-Ver-lag, 1964, pp. 103-117.
87. KENDREW, J. C. Side-chain interactions inmyoglobin. Brookhaven Sympos Biol 15: 216-226,1962.
88. KENDREW, J. C., R. E. DICKERSON, B. E.STRANDBERG, R. G. HART, D. R. DAVIES, D. C.PaILLIPS, and V. C. SHORE. Structure of myoglobin;
a three-dimensional Fourier synthesis at 2A resolu-tion. Nature 185: 422-427, 1960.
89. KING, T. E., H. S. MASON, and M. MORRISON(eds.). Oxidases and Related Redox Systems, vol. 1.New York, Wiley & Sons, 1965.
90. KING, T. E., H. S. MASON, and M. MORRISON(eds.). Oxidases and Related Redox Systems, vol. 2.New York, Wiley & Sons, 1965.
91. KLEINWACHTER, V. An X-ray diffraction studyof ferritin; interpretation of low-angle scattering.Arch Biochem 105: 352-358, 1964.
92. KOENIG, D. F. The structure of a-chloro-hemin. Acta Crystallogr 18: 663-673, 1965.
93. KOMATSU, ST. K., and R. E. FEENEY. Role oftyrosyl groups in metal binding properties of trans-ferrins. Biochemistry 6: 1136-1141, 1967.
94. KOURILSKY, F. M., and P. BURTIN. Immuno-chemical difference between iron-saturated and un-saturated human transferrin. Nature 218: 375-377,1968.
95. KRUH, J., and H. BORSOOK. Haemoglobinsynthesis in rabbit reticulocytes in vitro. 1 Biol Chem220: 905-915, 1956.
96. LANE, R. S. Transferrin synthesis in the rat;a study using the fluorescent antibody technique.Brit / Haemat 15: 355-364, 1968.
97. LEVIN, O. Electron microscope observationson some 60s erythrocruorins and their split products.1 Molec Biol 6: 95-101, 1963.
98. LoEwus, M. W., and R. A. FINEBERO. Theincorporation of iron by apoferritin. Biochim Bio-phys Acta 26: 441-443, 1957.
99. LOFTFIELD, R. B., and E. A. EIGNER. The timerequired for the synthesis of a ferritin molecule inrat liver. / Biol Chem 231: 925-943, 1958.
100. MALKIN, R., and J. C. RABINOWITZ. Nonhemeiron electron-transfer proteins. Ann Rev Biochem36: 113-148, 1967.
101. MARGOLIASH, E., and A. SCHEjTER. Cyto-chrome c. Advances Protein Chem 21: 113-286,1966.
102. MATIOLI, G. T., and R. F. BAKER. Denatura-tion of ferritin and its relationship with hemosiderin.J Ultrastruct Res 8: 477-490, 1963.
103. MATIOLI, G. T., and E. H. EYLAR. The bio-synthesis of apoferritin by reticulocytes. Proc NatAcad Sci USA 52: 508-516, 1964.
104. MAZUR, A., 1. LITT, and E. SHORR. Chemicalproperties of ferritin and their relation to its vaso-depressor activity. 1 Biol Chem 187: 473-484, 1950.
105. MAZUR, A., and E. SHORR. A quantitativeimmunochemical study of ferritin and its relationto the hepatic vasodepressor material. 1 Biol Chem182: 607-627, 1950.
106. MCKAY, R. H., and R. A. FINEBERG. Horse
spleen hemosiderin. 1. Isolation. Arch Biochem 104:487-495, 1964.
17

107. McKAY, R. H., and R. A. FINEBERG. Horsespleen hemosiderin. II. Further characterization.Arch Biochem 104: 496-508, 1964.
108. MEIER-RuGE, W., G. BENEKE, and G. AHLERT.
Quantitative relations between ferritin and siderin.Nature 199: 175, 1963.
109. MICHAELIS, L. Ferritin and apoferritin. Ad-vances Protein Chem 3: 53-66, 1947
110. MICHAELIS, L., C. D. CORYELL, and S. GRAN-ICK. Ferritin. III. The magnetic properties of ferri-tin and some other colloidal ferric compounds. 1Biol Chem 148: 463-480, 1943.
111. MOORE, C. V., and R. DUBACH. Iron. InC. L. Comar and F. Bronner (eds.), Mineral Me-tabolism; an Advanced Treatise, New York, Aca-demic Press, 1962, pp. 287-348.
112. MORGAN, E. H. The interaction betweenrabbit, human, and rat transferrin and reticulocytes.Brit 1 Haemat 10: 442-452, 1964.
113. MORGAN, E. H., E. R. HUEHNS, and C. A.FINCH. Iron reflux from reticulocytes and bonemarrow cells in vitro. Amer 1 Physiol 210: 579-585,1966.
114. MUIR, A. R. The molecular structure of iso-lated and intracellular ferritin. Quart 1 Exp Physiol45: 192-201, 1960.
115. MUIRHEAD, H., J. M. Cox, L. MAZZARELLA,
and M. F. PERUTZ. Structure and function of haemo-globin. III. A three-dimensional fourier synthesis ofhuman deoxyhaemoglobin at 5.5A resolution. 1Molec Biol 28: 117-156, 1967.
116. MUIRHEAD, H., and M. F. PERUTZ. Structureof haemoglobin; a three-dimensional fourier synthe-sis of reduced human haemoglobin at 5.5A resolu-tion. Nature 199: 633-639, 1963.
117. NEER, E. J., W. KONIGSBERG, and G. GUIDOTTI.
The interactions between a and 3 chains of humanhemoglobin. 1 Biol Chem 243: 1971-1978, 1968.
118. NEILANDS, J. B. Naturally occurring non-porphyrin iron compounds. Structure and Bonding1: 59-108, 1966.
119. NICHOLLS, P., and G. R. SCHONBAUM. Cata-lases. In P. D. Boyer, H. Lardy, and K. Myrback(eds.), The Enzymes, vol. 8, New York, AcademicPress, 1963, pp. 147-225.
120. NOBBS, C. L., H. C. WATSON, and J. C. KEN-
DREW. Structure of deoxymyoglobin. Nature 209:339-341, 1966.
121. NoYEs, W. D., T. H. BOTHWELL, and C. A.FINCH. The role of the reticuloendothelial cell iniron metabolism. Brit 1 Haemat 6: 43-55, 1960.
122. PADLAN, E. A., and W. E. LOVE. Structureof the haemoglobin of the marine annelid worm,Glycera dibranchiata, at 5.5A-resolution. Nature220: 376-378, 1968.
123. PAPE, L., J. S. MULTANI, C. STITT, and P.SALTMAN. In vitro reconstitution of ferritin. Bio-chemistry 7: 606-612, 1968.
124. PAPE, L., J. S. MULTANI, C. STITT, and P.SALTMAN. The mobilization of iron from ferritinby chelating agents. Biochemistry 7: 613-616, 1968.
125. PAUL, K. G. Peroxidases. In P. D. Boyer,H. Lardy, and K. Myrback (eds.), The Enzymes,vol. 8, New York, Academic Press, 1963, pp. 227-274.
126. PEAT, A., and G. H. BANBURY. Occurrenceof ferritin-like particles in a fungus. Planta (Berl.)79: 268-270, 1968.
127. PEISACH, J., W. E. BLUMBERG, B. A. WITTEN-
BERG, and J. B. WITTENBERG. Electronic structureof photoheme proteins. III. Configuration of theheme and its ligands. 1 Biol Chem 243: 1871-1880,1968.
128. PERUTZ, M. F., H. MUIRHEAD, J. M. Cox, andL. C. G. GOAMAN. Three-dimensional fourier syn-thesis of horse oxyhaemoglobin at 2.8A resolution.II. The atomic model. Nature 219: 131-139, 1968.
129. PERUTZ, M. F., M. G. ROSSMANN, A. F.CULLIS, H. MUIRHEAD, G. WILL, and A. C. T.NORTH. Structure of haemoglobin; a three-dimen-sional fourier synthesis at 5.5A resolution, obtainedby X-ray analysis. Nature 185: 416-422, 1960.
130. PRELOG, V. Iron-containing compounds inmicro-organisms. In F. Gross (ed.), Iron Metabo-lism; an International Symposium, Berlin, Springer-Verlag, 1964, pp. 73-83.
131. RABINOVITZ, M., and H. S. WAXMAN. De-pendence of polyribosome structure in reticulocyteson iron; implication on the tape theory of haemo-globin synthesis. Nature 206: 897-900, 1965.
132. RICHTER, G. W. A study of hemosiderosiswith the aid of the electron microscope. 1 Exp Med106: 203-218, 1957.
133. RICHTER, G. W. Electron microscopy ofhemosiderin; presence of ferritin and occurrence ofcrystalline lattices in hemosiderin deposits. ¡ Bio-phys Biochem Cytol 4: 55-58, 1958.
134. RICHTER, G. W. Internal structure of apo-ferritin as revealed by the "negative staining tech-nique." 1 Biophys Biochem Cytol 6: 531-534, 1959.
135. RICHTER, G. W. The nature of hemosideringranules in idiopathic hemochromatosis; electronmicroscopy, chemical, and serological studies. Amer1 Path 35: 690-691, 1959.
136. RICHTER, G. W. On ferritin and its produc-tion by cells growing in vitro. Lab Invest 12: 1026-1039, 1963.
137. RICHTER, G. W., and G. F. WALKER. Reversi-ble association of apoferritin molecules; comparisonof light-scattering and other data. Biochemistry 6:2871-2881, 1967.
18
1
138. RIMINGTON, C., and G. Y. KENNEDY. Por-phyrins; structure, distribution, and metabolism. InM. Florkin and H. S. Mason (eds.), ComparativeBiochemistry, New York, Academic Press, 1962, pp.557-614.
139. ROBARDS, A. W., and C. L. ROBINSON. Fur-ther studies on phytoferritin. Planta (Berl.) 82:179-188, 1968.
140. ROCHE, J., M. BEssxs, and J. BRETON-GoRIUS.
Mise en évidence de molécules d'hémoglobine et deferritine dans certaines cellules d'Arenicola marina.C R Acad Sci 252: 3886-3887, 1961.
141. ROSENMEYER, M. A., and E. R. HUEHNS. Onthe mechanism of the dissociation of haemoglobin.1 Molec Biol 25: 253-273, 1967.
142. Rossi FANELLI, A., E. ANTONINI, and A.CAPUTO. Hemoglobin and myoglobin. Advances Pro-tein Chem 19: 73-222, 1964.
143. ROTHEN, A. Ferritin and apoferritin in theultra-centrifuge. Studies on the relationship of fer-ritin and apoferritin; precision measurements of therates of sedimentation of apoferritin. 1 Biol Chem152: 679-693, 1944.
144. ROUGHTON, F. J. W. Transport of oxygen andcarbon dioxide. In Handbook o] Physiology, Sec-tion 3, Respiration, vol. 1, Washington, D.C.,American Physiological Society, 1964, pp. 767-825.
145. ROUGHTON, F. J. W., A. B. OTIS, and R. L. J.LYSTER. The determination of the individual equi-librium constants of the four intermediate reactionsbetween oxygen and sheep haemoglobin. Proc RoySoc [Biol] 144: 29-54, 1955.
146. SADDI, R., and A. voN DER DECKEN. Specificstimulation of amino acid incorporation into ferritinby rat-liver slices after injection of iron in vivo.Biochem Biophys Acta 90: 196-198, 1964.
147. SAN PIETRO, A. (ed.). Non-heme Iron Pro-teins; Role in Energy Conversion. Yellow Springs(Ohio), Antioch Press, 1965.
148. SECKBACH, J. Studies on the deposition ofplant ferritin as influenced by iron supply to iron-deficient beans. 1 Ultrastruct Res 22: 413-423, 1968.
149. SHODEN, A., B. W. GABRIO, and C. A. FINCH.
The relationship between ferritin and hemosiderinin rabbits and man. 1 Biol Chem 204: 823-830, 1953.
150. SHODEN, A., and P. STURGEON. Hemosiderin.
1. A physico-chemical study. Acta Haemat (Basel)23: 376-392, 1960.
151. SHODEN, A., and P. STURGEON. Formation of
haemosiderin and its relation to ferritin. Nature189: 846-847, 1961.
152. SMITH, J. A., J. W. DRYSDALE, A. GOLDBERG,
and H. N. MUNRO. The effect of enteral andparenteral iron on ferritin synthesis in the intestinalmucosa of the rat. Brit 1 Haemat 14: 79-86, 1968.
153. SPIES, J. R. Determination of tryptophan inproteins. Anal Chem 37: 1412-1416, 1967.
154. STURGEON, P., and A. SHODEN. Mechanismsof iron storage. In F. Gross (ed.), Iron Metabolism;an International Symposium, Berlin, Springer-Verlag, 1964, pp. 121-146.
155. SURAN, A. A., and H. TARVER. Heterogeneityof horse spleen ferritin and apoferritin; comparisonof electrophoretic and chromatographic fractions.Arch Biochem 111: 399-406, 1965.
156. TAVILL, A. S., A. T. GRAYZEL, 1. M. LONDON,
M. K. WILLIAMS, and G. A. VANDERHOFF. The roleof heme in the synthesis and assembly of hemo-globin. 1 Biol Chem 243: 4987-4999, 1968.
157. THERON, J. J., A. O. HAWTREY, and V.SCHIRREN. Characterization of human liver ferritinby starch-gel electrophoresis. Clin Chim Acta 8:165-167, 1963.
158. TOWE, K. M., and W. F. BRADLEY. Mineral-ogical constitution of colloidal "Hydrous FerricOxides." ¡ Colloid Interface Sci 24: 384-392, 1967.
159. TowE, K. M., and H. A. LOWENSTAM. Ultra-structure and development of iron mineralization inthe radular teeth of Cryptochiton stelleri (mollusca).1 Ultrastruct Res 17: 1-13, 1967.
160. TowE, K. M., H. A. LOWENSTAM, and M. H.NESSON. Invertebrate ferritin; occurrence in mol-lusca. Science 142: 63-64, 1963.
161. VAN STONE, J., R. D. COLEMAN, and P.HELLER. Effect of ferritin on globin synthesis.Nature 210: 843-844, 1966.
162. WAXMAN, H. S., and M. RABINOVITZ. Ironsupplementation in vitro and the state of aggrega-tion and function of reticulocyte ribosomes in hemo-globin synthesis. Biochem Biophys Res Commun19: 538-545, 1965.
163. WAXMAN, H. S., and M. RABINOVITZ. Controlof reticulocyte polyribosome content and hemoglobinsynthesis by heme. Biochim Biophys Acta 129: 369-379, 1966.
164. WEINTRAUB, L. R., M. E. CONRAD, and W. H.CROSBY. The role of hepatic iron stores in thecontrol of absorption. / Clin Invest 43: 40-44, 1964.
165. WHEBY, M. S., and L. G. JONES. Role oftransferrin in iron absorption. 1 Clin Invest 42:1007-1016, 1963.
166. WILLIAMS, M. A., and P. M. HARRISON.
Electron-microscopic and chemical studies of oligo-mers in horse ferritin. Biochem 1 110: 265-280, 1968.
167. WINDLE, J. J., A. K. WIERSEMA, J. R. CLARK,
and R. E. FEENEY. Investigation of the iron andcopper complexes of avian conalbumins and humantransferrins by electron paramagnetic resonance.Biochemistry 2: 1341-1345, 1963.
168. WOHLER, F. Über die Natur des Hamosi-derins. Acta Haemat (Basel) 23: 342-377, 1960.
169. WOHLER, F. The treatment of haemochro-matosis with desferrioxamine. In F. Gross (ed.),
19

Iron Metabolism; an International Symposium, Ber- Regulation of ferritin synthesis in rat liver. 1 Biollin, Springer-Verlag, 1964, pp. 551-567. Chem 243: 2911-2917, 1968.
170. WOODWORTH, R. C. The mechanism of metal 173. Yu, F.-L., and R. A. FINEBERG. Biosynthesisbinding to conalbumin and siderophilin. Protides of ferritin by rat liver slices. ¡ Biol Chem 240:Biol Fluids 14: 37-44, 1966. 2083-2087, 1965.
171. WYMAN, J. Linked functions and reciprocal 174. ZAIL, S. S., R. W. CHARLTON, J. D. TORRANCE,effects in hemoglobin; a second look. Advances Pro- and T. H. BOTHWELL. Studies on formation of ferri-tin Chem 19:. 7-28R6 1964 tin in reA eP1 precursnrs 7 r71in iv,,/ct 43: 670-680,
172. YosHINO, Y., J. MANIS, and D. SCHACHTER. 1964.
20

THE CONTROL OF IRON BALANCE BY THEINTESTINAL MUCOSA 1
William H. Crosby
Iron metabolism is under the control of acomplicated system for keeping unneeded ironout of the body. It is unlike the metabolism ofother nutrient metals, such as potassium, cal-cium, or copper, which depend upon excretoryfunctions to remove any excess. The excretorycapability for getting rid of iron is meager, sothe balance is maintained primarily by adjust-ing the absorption of available iron (17). Thesmall intestine of a normal man absorbs about1 mg of iron a day (18), thereby offsetting simi-lar losses (14), which are comprised of thetraces of iron in all of the epithelial cells shedfrom the surfaces of the body. This 1 mg ofiron is absorbed from the 15 to 20 mg in thedaily diet. More than 50 per cent of dietary ironis available for absorption (13), but the normalintestine declines to accept unneeded iron. Whenthe requirement is increased during growth orpregnancy or after blood loss, the intestine'smucosal block is relaxed to permit more of theavailable iron to enter (9). A normal man witha moderate-to-severe iron deficiency can absorb6 mg of his dietary iron in a day-1 mg lost indesquamating epithelium and 5 mg incorporatedinto the expanding mass of circulating hemoglo-bin as the anemia is repaired (6).
The diflerences of behavior of the intestine inthese two states, repletion and depletion of iron,provide a useful model for comparative studies
1 These studies were aided with funds from U.S. ArmyResearch and Development Command Contract NumberDA-49-193-MD-2815.
and for speculation concerning the control ofiron metabolism. They also provide some insightinto the complexity of the system that exerts thecontrol.
Iron deficiency is induced experimentally byremoving blood from normal volunteers. Oneliter of blood with 150 g of hemoglobin con-tains 500 mg of iron, which is 10 to 15 per centof the body's total. Following such a loss, theanemia is corrected by a temporary increase oferythropoiesis. The iron required for this spurtof hemoglobin synthesis comes from two sources-the physiologically uncommitted stores of ironin the liver, spleen, and bone marrow, and fromthe diet. Following this loss of blood and iron,the small intestine absorbs more than the usualamount of iron. It changes its behavior in anappropriate reaction to a changed requirementfor iron. In other words, the intestine is actingupon information it receives concerning the re-quirement.
The iron absorption control system comprisesa series of recognizable steps: (1) informationconcerning the requirement for iron must origi-nate somewhere in the system; (2) this informa-tion must somehow be transmitted to the smallintestine; (3) the intestine must somehow re-ceive the information; and (4) the informationmust be translated into a pattern of iron ab-sorption-an avidity that is appropriate to therequirement for iron. Though the nature of thissystem is known, information is still lacking onprecisely how the several steps are accomplished.
21
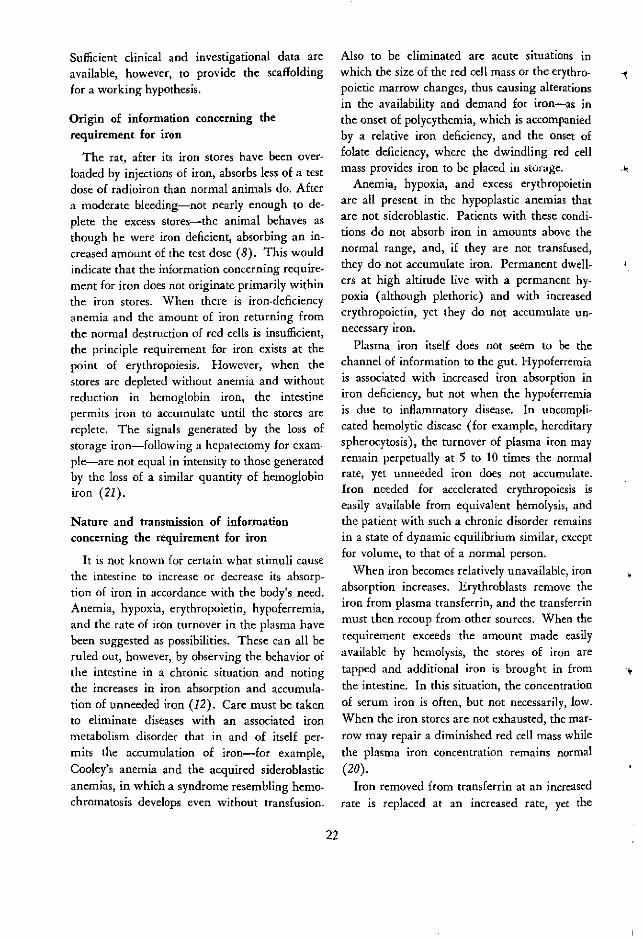
Sufficient clinical and investigational data areavailable, however, to provide the scaffoldingfor a working hypothesis.
Origin of information concerning therequirement for iron
The rat, after its iron stores have been over-loaded by injections of iron, absorbs less of a testdose of radioiron than normal animals do. Aftera moderate bleeding-not nearly enough to de-plete the excess stores-the animal behaves asthough he were iron deficient, absorbing an in-creased amount of the test dose (8). This wouldindicate that the information concerning require-ment for iron does not originate primarily withinthe iron stores. When there is iron-deficiencyanemia and the amount of iron returning fromthe normal destruction of red cells is insufficient,the principle requirement for iron exists at thepoint of erythropoiesis. However, when thestores are depleted without anemia and withoutreduction in hemoglobin iron, the intestinepermits iron to accumulate until the stores arereplete. The signals generated by the loss ofstorage iron-following a hepatectomy for exam-ple-are not equal in intensity to those generatedby the loss of a similar quantity of hemoglobiniron (21).
Nature and transmnission of informationconcerning the requirement for iron
It is not known for certain what stimuli causethe intestine to increase or decrease its absorp-tion of iron in accordance with the body's need.Anemia, hypoxia, erythropoietin, hypoferremia,and the rate of iron turnover in the plasma havebeen suggested as possibilities. These can all beruled out, however, by observing the behavior ofthe intestine in a chronic situation and notingthe increases in iron absorption and accumula-tion of unneeded iron (12). Care must be takento eliminate diseases with an associated ironmetabolism disorder that in and of itself per-mits the accumulation of iron-for example,Cooley's anemia and the acquired sideroblasticanemias, in which a syndrome resembling hemo-chromatosis develops even without transfusion.
Also to be eliminated are acute situations inwhich the size of the red cell mass or the erythro-poietic marrow changes, thus causing alterationsin the availability and demand for iron-as inthe onset of polycythemia, which is accompaniedby a relative iron deficiency, and the onset offolate deficiency, where the dwindling red cellmass provides iron to be placed in storage.
Anemia, hypoxia, and excess erythropoietinare all present in the hypoplastic anemias thatare not sideroblastic. Patients with these condi-tions do not absorb iron in amounts above thenormal range, and, if they are not transfused,they do not accumulate iron. Permanent dwell-ers at high altitude live with a permanent hy-poxia (although plethoric) and with increasederythropoietin, yet they do not accumulate un-necessary iron.
Plasma iron itself does not seem to be thechannel of information to the gut. Hypoferremiais associated with increased iron absorption iniron deficiency, but not when the hypoferremiais due to inflammatory disease. In uncompli-cated hemolytic disease (for example, hereditaryspherocytosis), the turnover of plasma iron mayremain perpetually at 5 to 10 times the normalrate, yet unneeded iron does not accumulate.Iron needed for accelerated erythropoiesis iseasily available from equivalent hemolysis, andthe patient with such a chronic disorder remainsin a state of dynamic equilibrium similar, exceptfor volume, to that of a normal person.
When iron becomes relatively unavailable, ironabsorption increases. Erythroblasts remove theiron from plasma transferrin, and the transferrinmust then recoup from other sources. When therequirement exceeds the amount made easilyavailable by hemolysis, the stores of iron aretapped and additional iron is brought in fromthe intestine. In this situation, the concentrationof serum iron is often, but not necessarily, low.When the iron stores are not exhausted, the mar-row may repair a diminished red cell mass whilethe plasma iron concentration remains normal(20).
Iron removed from transferrin at an increasedrate is replaced at an increased rate, yet the
22
-1
i

concentration of plasma iron and the saturationof plasma transferrin tend to remain constant.This suggests that the transferrin's avidity foriron involves a homeostatic mechanism thatmaintains the iron-binding protein at about onethird of saturation (11). When saturation fallsbelow that level, the avidity of the protein seemsto increase so that iron is drawn from the storagedepots. When a normal man is injected paren-terally with a modest amount of iron in excessof requirement-let us say 1 or 2 grams-withina few weeks that iron has been distributed to thestorage depots, and the ratio of plasma iron totransferrin re-establishes itself at the evidentlycritical level of about one third saturation. Theavidity of the transferrin is low enough to pre-vent the excessive storage iron from bulginginto the plasma space.
The homeostatic behavior of transferrin,which shows avidity increased during iron de-fieiency and decreased during surfeit, suggeststhat this is the mechanism whereby informationconcerning iron requirement is transmitted fromthe place where iron is needed to the place whereit is available.
The intestine's reception of informationconcerning the requirement for iron
The plasma transferrin behaves in responseto the requirement for iron, bringing iron to thestores when there is an excess and cleaning outthe stores when there is a deficit. It is evidentthat the several pools of uncommitted iron varyin their availability. For example, the iron de-rived from normal hemolysis seems to be mostreadily available, while iron stored in the liveris less so. As a consequence, the daily cycle oferythrocyte iron involves little of the liver's stor-age iron: about 90 per cent of the iron in newred cells comes from old red cells. When the re-quirement increases and the transferrin mustrecover the needed iron from available sources,the more labile, easily available iron pools arethe first to go. Notable among these is the non-heme iron in the intestinal mucosa. We havefound that the concentration of iron in theduodenal mucosa is low in the case of iron de-
ficiency and high in experimental iron overload(8). For example, in rats, within a week afterhemorrhage, the concentration of iron in theduodenum falls from about 15 to 8 ,tg per g oftissue. When 25 ,tg of iron is injected intra-venously, the concentration of duodenal ironabruptly increases, then gradually subsides tonormal within four days. There is evidence thatthe differences of intestinal iron concentrationbetween normal, iron-deficient, and iron-loadedanimals may not be so great in the epithelial cellsas it is in the entire mucosa (4), and the differ-ences may not be evident in man (1). The prob-lem needs further investigation, but it is worthconsidering that in iron deficiency all tissues be-come iron deficient, and in the state of ironoverload resulting from injections of iron ortransfusions it is possible to see excess iron in theintestinal lamina propria (2).
The working hypothesis here is that the smallintestine receives information concerning thebody's requirement for iron through the mediumof its nonheme iron pool. When iron is neededthe pool is depleted; when iron is in excess thepool becomes overloaded.
Translating iron requirement information intoan appropriate pattern of iron absorption
In both man and rats (7, 10, 16), radioauto-graphs of the duodenum after ingestion of radio-iron have demonstrated that the epithelial cellsof the villi react differently in different states ofiron repletion. In the iron-deficient state, thecells in vivo take up a great amount of the radio-iron and pass all of it into the body, so that inthe radioautographs the villi are free of activity.In vitro, the epithelial cells accept the iron freelybut are unable to pass it on, so they are highlyradioactive. Normal epithelium in vitro acceptsless iron than that of the iron-deficient patient,while the epithelium of the iron-loaded subjectaccepts little or no iron at all. The in vivo ex-periment in iron-loaded animals does not revealany radioactivity in the villous epithelium either.One may conclude that these cells have beenconditioned to refuse available iron. In this situa-tion, the mucosal block to absorption appears to
23

reside at the surface of the cell. On the otherhand, in normal animals the radioautographdemonstrates that the epithelial cells sequester aportion of the absorbed iron, and that iron is lostinto the lumen when the cells are shed at theend of their life cycle. Another portion of theabsorbed iron, of course, is passed along to thebody. Thus, in addition to the mechanism atthe surface of the cell, there appears to be a sec-ond mechanism within the cell to prevent un-needed iron from entering the body. The epithe-lium has the ability to synthesize ferritin, andthis ability is sharply diminished in iron de-ficiency (5). For this reason, it is believed pos-sible that the accepted iron which becomessequestered in the epithelium has been boundinto ferritin. In this conception, ferritin is not astage of iron absorption but rather a metaboliccul-de-sac to prevent iron absorption. For thesake of completeness, it should be noted thatthere is yet another block to the absorption ofiron. Following a large dose of iron by mouth,it is possible within two or three hours to dem-onstrate the presence of iron-loaded macro-phages in the duodenal villous tips. This occurseven in iron deficiency (19), thus indicating thatthe iron is not of internal origin. These iron-laden cells move across the epithelial cortex andreturn the iron to the intestinal lumen (2).
Conditioning of the epithelial cells results inthe absorption of iron in consonance with thebody's requirement. It is evident that the "frontdoor" of the epithelial cells can be closed againstdietary iron. There is also evidence to indicatethat the transfer of iron from cells to the plasmais rate-limiting (22). It is reasonable to postu-late that external information concerning re-quirement determines the attitude of the epithe-lial cells. According to the hypothesis, thisattitude is determined by the concentration ofnonheme iron in the lamina propria of the du-odenal mucosa. As the cells are formed, theysomehow receive a signal concerning the require-ment for iron, and this impression dominatesthe ability to accept or reject available ironthroughout the cells' life span. A cell informedof a surfeit cannot accept iron; a cell informed
of a deficiency cannot reject it. According to thisconcept, the duodenum changes its attitude to-ward available iron by changing its epithelialcovering.
The means whereby the cells are imprintedwith instructions for absorbing iron may berelated to a small amount of iron that is incor-porated into the cell as it is formed. When atrace of highly radioactive iron is injected intra-venously in normal and iron-loaded rats, thevillous epithelial cells formed thereafter areradioactive; none of the radioactivity goes intocells already formed (8). In iron-deficient ani-mals, none of the cells become radioactive. Theiron involved represents a tiny investment. Ifit is this mite that controls iron absorption bythe cell, it must be strategically positioned (15).
While the ability to excrete iron is limited,it is not entirely lacking. The macrophages ofthe intestinal lamina propria are loaded withiron in patients with transfusion siderosis, andthese cells have been shown to intercept absorbedunneeded iron (19). It is not known if theyplay any part in normal iron metabolism.
Epithelial cells of the mucus-secreting glandsare also capable of accepting more iron thanthey require and storing it as ferritin-hemosid-erin (3, 10). These cells are located at thesurfaces of the body, and when they are shedthe iron within is lost. In the gut, the mucousglands of the stomach and Brunner's glands ofthe duodenum provide yet another means bywhich a small amount of excess iron can leakout.
The total excess iron that an iron-loaded mancan lose may not exceed 4 or 5 mg a day (13).This seems small when the overload is measuredin grams, as in a patient with transfusion sider-osis, but it is adequate to help maintain ironbalance under normal conditions. It is possiblethat the intestine may, from time to time, absorbsome small quantity of iron in excess of therequirement. These excretory channels wouldbe adequate to remove the excess. Thus, themacrophages and specialized epithelial cells mayserve as a supplementary device in support of
24
1
t
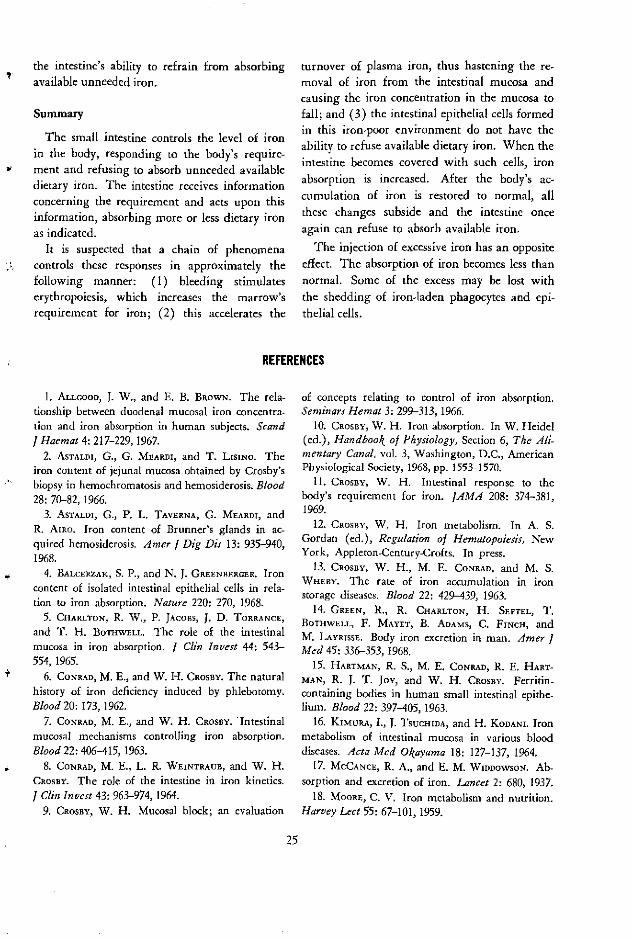
the intestine's ability to refrain from absorbingavailable unneeded iron.
Summary
The small intestine controls the level of ironin the body, responding to the body's require-ment and refusing to absorb unneeded availabledietary iron. The intestine receives informationconcerning the requirement and acts upon thisinformation, absorbing more or less dietary ironas indicated.
It is suspected that a chain of phenomenacontrols these responses in approximately thefollowing manner: (I) bleeding stimulateserythropoiesis, which increases the marrow'srequirement for iron; (2) this accelerates the
1. ALLGOOD, J. W., and E. B. BROWN. The rela-tionship between duodenal mucosal iron concentra-tion and iron absorption in human subjects. Scand¡ Haemat 4: 217-229,1967.
2. ASTALDI, G., G. MEARDI, and T. LISINo. Theiron content of jejunal mucosa obtained by Crosby'sbiopsy in hemochromatosis and hemosiderosis. Blood28: 70-82, 1966.
3. ASTALDI, G., P. L. TAVERNA, G. MEARDI, andR. AIRO. Iron content of Brunner's glands in ac-quired hemosiderosis. Amer 1 Dig Dis 13: 935-940,1968.
4. BALCERZAK, S. P., and N. J. GREENBERCER. Ironcontent of isolated intestinal epithelial cells in rela-tion to iron absorption. Nature 220: 270, 1968.
5. CHARLTON, R. W., P. JAcoBS, J. D. TORRANCE,
and T. H. BOTHWELL. The role of the intestinalmucosa in iron absorption. 1 Clin Invest 44: 543-554, 1965.
6. CONRAD, M. E., and W. H. CROSBY. The naturalhistory of iron deficiency induced by phlebotomy.Blood 20: 173, 1962.
7. CONRAD, M. E., and W. H. CROSBY. Intestinalmucosal mechanisms controlling iron absorption.Blood 22: 406-415, 1963.
8. CONRAD, M. E., L. R. WEINTRAUB, and W. H.CROSBY. The role of the intestine in iron kinetics.
¡ Clin Invest 43: 963-974, 1964.9. CROSBY, W. H. Mucosal block; an evaluation
turnover of plasma iron, thus hastening the re-moval of iron from the intestinal mucosa andcausing the iron concentration in the mucosa tofall; and (3) the intestinal epithelial cells formedin this iron-poor environment do not have theability to refuse available dietary iron. When theintestine becomes covered with such cells, ironabsorption is increased. After the body's ac-cumulation of iron is restored to normal, allthese changes subside and the intestine onceagain can refuse to absorb available iron.
The injection of excessive iron has an oppositeeffect. The absorption of iron becomes less thannormal. Some of the excess may be lost withthe shedding of iron-laden phagocytes and epi-thelial cells.
RENCES
of concepts relating to control of iron absorption.Seminars Hemat 3: 299-313,1966.
10. CROSBY, W. H. Iron absorption. In W. Heidel(ed.), Handbook of Physiology, Section 6, The Ali-mentary Canal, vol. 3, Washington, D.C., AmericanPhysiological Society, 1968, pp. 1553-1570.
11. CROSBY, W. H. Intestinal response to thebody's requirement for iron. ¡AMA 208: 374-381,1969.
12. CROSBY, W. H. Iron metabolism. In A. S.Gordan (ed.), Regulation o/ Hematopoiesis, NewYork, Appleton-Century-Crofts. In press.
13. CROSBY, W. H., M. E. CONRAD, and M. S.WHEBY. The rate of iron accumulation in ironstorage diseases. Blood 22: 429-439, 1963.
14. GREEN, R., R. CHARLTON, H. SEFTEL, T.BOTHWELL, F. MAYET, B. ADAMS, C. FINCH, and
M. LAYRISSE. Body iron excretion in man. Amer 1Med 45: 336-353, 1968.
15. HARTMAN, R. S., M. E. CONRAD, R. E. HART-MAN, R. J. T. JoY, and W. H. CROSBY. Ferritin-containing bodies in human small intestinal epithe-lium. Blood 22: 397-405,1963.
16. KIMURA, 1., J. TSUCHIDA, and H. KODANI. Ironmetabolism of intestinal mucosa in various blooddiseases. Acta Med Okayama 18: 127-137, 1964.
17. MCCANCE, R. A., and E. M. WIDDOWSON. Ab-sorption and excretion of iron. Lancet 2: 680, 1937.
18. MOORE, C. V. Iron metabolism and nutrition.Harvey Lect 55: 67-101, 1959.
25

19. MOURIQUAND, C. Villosité intestinale et mé-tabolisme du fer; une étude expérimentale. RevHematol 15: 472-488, 1960.
20. WEINTRAUB, L. R., M. E. CONRAD, and W. H.CROSBY. Regulation of the intestinal absorption ofiron by the rate of erythropoiesis. Brit / Haemat 11:432-438, 1965.
21. WEINTRAUB, L. R., M. E. CONRAD, W. H.CROSBY, and A. L. FoY. The role of hepatic ironstores in the control of iron absorption. 1 ClinInvest 43: 40-44, 1964.
22. WHEBY, M. S., L. G. JONES, and W. H. CROSBY.Studies on iron absorption; intestinal regulatorymechanisms. 1 Clin Invest 43: 1433-1442, 1964.
26
-TI
t1

THE ROLE OF PROTEIN IN IRON ABSORPTION
Marcel E. Conrad
Iron deficiency is widespread among popula-tions that consume a protein-deficient diet. Itsetiology has been related to a variety of differ-ent factors in combination, some of them di-rectly attributable to protein-depleted diet andothers apparently unrelated to food but occurringwith high frequency among people of limitedmeans (3, 4, 42). In some geographic areas pro-tein consumption is diminished by religious be-liefs and customs that forbid the use of meat asfood. However, in most parts of the world, aprotein-depleted diet is not eaten by choice, itbeing a reflection of poverty rather than dietaryidiosyncrasy.
Nutritional studies suggest that the iron con-tent of the diet is the most important factoraffecting iron repletion. A low incidence of irondeficiency is found in the United States, wherethe adult diet contains 10 to 20 mg of iron,whereas it is commonplace in areas of the worldwhere the diet contains less iron (42). Theproblem is further complicated by marked dif-ferences in foods and the chemical form of die-tary iron in various parts of the world. Signifi-cant differences in the quantity of iron absorbedfrom various radiolabeled foods attests to theimportance of this factor (24, 26, 27, 29). Thesedifferences exist because foods contain variousforms of iron and ingredients that serve to in-crease and/or decrease iron absorption. Ferrousiron is absorbed in greater quantities than ferriciron, and dietary ingredients such as certainsugars and amino acids solubilize iron to en-hance iron absorption, whereas other constitu-ents of the diet such as carbonates, oxalates,
phytates, and phosphates cause precipitation ormolecular aggregation of iron and hence de-crease absorption (2, 5, 8, 14, 21, 23, 28, 30, 32).
Iron deficiency is not prevalent among peoplewho consume meat as a major constituent oftheir diet. This can be attributed to both thehigh iron content of meat diets and the moreefficient absorption of hemoglobin iron thandietary iron. Heme is absorbed from the in-testinal lumen as an intact metalloporphyrin. Itdoes not compete with intraluminal iron forabsorptive sites in the mucosal cell, and in thepresence of globin-degradation products it is lesssusceptible than inorganic iron to precipitatingand aggregating chelators (Figure 1 and 1, 10,35,38, 41).
Absorption of Iron From FeS04 and Hemoglobin withFood ond Fosting
30-
1
201
._
=10
'
2
1
KlFeS04 Hemoglobin
Fosti ngFeS04 Hmoglobin
Non Fosting
FiG. 1. In measuring the absorption of Fe' from a testdose of ferrous sulfate or labeled hemoglobin containingone milligram of iron, each test dose was administered tohuman volunteers after a 16-hour fast or with food(36). More iron was absorbed by fasting subjects fromferrous sulfate than from hemoglobin. Addition of thetest doses to a meal markedly diminished the absorptionof iron from ferrous sulfate but had little effect on theabsorption of hemoglobin iron. Bars represent the meanof eight absorption studies and brackets are the standarderror of the mean.
27
1
---1

Many other factors that are generally found
in populations of limited means can contributesignificantly to iron deficiency. For example, thehistologic appearance of the small intestine innormal subjects from Southeast Asia contrasts
sharply with biopsy specimens from Europeans
and North Amrnericans. There appears to be amarked diminution in the absorptive surface
area of the gut, with alterations that resemble
sprue (9, 33). Many other factors contribute to
iron deficiency as well (Table 1). These in-
clude hookworm infestation, chronic infection,
chronic diarrhea, and frequent pregnancy (1,
13, 19, 20, 25, 31). Diets often contain mar-ginal amounts of other nutrients, and iron de-
ficiency may be complicated by the coexistence
of deficiencies in dietary needs such as folic
acid, vitamin B12, thiamine, and riboflavin (34,
37).It is difficult to study the effect of protein dep-
rivation on iron absorption in malnourished peo-
ple because of the multiplicity of factors in-
volved. For this reason, experiments with rats
have been used to study the effect of starvationand dietary depletion of protein on iron absorp-tion (11).
Previously, acute starvation was used to assayerythropoietin (22). Rodents starved for five
days have a marked depression in the incorpora-tion of intravenous doses of radioiron into red
TABLE 1. Factors affecting iron repletion in protein-deprived populations
Absorption:
1. Iron-deficient diet2. Chemical form of dietary iron3. Histology of small intestine4. Limited erythropoiesis5. Limited growth rate6. Chronic infection7. Chronic diarrhea8. Geophagia
Excretion:
1. Enhanced excretion2. Intestinal parasites3. Frequent pregnancy
blood cells. Similarly, there is a notable decreasein the absorption of iron from oral test doses offerrous sulfate. The animals lose body weight;they develop a relative erythrocytosis; and theyshow an elevated serum iron concentration, asignificant decrease in their total iron-bindingcapacity, and a prolonged plasma iron clearancewith diminished plasma iron turnover (Table2).
Similar changes were observed in ferrokineticstudies of rats made iron-deficient by phlebotomyof 4 ml of blood at four and ten days before star-vation when compared with iron-deficient ratsthat were fed. The starved animals lose 25 percent of their body weight after five days offasting. The packed cellular volume increases,because starved rodents voluntarily abstain fromdrinking normal quantities of water. Starvationdecreases iron absorption and the incorporationof radioiron into red blood cells. Serum ironconcentration was shown to be increased, and thetotal iron-binding capacity decreased. Differencesin the plasma iron clearance and calculated plasmairon turnover were not significant (Table 3).
Ferrokinetic data from starved iron-deficientrats were similar to observations in normal un-starved animals. A comparison of iron absorp-tion studies in normal, iron-deficient, iron-loaded, and phenylhydrazine-treated rats isshown in Figure 2. In groups of unstarved ani-mals, iron deficiency and phenylhydrazine-in-duced hemolysis caused an increase in iron ab-sorption, whereas iron-loaded rats absorbed lessiron than normal control animals. A similar
TABLE 2. Effect of acute starvation on iron metabolismin normal rats
FASTED STARVED
OVERNIGHT 5 DAYS
Iron absorption (%) 20 5Weight loss (%) 6 23Hematocrit (%) 48 55Serum iron (tg/100 ml) 116 192TIBC (yag/100 ml) 495 416Plasma iron clearance (T Y/2 min) 70 169Daily iron turnover (,ag/d) 115 79RBC iron incorporation (%) 36 7
28
¿
-4

TABLE 3. Effect of acute starvation on iron metabolism
in iron-deficient rats
FASTED STARVEDOVERNIGHT 5 DAYS
Iron absorption (%) 48 24Weight loss (%) 5 25Hemnatocrit (%) 39 45Serum iron (,tg/100 ml) 51 89TIBC (,ug/100 ml) 540 428Plasma iron clearance (T /r min) 40 50Daily iron turnover (tzg/d) 89 110RBC iron incorporation (%) 80 54
relationship was observed among groups of
starved animals in the various states of iron re-pletion and with hemolysis. However, the
starved animals absorbed significantly less iron
than unstarved rats in the same state of iron
repletion. Thus, iron-deficient and phenylhydra-
zine-treated starved rats absorbed approximately
the same amount of iron from oral test doses of
ferrous sulfate as did unstarved normal control
animals. This indicates that starvation produces
ABSORPrlTION OF IRON BY RATS IN VARIOUS STATES OF IRON REPLETION ANDHEMOLYSIS: FED VERSUS STARVEO RATS
FIG. 2. In the various states of iron repletion and he-
molysis, rats fed a normal diet (stippled bars) absorbed
significantly more Fe5' from oral test doses of ferrous sul-fate than comparable animals starved for five days (stripedbars) (16). Fasted, iron-deficient rats absorbed as muchiron as normal, unstarved animals but significantly less
than the iron-deficient rats that received a normal diet.
Similar changes were observed in acetyl-phenylhydrazine-
treated animals. This suggested that there was a rela-
tive deficiency of substances required for hemoglobin syn-
thesis but that the deficit was not absolute. Bars show
mean levels and brackets indicate 1 SE for 10 rats.
relative changes in iron absorption and that anyhuman or animal studies must include appropri-ate control groups, or else differences will remainundetected.
The elevated hematocrit observed in all groupsof starved animals was caused by dehydrationand a diminished plasma volume. Starved ratsingest about one half the volume of water con-sumed by fed animals, and Cr' red blood cellvolume studies showed the same red blood cellmass in normal animals and in rats starved forfive days. To determine whether relative eryth-remia or dehydration affected iron absorption,water was removed from animal cages and ratswere hydrated by hypodermoclysis of 10 ml 5%dextrose at six-hour intervals for five days. Halfthe animals were starved and the remainderwere fed dried food. The hematocrit remainednormal in the parenterally hydrated starved ani-mals, but iron absorption and the red blood cellincorporation of Fe5 was notably depressed(Table 4).
Periodic studies following recovery from a five-day period of starvation showed that iron ab-sorption became normal after six days of feed-ing. This coincided with the interval required
TABLE 4. Hydration and iron absorption
NORMAL STARVED 5 DAYS
HYPO- HYPO0WATER WATER
DERMO- DERMO-AD LIB. AV LIB.
CLYSIS CLYSIS
Water intake(ml/day) 35 40 21 40
Food(g/day) 17 12 0 0
Weight(g) +12 -4 -57 -44
Hematocrit(%) 48 47 56 48
Ci`' RBC mass(ml) 5.1 5.0 4.9 5.0
Fe absorption(%) 18 15 5 6
RBC Fe` incorp.(%) 39 34 7 7
29
o
o
u1
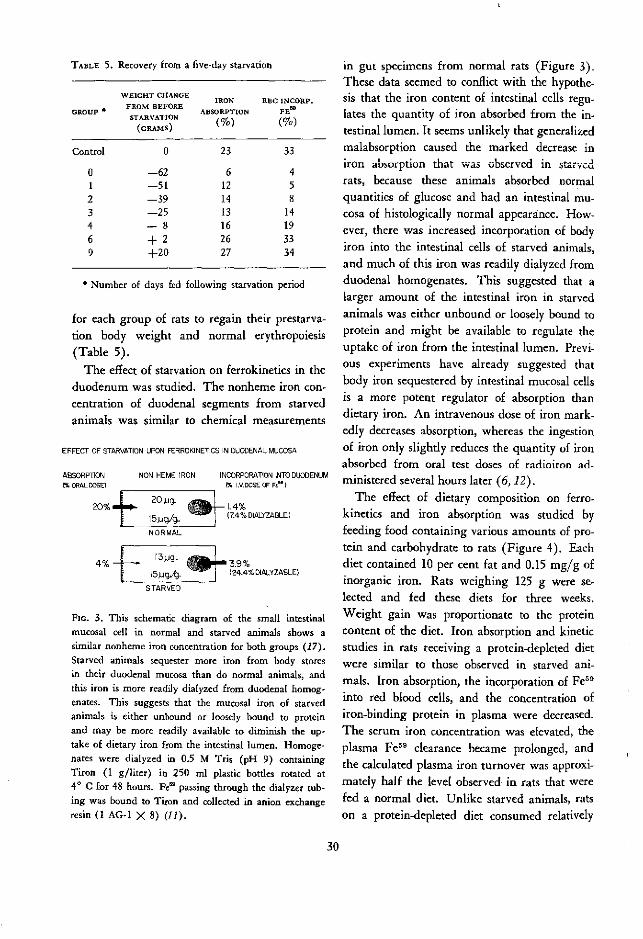
TABLE 5. Recovery from a five-day starvation
WEIGHT CHANGEIRON RBC INCORP.
GROUP FROM BEFORE ABSORPTION FEw
STARVATION ( )(GRAMS)
Control 0 23 33
0 -62 6 41 -51 12 52 -39 14 83 -25 13 144 -8 16 196 + 2 26 339 +20 27 34
*Number of days fed following starvation period
for each group of rats to regain their prestarva-tion body weight and normal erythropoiesis(Table 5).
The effect of starvation on ferrokinetics in theduodenum was studied. The nonheme iron con-centration of duodenal segments from starvedanimals was similar to chemical measurements
EFFECT OF STARVATION UPON FERROKINETICS IN DUODENAL MUCOSA
ABSORPTION NON HEME IRON INCORPORATION INTO DUODENUMEORAL DOSE) (% I.V. DOSE OF Ft")
20% + 20. > c9 r- 1 .4%15,uqg/g. í~ - (7.4% DIALYZABLE)
NORMAL
41 5 g.4. (24.4% DIALYZABLE)
STARVED
FIG. 3. This schematic diagram of the small intestinalmucosal cell in normal and srarved animals shows asimilar nonheme iron concentration for both groups (17).Starved animals sequester more iron from body storesin their duodenal mucosa than do normal animals, andthis iron is more readily dialyzed from duodenal homog-enates. This suggests that the mucosal iron of starvedanimals is either unbound or loosely bound to proteinand may be more readily available to diminish the up-take of dietary iron from the intestinal lumen. Homoge-nates were dialyzed in 0.5 M Tris (pH 9) containingTiron (1 g/liter) in 250 ml plastic bottles rotated at4° c for 48 hours. Fe' passing through the dialyzer tub-ing was bound to Tiron and collected in anion exchangeresin (1 AG-1 X 8) (11).
in gut specimens from normal rats (Figure 3).These data seemed to conflict with the hypothe-sis that the iron content of intestinal cells regu-lates the quantity of iron absorbed from the in-testinal lumen. It seems unlikely that generalizedmalabsorption caused the marked decrease iniroi absorption that was obscrvcd in starvedrats, because these animals absorbed normalquantities of glucose and had an intestinal mu-cosa of histologically normal appearance. How-ever, there was increased incorporation of bodyiron into the intestinal cells of starved animals,and much of this iron was readily dialyzed fromduodenal homogenates. This suggested that alarger amount of the intestinal iron in starvedanimals was either unbound or loosely bound toprotein and might be available to regulate theuptake of iron from the intestinal lumen. Previ-ous experiments have already suggested thatbody iron sequestered by intestinal mucosal cellsis a more potent regulator of absorption thandietary iron. An intravenous dose of iron mark-edly decreases absorption, whereas the ingestionof iron only slightly reduces the quantity of ironabsorbed from oral test doses of radioiron ad-ministered several hours later (6, 12).
The effect of dietary composition on ferro-kinetics and iron absorption was studied byfeeding food containing various amounts of pro-tein and carbohydrate to rats (Figure 4). Eachdiet contained 10 per cent fat and 0.15 mg/g ofinorganic iron. Rats weighing 125 g were se-lected and fed these diets for three weeks.Weight gain was proportionate to the proteincontent of the diet. Iron absorption and kineticstudies in rats receiving a protein-depleted dietwere similar to those observed in starved ani-mals. Iron absorption, the incorporation of Fe59
into red blood cells, and the concentration ofiron-binding protein in plasma were decreased.The serum iron concentration was elevated, theplasma Fe59 clearance became prolonged, andthe calculated plasma iron turnover was approxi-mately half the level observed in rats that werefed a normal diet. Unlike starved animals, ratson a protein-depleted diet consumed relatively
30
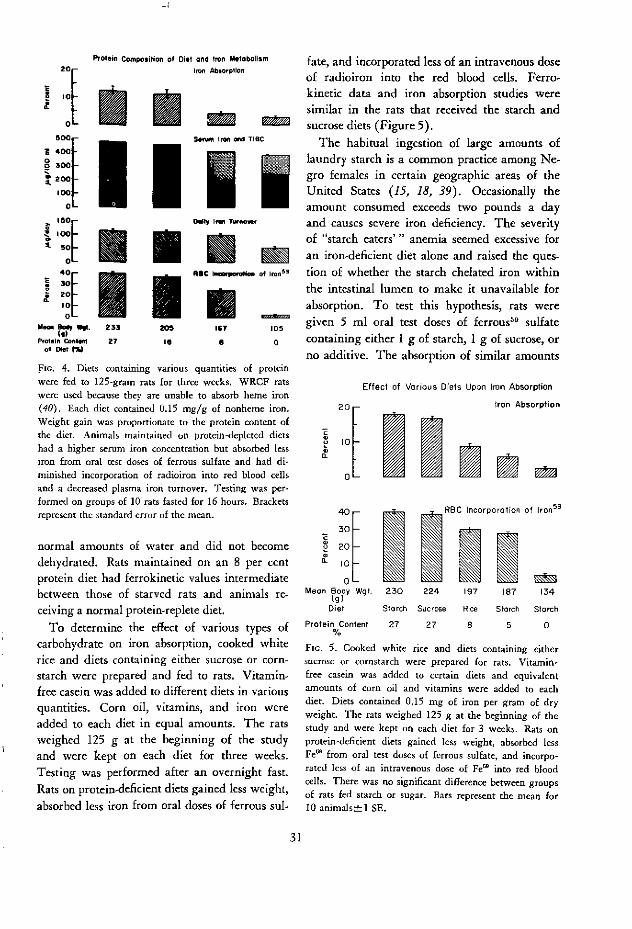
20
r
-E 400 -
~o
300 -
200
100 -
o40
. ::_' 0_40
a _loM~een ~ w#.
Protein Contelof Diet ('/,
'otein Composition of Diet oand ron Metabolism
Iron Abhorplion
S5n Iron ed TIBC
Dt/ Ifrn TWnowv
R8C ~n of Iron 9
235
27
- - _205 167 105
l8 8 0
FIG. 4. Diets containing various quantities of proteinwere fed to 125-gram rats for three weeks. WRCF ratswere used because they are unable to absorb heme iron(40). Each diet contained 0.15 mg/g of nonheme iron.Weight gain was proportionate to the protein content ofthe diet. Animals maintained on protein-depleted dietshad a higher serum iron concentration but absorbed lessiron from oral test doses of ferrous sulfate and had di-minished incorporation of radioiron into red blood cellsand a decreased plasma iron turnover. Testing was per-formed on groups of 10 rats fasted for 16 hours. Bracketsrepresent the standard error of the mean.
normal amounts of water and did not becomedehydrated. Rats maintained on an 8 per centprotein diet had ferrokinetic values intermediatebetween those of starved rats and animals re-ceiving a normal protein-replete diet.
To determine the effect of various types ofcarbohydrate on iron absorption, cooked whiterice and diets containing either sucrose or corn-starch were prepared and fed to rats. Vitamin-free casein was added to different diets in variousquantities. Corn oil, vitamins, and iron wereadded to each diet in equal amounts. The ratsweighed 125 g at the beginning of the studyand were kept on each diet for three weeks.Testing was performed after an overnight fast.Rats on protein-deficient diets gained less weight,
absorbed less iron from oral doses of ferrous sul-
fate, and incorporated less of an intravenous doseof radioiron into the red blood cells. Ferro-kinetic data and iron absorption studies weresimilar in the rats that received the starch andsucrose diets (Figure 5).
The habitual ingestion of large amounts oflaundry starch is a common practice among Ne-gro females in certain geographic areas of theUnited States (15, 18, 39). Occasionally theamount consumed exceeds two pounds a dayand causes severe iron deficiency. The severityof "starch eaters'" anemia seemed excessive for
an iron-deficient diet alone and raised the ques-tion of whether the starch chelated iron withinthe intestinal lumen to make it unavailable for
absorption. To test this hypothesis, rats weregiven 5 ml oral test doses of ferrous5 9 sulfatecontaining either 1 g of starch, 1 g of sucrose, orno additive. The absorption of similar amounts
Effect of Various Diets Upon Iron Absorption
20 ¡ron Absorption
0L - El g3 m2c-
4 0-
30 -
2 20 -
0o 0 -
Meon Body Wgt.(g)
Diel
Protein Content%
RBC Incorporation of ron59
HI l L~~~M I230 224 197 187 134
Storch Sucrose Rice Storch Starch
27 27 8 5 0
FIG. 5. Cooked white rice and diets containing eithersucrose or cornstarch were prepared for rats. Vitamin-free casein was added to certain diets and equivalentamounts of corn oil and vitamins were added to eachdiet. Diets contained 0.15 mg of iron per gram of dryweight. The rats weighed 125 g at the beginning of thestudy and were kept on each diet for 3 weeks. Rats onprotein-deficient diets gained less weight, absorbed lessFe6' from oral test doses of ferrous sulfate, and incorpo-rated less of an intravenous dose of Fe' into red bloodcells. There was no significant difference between groupsof rats fed starch or sugar. Bars represent the mean for10 animals+l1 SE.
31
i

EFFECT OF ADDITION OF STARCH OR SUCROSE
TO ORAL TEST DOSES OF RADIOIRON
25-
20-
. 15-
g15
l lo.D i 0-
55-
O-
T
No Addi tve Storch Sucrose
FIG. 6. The addition of 1 gram of either starch or su-crose to oral test doses of ferrous' sulfate had no sig-nificant effect on iron absorption (18).
of iron from each preparation indicated thatstarch had no direct intraluminal effect on ironabsorption (Figure 6).
The effect on iron excretion of diets containingvarious amounts of protein was studied by meas-uring the whole body retention of a parenteraldose of radioiron in rats with diets containingeither 27 per cent, 8 per cent, or no protein atall. After two weeks on the special diets, theanimals received an intravenous dose of Fe*9-labeled plasma, and they continued to receive thesame diets for another two months after injec-tion. The rats that were fed the protein-depleteddiets lost significantly more radioiron than theanimals that received a normal diet (Figure 7).
The effect of prolonged protein depletion onanemia was studied in rats with either iron-replete or iron-depleted diets containing variousamounts of protein. Six weeks of protein dep-
O8DY RETENTION OF PARENTERAL IRON$9
IN RATS ON DIETSWITH DIFFERENT PROTEIN
CONTENTS
so
DAYS
FIG. 7. Body retention of a parenteral dose of Fe'9
was measured twice weekly in rats given diets containingeither 27 per cent, 8 per cent, or no protein. The ani-mals were fed the special diets for two weeks before theywere injected with an intravenous dose of Fe-labeledplasma. Whole body radioactivity was measured in asmall animal liquid scintillation detector (ARAMAC)and by assay of the radioiron in stool collections (16).Protein depletion caused increased loss of parenteraliron from animals. Each point represents the mean fora group of 10 rats.
rivation caused a moderate anemia in the ratsreceiving an iron-replete diet. However, the redblood cells remained normochromic and normo-cytic. All iron-depleted diets produced a micro-cytic hypochromic anemia, and the anemia wasmost severe in the animals that were fed a pro-tein-depleted diet (Table 6).
TABLE 6. Hematologic data on rats fed various amounts of protein for six weeks
RBC HB HCT MCV MCH MCHC(106 CELLS/CMM) (G/100 ML) (%) (W3
) (/z/-G) (%)
28% Protein with iron 8.6 14.5 44 50 17 33Iron-depleted
8% Protein with ironIron-depleted
0% Protein with ironIron-depleted
8.1
7.26.9
5.14.9
10.5
11.69.7
8.26.7
32
3628
2421
40
4941
13 30
16 3414 29
49 16 3443 14 31
32
si.
1
1
1
1
0
1
;5
i�
l1

Summary
Iron deficiency is widespread among popula-tions consuming a protein-deficient diet, and itis found with greatest frequency in women dur-ing the childbearing years and in children dur-ing periods of maximal growth. These peoplefrequently have other nutritional problems suchas multiple deficiencies of the B vitamins.Among protein-starved humans the most im-portant nutritional factors causing iron deficien-cies are the low iron content of most protein-deficient diets and a lack of readily absorbedheme iron in the diet. Other factors that dimin-ish iron absorption in protein-deprived popula-tions are (1) histologic alterations of the smallintestinal mucosa, (2) a diminished corporealstimulus to absorb iron, (3) a decreased concen-tration of the amino acids in the diet that facili-tate iron absorption from the intestinal lumen,(4) chronic diarrhea, and (5) chronic infection.Iron deficiency is worsened in many of thesepeople because of a high incidence of hookworminfection and frequent pregnancies.
REFE
1. BADENOCH, J., and S. T. CALLENDER. Iron me-tabolism in steatorrhea; the use of radioactive ironin studies of absorption and utilization. Blood 9:123, 1954.
2. BENJAMIN, B. I., S. CORTELL, and M. E. CON-RAD. Bicarbonate induced iron complexes and ironabsorption; one effect of pancreatic secretions. Gas-troenterology 53: 389, 1967.
3. BEUTLER, E. V., V. F. FAIRBANKS, and J. L.FAHEY. Clinical Disorders of Iron Metabolism. NewYork, Grune & Stratton, 1963, p. 65.
4. BOTHWELL, T. H., and C. A. FINCH. Iron Me-tabolism. Boston, Little, Brown & Co., 1962, pp. 69and 311.
5. BRISE, H., and L. HALLBERG. Iron absorptionstudies. II. A method for comparative studies oniron absorption in man using two radioiron iso-topes. Acta Med Scand Suppl 376, 171: 7, 1962.
6. BROWN, E. B., JR., R. DUBACH, and C. V. MOORE.Studies in iron transportation and metabolism. XI.Critical analysis of mucosal block by large doses ofinorganic iron in human subjects. 1 Lab Clin Med52: 335, 1958.
Studies of starvation and protein depletion inexperimental animals showed ferrokinetic ab-normalities and diminished iron absorption. Thiswas not caused by a direct intraluminal effectof starch or sucrose diets on iron absorption. Theabnormality was attributed to retarded growthrate and diminished hemoglobin synthesis inthese animals. Protein-deprived animals seemedto attempt to re-establish and maintain a normalbody iron concentration by decreased absorptionand increased excretion of iron. Rats receivingan iron-replete, protein-deficient diet for pro-longed periods developed a normocytic normo-chromic anemia. A microcytic hypochromicanemia occurred only when iron was not addedto the protein-deficient food. The decreased ab-sorption of iron resulting from protein deple-tion was not accompanied by increased iron con-tent or concentration in the duodenal mucosa.However, in starved rats increased amounts ofdialyzable iron were shown to be incorporatedinto the duodenum from body stores and mayact to diminish the uptake of iron from thelumen of the gut into mucosal cells.
RENCES
7. CALLENDER, S. T., B. J. MALLETT, and M. D.SMITH. Absorption of haemoglobin iron. Brit /Haemat 3: 186, 1957.
8. CHARLEY, P. J., B. SARKAR, C. STITT, and P.
SALTMAN. The chelation of iron by sugars. BiochimBiophys Acta 69: 313, 1963.
9. COLWELL, E. J., J. D. WELSH, L. J. LEGTERS, andR. F. PROCTOR. Jejunal morphological characteristicsin South Vietnamese residents. ¡AMA 206: 2273,1968.
10. CONRAD, M. E., B. I. BENJAMIN, H. L. WIL-
LIAMS, and A. L. Foy. Human absorption of hemo-globin iron. Gastroenterology 53: 5, 1967.
11. CONRAD, M. E., A. L. Foy, H. L. WILLIAMS,
and W. H. KNOSPE. Effect of starvation and pro-tein depletion on ferrokinetics and iron absorption.Amer 1 Physiol 213: 557, 1967.
12. CONRAD, M. E., L. R. WEINTRAUB, and W. H.CROSBY. The role of the intestine in iron kinetics.1 Clin Invest 43: 963, 1964.
13. CORTELL, S., and M. E. CONRAD. The effectsof endotoxin on iron absorption. Amer J Physiol213: 43, 1967.
33

14. DAVIs, P. S., and D. J. DELLER. Prediction anddemonstration of iron chelating ability of sugars.Nature 212: 404, 1966.
15. FERGUSON, J. H., and A. G. KEATON. Studieson the diets of pregnant women in Mississippi; theingestion of clay and laundry starch. New Orleans
Med Surg 1 102: 460,1950.16. FORRESTER, R. H., M. E. CONRAD, JR. and
W. H. CROSBY. Measurement of total body iron5 9
in animals using whole body liquid scintillation de-tectors. Proc Soc Exp Biol Med 111: 115, 1962.
17. FoY, A. L., H. L. WILLIAMS, S. CORTELL, and
M. E. CONRAD. A modified procedure for the deter-mination of nonheme iron in tissue. Anal Biochem
18: 559, 1967.18. GARRETSON, F. D., and M. E. CONRAD. Starch
and iron absorption. Proc Soc Exp Biol Med 126:
304, 1967.19. GUBLER, C. J., G. E. CARTWRIGHT, and M. M.
WINTROBE. The anemia of infection. X. The effect
of infection on the absorption and storage of ironby the rat. J Biol Chem 184: 563, 1950.
20. HAHN, P. F., W. F. BALE, and G. H. WHIPPLE.
Effect of inflammation (turpentine abcess) on iron
absorption. Proc Soc Exp Biol Med 61: 405, 1946.21. HAHN, P. F., E. JONEs, R. C. LowE, G. R.
MENEELY, and W. PEACOCK. The relative absorption
and utilization of ferrous and ferric iron in anemiaas determined with the radioactive isotope. Amer1 Physiol 143: 191, 1945.
22. JACOBSON, L. O., and M. DOYLE. Erythropoie-sis. New York, Grune & Stratton, 1962, p. 1.
23. KROE, D., T. D. KINNEY, N. KAUFMAN, andJ. V. KLAVENS. The influence of amino acids on ironabsorption. Blood 21: 546, 1963.
24. LAYRISSE, M., J. D. COOK, C. MARTíNEz, M.ROCHE, I. N. KUHN, R. B. WALKER, and C. A.
FINCH. Food iron absorption; a comparison ofvegetable and animal foods. Blood 33: 430, 1969.
25. LAYRISSE, M., J. LINARES, and M. ROCHE. Ex-cess hemolysis in subjects with severe iron deficiency
anemia associated and nonassociated with hookworminfection. Blood 25: 73, 1965.
26. MOORE, C. V. The importance of nutritionalfactors in the pathogenesis of iron deficiency anemia.Scand / Clin Lab Invest 9:292, 1957.
27. MOORE, C. V. Iron metabolism and nutrition.Harvey Lect 55: 67, 1961.
28. MOORE, C. V., R. DUBACH, V. MINNICH, andH. K. ROBERTS. Absorption of ferrous and ferric
radioactive iron by human subjects and by dogs.¡ Clin Invest 23: 755, 1944.
29. PiRZio-BIROLI, G., T. H. BOTHWELL, and C. A.FINCH. Iron absorption. II. The absorption ofradioiron administered with a standard meal inman. 1 Lab Clin Med 51: 37, 1958.
30. SCHADE, S. G., R. J. COHEN, and M. E. CONRAD.Effect of hydrochloric acid on iron absorption. NewEng 1 Med 279: 672, 1968.
31. SCHADE, S. G., B. F. FELSHER, and M. E.CONRAD. An effect of intestinal motility on ironabsorption. Proc Soc Exp Biol Med 130: 757, 1969.
32. SOMERS, G. F. Relative oral toxicity of sometherapeutic iron preparations. Brit Med 1 2: 201,1947.
33. SPRINZ, H., R. SRIBHIBHADH, E. J. GANGAROSA,
C. BENYAJATI, D. KUNDEL, and S. HALSTEAD. Biopsyof small bowel of Thai people with special referenceto recovery from Asiatic cholera and an intestinalmalabsorption syndrome. Amer 1 Clin Path 38: 43,1962.
34. TROWELL, H. C. Dimorphic anemia; defi-ciency of iron associated with nutritional macrocyticanemia. Trans Roy Soc Trop Med Hyg 37: 19, 1943.
35. TURNBULL, A., F. CLETON, and C. A. FINCH.Iron absorption. IV. The absorption of hemoglobiniron. ¡ Clin Invest 41: 1897, 1962.
36. VAN HOEK, R., and M. E. CONRAD. Iron ab-sorption; measurement of ingested iron59 by a hu-man whole-body liquid scintillation counter. ¡ ClinInvest 40: 1153, 1961.
37. Vietnam: Nutrition Surrvey, October-Decem-ber 1959. Washington, D.C., [United States] Inter-departmental Committee on Nutrition for NationalDefense, 1960.
38. WALSH, R. J., 1. KALDOR, 1. BRADING, and E. P.GEORGE. The availability of iron in meat; some ex-periments with radioactive iron. Aust Ann Med4: 272, 1955.
39. WARSHAUER, S. E. Starch eaters anemia.Southern Med 1 59: 538, 1966.
40. WEINTRAUB, L. R., M. E. CONRAD, and W. H.CROSBY. Absorption of hemoglobin iron by the rat.Proc Soc Exp Biol Med 120: 840, 1965.
41. WEINTRAUB, L. R., M. B. WEINSTEIN, H.-J.HUSER, and S. RATAL. Absorption of hemoglobiniron; the role of heme-splitting substance in theintestinal mucosa. / Clin Invest 47: 531, 1968.
42. WORLD HEALTH ORGANIZATION, STUDY GROUP
ON ANEMIA. Summary of Data on Iron Intakes De-rived from Dietary Surveys. Geneva, 1958. (Work-ing Paper No. 10)
34

INTERSUBJECT AND INTRASUBJECT VARIATIONOF IRON ABSORPTION
James D. Cook
Measurements of iron absorption from thegastrointestinal tract have been a highly usefultool for studying the disorders of iron balance.The effectiveness of this tool, however, has beenlimited by the marked variations in absorptionthat have characterized measurements with pres-ent isotopic methods. In earlier reports, thisvariability was usually attributed to methodologicerrors in determining the activity retained in thebody. Tests were subsequently performed usingthe double isotope technique by comparing ab-sorption of Fe-5 and Fe5 9 administered as asingle dose. The differences noted by dual iso-tope counting of whole blood taken 14 days afteradministration were within a range of plus orminus 2 per cent, whereas absorption measure-ments among normal subjects typically rangefrom 1 to 50 per cent (5). Thus, it is apparentthat the explanation of variability in iron ab-sorption lies with the individual subject ratherthan with the method of assay.
It is important to examine variations in ironabsorption and the factors that give rise to themin order to find ways of reducing or eliminatingtheir effect and thereby improve the precisionof the tests now being used. Before consideringspecific factors, brief mention should be madeof the general nature of iron absorption data.The frequency distribution of large series ofmeasurements obtained under comparable con-ditions have shown a highly skewed distributionthat bears little resemblance to normality. Byapplying statistical methods based on assump-
tions of normal distribution, useful informationmay have been lost in the reports published todate. This loss of sensitivity in the analysis ofabsorption data can be avoided by transformingthe data to a scale that normalizes the frequencydistribution before applying classical methods ofstatistical analysis. It has been found that loga-rithmic transformation gives a distribution thatis remarkably close to normal and permits moresensitive evaluations to be made (5).
In turning now to specific causes of iron ab-sorption variation, it is useful to consider twomajor categories: intersubject variations, ordifferences among individuals, and intrasubjectvariations, or differences in the same subjectfrom day to day. Subject-to-subject variationscan be determined by subtracting the differencesin absorption of Fe55 and Fe59 administered tothe same subject on two successive days fromthe over-all variation in absorption among thetest group as a whole. Studies of this kind haveshown intersubject and intrasubject variabilityto be roughly equal in magnitude among normalsubjects. 1
Intrasubject differences represent an artifactof current isotopic methods that presumablyarises from differences in the gastrointestinalmotility or secretion at the time of dose admin-istration. A useful approach to minimizing theeffect of such variations is to administer theradioiron as a series of doses over a period of
1 J. D. Cook, M. Layrisse, and C. A. Finch, unpublishedobservations.
35

several days (2). This method is useful forstudies of inorganic iron, where the test dosecan be easily prepared and taken by the subject;it offers little advantage, however, when moredetailed preparation of the test dose is required,as in studies of dietary iron absorption. In thelatter case, better information can be obtainedby giving single doses to a larger number ofsubjects.
The importance of intersubject differences de-pends on the purpose for which the absorptionstudies are being performed. In certain cases,it is precisely these variations that are of interest,since iron absorption measurements provide asensitive index of an individual's iron require-ments. Women, for example, absorb more thantwice as much as men (6), reflecting differencesin iron requirements due to menstrual lossesand the demands of pregnancy and lactation.The iron balance of an entire population mayvary from one geographic region to another,presumably reflecting the type and level ofdietary iron supply. Thus, in studies from Eng-land, absorption of a 5 mg dose of ferroussulphate in normal subjects averages from 20to 30 per cent (1, 4, 8), whereas comparabledata for subjects living in the United States isof the order of 10 per cent (3, 9). A valuablefeature of iron absorption measurements, there-fore, is their ability to characterize the ironbalance of an individual.
Another important kind of iron absorptionstudy involves evaluating the availability of dif-ferent forms of administered iron. Here, subject-to-subject differences are an unwanted variablethat should be minimized in order to obtainoptimal sensitivity. When only two iron com-pounds are being assessed, a useful approach isto compare them both in the same subject bymeans of a double tracer technique. Whenmore than two compounds are being evaluated,however, it is important to eliminate possibledifferences in the over-all setting of the mucosaamong different groups of subjects. The mostsuitable approach here is to relate the absorptionof the test compound in each subject against astandard reference dose of inorganic iron (7).
I00 -
- 80-e
60-
40-'~~ 40 -S
*, 20 -
0 -
Fish Veal Inorganic ¡ron
a01
8:- e.
yI IT 1 fi
Fio. 1. Comparison of absorptionbiosynthetically tagged dietary iron
.0
Ratio food 1Inorganic iron
-1.0_
lo
' 0o
0-5' -.11
_
Y*
18
-I I
from two types of
An example of this model is shown in Figure 1.Mean absorption from two forms of biosyntheti-cally labeled dietary iron were roughly equal,whereas inorganic iron absorption revealed ap-preciable difference in the over-all level of ironabsorption in the two groups of test subjects.When these were unmasked by relating theabsorption of the food iron to the reference dose,highly significant differences in the availabilityof iron became apparent. Optimal sensitivity ofthe statistical comparison requires that the ratiosbe tested on the logarithmic scale.
In summary, the limitations in the precisionof present iron absorption techniques can be;explained in terms of day-to-day variations inthe same subject and individual variations amongdifferent subjects. In all types of studies, pre-cision can be improved by employing more ap-propriate methods of statistical analysis for theskewed distribution of iron absorption data, andalso by using sufficient numbers of subjects togive statistical validity to the results. Studieswith inorganic iron can be made more preciseby administering multiple test doses to reducedifferences between days. In studies of dietaryiron assimilation, it is important to relate meas-urements to a reference dose of inorganic ironso as to eliminate any variations in the mucosalsetting for iron that may exist among the differ-ent groups of test subjects.
36
REFERENCES
1. BANNERMAN, R. M., S. T. CALLENDER, R. M.HARDISTY, and R. S. SMITH. Iron absorption inthalassemia. Brit 1 Haemat 10: 490-495, 1964.
2. BRISE, H., and L. HALLBERG. Iron absorptionstudies. II. A method for comparative studies oniron absorption in man using two radioiron isotopes.Acta Med Scand Suppl 376, 171, 1962.
3. BROWN, E. B., R. DUBACH, and C. V. MOORE.Studies in iron transport and metabolism. XI. Criti-cal analysis of mucosal block by large doses of in-organic iron in human subjects. 1 Lab Clin Med52: 335-355, 1958.
4. CALLENDER, S. T., B. J. MALLETT, and M. D.SMITH. Absorption of haemoglobin iron. Brit ¡Haemat 3: 186-192, 1957.
5. COOK, J. D., M. LAYRISSE, and C. A. FINCH.The measurement of iron absorption. Blood 33:421-429, 1969.
6. KUHN, 1. N., M. LAYRISSE, M. ROCHE, C.MARTINEZ, and R. B. WALKER. Observations on themechanism of iron absorption. Amer ¡ Clin Nutr21: 1184-1188, 1968.
7. LAYRISSE, M., J. D. COOK, C. MARTíNEZ, M.ROCHE, 1. N. KUHN, R. B. WALKER, and C. A.FINCH. Food iron absorption; a comparison ofvegetable and animal foods. Blood 33: 430-443,1969.
8. SMITH, M. D., and 1. M. PANNACCIULLI. Ab-sorption of inorganic iron from graded doses; itssignificance in relation to iron absorption tests andthe mucosal block theory. Brit 1 Haemat 4: 428-434,1958.
9. TURNBULL, A., F. CLETON, and C. A. FINCH.Iron absorption. IV. The absorption of hemoglobiniron. 1 Clin Invest 41: 1897-1907, 1962.
37
IRON ABSORPTION FROM FOOD'
Miguel Layrisse
Most of the knowledge on iron absorption isbased on studies performed with radioiron inthe form of iron salts. Investigations of ironabsorption from food in which radioiron is bio-logically incorporated were first started in 1951with the pioneer work of Moore and Dubach(19). However, despite the importance of thissubject for nutrition, it has not been activelypursued since then. The large amount of radio-iron necessary for biological tagging and thetediousness of cultivating the necessary plantshave made progress very difficult. Only theabsorption of hemoglobin iron has been studiedin detail (2, 3, 6, 7, 9, 23).
Early contributions (3, 5, 17, 18, 19) haveshown in general that food iron of animal originis better absorbed than vegetable food iron, andthat absorption rates vary widely according tothe type of food and individual tested. In nor-mal subjects, the mean iron absorption fromanimal food ranges from 2 to 6 per cent in eggsto 11 per cent in chicken muscle and 9 to 13per cent in hemoglobin. Iron absorption fromvegetable food (spinach, mustard greens, swisschard, and beet greens) is shown to be generallylower than with animal food, but only a fewsamples of each food have been tested.
In 1964 the Department of Medicine andBotany of the University of Washington andthe Department of Physiopathology at IVIC inCaracas started a program to study iron ab-sorption with the staple foods consumed in
1 The studies performed in Venezuela were supportedin part by U.S. Public Health Service Grant No. Rol-HE-06507.
tropical and temperate zones. A summary ofthe results of the last five years' work, whichinvolved more than 500 subjects, will be pre-sented here. Some of these findings have beenthe subject of recent publications (8, 10, 12, 14,15), and the others, still in the process ofanalysis, are presented here as preliminaryinformation.
Any discussion of iron absorption from foodshould take into account that, besides the varia-tion among different individuals owing to thedegree of iron storage, there is an intrasubjectday-to-day variation that may be as high as 100per cent at different times. Some authors havefound a reduction in intrasubject variation withthe administration of multiple doses over aperiod of 10 days (1), whereas others have founda similar variation regardless of whether doseadministration was single or multiple (13).Methodological errors play a minor part in varia-tion; they are estimated to be of the order ofplus or minus 2 per cent. 2 This has beendemonstrated by determining iron absorption insubjects fed with either inorganic iron taggedwith Fe5` and Fe5 9, or corn from cultures inwhich Fe 55 was added to the nutrient and Fe5 9
injected into the stem. It is also important tomention that the skew distribution observed inthe absorption of an iron salt (8), which ischanged into a normal distribution by using thelogarithm of the percentage of absorption, isalso observed in the absorption of food iron.
2 J D. Cook, M. Layrisse, and C. A. Finch, unpublishedobservation.
38
1

This tas been clearly shown with foods such asblack beans and veal tested in a large numberof subjects. Accordingly, the mean absorptionand standard deviation of absorption from eachfood presented here is calculated from the loga-rithms of the percentage of absorption.
The results of 448 tests of six foods of vege-table origin and four foods of animal originare shown in Figure 1. This material includesabsorption tests already published (10, 14, 15)and new information collected in the last twoyears. For the most part, iron from vegetablefoods is poorly absorbed (soybean was theonly exception). The mean absorption, includ-ing normal and iron-deficient subjects, rangesfrom about 1 per cent in spinach to 5 per cent
in wheat, with intermediate values of 3 per centin corn and 4 per cent in black beans and let-tuce. Iron absorption from animal food rangedfrom 7 per cent in ferritin to 22 per cent in veal,with intermediate values of 11 per cent in fishand 12 per cent in hemoglobin. The mean ironabsorption from soybean was 11 per cent,which is close to the intermediate values observedin animal food. The mean absorption of eachfood, with the exception of veal, was lower thanthat reported in recent publications (14). Theselower figures may be accounted for in part bythe mathematical treatment of the data.
A comparison of iron absorption from eachfood, based on the three parameters used toestimate body iron stores in studies of this kind,
Food of vegetable origin Food of animal origin
Spinoch Bick beons Corn Lettuce Wheat Soybeon Ferritin F 4 eo Hlooi Totalmuscle m uscleDose of 2 mg 3-4 mg 2-4mg l-l.7mg 2-4mg 3-4rmg 3 mg 1-2 mg 3-4rg 3-4mqfood Fe
N' Cases 9 122 73 13 42 24 17 34 39 75 448
20
15
.0 E¡5_ E
QL~~~~1
i~ lr Li
u~
~ : I2 -
FIG 1. Findings on irorl absorption from foods; the result of a collaborative study conducted by the Department ofBotany and Medicine at the University of Washington, Seattle, and the Department of Physiopathology, IVIC,Caracas, Venezuela. The mean absorption and standard error is calculated from the logarithms of the percentageof absorption.
39

showed that there is a poor correlation betweenthe absorption of food iron and either serumiron concentration or percentage of transferrinsaturation. However, a significant correlationwas observed between absorption of food ironand inorganic iron. Accordingly, a ratio of foodiron and inorganic iron absorption could beused, instead of food iron absorption alone. Thismade it possible to compare differences inabsorption in the various foods independently ofvariations in individual iron stores. The meanratio was below 0.20 in black beans, spinach,and corn; from 0.20 to 0.29 in wheat and lettuce;from 0.30 to 0.39 in soybean and hemoglobin;0.52 in fish; and 0.97 in veal. On the basis ofthese results, the iron absorption from thesefoods may be predicted in a subject whose in-organic iron absorption is known. For example,a normal male with an absorption of 7 per centwill absorb less than 1 per cent from corn,spinach, or black beans; between 1 and 2 percent from lettuce or wheat; between 2 and 5per cent from fish, soybean, or hemoglobin,and about 8 per cent from veal muscle. In sub-jects with iron-deficiency anemia and diminishediron stores, inorganic iron absorption will be 50per cent and above in most cases, and, propor-tionally, the level of food iron absorption willbe at least two or three times as great.
Previous studies (10, 12) have shown thatabsorption of food iron (wheat, corn, and fer-ritin) is enhanced by ascorbic acid and markedlydepressed by desferrioxamine. The only twofoods studied so far that do not follow thispattern are hemoglobin (23), in which absorp-tion is not affected by reducing or chelatingagents, and soybean, whose absorption is notincreased with ascorbic acid (12). In view ofthe wide range of iron absorption levels amongdifferent subjects, which is more pronouncedthan the daily intrasubject variation, the ironabsorption from a single food given alone andcombined consecutively with ascorbic acid anddesferrioxamine was determined in each indi-vidual. The results showed that iron absorptionfrom veal muscle is not affected by these agents,whereas iron absorption from fish muscle is
markedly reduced by desferrioxamine and in-creased by ascorbic acid. These preliminaryresults may suggest that the myoglobin iron isstill attached to the porphyrin ring during theabsorption, as was already demonstrated withhemoglobin iron, and that fish iron goes by adifferent route.
The possible interacting effect of several foodsadministered in the same meal, as in the usualdiet, has also been studied. Experiments withanimal and vegetable foods mixed in a singlemeal (15) have shown that iron absorption fromveal is significantly lower when veal is combinedwith either black beans or corn than when it isgiven alone. Contrariwise, corn and black beansgive higher absorption levels when mixed withveal or fish than when administered alone.
Further studies have been conducted to findout whether the amino acids present in fishmuscle are responsible for the enhancement ofvegetable iron absorption in the same way thatsome amino acids affect the absorption of in-organic iron (11). In the first experiment, blackbeans were mixed with amino acids in the samenumber and proportion as those present in 100 gof fish. The resulting iron absorption levelwas more than double the figure obtained withblack beans alone. Further experiments showedthat the sulfur-containing amino acids-cysteineplus methionine, or cysteine alone-enhancevegetable iron absorption. However, there was nosignificant increase in absorption with the otheramino acids grouped according to their chemicalproperties (16).
Although there is no further information inthe literature concerning the interacting effecton iron absorption of foods administered in thesame meal, studies have been performed todetermine the effect of a single food or standardmeals on the absorption of tagged inorganiciron. The goal in most of these studies has beento investigate the possible benefit of feeding apopulation with staple foods enriched with in-organic iron. They have shown that either asingle food, such as wheat (4, 22), or a standardmeal (20, 21) result in a much lower inorganiciron absorption level than that of iron given
40

alone. Absorption is improved when ascorbic
acid is administered with the meal (4, 20). In
connection with this point, the two groups of
the University of Washington and IVIC have
found that inorganic iron absorption is markedly
reduced when the iron is combined with either
soybean or corn, but it is not affected when
administered with veal muscle.
The information presented in this paper cen-
ters around two aspects of iron metabolism that
are of great importance in public health: namely,
absorbability of iron from diet, and absorbability
of iron supplementing the diet. The studies of
iron absorption from food have shown how poor
some of the national staples really are. This is
the case with corn, for example, which is con-
sumed as a large part of the diet throughout
Central America. The findings also indicate that
food of animal origin is important not only for
its high rate of iron absorbability but also for
its effect on vegetable iron absorption. The
great difference between vegetable and animal
food may explain why the prevalence of iron-
deficiency anemia (in the absence of blood loss)
is less frequent in temperate zones than in tropi-
cal areas; even though iron intake in the latter
is higher, most of it comes from vegetable
sources.Studies on the absorption of inorganic iron
administered with a single food or with a diet
show variations according to the accompanying
food. Thus it may be concluded that food iron
fortification programs should first be evaluated
by isotopic methods in a pilot study using a
sample of the population in question and expos-
ing them to the same environmental conditions.
REFERENCES
1. BRISE, H., and L. HALLBERG. Iron absorptionstudies. 11. A method for comparative studies oniron absorption in man using two radioiron iso-topes. Acta Med Scand Suppl 376, 171: 7-22, 1962.
2. BROWN, E. B., Y. F. HWANG, S. NICOL, and
J. TERNEERG. Absorption of radioiron-labeled hemrno-globin by dogs. J Lab Clin Med 72:58-64, 1968.
3. CALLENDER, S. T., B. J. MALLETT, and M. D.SMITH. Absorption of hemoglobin iron. BritHaemat 3: 186-192, 1957.
4. CALLENDER, S. T., and G. T. WARNER. Iron
absorption from bread. Amer 1 Clin Nutr 21: 1170-1174, 1968.
5. CHODOS, R. B., J. F. Ross, L. APT, M. POLLY-
COVE, and J. A. E. HALKETT. The absorption of
radioiron labelled foods and iron salts in normaland iron deficient subjects and in idiopathic hemo-chromatosis. 1 Clin Invest 36: 314-326, 1957.
6. CONRAD, M. E., B. 1. BENJAMIN, H. L. WIL-
LIAMS, and A. L. FoY. Human absorption of hemo-globin iron. Gastroenterology 53: 5-10, 1967.
7. CONRAD, M. E., R. WEINTRAUB, D. A. SEARS,
and W. H. CRO5sBY. Absorption of hemoglobin iron.
Amer I Physiol 211: 1123-1130, 1966.8. COOK, J. D., M. LAYRISSE, and C. A. FINCH.
The measurement of iron -absorption. Blood 33:
421-429, 1969.9. HALLBERG, L., and L. SOLVELL. Absorption of
hemoglobin iron in man. Proceedings, X Congressof the International Society oj Hematology (Stock-holm) F. 5.
10. HUSSAIN, R., R. B. WALKER, M. LAYRISSE, P.
CLARK, and C. A. FINCH. Nutritive values of food
iron. Amer I Clin Nutr 16: 464-471, 1965.11. KROE, D., T. D. KINNEY, N. KAUFMAN, and
J. V. KLAVENS. The influence of amino acids on ironabsorption. Blood 21: 546-552, 1963.
12. KUHN, 1. N., M. LAYRISSE, M. ROCHE, C. MAR-
TíNEZ, and R. B. WALKER. Observations on themechanism of iron absorption. Amer 1 Clin Nutr21: 1184-1188,1968.
13. KUHN, 1. N., E. R. MONSEN, J. D. CooK, and
C. A. FINCH. Iron absorption in man. 1 Lab ClinMed 71: 715-721, 1968.
14. LAYRISSE, M., J. D. COOK, C. MARTíNEZ, M.ROCHE, 1. N. KUHN, and C. A. FINCH. Food iron
absorption; a comparison of vegetable and animalfoods. Blood 33: 430-443, 1969.
15. LAYRISSE, M., C. MARTíNEZ-ToRRES, and M.
ROCHE. The effect of interaction of various foodson iron absorption. Amer 1 Clin Nutr 21: 1175-1183,1968.
16. MARTINEZ-TORRES, C., and M. LAYRISSE. Effect
of amino acids on iron absorption from black beans.In preparation.
17. MOORE, C. V. Iron nutrition. In F. Gross
(ed.), Iron Metabolism; an International Sympo-sium, Berlin, Springer-Verlag, 1964, pp. 241-265.
18. MOORE, C. V. Iron nutrition and require-ments. In "Iron Metabolism," Series Haematologica,vol. 6, supplement to Scand 1 Haemat, 1965, PP.1-14.
41

19. MooRE, C. V., and R. DUBACH. Observationon the absorption of iron from food tagged withradioiron. Trans Ass Amer Physicians 64: 245-256,1951.
20. PIRZIO-BIROLI, G., T. H. BOTHWELL, and C. A.FINCH. Iron absorption. II. The absorption of radio-
iron administered with a standard meal in man.
I Lab Clin Med 51: 37-48, 1958.
21. SCHULTZ, J., and N. J. SMITH. A quantitativestudy of the absorption of iron salts in infants andchildren. Amer ¡ Dis Child 95: 120-125, 1958.
22. STEINKAMP, R., R. DUBACH, and C. V. MOORE.Absorption of radioiron from iron-enriched bread.Arch Intern Med 95: 181-183, 1955.
23. TURNBULL, A., F. CLETON, and C. A. FINCH.Iron absorption. IV. Anbsorption of hemnioglobin iron.1 Clin Invest 41: 1897-1907, 1962.
42
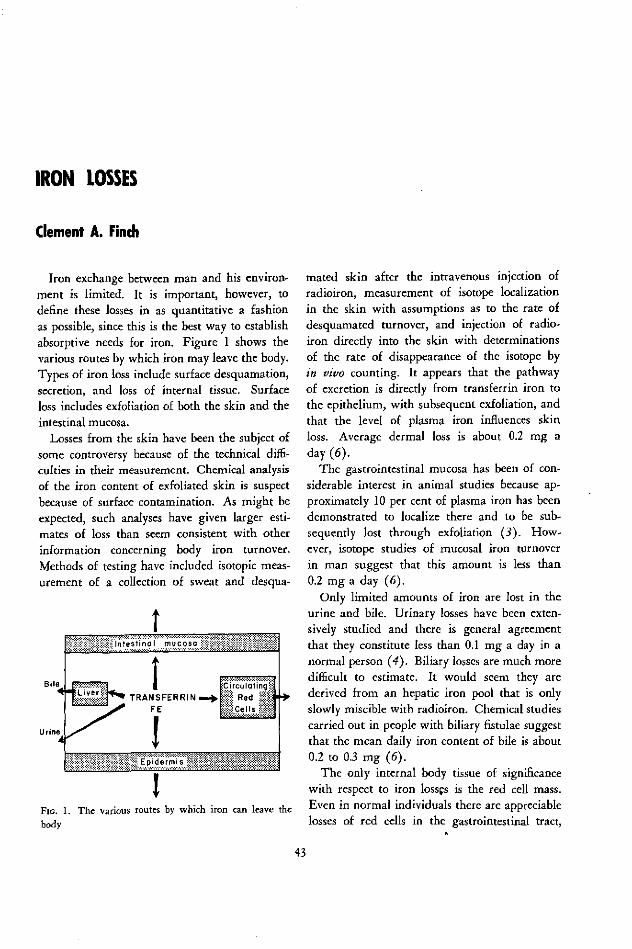
IRON LOSSES
Clement A. Finch
Iron exchange between man and his environ-ment is limited. It is important, however, todefine these losses in as quantitative a fashionas possible, since this is the best way to establishabsorptive needs for iron. Figure 1 shows thevarious routes by which iron may leave the body.Types of iron loss include surface desquamation,secretion, and loss of internal tissue. Surfaceloss includes exfoliation of both the skin and theintestinal mucosa.
Losses from the skin have been the subject ofsome controversy because of the technical diffi-culties in their measurement. Chemical analysisof the iron content of exfoliated skin is suspectbecause of surface contamination. As might beexpected, such analyses have given larger esti-mates of loss than seem consistent with otherinformation concerning body iron turnover.Methods of testing have included isotopic meas-urement of a collection of sweat and desqua-
1tinal m u coso
FIG. 1. The various routes by which iron can leave thebody
mated skin after the intravenous injection ofradioiron, measurement of isotope localizationin the skin with assumptions as to the rate ofdesquamated turnover, and injection of radio-iron directly into the skin with determinationsof the rate of disappearance of the isotope byin vivo counting. It appears that the pathwayof excretion is directly from transferrin iron tothe epithelium, with subsequent exfoliation, andthat the level of plasma iron influences skinloss. Average dermal loss is about 0.2 mg aday (6).
The gastrointestinal mucosa has been of con-siderable interest in animal studies because ap-proximately 10 per cent of plasma iron has beendemonstrated to localize there and to be sub-sequently lost through exfoliation (3). How-ever, isotope studies of mucosal iron turnoverin man suggest that this amount is less than0.2 mg a day (6).
Only limited amounts of iron are lost in theurine and bile. Urinary losses have been exten-sively studied and there is general agreementthat they constitute less than 0.1 mg a day in anormal person (4). Biliary losses are much moredifficult to estimate. It would seem they arederived from an hepatic iron pool that is onlyslowly miscible with radioiron. Chemical studiescarried out in people with biliary fistulae suggestthat the mean daily iron content of bile is about0.2 to 0.3 mg (6).
The only internal body tissue of significancewith respect to iron lossCs is the red cell mass.Even in normal individuals there are appreciablelosses of red cells in the gastrointestinal tract,
43

and this "physiologic" bleeding from the guthas been estimated at 0.35 mg a day (6). Tothis might be added the day-to-day losses ofblood that may occur from trauma to the bodyexterior. All these individually estimated ironlosses in the adult male are summarized inTable i.
There are obvious difficulties in estimatingiron losses in such a piecemeal manner. It wouldseem more accurate to measure the turnoverof body iron in man by isotopic methods. Thereare two general approaches to this; one involvestotal body counting and the other involves themeasurement of the specific activity of the circu-lating red cells.
In the first technique, Fe5 9 must be used topermit external counting. This method has ob-vious drawbacks, since the isotope's relativelyshort half-life of 45 days limits body loss meas-urement to about a year. Moreover, assump-tions have to be made concerning the degree ofmixing of body iron with the isotope injected.
The second method involves the intravenousinjection of Fe55, an isotope with a half-life ofthree years (5). The specific activity of the redcells is then measured over a period of severalyears. Approximately 90 per cent of the injectediron is found in the circulating red cell mass at90 days; thereafter, the level of circulating activ-ity declines. This occurs more rapidly duringthe first year, presumably because of some dilu-tion in body stores. In subsequent years thelevel of circulating activity falls at an exponentialrate. In the interpretation of this late curve,certain assumptions must be made. Total bodyiron must be constant over the period of study,and the total miscible pool must be estimated.
TABLE 1. Estimated iron losses in the adult 70 kg male(mg/day)
Total 0.93
GastrointestinalBloodMucosalBiliary
UrinarySkin
0.350.100.200.080.20
With these assumptions in mind, total dailybody iron turnover has been calculated in theadult male to be 0.95 mg, or 13 ,ag per kilogramof body weight, in subjects studied in Seattle,Caracas, and Durban (6). These figures are ingood agreement with the tabulation of theindividual losses previously discussed.
The information concerning iron losses in thenormal adult male may be considered highlyprecise. Iron losses in the adult female are lessconsistent owing to the variability of menstrualblood loss. Figure 2 shows the results of meas-urements by Hallberg et al. (7) of losses in-curred by menstruating and pregnant females.The mean daily menstrual loss is 0.5 mg, but5 per cent of the women go up to more than1.4 mg. Pregnancy losses are also highly sig-nificant, with a mean daily loss of 2.5 mg, andan even greater requirement during the lastmonths (1).
Virtually nothing is known about iron lossesin infancy. It is apparent, however, that appre-ciable requirements result from rapid growth ofthe child and expansion of his body tissues. Forevery kilogram of lean body weight producedthere is an iron requirement of approximately35 mg. Isotope labeling of the fetus in uteropermits measurement after birth of the dilutionof the body iron pool by absorbed iron (10).
In addition to physiologic losses of iron, thenumerous mechanisms by which pathologic ironloss occurs must be taken into account as well.These relate to the red cell mass and usually tobleeding. In most instances, bleeding occursfrom the gastrointestinal tract, and in terms ofits global significance hookworm infestation rep-resents the leading cause. The outstandingstudies of Roche and Layrisse (8) have identifiedmany aspects of hookworm blood loss. Theyhave demonstrated a daily iron loss per wormof 0.03 mg for Necator americanus, 0.05 mgfor Ancylostoma caninum, and 0.15 mng forAncylostoma duodenale. Iron may also be lostby infestation of other intestinal or blood-suckinginsects, by pathology of the gastrointestinal tract,by uterine bleeding in the female-to mnentiona few of the more common ways. A single blood
44

TABLE 2. Iron balance data on three population groups
INCIDENCE OFLOSSES STORES IRON-DEFICIENCY
(MG/D) (MG) ANEMIA
(%)
Males 0.9 1,000 < 5Menstruating females 1.5 400 5-10Pregnant females 2.5 200 20-30
donation requires an increased daily iron absorp-tion of 0.6 mg for one year to replace theamount removed. Unusual causes of iron de-ficiency include hemosiderinuria (9) and intra-pulmonary bleeding (2).
The significance of physiologic iron losses isonly apparent when matched against iron avail-able in the diet. Since iron absorption anddietary iron are discussed elsewhere, this directcomparison will not be made. Table 2 points tothe significance of physiologic iron losses in
1. AMERICAN MEDICAL ASSOCIATION, COMMITTEE
ON IRON DEFICIENCY. Iron deficiency in the UnitedStates. ]AMA 203: 407-412, 1968.
2. APT, L., M. POLLYCOVE, and J. F. Ross. Idio-
pathic pulmonary hemosiderosis; a study of the ane-mia and iron distribution using radioiron and radio-chromium. 1 Clin lnvest 36: 1150-1159, 1957.
3. CONRAD, M. E., L. R. WEINTRAUB, W. H.CROSBY, B. MERRIL, and A. Foy. The role of theintestine in iron kinetics. 1 Clin lnvest 43: 963-974,1964.
4. DAGG, J. H., J. A. SMITH, and A. GOLDBERG.Urinary excretion of iron. Clin Sci 30: 495-503,1966.
5. FINCH, C. A. Body iron exchange in man. 1Clin Invest 38: 392-396, 1959.
6. GREEN, R., R. CHARLTON, H. SEFTEL, T. BOTH-
WELL, F. MAYET, B. ADAMS, C. FINCH, and M. LAY-
another way-by relating them to iron storesand to the incidence of iron-deficiency anemia.Iron stores portray the result of balance betweenabsorption and loss. The incidence of iron-deficiency anemia indicates the state of iron bal-ance in the population at large. In the man,iron balance appears satisfactory in that iron
stores are ample for any foresecable needs, in-cluding blood donation, and iron deficiency is
limited to pathologic bleeding and rare instances
of malabsorption. The requirement of the men-struating female compromises her iron stores
and is associated with an incidence of 5 to 10per cent of iron-deficiency anemia. In pregnancy,
a negative iron balance is inevitable. These dataindicate that the physiologic losses of about 1
mg in the male are of no consequence but thatlosses of 2 or more mg a day in the menstruating
or pregnant female are almost certain to create
a negative iron balance.
REFERENCES
RISSE. Body iron excretion in man; a collaborativestudy. Amer 1 Med 45: 336-353, 1968.
7. HALLBERG, L., A. M. HOGDAHL, L. NILSSON, andG. RYBO. Menstrual blood loss, a population study;variation at different ages and attempts to definenormality. Acta Obstet Gynec Scand 45: 320-351,1966.
8. ROCHE, M., and M. LAYRISSE. The nature andcauses of "hookworm anemia." Amer 1 Trop Med15: 1031-1102, 1966.
9. SEARS, D. A., P. R. ANDERSON, A. L. FoY, H. L.WILLIAMS, and W. H. CROSBY. Urinary iron excre-tion and renal metabolism of hemoglobin in hemo-lytic diseases. Blood 28: 708-725, 1966.
10. SMITH, C. A., R. B. CHERRY, C. J. MALETSKOS,
J. GIBSON, II, C. ROBY, W. CATON, and D. REID.Persistence and utilization of maternal iron for bloodformation during infancy. 1 Clin Invest 34: 1391-1402, 1955.
45

GENERAL DISCUSSIONModerator: We have heard about the basic
aspects of iron deficiency, and we will now takea few minutes for a discussion of the sessionso far. A question has been raised about the roleof erythropoietin in iron absorption, which Dr.Crosby will answer.
Dr. Crosby: Erythropoietin does play a rolein iron absorption, but probably it is entirelyindirect. By stimulating the requirement forhemoglobin iron, it establishes a state of irondeficiency, and this then is reflected in alterediron absorption by the intestine. Erythropoietinitself probably does not cause any change in thebehavior of the intestine.
Dr. Cohen: There have been reports in theliterature on the relative turnover rates of thevarious iron compounds; viz., the cytochromes,hemoglobin, myoglobin, and the peroxidases.From the standpoint of iron deficiency, it iscrucial to know where the rate-limiting con-centration will have its greatest impact. Ifcytochromes have high turnover rates and thereis only a limited amount of iron available, avery serious problem could exist, obviously, forcell function. What is the current state ofknowledge on the relative rates at which thedifferent iron pools turn over? Does cytochrometurn over more rapidly than hemoglobin, myo-globin, or the other iron heme compounds?
Dr. Finch: Since the hemoglobin cycle is sooverwhelming from a quantitative standpoint, itis very difficult in the kinetic studies to see thechanges in the rates of these other pools. Thereis some evidence clinically that the erythroidmarrow is the most avid tissue in taking upiron, and even at extremely low plasma levelsthe erythron does better than other tissues. Instates of very low plasma iron, other tissues maywell suffer. There have been findings such asspoon nails and certain red cell and tissueenzyme measurements showing decreases. Thefunctional significance of such changes is farfrom clear.
Dr. Crosby: I suspect there is one organwhose individuality exceeds even that of the
erythroblast-the placenta. A child can beborn with a normal complement of iron froma woman who is iron deficient.
Dr. Waterlow: I would like to ask a ques-tion and to show a couple of slides. As severalspeakers have said and will say, infantile anemiais a tremendously important problem throughoutthe area. Failure to absorb iron may be one ofthe causal factors. Therefore in Jamaica, incollaboration with Dr. Paul Milner and Dr. AnnAshworth, we have made measurements in in-fants of the absorption of iron from labeled foodssupplied by Dr. Finch.
Figure 1 shows the absorption of corn ironcompared with that of ferrous ascorbate. Thecorn iron was very poorly absorbed-on theaverage only 2.5 per cent, compared with 28per cent from ascorbate. Three measurementswere made on each patient, either two withcorn and one with ascorbate, or vice versa.The point I want to emphasize is the variabilityof repeat measurements-a point on which manyauthors working withcommented.
PI; i.11
E%EWH
W'Hb 94
/.Saf1
60-
*,40-2o
20-
16 11
87 95
10.8 3
GO1 (-
5
99
©
iron absorption have
13
95
©3
12
87
12J
®9
10
98
11.5
5
;0
means :-Corn -2.5%/ron ascorbate -28 %
GW TD ML MC DC LL NS MS
FIG. 1. Absorption of corn iron
of ferrous ascorbate
a96
11.3
17
D5
compared with that
46

We observed that children who happento have a fever at or near the time of the testabsorb very poorly. Figure 2 shows some meas-urements of iron absorption in relation to bodytemperature. Fever seems to depress the absorp-tion almost to nothing. I want to stress that achild doesn't have to be clinically ill to show thiseffect. In one case we picked up an undetectedsubclinical infection because the child failed toabsorb iron. This effect of even a mild infec-tion may be one of the causes of the variabilitymentioned above, and it may in practice be animportant cause of poor iron absorption bypeople in tropical countries.
The question I want to pose is, what is themechanism of this effect?
Moderator: Do you say it is the fever thatcauses poor absorption, or just the infection?
Dr. Waterlow: All we know is that thereis a rise of temperature. Usually we can find nocause for the infection. Sometimes these effectsare produced simply by routine immunization.
Colonel Conrad: If you inject endotoxin intoan animal, it will immediately have a markeddiminution in its capability to absorb iron.Unlike most known factors, which take severaldays to affect iron absorption, endotoxin pro-duces a significant effect within one hour after
A., D.OcL. E.C. O.T. C.D.
e40.iL . .. _ ;
FIG. 2. Effect of pyrexia on iron absorption
injection. The animal does not die, but itappears slightly lethargic. This is similar to theresults reported with injections of turpentine.I believe experiments with endotoxin are moredefinitive. If you studied your febrile childrenyou would find their serum iron concentrationwas quite low in comparison to measurementsat the time they were absorbing iron in normalquantities.
Dr. Moore: Dr. Crosby, what do you thinkhappens to the mechanism controlling intestinalabsorption when it seems to break down? Forinstance, in pyridoxine-deficient animals, Dr.Wintrobe and his associates have demonstratedincreased absorption, even though these animalshave some degree of iron overload. In individ-uals with ineffective erythropoiesis, it has beendemonstrated that iron overload develops in partbecause increased amounts of iron are absorbed.The same thing must happen with hemochroma-tosis. Persons who develop iron overload as aresult of drinking wine, or as a result of eitherpancreatic or hepatic disease, also seem toabsorb increased amounts of iron even in thepresence of the overload.
Dr. Crosby: The very nature of your ques-tion helps me to answer it. In posing a ques-tion with so many facets, you indicate that theproblem is a complex one. In my presentationI stated that the control of iron balance appearsto reside in a complicated system for keepingiron out of the body, and I simplified it intofour steps, but there may actually be more. Ina complicated system for doing anything, dis-ruption can occur in many places. For thisreason, in the present instance, I suspect that thedisorders that permit unneeded iron to comeinto the body are numerous and varied. Thereis some support for this in the rather largenumber of hereditary disorders that are clini-cally identifiable as different; in all of these,the syndrome which we might call hemochroma-tosis does occur.
Dr. Caldeyro-Barcia: I would like to knowwhether the increased iron needs in pregnantwomen are entirely due to the iron that isbeing transferred to the fetus, or if the maternal
47

needs for her own metabolism are increased.Also, I would like to know whether theplacental transfer from mother to fetus is ac-complished by simple diffusion or facilitateddiffusion, or whether it is an active transfer.
Dr. Moore: There is probably an increasedrequirement during pregnancy, caused by thedemands of the fetus and by the sizable increasein circulating red cell mass that occurs duringthe second half of this period. As I will pointout shortly in my paper, however, the ironthat goes into the increased circulating red cellmass is largely conserved by the mother andreturned to her body economy when the preg-nancy is terminated. I cannot answer the ques-tion about the mechanism of iron transfer acrossthe placenta. Dr. Elmer Brown in our depart-ment tried very hard to find evidence for anactive transfer system, but he was not able todo so. Dr. Finch has also worked on thisproblem. Perhaps he can supply additionalinformation.
Dr. Finch: I can comment that there are cer-tainly large amounts of iron going across theplacenta, in spite of marked deficiency on thepart of the mother. Fetal plasma does not goback across the placenta. It is a one-way street,and an extremely effective one, able to competesuccessfully with all maternal needs for iron.
Moderator: I have a small comment to makein regard to Dr. Conrad's statement that theiron content of the diet is usually low whenthe protein content is low. The fact is thatin our hemisphere this is not necessarily true.In most of the Latin American countries, theiron content of diet is quite high. In Venezuela,for example, it is of the order of 25 to 50 mgper day. In spite of the high intake in our coun-tries, iron-deficiency anemia is widespread, sothere must be difficulty with absorption, evenmore so than in Asia.
Dr. Cohen: I would like to go back to thequestion of the dynamics of the system. Ob-viously, one tends to focus on hemoglobin,because it represents the largest mass of iron,and also because it is relatively easy to get at.However, in consideration of the dynamic steady
state, we recognize that the distribution of ironto the different pools is going to be, within cer-tain limits, a function of the concentration oftransferrin iron, or whatever pool is rate-limit-ing. The avidity factor that has been alludedto in the erythropoietic system is very illumi-nlating. WVe know that there is consider ablereserve capacity of the circulating hemoglobinconcentration from the standpoint of oxygentransport and buffering. Thus, there should besome recognition of the fact that in this steadystate process there are iron compounds of farmore critical significance to cell function thanthe mere transport of oxygen or the bufferingof the blood.
The pool size of hemoglobin is at leasttwo orders of magnitude greater than perhapsthat of the cytochromes or other systems whichmay be rate-limiting. I am suggesting, there-fore, that within a fairly small range of hemo-globin change there might be much largerchanges in specific iron compounds that arecrucial, particularly for the fetus during preg-nancy, or in certain pathologic states. I feelthat these important areas, though much moredifficult to get at, warrant thorough study.
Dr. Gandra: I should like to hear from Dr.Layrisse something about the common causesfor impairment of iron absorption that mightbe present in black beans and spinach, such asphytates and oxalates.
Dr. Layrisse: Black beans and corn probablycontain a large amount of phosphate and phy-tate, which could partially block the iron presentin these seeds. However, we do not know yetif this is the case, or whether there are otherchelating agents in these foods.
Moderator: Do we have any idea of thechemical state of the iron in these foods?
Dr. Layrisse: No.Dr. Waterlow: Perhaps we should call on
the physical chemists. Obviously, standardchemical analysis is not going to tell us muchabout the state of iron in vegetables. WouldDr. Harrison have anything to add?
Dr. Harrison: Unfortunately, for X-ray anal-ysis, you have to crystallize your material first.
48

Dr. Cohen: I would like to ask Dr. Harrisonwhether the ligands or chelates that are formedbetween ascorbate and iron can be formed withboth the divalent and trivalent forms of iron.
Dr. Harrison: I don t know specifically in re-lation to ascorbate.
Colonel Conrad: The compound formed withferric iron and ascorbate is totally different fromthat formed with ferrous iron and ascorbate. Ithas different solubility characteristics, differentcharacteristics by infrared spectroscopy, and adifferent chemical composition. On theoreticalgrounds, the complex formed by ferric iron and
ascorbate is probably more available for absorp-
tion than the ferrous ascorbate complex. Theferric iron probably becomes ferrous iron when
it combines with the ascorbate. However, it
forms a tighter complex, which remains solubleover a much wider range of pH.
Dr. Caldeyro-Barcia: It has recently been re-ported that when the interval between twosuccessive pregnancies is very short (less than12 months between births) the second newbornhas a lower birth weight and poorer motor andpsychological performances later in life thanbabies from comparable groups in which theinterval between pregnancies has been longer.I wonder if the question of iron deficiency maybe related to this problem.
Moderator: I don't know whether anybodycan answer that.
It appears not.If there are no further comments, I think we
will go on with the program and ask Dr. Mooreto speak to us on human iron requirements.
49

HUMAN IRON REQUIREMENTS
Carl V. Moore
Nutritional requirements for iron are deter-mined by the amount lost from the body, theamount needed to support growth and preg-nancy, and the efficiency with which food ironis absorbed from the intestinal tract. Efforts todefine requirements have brought out the fol-lowing facts: (1) information about iron lossesand iron absorption from whole diets is in-complete; (2) variations among people, deter-mined by factors such as body size and differ-ences in menstrual loss, cover a relatively broadrange; and (3) needs during infancy andpregnancy have probably been underestimated(5, 21, 23). Recent studies of the kind alreadysummarized by previous speakers at the presentsymposium have focused on these problemsand have added sufficient data so that intelligentestimates of iron requirements can now be made.
Requirements can be stated in one of twoways. The first takes into account differencesamong people and states the estimates as arange. The second approach, often preferredby public health workers, states requirementsin terms that are broad enough to meet theneeds of a large segment-often 90 or 95per cent-of any given population.
Iron needed for excretion, pregnancy,and growth
The best and most recent measurements ofobligatory loss of body iron by adult male sub-
1 The investigations by the author and his associatesdescribed in this presentation were supported in part byU.S. Public Health Service Research Grant No. H-22from the National Heart Institute.
jects (Table 1) indicate a daily excretion rateof 0.5 to 1.63 mg; mean values for three groupsof subjects varied from 0.95 to 1.02 mg (8).A total of 41 subjects, from Seattle, Venezuela,and South Africa (Indian men), was includedin the group. A breakdown of the data indi-cated that about 0.1 mg of the gastrointestinalloss occurred through desquamated mucosalcells and about 0.4 mg through blood; biledelivered to the small intestine each day con-tained about 0.26 mg, but there was no way todetermine how much of this amount was reab-sorbed. The daily iron content of urine wasonly about 0.1 mg. The estimated daily ironloss from skin at normal transferrin saturationswas between 0.2 and 0.3 mg, but this figurecould rise to as much as 0.6 or 0.7 mg whentransferrin saturation was high. It was postu-lated that the values for iron-deficient subjectswould be about half these figures. In twogroups of Bantu subjects with high iron stores,the total body iron loss was as high as 4.4 mg aday, with mean values of 2 and 2.4 mrg. No
TABLE 1. Iron required to replace physiological losses andto support growth and pregnancy (mg/day)
AVERAGE RANGE
Loss in feces, urine,and sweat 0.9-1.0 0.5 -1.6
Menstrual loss 0.5 0.1 -1.4Pregnancy 2.4 1.68-3.75Growth (average)
Males 0.5 0.3 -0.7Females 0.37 0.3 -0.45
50
a·

r
FiG. 1. Distribution of menstrual blood loss in a popu-lation sample of womrnen living in Goteborg, Sweden.
Loss in ml of blood is indicated along the horizontal
scale; number of subjects along the vertical scale. Repro-duced from Hallberg et al. (9).
similar data are available for children. In non-
menstruating women, the figures were 0.64±
0.05 mg (4).The most extensive studies of menstrual blood
flow indicate that the loss is fairly constant
from month to month in the individual woman
but varies widely from one subject to the next
(9). It may be as small as 10 ml a month,
but may be greater than 60 ml a month in 15 to
25 per cent of a presumed normal population.
The mean loss in a group of Swedish women
was found to be 43.4 - 2.3 ml a month, or
about 0.5 mg a day (Figure 1). In 95 per cent
of the women studied, menstrual loss was found
to be less than 1.4 mg a day. Consequently,
the range of iron needed to compensate for
menstrual blood loss in healthy women extends
from as little as 0.1 to as much as 1.4 mg a day.
The amount of iron necessary to compensate
for losses sustained through pregnancy is rela-
tively large and varies widely (Table 2 and
5, 21, 23). The average obligatory excretion ofbody iron has conservatively been estimated at
170 mg, with a range of 150 to 200 mg. The
iron contained in the fetus varies from about
200 to 370 mg, with an average of about 270 mg,
while that contained in the placenta and cord
varies from about 30 to 170 mg, with an average
of roughly 90 mg. Blood lost at delivery has
been estimated to contain 90 to 310 mg, or an
average of 150 mg. These are quantities actually
lost from the body; they vary from 470 to
TABLE 2. Iron required for pregnancy (mg)
AVERAGE RANGE
External iron loss 170 150-200Fetal iron 270 200-370Iron in placenta and cord 90 30-170Blood loss at delivery 150 90-310(Expansion of red blood
cell mass 450 200-600)*Total requirement * 680 470-1050Av. requirement per day * 2.4 1.68-3.75
Expansion of red cell mass not included.
1050 mg, with an average of 680 mg. Statedin terms of daily losses, they range from 1.68 to3.75 mg, with an average of 2.4 mg. Thisfigure does not include the 200 to 600 mg re-quired for the expanded red blood cell masswhich develops late in pregnancy, because thatiron is largely conserved when the erythrocytemass returns to normal after delivery. Lacta-tion after delivery produces additional ironlosses of approximately 0.5 to 1 mg a day, butthat amount is usually balanced by the absenceof menstruation during the period in question.
The iron required for growth varies with therate of growth and the body weight to be eventu-ally attained at adult stature. The fully grownman has approximately 50 mg of iron for eachkilogram of body weight; the adult woman,about 35 mg (5). Thus, a man who stops grow-ing when he reaches an adult weight of 50 kg
above his birth weight will normally have as-similated 2500 mg. Spread over the 20 yearsthat males take to reach adult stature, this figureamounts to 125 mg a year, or about 0.35 mg aday (Table 1). A large man who ends up weigh-ing 100 kg above his birth weight would requiretwice as much iron-250 mg a year or 0.7 mg aday. Similar figures for human females, basedon the assumptions that growth is completedby the age of 15 years and that normal adultweight varies from 45 to 70 kg above birthweight, would be 100 to 160 mg a year, or 0.3to 0.45 mg a day. These average values wouldvary from year to year depending on growthspurts. During the first year of life, for instance,
51

TABLE 3. Estimated iron needs and dietary requirements
iRON NEEDED (MG/DAY)
FECES, DIETARY IRON
URINE, MENSES PREGNANCY GROWTH TOTAL REQUIREMENTS
DERMAL (MG/DAY)
Men, nonmenstruating women 0.5-1.6 0.5 -1.6 5-16Menstruating women 0.5-1.6 0.1-1.4 0.6 -3.0 6-30Pregnancy 1.7-3.75 1.7 -3.75 17-37.5Adolescent boys 0.5-1.6 0.35-0.7 0.85-2.3 8.5-23
girls 0.5-1.6 0.1-1.4 0.3 -0.45 0.9 -3.45 9-34.5Children (average) ?0.1-0.8 0.3 -0.7 0.4 -1.5 4-15Infants (3-12 months) ? 0.8 -1.5 1.0 -1.5 10-15
* Assuming 10% absorption.
it is estimated that the need is approximately0.8 to 1.5 mg a day for normal term infants(19, 26, 30, 31).
The data summarized above have been usedto construct the range of values presented inTable 3-namely, the estimated average amountsof iron that must be accumulated in a day tomeet the needs of various segments of thepopulation. They are of the same magnitude asthose previously published by the Committee onIron Deficiency of the American Medical Asso-ciation's Council on Foods and Nutrition (5)but differ slightly to reflect the new data onobligatory body iron loss (8) and a differentmethod for calculating the needs associated withpregnancy (inclusion of blood loss at deliveryplus omission of the iron required for expansionof red blood cell mass).
Absorption of food iron
The task of determining how much foodiron must be consumed in order to provide forthese needs is particularly difficult (21, 22).In recent years, most studies on food iron ab-sorption have used foods grown or prepared soas to contain radioiron. The foods are thencooked and fed as they would be under normalconsumption except that they are given alone.
Figure 2 summarizes most of the publisheddata on the absorption of radioisotope-taggedfoods (1, 3, 7, 12, 13, 20, 27, 29, 33). The
FOOD
23 U 0lUN Ub l 0UN -W02 FW aUV -ui-
_ NOO'i PERCENT Fe-9 ABSORBED100s lO 20 30 40 s50 60 70 - SO
AEGC S O3F1 G , S i
SOYOC*NS .........T;
iDaet~~~~~ERCENilT F.-ABSOR...BED
CARC, , ri,
L FEIISTVI
OWOACL AFOr-E '2 II
MILO []
MYeRTn '
MU'SCI-E Ivibs I' m;
FOOD O 0 20 30 40 50 D 70 80 90
á...... 52
tNilLii 10 I
O0CIERALL AGORAIi6E lS
NO O PRCtotSjOtrENt T F 5 A DORE
FOOD 0 8.5.Fm° K)2 5 4 O6 7 09
17i8nase I I I
OVERALL AVERAGE _ _ ~
FIG. 2. Radioiron measurement of the absorption ofiron from foods by adult subjects and children. Thelength of the bars indicates the degree of variation inresults obtained from each food; the heavy vertical lineacross each bar indicates the average value. Cross-hatchedbars = iron-deficient; clear bars = normal. The amountof iron in each feeding varied from I to 17 mrg. Datacompiled from the following references: 1, 3, 7, 12, 13,20, 24, 27, 29, 33.
length of the bars indicates the variation amongdifferent subjects for each food; the heavy
52

vertical line across each bar indicates the averagevalue; the cross-hatched bars represent the resultswith iron-deficient subjects. The amounts of ironin each vary from 1 to 17 mg. Several facts areevident: variation among subjects is large; iron-deficient patients tend to absorb food ironbetter than normal subjects do; and assimilationfrom wheat and corn is less efficient than frommost other foods, particularly those of animalorigin. In all the studies taken together, theover-all average is 8.5 per cent for normal sub-jects and 18.9 per cent for iron-deficient persons.
Several deficiencies in these data should bepointed out. The test dose was administeredon a one-shot basis and does not, therefore, illus-trate the day-to-day variation that may occurin the same individual. Furthermore, the foodwas fed by itself, so that the effect of otherfoods administered in combination was notevaluated. Layrisse and his associates (16) haveelegantly demonstrated that absorption from cornand black beans is increased by feeding animalfood simultaneously; that absorption fromveal (but not from fish) is reduced when fedtogether with corn or black beans; and that cer-tain amino acids, especially the sulfur-containinggroup of amino acids, enhance the absorptionof iron from vegetable sources.
Several groups of workers have tried to cir-cumvent some of these problems by feeding atracer dose of radioiron along with a stand-ard meal. The results of one such study fromDr. Finch's laboratory are also included inFigure 2 (24). This method saves the troubleof labeling the foods themselves, avoids theartificiality of measuring absorption from onlyone food at a time, and permits evaluation of anumber of intra- and extraluminal factors thataffect iron absorption. It assumes, however, thatthe tracer dose of ferric chloride will admixor interchange sufficiently with the iron in foodto provide an index of iron absorption, whereasthere is evidence to suggest that, in the case ofhemoglobin at least, such interchange does notoccur (10). Results with the four differentstandard meals agree reasonably well with eachother (Table 4 and 6, 24, 28, 32). The average
TABLE 4. Absorption of radioiron from standard meals
Fe hORilAL | Fe DEFICIENT
m9 NO. Range A v.& NO. Range % Av.%
Shrpe eta]1(adSlehepnt boye) 7.5 - 6 10 ? 5.76
10 7 8 .3
Turnbull 8 7 1-10 3.4 2- 17 - 33 25
6$ 22 14 - 80 46.2
Piio -6oíli et a1 4.6 a8 1.7 - 16.6 6.35 8 9.9 -38.7 21.6
4.6 12-- 0.5 -10.5 4.6
4.6 4--- 0.6 - 8.6 5.3
Go1dber.g et al 12.5 8 17 -66 75
7 41 29.6 18.5
Fe deficlency without anemiaNon-hematolog I c patients
-Pernicious an eia fn remlssion
fPatients withAchlorhydrla
Composition of the standard meals as follows:
1 Sharpe, Peacock, Cooke, and Harris (1950): Milk,200 g; cooked rolled oats, 285 g; white bread, 34 or56 g; tomtao juice, 150 g.
2 Turnbull (1965): Canned stewing steak, 50 g; po-tato powder, 15 g; frozen peas, 50 g; butter, 10 g;orange, 100 g; cream, 20 g.
3 Pirzio-Biroli, Bothwell, and Finch (1958): Cannedcorned beef hash, 200 g; apple sauce, 200 g; tomnato juice,200 g; soda crackers, 13 g; cocoa, 3 g.
4 Goldberg, Lochhead, and Dagg (1963): Corned beef,100 g; apple sauce, 100 g; tomato juice, 200 g; creamcrackers, 13 g; cocoa, 3 g.
values for healthy or normal subjects range from3.4 to 8.3 per cent, and for iron-deficient patientsfrom 18.5 to 57.5 per cent. The strong pos-sibility exists, however, that these data representthe absorption of inorganic iron and are not anaccurate measure of the assimilation of iron fromfood.
There is a tendency to ignore the results ofearly balance studies because technical errorswere significant, because the difference betweenoral intake and fecal loss was so small thatprecise measurement was difficult, and becausedifferentiation between excreted and unabsorbedfecal iron was not possible (22). Five of thesestudies, however, were done with such greatcare that they merit attention (Figure 3 and11, 14, 17, 25, 34). They have the advantageof having been performed, with one exception,over a period of at least 28 days, so thatdaily variation was minimized. In addition, avaried diet was used. In these healthy sub-jects, the absorption range, calculated on thebasis of the positive balance, was from 7.3 to
53

O 4 8 0 30 20 A)LANCE OSSORNION
wddo as sec.l.Ce 4 a .. ........
FiS. 3 .I on balancel s u odoi o z¡ro abZlsM M ACll. 07 301st (('133 (46 3
o 4 12 11.
q fli _t2-D,«St> ~~~~~~~~3-S 04 3 <3393
FIo. 3. Iron balance studies of iron absorption
21 per cent. If one assumes that 0.5 mg offecal iron was excreted iron, then the propor-tion of food iron absorbed from the basal dietswould be increased to from 11.3 to 27.5 per cent.
There are several other dietary factors thatmust be considered in attempting to arrive atan average figure for food iron absorption:
1. Achlorhydria may impair the absorption offood iron (6, 22).
2. In countries where wine is taken withmeals, the wine serves as a source of ironand its alcohol content may enhance absorptionas well (2).
3. Ascorbic acid will increase absorption fromcertain foods (15, 22).
4. The use of iron cooking utensils may addconsiderable amounts of iron to foods (21).
5. Geophagia, or clay eating, is more fre-quent, particularly among economically deprivedgroups, than is commonly recognized. Alkalineclays with a high cation exchange capacity areparticularly instrumental in depressing iron as-similation (Figure 4 and 18).
For all these reasons, it is impossible at thepresent time to draw any firm conclusionsabout the composite percentage of iron that willbe absorbed from a given diet. Furthermore,it is difficult to judge exactly how iron absorp-
REFE
1. CALLENDER, S. T. Digestive absorption of iron.In F. Gross (ed.), Iron Metabolism; an InternationalSymposium, Berlin, Springer-Verlag, 1964, pp. 89-96.
5 0 r
c 40
qZS 300
20
mo1 n
O Without Clay (Mean 26.8:)[ With Clay (Mean 2.4 t)
HF
Fi n1-IrL- VM MDOJ MKd' YGd GMc4 BBV PS PJ M(MCGS
FIG. 4. Effect of 5 grams of Turkish clay (pH 10.3)on Fe¿SO, absorption in nine normal subjects. Repro-duced from Minnich et al. (18).
tion will increase or decrease on a sliding scaleas iron deficiency develops or is corrected. Onecan do no better than to guess that a figure of10 per cent might represent a fair approxima-tion for diets that contain a generous amount ofanimal protein; the estimate of 10 per cent isprobably too high when food is derived largelyfrom vegetable sources, particularly cereals.
Dietary iron requirements
Application of the 10 per cent absorptionfigure to the estimates of iron needs gives thedietary estimates indicated in the right-handcolumn of Table 3.
Since in most diets there is only about6 mg of iron per thousand calories, it is evidentthat the higher values in the various rangeswould be difficult to achieve, particularly ininfants, adolescent girls, menstruating women,and pregnant women. It is not surprising,therefore, that these are the groups in whichiron deficiency is most common. The estimatesare higher than formerly believed and causeconsternation among nutritionists. The greatestchance for error would come from underestimat-ing the efficiency of absorption, but at this timethe recommendations seem reasonable. It isdoubtful that they are off by a factor of morethan plus or minus 25 per cent.
RENCES
2. CHARLTON, R. W., P. JACOBS, H. SEFTEL, andT. H. BOTHWELL. The effect of alcohol on ironabsorption. Brit Med 1 2: 1427-1429, 1964.
54
IDO' ' _ ' ' ' ' ''-

3. CHODOS, R. B., J. F. Ross, M. POLLYCOVE, andJ. A. E. HALKETT. The absorption of radioironlabeled foods and iron salts in normal and iron-deficient subjects and in hemochromatosis. / ClinInvest 36: 314-326, 1957.
4. FINCH, C. A. Body iron exchange in man.Clin Invest 38: 392-396, 1959.
5. FINCH, C. A., E. BEUTLER, E. B. BROWN, W. H.CROSBY, M. HEGSTED, C. V. MOORE, J. A. PRITCHARD,P. STURGEON, and M. M. WINTROBE. Iron deficiencyin the United States; Committee on Iron Deficiency.IAMA 203: 407-412,1968.
6. GOLDBERG, A., A. C. LOCHHEAD, and J. H. DAGG.Histamine-fast achlorhydria and iron absorption.Lancet 1: 848-850, 1963.
7. GORTEN, M. K., R. HEPNER, and J. B. WORK-MAN. Iron metabolism in premature infants. 1Pediat 63: 1063-1071, 1963.
8. GREEN, R., R. CHARLTON, H. SEFTEL, T. BOTH-WELL, F. MAYET, B. ADAMS, and C. A. FINCH. Bodyiron excretion in man, a collaborative study. Amer1 Med 45: 336-353,1968.
9. HALLBERG, L., A. HOGDAHL, L. NILSSON, andG. RYBO. Menstrual blood loss, a population study;variation at different ages and attempts to definenormality. Acta Obstet Gynec Scand 45: 320-351,1966.
10. HALLBERG, L., and L. SOLVELL. Absorption ofhemoglobin iron in man. Acta Med Scand 181: 335-354, 1967.
11. HUSSAIN, R., and V. N. PATWARDHAN. Theinfluence of phytate on the absorption of iron. Indian1 Med Res 47: 676-682, 1959.
12. HUSSAIN, R., R. B. WALKER, M. LAYRISSE, P.CLARK, and C. A. FINCH. Nutrition value of foodiron. Amer 1 Clin Nutr 16: 464-471, 1965.
13. HWANG, Y-F., and E. B. BROWN. Effect ofdesferrioxamine on iron absorption. Lancet 1: 135-137, 1965.
14. JOHNSTON, F. A., R. FRENCHMAN, and E. D.BURROUGHS. The absorption of iron from beef bywomen. 1 Nutr 35: 453-465,1948.
15. KUHN, 1. N., M. LAYRISSE, M. ROCHE, C.MARTíNEZ, and R. B. WALKER. Observations on themechanism of iron absorption. Amer 1 Clin Nutr21: 1184-1188, 1968.
16. LAYRISSE, M., MARTíNEz-TORRES, and M. ROCHE.The effect of interaction of various foods on ironabsorption. Amer 1 Clin Nutr 21: 1175-1183, 1968.
17. McMILLAN, T. J., and F. A. JOHNSTON. Theabsorption of iron from spinach by six young wom-en, and the effect of beef upon the absorption.Nutr 44: 383-389,1951.
18. MINNICH, V., A. OKCUOGLU, Y. TARCON, A.ARCOSOY, S. CIN, O. YORUKOGLU, F. RENOA, and
B. DEMIRAG. Pica in Turkey. II. Effect of clay uponiron absorption. Amer 1 Clin Nutr 21: 78-86, 1968.
19. MOE, P. J. Iron requirements in infancy; lon-gitudinal studies of iron requirements during thefirst year of life. Acta Paediat Suppl 150: 11-67,1963.
20. MOORE, C. V., and R. DUBACH. Observationson the absorption of iron from foods tagged withradioiron. Trans Ass Amer Physicians 64: 245-256,1951.
21. MOORE, C. V. Iron nutrition and require-ments. In "Iron Metabolism," Series Haematologica,vol. 6, suppl. Scand 1 Haemat, 1965, pp. 1-14.
22. MOORE, C. V. The absorption of iron fromfoods. In Gunnar Blix (ed.), Occurrence, Causesand Prevention of Nutritional Anaemias; Symposiaof the Swedish Nutrition Foundation, VI, Stock-holm, Almqvist and Wiksell, 1968, pp. 92-102.
23. MOORE, C. V. Iron nutrition. In F. Gross(ed.), Iron Metabolism; an International Sym-posium, Berlin, Springer-Verlag, 1964, pp. 241-265.
24. PIRZIo-BIRoLI, G., T. H. BOTHWELL, and C. A.FINCH. Iron absorption. II. The absorption of radio-iron administered with a standard meal in man.
Lab Clin Med 51: 37-48, 1958.25. SCHLAPHOFF, D. M., and F. A. JOHNSTON. The
iron requirement of six adolescent girls. 1 Nutr39: 67-82, 1949.
26. SCHULMAN, 1. Iron requirements in infancy.JAMA 175: 118-123, 1961.
27. SCHULZ, J., and N. J. SMITH. A quantitativestudy of the absorption of food iron in infants andchildren. Amer 1 Dis Child 95: 109-119, 1958.
28. SHARPE, L. M., W. C. PEACOCK, R. COOKE, andR. S. HARRIS. The effect of phytate and other foodfactors on iron absorption. 1 Nutr 41: 433-446, 1950.
29. STEINKAMP, R., R. DUBACH, and C. V. MOORE.Absorption of radioiron from iron-enriched bread.Arch Intern Med 95: 181-193, 1955.
30. STURGEON, P. Iron metabolism; a review withspecial consideration of iron requirements duringnormal infancy. Pediatrics 18: 267-298, 1956.
31. STURGEON, P. Studies of iron requirements ininfants and children. In R. O. Wallerstein and S. R.Mettier (eds.), Iron in Clinical Medicine, Berkeley,Univ. of California Press, 1958, pp. 183-203.
32. TURNBULL, A. L. The absorption of radioirongiven with a standard meal after Polya partial gas-trectomy. Clin Sci 28: 499-509, 1965.
33. TURNBULL, A. L., F. CLETON, and C. A. FINCH.Iron absorption. IV. The absorption of hemoglobiniron. 1 Clin Invest 41: 1897-1907, 1962.
34. WIDDOWSON, E. M., and R. A. MCCANCE. Ironexchanges of adults on white and brown bread diets.Lancet 1: 588-592, 1942.
55

IRON-DEFICIENCY ANEMIA IN LATIN AMERICAN ANDCARIBBEAN POPULATIONS
Yaro R. Gandra
Iron-deficiency anemias have long been iden-tified as a major public health problem in dif-ferent areas of Latin America and the Carib-bean. The frequency of anemia in these popu-lations and its negative effect on their progressand development are recognized. The infectionsand reduced work capacity associated withanemia result in educational and economic lossesthat eventually affect the social behavior of thehemisphere's population. The problem is mostacute among vulnerable groups, whose physio-logical iron requirements are particularly high.
Although many reports on iron-deficiencyanemia in different areas of the hemispherehave been published, the real extent of thisdisorder is still unknown. In recent years acoordinated effort to explore the problem fullyhas been carried out under the auspices ofWHO, PAHO, and FAO (20, 21, 22, 23). Invarious meetings studies have been recom-mended to clarify the role of dietary defi-ciency and parasitism in the pathogenesis ofnutritional anemias and also to learn moreabout anemias associated with pregnancy.
In 1963 a regional center was establishedunder the auspices of PAHO/WHO at theIVIC, in Caracas, to train investigators andtechnicians for work in this field throughoutLatin America and the Caribbean area.
In August 1968 a meeting of the PAHO Scien-tific Group on Research in Nutritional Anemiaswas held at Caracas. Its main purpose was tostudy and discuss a WHO nutritional anemias
program in Latin America and the Caribbean;it also examined parameters for the reproduci-bility of data from different cooperating labora-tories and made appropriate recommendations.
Iron-deficiency anemia
Iron-deficiency anemia is the most commonkind of anemia in the Americas, and, as malnu-trition, it is second only to protein-calorie mal-nutrition. Since dietary iron intakes in this areaof the world are not significantly lower thanthey are elsewhere, where iron-deficiency anemiais not a major problem, it is probable that otherfactors enter into play-the amount of ironavailable for absorption, the interference of nu-trients in the common diet, abnormalities ofsmall bowel architecture, or abnormal bloodloss. Other possible causes of iron-deficiencyanemia, such as low dietary calcium, highphosphorus in the diet, or iron loss from theskin through excessive perspiration or due toincreased intestinal desquamation have not beeninvestigated in detail in this area.
The literature on this subject is extensive,but the population samples analyzed, themethods used, and the criteria of normality havenot been homogeneous and do not allow for anadequate analysis of the results. Thus, emphasishas been focused on the need for data that arecomparable rather than for information fromfield studies in general.
The reports from different surveys carried outin Latin America and the Caribbean area show
56

hemoglobin averages varying from 11.8 g to16.0 g/100 ml of blood, the level for malesbeing 1 or 1.5 g higher (Table 1). Some areas,like the West Indies, showed low over-all aver-ages-12 .5 for males and 11.8 for females (19),whereas other places, such as Uruguay (17),had general averages that were somewhat higher-14.7 for men and 13.5 for women. A betteranalysis of this situation, however, is obtainedwhen one considers the percentage of individ-uals in the population classified as "low" or"deficient." In Venezuela, for instance (18),although the male population had an averageof 13.7 g/100 ml, 41.7 per cent had hemoglobinrates considered "low," and 14.2 per cent wereunder 12 g/100 ml; and in the same country,18.9 per cent of the women were below thislast-mentioned level. The percentage of totalpopulation having less than 12 g of hemoglobinvaries in the different countries from 1.7 to38.6 for males and from 3.6 to 49.1 for females(12, 17, 20).
Quite often generally elevated hemoglobinaverages have been found among populationsliving at high altitudes. It is evident that amore meaningful interpretation of the hema-tological data is obtained when the figures areadjusted taking altitude into consideration. InBolivia, for instance (12), a general average of16.4 was obtained for persons over 15 years ofage and 14.9 for those 15 and under. Sevenstudy areas located at altitudes ranging from6,700 to 13,467 feet presented generally highhemoglobin averages, but when these data werecorrected for altitude, most of the subjects fellinto the "acceptable" or "low" category. Thesame thing happened with the studies in Colom-bia (14), Ecuador (15), and Mexico (2).
The mean corpuscular hemoglobin concentra-tion (MCHC) was around 32 per cent in allthe countries but Venezuela, where it was about36 per cent. The proportion of the general pop-ulation having an MCHC of less than 30 percent varied from 1.5 per cent for Venezuela (18)to 18.0 per cent for the West Indies (19). Thisis a partial suggestion of the presence of iron-deficiency hypochromic macrocytic anemia.
Serum iron was not determined in most ofthe studies. In Trinidad (5), the serum ironvalues ranged between 22.92 to 274 jtg/100 ml,with a mean value of 87.2 /ag/100 ml; 43 percent of the subjects studied had values under80 tug, and 15 per cent were below 50 /g/100 ml.
All the data that have been cited refer to thegeneral population, and therefore they do notalways give a clear picture of the vulnerablegroups, where the problem of anemia is ofgreatest magnitude.
In Venezuela (18), for example (Table 2),children under one year of age have a mean aver-age hemoglobin of 10.27 g/100 mi, and one thirdof them have hemoglobin concentrations of lessthan 10 g/100 ml. In Brazil (16), the childrenin this same age group have an average hemo-globin of 12.1 g/100 ml, and half of them havelevels below 12 g/100 ml. In the West Indies(19), almost 90 per cent of children under twoyears of age have hemoglobin levels below12 g/10 0 ml.
Preschool children in all these countries ex-cept Uruguay are deficient. In this age group,the average hemoglobin levels in the differentLatin American countries has varied, with gen-eral averages of from 10.8 g/100 ml (and 77.4per cent with less than 12 g) in the West Indies(19) to 13.2 g/100 ml in Bolivia (12).
Many authors found "foci" of anemia inschoolchildren in certain tropical areas. InIquitos, Peru (6), for example, the schoolchil-dren had an average hemoglobin of 10.6 g/100lml, with 56 per cent having less than 10 g/100ml. A recent examination of schoolchildrenfrom villages in the coastal region of the Stateof Sao Paulo (Brazil), showed general hemo-globin averages in many villages of around 9.5g/100 mi, with more than half the children hav-ing less than 10 g/100 ml. Throughout almostall of Latin America and the Caribbean area
a large percentage of the children have inade-
quate hemoglobin concentration levels.
Pregnant and lactating women are another
group in which anemia is an important public
health problem (Table 3). Some of the surveys
by the U.S. Interdepartmental Committee on
57

r'q
o+ ~
oD o \° o°
r,!, e,!, v ~ ~ ~~~r,
~ s o o o
"o~~~~~
CO - -m O O O G
CO - - __
¢ - -_ rGat
c a: oe +~ _ E, evo 0
c _Omto
E z v o u c~~ ° :~'
u
CO~~~~~~~~~~~~~~~~~~~~~~~~~~~:
C e oCS m l'v
.0 D -+ ex t,
.0~ ~ ~ ~~ CO j)
o~~~~~
.0 ~~~~~~~-
C . .0m
uu E
CO+
o E- COOa c Q 8 C
z = )Xn
0+~~~~~~
Co Zq . .
-< (' lo< O
O - Z~~~~~~~
58

>' 0+i t-,
,' + :i e!q. -1 m VN °-u M; u-,r
0+ _ 0 b+ b_ u
<-'afO O-F . I
_ _
o _
¡ Q 2ci IMO z~~.4
u o+'
sa _
I I >s
- o ci
u c -
_
j-.e-~
.4O O O
Q0_ W0('1 4 _
t -
I I I I I I
W 0+ <-
441 -
: 1 o el
a;
ra~
Ir.
VNmEUo
, t-
l-
U .o
O.~ UE
E,0
E,-
Co
o, ooEU
¡ ¡ 1
¡ ¡ ¡
QQ I IIu u ¡ ¡
C,r III11
O. COO r,
ra-1
Ora 4 1 ON m '4-E,- <~";<-
mN°> m u:" °+cO r; I,r + biW\ m | So _
c: C : ,uQQ
u u ¡ <-o 'r. Z ~l o1
c
-o.0
0.o
Qin.
0+ '¡ UE C-u - ra
Q Q 'u
C 0 C 0 r' 0o Co 4- (- > a;o C
u u W o
C: C m F
o'4 C4 :
' - i' -
v r!-a
ti3
u)
-oQo-o
-o ¡- -a inr
r-t r- a. u-,m a-
- (' -- - -
¡4 ~1 (4.4
vv-v O ~ v~
59
w1
z
;'
miniE4a-
ooo'C-
0-
wuQ- <-
3 «
p _
z -
U
.z
.1N14
-4
iz14
o
-P, O+ a)0-~
Z +O
o -
,=
v
¡ 1
¡ 1 ¡
1- -
o'Z-
'-
5
c.-
oi4,Oo
mN
yD v,
-o
o
u
IIz
X m
1 1 1

<lí Ir r4 c : N
<1 ae .-C'i7 al
O 0' c5 r4 C= O
- v\e - uo .
1rl -o
- e qo - 'e
- 1 1 Q
- - -o
e g
m t- xi c
Vv
("1
« Cr rC " C C C
_ e
mCUCCQ _
e e u 0
Ez! C C 'o_ lo
-4 -c: Cr
c
0E
e -
z , caz
I il
Ó; \o rq 1e _ 1
C d
-E o o
c: c V VE u vP.
60
..
wi
9
1-z c
0 -S
,eo e:ct-. e,-- 4
o
xw
8
o
.4
oe5
z
o
w D
zo o
z �
1IZ>
lz:�
i:z
Gz�
zz
e1
.4
z
-5
'D
-
em0.4ue
e -
_
Z
'. 11
Q,
<z
Nutrition for National Defense (ICNND) in-clude these groups in their studies. In Ven-ezuela, for instance, where the hemoglobinaverage of pregnant and lactating women ispractically the same as that of nonpregnant,nonlactating females, the proportion of caseswith less than 12 g in pregnant women is 57.9per cent, whereas in the total nonpregnantfemale group it is 18.9 per cent. The samesituation was found in other areas. Even inUruguay (17), where anemias are not a veryserious health problem, 60 per cent of the third-trimester pregnant women were found to haveless than 12 g/100 ml, as against 6.1 per centin the nonpregnant group. In Trinidad (4),an examination of over 500 pregnant womenselected at random showed that 34 per centhad hemoglobin concentrations of less than10 g/100 ml. In this study it was shown thatthe rate of hemoglobin values decreases as thepregnancy progresses. Women in the first fivemonths of pregnancy have an average of 11g/100 ml, and those in the sixth month andonward have 10.6 g/100 ml. In Saltillo (1),a city in the north of Mexico with an altitudeof over 5,200 feet, 50 per cent of the pregnantwomen under medical supervision had hemo-globin levels of less than 10.5 g/100l ml, and15.2 per cent had less than 8.5 g/100 ml; 68per cent of all the pregnant women studiedhad less than 50jug/100 ml of serum iron.
The 1968 PAHO Scientific Group on Researchin Nutritional Anemias, meeting at Caracas,reviewed the pilot studies on the prevalence ofnutritional anemia in pregnancy that had beenrecommended in 1963, and the results of 900protocols from cooperating laboratories in Mex-ico City, Caracas, Medellín, Sio Paulo, Lima,Corrientes (Argentina), and Port of Spain ledto the conclusion that 21 per cent of the womenin the last trimester of pregnancy are definitelyanemic and have hemoglobin levels below thelower limit of normality (10 g/100 ml at sealevel, or corrected for altitude).
The foregoing data demonstrate the serious-ness of anemia among vulnerable groups ofinfants, preschool children, schoolchildren, and
pregnant and lactating women. If analyzedsamples could be extended to all the population,one would realize that millions of people inLatin America and the Caribbean area haveclear-cut anemia.
The most frequent types of anemia inLatin America and the Caribbean
As far as the type of anemia is concerned,many of the studies mentioned (1, 9, 11, 16, 19)seem to indicate that the most frequent anemiain Latin America and the Caribbean area isproduced by the deficiency of available iron forthe body. The values of MCHC in these areasare generally "acceptable," but in several coun-tries the proportion of the population withaverage levels of less than 30 per cent washigh-Ecuador (15), 42.7 per cent; Chile (13),26.7 per cent for men and 42.8 per cent forwomen; Brazil (16), 23.5 per cent for men and17.5 per cent for women-to cite a few. InUruguay (17), where iron-deficiency anemia isnot a public health problem and the generalaverage of MCHC is similar to the level men-tioned above, there were no cases below 30per cent.
Serum iron has been shown to be generallylow. In Trinidad (5), for instance, 43 per centof the population has less than 80 /g/100 mi,and in 15 per cent of the population the levelis less than 50jg/100 ml. In Mexico, too (9),the serum iron levels were generally low; inHuamantla (11) and in Saltillo (1), for example,a large proportion of the pregnant women hadlow serum iron and high MCHC, suggestingthat at least 60 per cent of the cases of anemiain pregnant women were caused by iron de-ficiency.
It was concluded at the Caracas meetingin 1968 (10), that iron deficiency accounts forapproximately 75 per cent of the cases of anemiain the third trimester of pregnancy, and in ap-proximately one third of these cases an addi-tional nutritional deficiency can be observed.In female control subjects, iron deficiency ac-counts for approximately half of the anemiafound. Studies of low-income pregnant women
61

in the last trimester of pregnancy, nonpregnantwomen, and men conducted by IVIC in Caracasshowed hemoglobin levels of less than 11 g/100ml for 37 per cent of the pregnant women;low serum iron and decreased transferrin satura-tion indicated iron deficiency in nearly 60 percent nf the pregnant women and 19 per cent
of the nonpregnant women (23). Finally,projects that included the administration of ironto the anemic population of these areas (3, 6)confirmed that iron deficiency is the most gen-eral and important cause of anemia in LatinAmerica and the Caribbean area.
Etiology of iron-deficiency anemia inLatin America and the Caribbean
It is recognized that iron-deficiency anemiacan be caused by the following factors: (1) in-adequate ingestion; (2) poor absorption andutilization; (3) increased losses or requirements,as in growth, lactation, and pregnancy. All thesefactors are present in Latin America and theCaribbean area.
Inadequate ingestion
The idea that iron-deficiency anemias occurchiefly because of insufficient dietary iron intakehas not necessarily been confirmed by surveyscarried out in Latin America and the Caribbeanarea. The different reports on anemia anddietary iron intake from dietary surveys or foodanalysis show that in most cases there is nocorrelation between the amount of dietary ironand the degree of anemia (Table 1). InBolivia (12), Brazil (16), Chile (13), Mexico(2), and Venezuela (18), the amounts of dietaryiron were substantially above the NRC allow-ances and ICNND reference guides, and stilliron-deficiency anemia is a problem in theseareas. The biological availability of iron fromdietary sources has not always been taken intoconsideration. In the surveys of Chile andUruguay (13, 17), the average daily dietary ironintake was shown to be nearly 17 mg per capitain both cases-and yet anemia is a problem inChile but not in Uruguay. These examples
suggest that most anemia in these areas is notnecessarily a consequence of dietary iron de-ficiency, but rather that other factors are inter-fering.
Poor absorption and utilization
Iron-deficiency anemia may result from poorabsorption and utilization. Some reports haveshown that dietary iron derived from animalsources is better absorbed than that from vege-table sources, even in an iron-deficient patient.In these subjects, the absorption of iron de-rived from animal products such as meat andfish is about 20 per cent (8), whereas absorptionfrom staple foods such as wheat and corn isnot as high as 10 per cent. However, diets con-taining large amounts of animal protein may bemore efficient than vegetable diets as far as ironabsorption is concerned. Layrisse et al. (7),working with food of animal and vegetableorigin, found that the interaction of both maychange the rate of iron absorption and that themixture of a vegetable food such as corn orblack beans with food of animal origin enhancesthe absorption of iron by threefold.
It should be kept in mind that for the greatmajority of people in Latin America and theCaribbean area the proportion of animal foodsin the diet is not adequate. In Brazil (16),for instance, a dietary survey showed that ironintake is high chiefly because of the high con-sumption of legumes. Animal food, such asmeat and eggs, is not commonly eaten bythe population.
Malnutrition may well be an important causeof anemia in Latin America and the Caribbeanarea. Also, deficiencies of proteins, folate, vita-min B1l and other nutrients can result in anemia.
Increased losses
Epidemiological studies on losses of iron fromthe body through sweat, skin exfoliation, urine,and gastrointestinal processes are not availablefor Latin America and the Caribbean, and con-sequently it is not possible to give consistentfigures for these areas. It is generally accepted
62

that one of the most important causes of bodyiron loss in tropical zones is hookworm infec-tion. Ancylostoma duodenale, Necator ameri-canus, Trichuris trichiura, Schistosoma hema-tobium, and Schistosoma mansoni infections canproduce chronic blood loss resulting in iron-deficiency anemia.
Nutritional surveys carried out in Latin Amer-ica and the Caribbean have shown that intestinalparasitic infections and anemias frequently con-stitute a serious public health problem (4, 5,14). In the survey of Northeast Brazil (16),for example, 99.4 per cent of the results of fecalexamination for helminths was positive. A com-parison of hemoglobin levels in subjects withand without hookworm infection showed thatthose with hookworm had a mean hemoglobinconsistently lower than those without.
In the study of an Amazon basin community(6), it was reported that 56 per cent of theschoolchildren had hemoglobin levels below10 g/100 ml, and 96 per cent harbored morethan one kind of intestinal parasite. Hookwormswere found in 93 per cent of the schoolchildren.In one subgroup that received iron but not anti-helminthic treatment, the mean hemoglobinconcentration increased from 8.3 -- 2.1 to 10.8-1.1 g/100l ml six weeks after treatment had beeninitiated. In another subgroup that receivedboth iron and antihelminthics, the mean hemo-globin concentration increased from 8.2+-2.2 to11.5+1.0 g/1 00 ml during the same period.The response of the group that had previouslybeen given antihelminthics was significantlygreater (p>0.05) than that of the group thatdid not receive the treatment.
A Mexico study (2), in which the frequencyof anemia was analyzed both in coastal com-munities and in the highlands, revealed anaverage hemoglobin of 11.1 g/100 ml on thecoast and 12.1 in the highlands. Hookworminfection was very common in the former areabut not in the latter.
Studies of infected and noninfected ruralcommunities in Venezuela have demonstratedthat 30 per cent of the anemic conditions couldbe traced directly to hookworm infection. Para-
sitic blood losses had to reach a certain levelof intensity, however, before they significantlyinfluenced hemoglobin levels in the blood.
Since parasitic infection is a very widespreadpublic health problem in Latin America and theCaribbean area, it can easily be surmised thatit has an important role in enhancing the preva-lence of iron deficiency in these areas. Someexception to this, of course, can be found in theliterature. In Saltillo, for instance (1), wherehookworm is not prevalent, 50.9 per cent of thepregnant women had hemoglobin levels below10.5 g/100 ml, and 68.0 per cent of the samegroup had less than 50 /g of serum iron. Thus,although anemia is a serious problem in thisarea, the authors conclude that hookworm in-fection has little to do with the situation.
Final considerations
In all the available reports, a high percentageof the general population and of specific groupshave blood parameters that are considered "de-ficient" or "low." If the groups that have beenanalyzed in these different surveys are reallyrepresentative of the general population of thearea, this means that millions of people in LatinAmerica and the Caribbean have unsatisfactoryhemoglobin levels.
For the most part, dietary iron deficiency doesnot stand out as a factor among these popula-tions, though poor, unbalanced diets could havean important role in the absorption of iron.
The increase of intestinal hemoglobin ironloss as a consequence of the prevalence of para-sitic infection might also be another importantfactor in the frequency of iron-deficiency anemia,chiefly in the tropical areas of Latin Americaand the Caribbean.
The reports that have been made to date onthe subject of anemias are not sufficient enoughto give a clear idea about their frequency, se-verity, or etiology, and more studies in differentareas should be stimulated. Moreover, the lackof standardized techniques in these surveys, andthe variation in criteria used for random sam-pling, make comparisons difficult; greater en-couragement should be given to the PAHO/
63

WHO efforts to standardize methods and tech-niques for obtaining accurate data on the preva-lence and etiology of anemias.
It is important also to consider that, despitethe many surveys that have been made on iron-
deficiency anemia, very few programs for thedistribution of iron to the general populationor to specific vulnerable groups have been car-ried out to date. It would be useful to stimulatemore preventive programs in this area.
REFERENCES
1. BÁEZ, M., et al. La anemia en embarazadas dediferente nivel socioeconómico. Arch Venez Nutr18: 221-232, 1968.
2. BALAM, G., and A. CHÁVEZ. Frecuencia deanemia en algunas comunidades rurales del altiplanoy de las costas. Salud Publica Mex 8: 225-233, 1966.
3. BRADFIELD, R. B., et al. Effect of low-level ironand vitamin supplementation on a tropical anemia.Amer 1 Clin Nutr 21: 57-67,1968.
4. CHOPRA, J. G., et al. Anemia in pregnancy.Amer 1 Public Health 57: 857-868, 1967.
5. CHOPRA, J. G., and N. T. A. BYAN. Anemiasurvey in Trinidad and Tobago. Amer 1 PublicHealth 58: 1922-1936, 1968.
6. GANDRA, Y. R., et al. Studies of the pathogene-sis of a tropical normocytic anemia. Amer / ClinNutr 18: 116-122, 1966.
7. LAYRISSE, M., C. MARTíNEZ-TORRES, and M.ROCHE. The effect of interaction of various foods oniron absorption. Amer 1 Clin Nutr 21: 1175-1183,1968.
8. LAYRISSE, M., et al. Food iron absorption; acomparison of vegetable and animal foods. Blood33: 430-443, 1969.
9. LISKER, R., and O. B. P. ALVAR. Frecuencia ycaracterísticas de la anemia en el medio rural mexi-cano. Rev Invest Clin 15: 29-42, 1963.
10. PAN AMERICAN HEALTH ORGANIZATION. Pre-liminary Report oj the PAHO Scientific GroupMeeting on Research in Nutritional Anemias (Ca-racas), August 1968.
11. SÁNCHEZ-MEDAL, L., et al. Anemia en el emba-
razo. 1. Estudio de 143 embarazadas de Huamantla,Tlaxcala. Gac Med Mex 97: 1335-1349, 1967.
12. UNITED STATES, INTERDEPARTMENTAL COMMIT-
TEE ON NUTRITION FOR NATIONAL DEFENSE. Bolivia:Nutrition Survey; a Report. Washington, D.C., 1964.
13. UNITED STATES, INTERDEPARTMENTAL COMMIT-
TEE ON NUTRITION FOR NATIONAL DEFENSE. Chile:Nutrition Survey; a Report. Washington, D.C., 1964.
14. UNITED STATES, INTERDEPARTMENTAL COMMIT-
TEE ON NUTRITION FOR NATIONAL DEFENSE. Colom-
bia: Nutrition Survey, May-August 1960; a Report.Washington, D.C., 1961.
15. UNITED STATES, INTERDEPARTMENTAL COMMIT-
TEE ON NUTRITION FOR NATIONAL DEFENSE. Ecuador:Nutrition Survey; a Report. Washington, D.C., 1960.
16. UNITED STATES, INTERDEPARTMENTAL COMMIT-
TEE ON NUTRITION FOR NATIONAL DEFENSE. North-east Brazil: Nutrition Survey; a Report. Washing-ton, D.C., 1965.
17. UNITED STATES, INTERDEPARTMENTAL COMMIT-
TEE ON NUTRITION FOR NATIONAL DEFENSE. Uru-guay: Nutrition Survey; a Report. Washington,D.C., 1963.
18. UNITED STATES, INTERDEPARTMENTAL COMMIT-
TEE ON NUTRITION FOR NATIONAL DEFENSE. Vene-
zuela: Nutrition Survey, May-June 1963; a Report.Washington, D.C., 1964.
19. UNITED STATES, INTERDEPARTMENTAL COMMIT-
TEE ON NUTRITION FOR NATIONAL DEFENSE. WestIndies . . .: Nutrition Survey, August-September1961; a Report. Washington, D.C., 1962.
20. WORLD HEALTH ORGANIZATION. FAO/ WHOjoint Expert Committee on Nutrition; First. Geneva,1950. (Technical Report Series, No. 16)
21. WORLD HEALTH ORGANIZATION. FAO/WHOJoint Expert Committee on Nutrition; Fourth. Ge-neva, 1955. (Technical Report Series, No. 97)
22. WORLD HEALTH ORGANIZATION. FAOIWHOjoint Expert Committee on Nutrition; Filth. Ge-neva, 1958. (Technical Report Series, No. 149)
23. WORLD HEALTH ORGANIZATION. NutritionalAnemias. Geneva, 1968. (Technical Report Series,No. 405)
64

IRON DEFICIENCY IN PREGNANCY AND INFANCY
Luis Sánchez-Medal
From the standpoint of iron nutrition, preg-nancy is the most critical period in a woman'slife. In a normal pregnancy, the total ironrequirement is estimated to be from 580 to 1340mg, the average being about 980 mg (52). Thisamount is the sum of the ordinary external
losses, the requirements for red cell mass en-
largement, and the supply to the fetus and theplacenta.
The needs are unevenly distributed during
the period of pregnancy, rising exponentiallywith the passing months. Thus, whereas in thefirst trimester they amount to about 0.6 mg a
day, which is less than those of the nonpregnant
woman, they go up to about 8 mg a day duringthe third trimester (Table 1). These estimates
are based on the following data: (1) the ironcontent of the fetus, which is 5 mg at fourmonths, 65 mg at seven months, and 265 mgat ten months (37); (2) increases observed in
the mother's red cell volume during pregnancy,which range from 315 to 485 ml, with an aver-
age of about 425 ml, equivalent to 500 mg of
TABLE 1. Distribution of iron requirements (mg/day)during pregnancy
FIRST * SECOND THIRD
External losses 0.5 0.5 0.5The fetus 0.04 0.7 2.4Mother's RCV expansion 0 1.4 4.2Placenta 0.04 0.3 0.5
Totals 0.58 2.9 7.6
* Trimester
iron (Table 2 and 4, 8, 10, 29, 40); and (3) theapparent uneven distribution of this rise through-out pregnancy. Though Caton and associates(8) reported similar increases in the three tri-mesters, the data of De Leeuw et al. (10) andBerlin et al. (14) indicate that the increasestarts after the sixth and seventh month, re-spectively. It seems likely that most of the redcell volume increase takes place during the lasttrimester.
Diet does not provide absorbable iron in suf-ficient amounts to meet the third trimester re-quirements. Common diets in Western societiesprovide less than 2 mg of absorbable iron perday to the iron-deficient subject (10, 17, 25, 42).
Iron stores are usually insufficient to coverthe difference between what is required andwhat is absorbed. Estimates made using differ-ent methods have shown that all over the worldthe average woman has limited iron stores-
TABLE 2. Mean increase in red cell volume duringpregnancy
Berlin et al. (4) 315 mlDe Leeuw et al. (10) 405 mlLund and Donovan (29) 439 mlPritchard (39) 485 mlCaton et al. (8) 495 ml
Mean of all series: 425 ml =- 500 mg of iron,distributed as follows (mg):
FIRST * SECOND THIRD
TotalPer day
0 125 3750 1.4 4.2
* Trimester
65

TABLE 3. Prevalence of anemia and iron deficiency in pregnancy
PLACE SUBJECTS
%/ FREQUENCY OF
IRON
ANEMIA DEFICIENCY BOTH IN
JN THE ALL CASES
ANEMICS
Evers (11)Benjamin et al. (3)Hunter (20)Lund (28)Giles and Burton (13)
HollandNew York, U.S.A.Indianapolis, U.S.A.New Orleans, U.S.A.England
* Hb below 12 g; in the others Hb below 11 gt First prenatal consultation
At term
in most cases less than 400 mg (6, 10, 39, 45, 54).In the light of these facts, it is not surprising
that iron deficiency in pregnant women is astanding problem all over the world, even inthe most industrialized countries (Tables 3 and
TABLE 4. Prevalence of anemia and iron deficiency inpregnant women in WHO collaborative studies (38, 56)
ANEMIA * IRONDEFICIENCY
(%) (%)
Ramalingaswami: New Delhi(rural) 80 t 51.7
Baker: Vellore 56 99.0Rachemilewitz: Upper Galilee
(rural) 471 46.3Layrisse: Caracas 37 59.7Sánchez-Medal: Tlaxcala
(rural) 28 64.5Lawkowicz: Warsaw 21.8 40.0Gutnisky: Corrientes 63.0 t -Layrisse: Caracas 52.0 57.0Viteri: Guatemala 38.0 73.0Sánchez-Medal: Mexico City 36.0 33.1Sánchez-Medal: Mexico City 19.0 23.1Reynafarje: Lima 35.0 -Vélez: Medellín 26.0 11.0 #Jamra: Sao Paulo 13.0 17.0
* Criteria: Hb below 11.0 g at sea level; saturationindex below 15%
t Second and third trimestersUncinariasis
§ Sampled during labor# 43% of cases with SFe below 50 cg
4 and 3, 11, 13, 20, 27, 28, 43). The Bantusseem to be the only exception, which may beexplained by the large iron content of theirusual diet (12). Thus, the World HealthOrganization has made the general recommen-dation that "a dose of ferrous salt containingat least 60 mg of elemental iron [be] given oncedaily during the second and third trimesters ofpregnancy and the first six months of lacta-tion" (56).
The prophylactic administration of iron dur-ing pregnancy is useful even in populationswithout widespread iron deficiency (35). Thiswas demonstrated in a study of women injectedintravenously with 1200 mg of iron dextran*during the first trimester of pregnancy (Table5). In the third trimester all the subjects hadserum iron levels of over 60 ísg/100 ml, trans-ferrin saturation over 15%, and a higher hemo-globin (0.4 g/100 ml) than they had hadduring the first three months.
Iron nutrition is also seriously compromisedduring infancy. During the first two to threemonths of life, iron requirements of the normalinfant are practically zero; the total hemoglobinlevel remains lower than that present in thenewborn. From then on, however, total hemo-globin increases rapidly as the infant gainsweight and his concomitant blood volume in-
* Iron dextran (Imferon) was kindly supplied byFarmacéuticos Lakeside, S.A.
66
AUTHORS
1000105247444015983
>9049 * t20t50t55 t
8098
>9978

TABLE 5. Effect of prophylactic administration of ironto pregnant women without evidence of iron deficiencyin the first trimester *
IRON-CONTROLS
TREATED
Data on first trimesterMean hemoglobin (g/l00 ml) - 13.0Mean serum iron (,ag/100 ml) - 131.0Cases with SFe below 60 ug (%) - OMean transferrin saturation (%) - 34.8Cases with saturation below 15 (%) - 0
Data on third trimesterMean hemoglobin (gO/100 ml) 12.4 13.4Cases with hemoglobin below 12(%) 36 4.5Mean serum iron (/ag/l1O ml) 97.3 121.0Cases with SFe below 60 yg (%) 10.5 0Mean transferrin saturation (%) 20.2 30.4Cases with saturation below 15(%) 33 0
* The iron-treated group was randomly selected fromthe same population as the controls. In the latter, nolaboratory determinations were performed in the firsttrimester, but it may be assumed that at that time theyhad values similar to those in subjects injected with1200 mg of intravenous iron dextran.
creases. During the second three months oflife, about 1.0 mg of iron a day is required toincrease hemoglobin, myoglobin, and iron-con-taining enzymes, and to compensate for externallosses estimated at 0.1 to 0.15 mg a day (52).The requirements decrease progressively fromthe third trimester on, so that in the second yearof life they are probably of the order of 0.4 to0.5 mg. The requirements of infants growingfaster than average, and particularly those whoseweight was low at birth, are even greater.
The infant's usual diet, with milk as the maincomponent, plus meat, fruits, and cereals, cannotprovide sufficient iron to meet these require-ments. Recognition of this fact has led to theuse of iron-enriched cereals, which at presentare the main source of iron in the first-year dietof infants in upper-income families (2). How-ever, many babies refuse to eat these processedfoods (2), and low-income families cannot affordthem. Moreover, the foods currently on themarket do not seem to provide sufficient iron.It has been estimated that the usual diet withiron-enriched cereals contains from 4 to 6 mg of
iron a day (45, 50). These considerations appearto be correct and significant. Guest and Brown(15) state that in 1957 iron deficiency in infancyin Cincinnati was as widespread as it had been20 years before, and Moe (33) found a highdeficiency rate in Norwegian infants. In addi-tion, several studies have shown that in infantsfrom upper-income families the blood hemo-globin and serum iron levels can be raised bysupplemental iron (33, 51).
At birth the infant has two main sources ofiron reserves: excess hemoglobin and tissuestores. The average newborn has about 20 gof excess hemoglobin, equivalent to 70 mg ofiron. This excess, which accounts for the largeblood volume and high concentration of hemo-globin in the newborn (34), is derived par-tially from placental transfusion. Early clamp-ing of the cord decreases the amount of hemo-globin excess; the difference in total hemoglobinbetween early and late clamping has been esti-mated in 4.6 to 6.0 g per kilo (36). Thus, inthe average newborn, early clamping will de-crease the hemoglobin iron reserve to less thanhalf the value mentioned above.
As to tissue stores, it may be assumed thatthe average newborn has a reserve of about80 mg. This figure is calculated by subtracting190 mg of hemoglobin and other functional ironfrom the 270 mg total iron content of the new-born (52).
Despite these reserves, it is a fact that irondeficiency is widespread not only among infantsfrom families with limited economical means,in whom definite anemia is observed with fre-quencies of even greater than 70 per cent (1, 9,23, 44), but also among those from upper-incomefamilies (Table 6 and 15, 50). The prevalenceof anemia in the latter is not as great, but ingeneral these babies still exhibit low serum ironand MCHC, high TIBC and erythrocyte proto-porphyrin (49), and increased absorption ofiron (47). The deficiency becomes apparent inthe second trimester of the infant's life (21, 47)and decreases after the age of 18 months, exceptin premature babies and those from very poor
homes, in whom it appears earlier and may
67

TABLE 6. Iron-deficiency anemia in infants (Hb below10 g)
AUTHOR AND PLA PREVALENCE SOCIOECONOMICAUTHOR AND PLACE NDTO
CONDITION
Currimbhoy:Bombay (9) 92.8 Poor
Andelman:Chicago (1) 76.0 Poor
LanzkowskyCape Town (23) 65.4 Medium (colored)
Schulman:Chicago (44) 44.0 Poor
Lanzkowsky:Cape Town (23) 29.5 Poor (white)
Guest: Cincinnati (15) 20.0 Variable
continue without improvement until as lateas three years of age (9).
Serum iron determinations in infants haveshown that the level decreases starting at birth,and that throughout infancy the mean valuesare definitely lower than those seen in adults.In infants supplemented with iron, higher valueshave been obtained, but they are still belownormal levels for adults (1, 31, 33, 49-51), whichsuggest that they are not yet iron sufficient(Figure 1). A hemoglobin level of 11 g per100 ml is not always indicative of iron suf-ficiency. In Sturgeon's series of infants given250 mg of parenteral iron (51), not one subjecthad a hemoglobin level lower than 11 g, andstill the group as a whole was probably irondeficient, since the mean serum iron and MCHCwere below the normal adult range and theTIBC was above.
D o-- IRO 6 MC/OUART MILK NO SOUO FOOS. AMARS ET AL 1959
C -IRON EEXTRAN 250 MG 1. STU..ON, . 1OSD & .....& ORAL IRON I AND Z MG/ ./DAY. STRGEON. .
E o- GO0D DI0T. NOADDITIONA-LIRON. STUROE,.I958F G GENERAL POPULATION. STUeGEO, 1954
\ r
0 1
A ; O O l lO 14 16 1O 2A 22
a GE MN 0 .T H S
FIG. 1. Mean iron serum values found in infants withand without iron supplementation
Two complications seen in markedly iron-deficient infants add to the problem: the occur-rence of microscopic but significant gastrointes-tinal bleeding (18), and the impairment of ironabsorption (22).
The current impression is that the tissuestores of the infant do not play an importantrole in the development of iron deficiency ininfancy and that the fetus gets all the iron itnecds from the mother, regardless of her ironstatus (5, 46). It would appear that furtherstudies on these aspects are needed, since it isreasonable to assume that the iron stores atbirth can make up for the difference betweeniron requirements and iron absorption duringinfancy, and that such stores probably dependon the iron nutrition status of the mother. Theamount of iron stored in the liver of stillbornshas been shown to vary greatly from one caseto another (Table 7 and 7, 14). Similarly, varia-tions in the total body iron content rangingfrom 200 to 370 mg for fetuses of similar weighthave been observed (55). Consequently, infantswith low iron stores have to depend solely ontheir diets to mect their iron requirements,
TABLE 7. Amount of iron found in liver of stillbornsweighing over 3 kg
AUTHOR SUBJECTS MG/IOOG TOTALMG
Gladstone (14) 1 72.0 140.0Gladstone (14) 1 10.6 15.6Widdowson and
Spray (55) 1 10.4 -Widdowson and
Spray (55) 1 16.7 -Widdowson and
Spray (55) 1 21.1 -Widdowson and
Spray (55) 1 25.5 -Widdowson and
Spray (55) 1 37.0 -Buchanan (7) 16 9.7-79 36-21Wainwright (53) 4 (E) 18-110Wainwright (53) 17 (B) 81-666
E= Europeans; B = Bantus* Dry weight in Wainwright's cases and wet weight
in the others
68
rP P c�-·'*Y" ir u*ruu.ni *in+iuLiu r�ur ·*a�*·nirrlr..i.·.im.

300
200 -
100
10oMOTHER
FIo. 2. Relationship between sethe mother and in the cord in 82 nsignificant relationship was observewhich became even more significaíwhen the pairs in which the moth<folate values were excluded from tl
whereas the infant born witlwill be able to withstand the d
It is most likely that theinfant's iron stores dependsstatus of the mother. The prehas found (26) a direct relserum iron values in the r
y= 130.2+ 0.316X cord (Figure 2). Earlier results reported byr= 0.263 pc:0.025
others (19, 24) are in agreement with this find-ing. More important is Wainwright's observa-tion (53) that Bantu infants have five times morestorage iron than European babies do, althoughmost Bantu females of child-bearing age do notshow histological evidence of siderosis. In fact,in over three fourths of the women under 40years of age studied by the same author the liveriron was scored as zero. In 14 Bantu stillbornsweighing more than 3 kg the mean iron contentin the liver was 0.175 per cent of the dry weight,
whereas in 4 European stillborns it was 0.035200 300 per cent. Furthermore, though in general the
rum ron values in mother's deficiencies do not influence the rederum iron values inmother-infant pairs. A cell values of the newborn, exceptions have beend in the whole group, observed. In a study of 82 mother-infant pairsnt (p less than 0.001) (26), a cord hemoglobin level below normaler had abnormally low limits was found in three instances, and in al!he analysis.e analysis. of them the infants' mothers showed megalo-
h large iron stores blastic changes in the bone marrow.
Iemands. The practical implication of these findings is
magnitude of the that among low-income families it will probablyon the nutritional be easier to prevent iron deficiency in infants byesent author's team prenatal measures than by medical supervisionlationship between of the infant. These measures, moreover, willnother and in the also benefit the mother.
REFERENCES
1. ANDELMAN, M. B., and B. R. SERED. Utilizationof dietary iron by term infants. Amer ¡ Dis Childlll: 45, 1966.
2. BEAL, V. A., A. J. MEYERS, and R. W. MCCAM-MON. Iron intake, hemoglobin, and physical growthduring the first two years of life. Pediatrics 30: 518,1962.
3. BENJAMIN, F., F. A. BASSEN, and L. M. MEYER.Serum levels of folic acid, vitamin B12, and iron inanemia of pregnancy. Amer 1 Obstet Gynec 96: 310,1966.
4. BERLIN, N. I., C. GOETSCH, G. M. HYDE, andR. J. PARSONS. The blood volume in pregnancy asdetermined by P
3 2 labeled red blood cells. SurgGynec Obstet 97: 173, 1953.
5. BOTHWELL, T. H. The diagnosis of iron defi-ciency. New Zeal Med ' 65: 880, 1966.
6. BOTHWELL, T. H., and C. A. FINCH. Iron Me-tabolism. London, J & A Churchill, 1962.
7. BUCHANAN, W. M. Storage iron in livers and
spleens of Rhodesian African children. Trans RoySoc Trop Med Hyg 62: 353, 1968.
8. CATON, W. L., C. C. ROBY, D. E. REID, R. CAS-
WELL, C. J. MALESTKOX, R. G. FLUHARTY, and J. G.GIBsoN, II. The circulating red cell volume andbody hematocrit in normal pregnancy and puerpe-rium. Amer ! Obstet Gynec 61: 1207, 1951.
9. CURRIMBHOY, Z. E. Iron malnutrition in Bom-bay. Indian ¡ Child Health 12: 800, 1963.
10. DE LEEUW, N. K. M., L. LOWENSTEIN, andY. S. HsIEH. Iron deficiency and hydremia in nor-mal pregnancy. Medicine 45: 291, 1966.
11. EVERS, J. E. M. Diagnosis, frequency andclinical implications of iron-deficiency in pregnancy.Abstracts of Papers Presented at the Xl Congress ofthe International Society of Haematology (Sydney,1966), p. 49.
12. GERRIT5EN, T. H., and A. R. P. WALKER. Theeffect of habitually high iron intake on certain blood
69
:·

values in pregnant Bantu females. ! Clin Invest 33:23, 1954.
13. GILES, C., and H. BURTON. Observations onprevention and diagnosis of anaemia in pregnancy.Brit Med 1 2: 636, 1960.
14. GLADSTONE, S. A. Iron in the liver and in thespleen after destruction of blood and transfusion.Amer 1 Dis Chiid 44: 8i, i932.
15. GUEST, G. M., and E. W. BROWN. Erythrocytesand hemoglobin of the blood in infancy and child-hood. III. Factors in variability; statistical studies.Amer ] Dis Child 93: 486,1957.
16. HAGBERG, B. The iron-binding capacity ofserum in infants and children. Acta Paediat 42,Suppl 93: 589, 1953.
17. HASKINS, D., A. R. STEVENS, S. FINCH, andC. A. FINCH. Iron stores. ¡ Clin Invest 31: 343,1952.
18. HOAG, M. S., R. O. WALLERSTEIN, and M.POLLYCOVE. Occult blood loss in iron deficiencyanemia in infancy. Pediatrics 27: 199, 1961.
19. HOFF-JORGENSEN, E., H. P. O. KRISTENSEN,and B. Z. CHRISTIANSEN. Simultaneous determina-tions of hemoglobin, iron, vitamin B12 and folicacid levels in the blood of mothers and newborninfants. Acta Paediat Suppl 140: 117, 1963.
20. HUNTER, C. A. Iron deficiency anemia inpregnancy. Surg Gynec Obstet 110: 210, 1960.
21. JosEPHs, H. W. Iron metabolism and the hypo-chromic anemia of infancy. Medicine 32: 125, 1953.
22. KIMBER, C., and L. R. WEINTRAUB. Malab-sorption of iron secondary to iron deficiency. Ab-stracts of Simultaneous Sessions, Xll Congress ofthe International Society of Haematology (NewYork, 1968), p. 86.
23. LANZKOWSKY, P. Hematologic values inhealthy infants and children in three racial groupsin Cape Town. ! Pediat 61: 620, 1962.
24. LAPAN, B., and M. M. FRIEDMAN. Blood studiesin normal pregnancy and the newborn. Amer !Obstet Gynec 76:96,1958.
25. LAYRISSE, M. The aetiology and geographicincidence of iron deficiency. Proceedings, XI Con-gress of the International Society of Haematology;Plenary Sessions (Sydney, 1966), p. 95.
26. LORíA, A., L. SANCHEZ-MEDAL, J. LABARDINI,
J. SOBERÓN, and S. KARCHMER. Comparación entreel estado nutricional de la madre y del recién nacido.Gac Med Mex 99: 229, 1969.
27. LOURDENADIN, S. Pattern of anemia and itseffects on pregnant women in Malaya. Med 1Malaya 19: 87, 1964.
28. LUND, C. J. Studies on the iron deficiencyanemia of pregnancy. Amer ¡ Obstet Gynec 62: 947,1951.
29. LUND, C. J., and J. C. DONOVAN. Blood vol-ume during pregnancy. Amer / Obstet Gynec 98:393, 1967.
30. MAYET, F. G. The anemia of pregnancy inDurban. S Afr 1 Obstet Gynec 4: 15, 1966.
31. MARSH, A., H. LONG, and E. STIERWALT.Comparative hematologic response to iron forti-fication of a miik formula for infants. Pediatrics24: 404, 1959.
32. McGREGOR, 1. A., K. WILLIAMS, W. Z. BILLE-wIcz, and A. M. THOMSON. Haemoglobin concen-tration and anemia in young West Africans (Gam-bian) children. Trans Roy Soc Trop Med Hyg 60:650, 1966.
33. MOE, P. J. Iron requirements in infancy.Acta Paediat Suppl 150: 11-67, 1963.
34. MOLLISON, P. L. Blood Transfusion in Clini-cal Medicine. Oxford, Blackwell Scientific Publ.,1951, p. 54.
35. MORGAN, E. H. Plasma iron and hemoglobinlevels; the effect of oral iron. Lancet 1: 9, 1961.
36. Moss, A. J., and M. MONSET-COUCHARD. Pla-cental transfusion; early versus late clamping of theumbilical cord. Pediatrics 40: 109, 1967.
37. OSGOOD, E. E. Development and growth ofhematopoietic tissues with a clinical practical methodof growth analysis. Pediatrics 15: 733, 1955.
38. PAN AMERICAN HEALTH ORGANIZATION. Nutri-tional Anemias in Latin America and the Caribbean;Report of the PAHO Scientific Group on Researchin Nutritional Anemias (Caracas), August 1968.
39. PRITCHARD, J. A., and R. A. MASON. Ironstores of normal adults and replenishment with oraliron therapy. IAMA 190: 897, 1964.
40. PRITCHARD, J. A. Changes in blood volumeduring pregnancy and delivery. Anesthesiology 26:393, 1965.
41. RAMOS GALVÁN, R., and H. LUNA-JASPE. Soma-tometría. Bol Med Hosp Inf (Mex) 21, supl. 1; 143,1964.
42. SÁNCHEz-MEDAL, L., and M. PATRÓN. Pato-genia y terapéutica de la uncinariasis. Rev InvestClin (Mex) 4: 177, 1952.
43. SANCHEZ-MEDAL, L., J. LABARDINI, M. A. PÉREZ
U., and A. LORiA. Anemia en el embarazo. GacMed Mex 97: 1335, 1967.
44. SCHULMAN, 1. Iron requirements in infancy.¡AMA 175: 118,1961.
45. SCOTT, D. E., and J. A. PRITCHARD. Iron defi-ciency in healthy young college women. ¡AMA199: 147, 1967.
46. SMITH, C. H. Blood Diseases in Infancy andChildhood. St. Louis, C. V. Mosby Co., 1966.
47. SMITH, N. J., and J. SCHULZ. The absorptionof iron in infants and children. In R. O. Wallerstein
70

and S. R. Mettier (eds.), Iron in Clinical Medicine,Berkeley, Univ. of California Press, 1958, p. 65.
48. STEARNS, G., and J. B. McKINLEY. The con-servation of blood iron during the period of physio-logical hemoglobin destruction in early infancy. !Nutr 13: 143, 1937.
49. STURGEON, P. Studies of iron requirements ininfants and children. Pediatrics 13: 107, 1954.
50. STURGEON, P. Iron metabolism. Pediatrics 18:267, 1956.
51. STURGEON, P. Studies of iron requirements ininfants and children. In R. O. Wallerstein and S. R.Mettier (eds.), Iron in Clinical Medicine, Berkeley,Univ. of California Press, 1958, p. 183.
52. UNITED STATES, COUNCIL ON FOODS AND NU-TRITION, COMMITTEE ON IRON DEFICIENCY. Iron de-ficiency in the United States. /AMA 203: 119, 1968.
53. WAINWRIGHT, J. Siderosis in the African. SAfr ¡ Lab Clin Med 3: 1, 1957.
54. WEINFELD, A. Storage iron in man. Acta MedScand Suppl 427, 177, 1965.
55. WIDDOWSON, E. M., and A. M. SPRAY. Chemi-cal development in utero. Arch Dis Child 26: 209,1951.
56. WORLD HEALTH ORGANIZATION. NutritionalAnemias; Report of WHO Meeting of Investigators.Geneva, 1967.
71

THE RELATiONSHiP BETWEEN HOOKWORM iNFECiIONAND ANEMIA
Marcel Roche
In the tropical and subtropical zones, whereboth hookworm infection and iron deficiencyare widespread, cases both of hookworm with-out anemia and of anemia without hookwormcan be readily found. That hookworm may bea major cause of iron-deficiency anemia can bestated on the basis of thrce lines of evidence:(1) the demonstrated blood and iron loss causedby hookworm; (2) the statistically significantcorrelation between circulating hemoglobinlevels and hookworm load; and (3) the slowrise in circulating hemoglobin, without addediron, when hookworms are removed and thepatient remains on his usual diet. The conclu-sions arrived at in the second and third linesof evidence are only known to apply in certainrural areas of Venezuela. In other countries,where a different nutritional status may prevail,the deductions are only tentative.
Blood and iron loss caused by hookworm
Attempts at estimating blood loss by isotopicand nonisotopic methods have been reviewedby Roche and Layrisse (24). Hahn and Offutt(14) were the first to use isotopic methods inanimals. Two infected dogs received Fe59-taggederythrocytes from donor dogs, and the declinein circulating radioactivity during periods ofconstant hematocrit reading was subsequentlydetermined. Gerritsen et al. (12) were the firstto use an isotopic method in man (Fe59 ). Sincethen, a number of authors have utilized eitherFe5 9 or Cr5 ' (26). Daily blood loss by Necator
is of the order of 0.03 ml per worm, whileAncylostoma duodenale gives losses of the orderof 0.15 to 0.4 ml.
Since the review by Roche and Layrisse (24),several additional reports have appeared on bloodloss by hookworm. Bloch and Ruiz (2) deter-mined losses by means of Cr5 ' in ten patients(N. americanus) and Fe59 in eleven (N. ameri-canus and A. duodenale). The average loss was0.1 ml per parasite, with wide variations. Rep(23) studied blood loss due to Ancylostomaceylanicum by means of Cr51 in two dogs andascertained an average daily loss of 0.0137 mlper worm. Mahmood (18) found a daily bloodloss of 0.032 ±0.035 ml per worm in twentypatients infected with N. americanus and 0.152±0.124 in ten patients infected with A. duode-nale. Georgi (10, 11) utilized whole-body count-ing for the measurement of blood loss due toHaemonchus contortus and to A. caninum (11)and found considerable losses due to these para-sites. Miller (20) reported a daily blood lossfor Ancylostoma caninum of 0.08 to 0.20 mlper worm for light infections and 0.01 to 0.09for heavy infections. Worms from irradiatedlarvae produced worms that caused little or noblood loss, and Uncinaria stenophala and Ancylo-stoma braziliense caused little or no blood loss.In two chimpanzees, Ancylostoma duodenalecaused daily blood losses of 0.04 and 0.02 ml,respectively, per worm.
It is abundantly clear, therefore, that hook-worm gives rise to blood loss, and therefore to
72

iron loss. By tagging circulating red blood cellssimultaneously with Fe5` and Cr51, Roche andP&érez-Giménez (25) showed that an average of44.1 per cent of the iron lost into the intestine ofinfected subjects was probably reabsorbed andreutilized. Layrisse et al. (16) found a 36.3 percent reabsorption. The average on all subjectsreported in the aforementioned two reports, plusfifteen more subjects (24), was 39.2 per centreabsorption of intestinal iron loss. In spite ofthis reabsorption, which tends to reduce the netloss, iron loss is still considerable, as may be seenin Table 1.
Of the two isotopes utilized, Cr 5 and Fe59,the former gives a more accurate and directidea of actual losses, since iron is in part reab-sorbed. The figures given for iron loss calcu-lated from Cr51 measurements are probablytoo high, and should be reduced by approxi-mately one third.
The loss of iron for a given amount of bloodvaries, of course, with the hemoglobin level.Eventually, as this level decreases, an equilibriumis established, at which point loss equals intake.To obtain an idea of the magnitude of suchloss, it may be assumed that a subject infectedwith 500 hookworms and initially with a normalhemoglobin level will have a daily intestinalblood loss of the order of 16 ml. This means,in the presence of normal circulating hemo-globin, a daily iron loss of 7.9, and, if reab-sorption is taken into account, a loss of approxi-mately 5.0 mg.
There is a rough but significant correlationbetween total blood loss and number of eggsin the stools, which has been determined to be2.74+1.50 ml/1000 eggs per gram of stool byRoche et al. (26) in twenty-one cases; 2.59 byBloch and Ruiz (2) in ten cases; and 2.14+ 1.01by Martínez-Torres et al. (19) in fifty cases.
Correlation between hookworm load and anemia
The association between hookworm and ane-mia was mentioned as early as 1880 (22), butthe matter was not studied thoroughly until thetwenties when Darling et al. (6, 7), by relatinghookworm load to hemoglobin levels, showed
that these were negatively correlated, in ageneral manner. The standardization of amethod to count hookworm eggs in the stools(27) made the matter easier, and a number ofstudies have been carried out in that directionsince then, several of them with statisticalanalysis (24). Of the 32 papers reviewed byLayrisse and Roche, 16 reported a definite cor-relation, and the rest showed uncertain correla-
tion or none at all; 14 of the papers containedstatistical analysis, and all of these but one
(Chernin, 4) reported significant correlation.
In making a statistical analysis of the cor-
relation between hookworm load and anemia,
a sufficient number of cases must be studied,
since variations in individual subjects may be
extreme. This figure will depend on the
number of severe cases in the series and on the
TABLE 1. Iron loss in human hookworm infection studied by isotopic methods *
ISOTOPE NO. OFAUTHOR YEAR USOTPE NO. OF IRON LOSSES (MG/DAY)
UsED SUBJECTS
Gerritsen et al. 1954Roche et al. 1957Ventura et al. 1957Roche et al. 1959Nabekura 1959Tasker 1961Layrisse et al. 1961Aly et al. 1962Farid et al. 1965
* From Roche and Layrisse (24)
Fe""Cr`e'c~6FewFewCr"CrIFer'
Cr",CEl
3217
144720113912
3.4-6.2-8.31.2-29.1
0.85-6.84Average: 5.25 Range: 1.80-16.24
0.8-7.51-40 (calculated on basis of "normal hemoglobin levels")
2.55-7.91Average: 3.35
Average: 6.06 Range: 3.56-9.94
73

background of iron balance in the community.In addition, the series studied should includea sufficient spectrum of both severe and lightinfections. Since light infection may not affecthemoglobin values, a relationship between loadand anemia should not be expected when onlysmnal loads are present. Similary, -when oily
small samples of cases with large loads areanalyzed (13), no relationship may be apparentbecause of the sample size and the many vari-ables involved.
More recently, Topley (30, 31) found astatistically significant negative correlation be-tween hemoglobin and hookworm load in Gam-bian men, but not in women-possibly becauseother sources of iron loss (pregnancy, lactation,menstruation) in women masked the mildereffect of hookworm.
In most studies, small loads of worms haveno apparent effect on hemoglobin. For example,Carr (3) and Stoll and Tseng (28) found thatthe drop in hemoglobin values began when theload was greater than 1000 eggs per gram ofstool; Layrisse and Roche (17) found the"break" at 2000 eggs per gram in women andchildren, and 5000 eggs per gram in adult men.Figure 1 gives the relationship curve found byLayrisse and Roche in their rural communitiesin Venezuela.
Layrisse and Roche (17) attempted to makea general estimate of the contribution of hook-worm as an anemia-producing factor in givenrural communities. They studied two com-
munities, geographically close to each other,
one with hookworm and the other practically
without. The results are shown in Table 2.
It is presumed that the difference in anemia
Eççs per g. of feces
FIG. 1. Relationship between hemoglobin levels andseverity of hookworm infection in various Venezuelanrural communities. The number of cases in each group isshown in parentheses. Vertical lines indicate one standarddeviation. The differences between the negative groupand both groups with less than 2000 eggs/g of feces arenot statistically significant. In all groups with more than2000 eggs/g of feces, the difference with the negativegroup is significant (P<0.01). From Layrisse and Roche(17).
prevalence among the noninfected groups be-
tween one area and the other is due to an
alimentary factor, probably the quantity of avail-able food iron. The difference between the
prevalence of anemia among the infected and
noninfected groups in the endemic zone pre-
sumably indicates the percentage of individuals
TABLE 2. Prevalence of anemia in two rural Venezuelan communities *
ZONE CLIMATENUTRITIONAL
STATE
NO. OF
SUBJECTS
PREVALENCE NONIN-INFECTED
ANEMIA FECTED
Endemic Hot humid Fair; little animal 1142 Abundant 46% 30%protein
Nonendemic Hot humid Fair; good animal 482 No 16%protein (fish)
* From Layrisse and Roche (17)
74

TABLE 3. Iron utilization from food measured in anemic subjects by the increase of total circulating hemoglobin andiron loss due to hookworm infection *
IRON LOSS TOTALHEMOGLOBIN
DUE TO IRON~~~~~~AGE~~IRON HOOKWORM USED
AGE INITIAL HEMOGLOBIN FINAL HEMOGLOBIN INCREASECASES YEARSIN (G/100) (T00 (TOTAL G) (NC TON (MG/DAY) t
A B A+B
Children from 2 to 6 years
1. E.A. 6 10.5 126 12.0 183 0.34 3.36 3.702. I.A. 6 8.6 89 14.4 152 0.37 1.34 1.71
Children from 7 to 14 years
1. L.M. 10 11.1 166 15.5 272 0.63 0.53 1.162. J.M.C. 9 10.5 164 12.6 246 0.49 0.20 0.693. J.R.V. 7 11.6 155 11.9 187 0.19 0.10 0.294. R.B. 9 8.5 113 10.6 179 0.39 1.11 1.505. E.G. 8 11.5 142 12.4 218 0.45 0.00 0.456. L.V. 12 11.7 205 13.3 311 0.63 2.54 3.177. A.M. 7 10.9 142 10.6 165 0.14 1.09 1.238. C.R.P. 7 8.0 130 11.4 237 0.54 1.14 1.689. C.R.M. 13 9.6 206 11.3 316 0.55 3.55 4.10
Average 10.4 158 12.2 237 0.45 1.03 1.25
Men from 15 to 45 years
1. P.A. 18 4.6 151 11.4 437 1.70 1.02 2.722. D.R.C. 38 12.5 422 15.2 494 0.42 0.18 0.60
* From Layrisse (15)t Minimum estimate
75

with anemia due to hookworm as a paramountfactor (roughly one third of the cases).
It has thus been abundantly shown, in anumber of communities, that groups with vary-ing degrees of hookworm infection have anaverage level of circulating hemoglobin signifi-canly below that of uninfected groups :ivingunder similar conditions in the same community.Such groups could properly be said to exhibithookworm anemia.
Rise in circulating hemoglobin afterremoval of the worms
Cruz (5) emphasized that hemoglobin re-sponded rapidly to the administration of ironin iron-deficient hookworm-infected subjects,whereas patients in whom hookworms had beenremoved but to whom iron was not given didnot respond in such a fashion. An examinationof these data, however, shows clearly that suchcases do respond, albeit very slowly. Incrementsin circulating hemoglobin were measured overa period of 365 days in thirteen endemic-zoneanemic subjects, in whom repeated worming wasperformed, while they remained in their usualhabitat and consumed their usual diet (15).The results are seen in Table 3. The increasein hemoglobin iron ranged from 0.14 to 1.70 mga day but, in addition, there was a fecal ironloss, due to residual infections or reinfections,in spite of repeated worming. From egg counts,this fecal iron loss could be estimated to rangefrom 0.10 to 3.55 mg a day, so that food ironutilization was probably at least of the orderof 0.29 to 4.10 mg a day-values not unlikethose that may be calculated from the datapresented by Cruz (5) and those given byFinch et al. (9) in phlebotomized subjects with
REFER
1. ALY, A. M., F. SALLAM, and A. M. ELSAADANY.Haematological findings in Ancylostoma anemia. ¡Egypt Med Ass 45: 1022-1028, 1962.
2. BLOCH, M., and J. C. Ruiz. Infección unci-nariásica; pérdida sanguínea intestinal y eritrociné-tica. Sangre 11: 279-291, 1966.
3. CARR, H. P. Observations on hookworm dis-ease in Mexico. Amer / Hyg 6: 42-61, 1926.
Increose of the circuloting hemoglobinfrorm food iron ofter vermifuge
PA. 15 yeor old mole
Hookwormegg coun
IPWO/g feesEstimoted
fecal ron lossmg./day
Vernifuge
13
C)\
126 105 98 3.1 2.3
24 24 21 07 1.0
1 I
4.1 5.0
22 26
5 *
O. 2c0 400 7600 8 ,000 1 1200Doys ofter first vermifuge
FIG. 2. Response of circulating hemoglobin to the ad-ministration of vermifuge. The values are near normalafter 3 years even though there is continued fecal bloodloss. Iron utilized from food for hemoglobin synthesiswas calculated to be 2.7 rng/day. The patient, P.A., isa 15-year-old male from a Venezuelan rural area. Heremained in the same locality throughout the study andconsumed his usual diet. From Roche and Layrisse (24).
polycythemia vera. The fact that hemoglobinrises to, or at least towards, normal after worm-ing, on local diet only and despite residual infec-tions, suggests that in the absence of hookworminfection the food iron in the area studied(Pequín, Venezuela) should be adequate tosustain hemoglobin levels.
Figure 2 shows the hemoglobin curve in onepatient in whom the study was carried out fora longer time. The curve may be seen to risefrom 4.5 to 13.0 g/100 ml over the 1200 daysduring which the patient was studied.
ENCES
4. CHERNIN, E. Problems in tropical public healthamong workers at a Jute mill near Calcutta. IV.Hemoglobin values and their relation to the inten-sity of hookworm infections in the labor force. Amer¡ Trop Med 3: 338-347, 1954.
5. CRUZ, W. O. Patogenia da anemia na Ancy-lostomose. III. Modificaçoes hemáticas e orgánicas,provocadas pelas simples eliminaq6es do Ancylos-
76

tomo e do Necator, em individuos fortemente ane-miados. Mem Inst Oswaldo Cruz 29: 487-540, 1934.
6. DARLING, S. T. The hookworm index and masstreatment. Amer ¡ Trop Med 2: 397-447, 1922.
7. DARLING, S. T., M. A. BARBER, and H. P.HACKER. Hookworm and Malaria Research in Ma-laya, lava, and the Fi¡i Islands. New York, Inter-national Health Board, The Rockefeller Foundation,1920.
8. FARID, Z., J. M. NICHOLS, S. BASSILY, and A. R.SCHUBERT. Blood loss in pure Ancylostoma duode-nale infection in Egyptian farmers. Amer 1 TropMed 14: 375-378,1965.
9. FINCH, S., D. HASKINS, and C. A. FINCH. Ironmetabolism; hematopoiesis following phlebotomy;iron as a limiting factor. 1 Clin Invest 29: 1078-1086, 1950.
10. GEORGI, J. R. Estimation of parasitic bloodloss by whole-body counting. Amer ¡ Vet Res 25:246-250,1964.
11. GEORGI, J. R. Estimation of erythrocyte lossin hookworm infection by whole-body 59Fe count-ing. 1 Parasit 54: 417-425, 1968.
12. GERRITSEN, T., H. J. HEINZ, and G. H. STAF-FORD. Estimation of blood loss in hookworm infes-tation with Fe 59; preliminary report. Science 119:412-413,1954.
13. GORDON, R. M. The effect of Ancylostoma,Ascaris, and Trichiuris infections on the health ofthe West African native. Amer 1 Trop Med Parasit19: 419-460, 1925.
14. HAHN, P. F., and E. P. OFFUTT. A methodfor the study of blood loss in hookworm infestation.Science, 110: 711-713,1949.
15. LAYRISSE, M. Ingesta y absorci6n de hierroalimentario en campesinos venezolanos. Acta CientVenez Supl 3: 134-152, 1967.
16. LAYRISSE, M., N. BLUMENFELD, and M. ROCHE.
Hookworm anemia; iron metabolism and erythro-kinetics. Blood 18: 61-72, 1961.
17. LAYRISSE, M., and M. ROCHE. The relationshipbetween anemia and hookworm infection; results ofsurveys of rural Venezuelan populations. Amer 1Hyg 79: 279-301, 1964.
18. MAHMOOD, A. Blood loss caused by helminthicinfections. Trans Roy Soc Trop Med Hyg 60: 766-769,1966.
19. MARTíNEz-ToRRES, C., A. OJEDA, M. ROCHE,
and M. LAYRISSE. Hookworm infection and intes-tinal blood loss. Trans Roy Soc Trop Med Hyg 61:373-383,1967.
20. MILLER, T. A. Pathogenesis and immunity inhookworm infection. Trans Roy Soc Trop Med Hyg62: 473-485, 1968.
21. NABEKURA, M. Kochu-sho no byotai-seiri nikansuru kenkyu; humben-nai shukketsu-ryo nitsuite. Kyushu Ketsueki Kenkyu Dokokaishi 9:706-721,1959.
22. PERRONCITO, E. Osservazioni elmintologicherelative alla malattia sviluppatasi endemica neglioperai del Gottardo. Riv Accad dei Lincei 7: 381-432, 1880.
23. REP, B. H. Pathogenicity of Ancylostoma bra-ziliense. IV. Blood loss caused by the worms in theprepatient period. Trop Geogr Med 18: 329-352,1966.
24. ROCHE, M., and M. LAYRISSE. The nature andcauses of "hookworm anemia." Amer 1 Trop Med15: 1031-1102, 1966.
25. ROCHE, M., and M. E. PíREz-GIM.NEZ. Intes-tinal loss and reabsorption of iron in hookworm in-fection. 1 Lab Clin Med 54: 49-52, 1959.
26. ROCHE, M., M. E. PíREZ-GIMÉNEZ, M. LAY-RISSE, and E. Di PRISCO. Study of urinary and fecalexcretion of radioactive chromium Cr 5 ' in man;its use in the measurement of intestinal blood lossassociated with hookworm infection. 1 Clin Invest36: 1183-1192, 1957.
27. STOLL, N. R. Investigations on the control ofhookworm disease. XVIII. On the relation betweenthe number of eggs found in human feces and thenumber of hookworms in the host. Amer l Hyg 3:156-179,1923.
28. STOLL, N. R., and H. W. TSENC. The severityof hookworm disease in a Chinese group as testedby hemoglobin readings for the anemia and eggcounts for the degree of the infestation. Amer 1 Hyg5: 536-552, 1925.
29. TASKER, P. W. G. Blood loss from hookworminfection. Trans Roy Soc Trop Med Hyg 55: 20-25,1961.
30. TOPLEY, E. Common anaemia in rural Gam-bia. 1. Hookworm anaemia among men. Trans RoySoc Trop Med Hyg 62: 579-594, 1968.
31. TOPLEY, E. Common anaemia in rural Gam-bia. II. Iron deficiency anaemia among women.Trans Roy Soc Trop Med Hyg 62: 595-601, 1968.
32. VENTURA, S., U. MARINONI, G. PURICELLY,
L. SUARDI, and G. MATIOLO. Studio analitico delricambio del ferro in condizioni normali e pato-logiche; ricerche cliniche condotte con l'ausilio delFe59 . III. II ricambio del ferro nei paziente affettida anemia ferrocarenziale. Haematologica 42: 563-650,1957.
77
PREVENTION OF IRON-DEFICIENCY ANEMIA
Joginder Chopra
Introduction
Nutritional anemia has long been considereda public health problem in Latin America andthe Caribbean-a fact that was reiterated at thefirst and second meetings of the PAHO Tech-nical Advisory Committee on Nutrition in 1962and 1968, respectively (5). Moreover, the FAO/WHO Joint Committee at its various meetings,beginning in 1949 (7), has stressed the urgencyfor investigation of the etiology and preventionof anemias, in view of the widespread preva-lence of this condition in the developing coun-tries of the tropical and subtropical zonesthroughout the world.
Although deficiency of several essential nutri-ents may result in anemia, those deserving pri-mary consideration are iron, folate, and vitaminB12. It is the general consensus of opinion thatdietary deficiency, poor absorption and utiliza-tion, physiological requirements, or increasedlosses of these nutrients are the underlyingcauses of most of the anemias in the world.Associated parasitism may enhance the signifi-cance of one or more of these factors.
In the prevention of iron-deficiency anemia,several approaches may be considered. Long-term goals can be achieved through programsdesigned to improve the dietary intake of ironby means of education and increased availabilityof iron-rich foods, and through environmentalsanitation campaigns to control parasitism as-sociated with blood loss. Immediate and short-term measures may consist of iron supplemen-tation for vulnerable groups, such as school-
children and pregnant and lactating women, aswell as enrichment and fortification of foodsconsumed by infants and preschoolers and byall segments of the population. Long-termprograms such as sanitation, education, andfood production must be supplemented by moreimmediate methods, and, undoubtedly, alongwith the distribution of prophylactic iron to thevulnerable groups, the fortification of foods withiron is an urgent need in most problem areas.
Long-term programs
Dietary measures
The optimum dietary iron requirement maybe defined as the amount and kind of food ironthat will make it possible for absorption to coverphysiological losses and demands in all subjectsunder al' phys .:^l-:l c tons, includinggrowth and pregnancy.
In areas where iron-deficiency anemia iscommon, an increase in iron intake throughnatural foods is desirable. This alone will notovercome anemia, but it will help to maintainnormal hemoglobin levels once other measureshave corrected the established disease. It isdifficult to change the dietary habits of people,but nutrition education programs carried outin maternal and child health centers and schoolsand among other groups over many years havebeen shown to produce permanent improvement.Increasing the availability of iron-rich foods byexpanding their production and marketing andby reducing their price will help to induce thepeople to consume them in greater quantity.
78

Data already presented at this meeting haveshown that the absorbability of iron in differentfoods varies considerably (3). In assessing thenutritional sufficiency of dietary iron, it is neces-sary to know not only the total amount of ironin the diet but also the relative contribution ofiron from different foodstuffs and the possibleeffect of one food on the absorption of ironfrom another. Attention should also be drawnto unsatisfactory cooking practices, which mayresult in iron loss and/or decreased availability.
In many countries in which iron deficiencyis common the diets are also deficient in othernutrients. Action programs should thereforebe directed toward an over-all improvement ofthe quality of these diets, particularly with re-spect to protein.
Environmental sanitation
Control or elimination of an underlying dis-ease process such as hookworm, trichiuris infec-tion, or schistosomiasis is highly desirable. Inthis respect, emphasis should be placed on theinterruption of transmission of parasites byimprovement of environmental sanitation andpersonal hygiene practices, as well as by effec-tive treatment of the infected persons. Thesemeasures should be intensified, particularly inrural areas where there is a high prevalence ofhookworm infection. Past experience has shown,however, that this is not an easy task; it takesa long time and results cannot be expected tobe spectacular. In general, the effectiveness ofany sanitation program is intimately linkedto raising the standard of living of the popu-lation.
Short-term measures
Iron supplementation for pregnant andlactating women
There is a high incidence of iron deficiencyamong pregnant and lactating women through-out the world, and from consideration of ironbalance it is clear that the requirements ofpregnancy cannot be met by diet alone or madeavailable from stores. Iron intake during thenonpregnant state should be adequate to allow
an accumulation of iron stores that can be drawnupon in the last trimester of pregnancy and dur-ing lactation. Pregnant women will derive greatbenefit from a routine supplement of a ferroussalt containing at least 60 mg of elemental iron,given once daily during the second and thirdtrimesters of pregnancy and the first six monthsof lactation (8). Such treatment will supplyiron for both the mother and the infant, thusproviding for the needs of the two groups thatin any community will have increased require-ments for iron.
Iron supplementation for schoolchildren
Studies have shown that improvement inhemoglobin levels can be obtained in childrenheavily infected with parasites by the dailyadministration of small amounts of iron for aspecified period of time. Once the regimen isdiscontinued, however, their hemoglobin levelsreturn to pretreatment status within severalmonths.
In areas where surveys on schoolchildrenshow a high prevalence of anemia and parasiticinfection, a combined program of dewormingand treatment, with distribution of 30 mg ofelemental iron per day in ferrous form through-out the school year, may provide good resultsas an emergency action (4). An evaluation ofthe cost/effectiveness of this type of programshould always be carried out in a pilot area,however, before it is implemented on a nationalscale.
Enrichment and fortification of /oodstufús
In the opinion of the PAHO/WHO expertgroups (3), enrichment of food with iron is onepotentially effective method of preventing irondeficiency. Iron enrichment of wheat flour aswell as food for infants is currently practiced insome countries, but as yet little information isavailable concerning the effectiveness of thisprocedure.
Before a food fortification program is under-taken, it is essential that the problem of anemiabe carefully investigated. The level of existingiron intake should be assessed, and the foodsmost suitable for enrichment should be selected,
79

taking into consideration their current use by thepopulation of the region or country in question.The selection of a suitable iron compound as anenriching agent will involve studies on theabsorbability of the enriched foods, the stabilityof the enriched product, and the cost and eco-nomics of production and marketing, as weil asits acceptability. Pilot trails should be conductedto determine its effectiveness before it is appliedon a national scale.
The choice of iron enrichment level will de-pend on the quantity of the food ordinarilyconsumed. The level should be adjusted soas to afford at least partial protection for vul-nerable groups without exposing the others tothe risk of excessive iron stores. While an en-richment program is being carried out, the hema-tological survey must be continued in order tocheck on the program's effectiveness, as indi-cated by the attainment and stabilization ofnormal hemoglobin levels by the majority of thepopulation at risk.
This stepwise development is essential toensure a program that can be recommendedwith confidence for adoption by governments.
In general, food-enrichment programs shouldbe directed toward all segments of the popula-tion and tailored to the existing levels of de-ficiency. Special attention should be given toreaching economically deprived groups and chil-dren, both by the fortification of infant for-mulas and by the development of high-proteinfoods for preschoolers.
The recent (1968) recommendation of theU.S. National Research Council (16) andINCAP (2) for iron intake is 15 mg a dayduring the first year of life. This amount isdifficult to achieve with any diet that is notfortified with iron, and many authorities inthe field have suggested routine prophylaxis ofsome kind.
The most simple and economic method, aswell as the most effective, is the incorporationof iron into formulas and/or special high-pro-tein foods for infants and preschoolers, espe-cially in underprivileged groups. Several studieson the use of iron-fortified formulas have shownsatisfactory results, and good utilization of ironhas been demonstrated even in the earliestmonths of life. In a recent study it was dem-onstrated that the administration of 12 mg ofiron per quart of reconstituted formula, begin-ning at birth or at three months of age, reducedthe incidence of anemia from 76 to 9 per cent
(1).
Conclusion
The prevention of iron-deficiency anemia re-mains a continuing challenge to the publichealth worker in the Western Hemisphere untilsuch time as simpler and more effective tech-niques are developed to improve population ironstores and to meet the special requirements ofvulnerable groups.
REFERENCES
1. ANDELMAN, M. B., and B. R. SERED. Utilizationof dietary iron by term infants. Amer 1 Dis Child111: 45-55, 1966.
2. INSTITUTO DE NUTRICIÓN DE CENTROAMÉRICA Y
PANAMÁ. Recomendaciones Nutricionales Diarias.(Unpublished)
3. LAYRISSE, M., J. D. COOK, C. MARTINEZ, M.ROCHE, I. N. KUHN, R. B. WALKER, and C. A. FINCH.
Food iron absorption; a comparison of vegetableand animal foods. Blood 33: 430-443, 1969.
4. PAN AMERICAN HEALTH ORGANIZATION. Nutri-
tional Anemias; Report of a PAHO Scientific Ad-visory Group. In press.
5. TECHNICAL ADVISORY COMMITTEE ON NUTRI-
TION. Report to the Director. March 1968. (Un-published)
6. UNITED STATES, NATIONAL ACADEMY OF
SCIENCES, NATIONAL RESEARCH COUNCIL. Recom-mended Dietary Allowances; a Report of the Foodand Nutrition Board. 7th ed. Washington, D. C.,1968.
7. WORLD HEALTH ORGANIZATION. FAO/WHOIoint Expert Committee on Nutrition. Geneva, 1967.(Technical Report Series, No. 377)
8. WORLD HEALTH ORGANIZATION. NutritionalAnemias; Report of a WHO Scientific Group. Ge-neva, 1968. (Technical Report Series, No. 405)
80
GENERAL DISCUSSIONModerator: We shall now have a discussion
of the papers we just heard.
Dr. Cohen: I would like to ask my clinicalfriends here what is "clinically" wrong withan adult male who has 12 grams of hemoglobinand four million red cells.
Moderator: My impression is that little isknown about the influence of anemia on be-havior, particularly in borderline anemias. Infact, I remember a patient that walked intothe hospital with 1.5 grams of hemoglobin. Weasked him what was wrong with him and hesaid he didn't feel particularly bad. I think agreat deal of old-fashioned human physiologyand psychology come into the picture, andfurther research needs to be done in this area.
Dr. Cohen: I am concerned that we mayhave created the appearance of a widespreadanemia by fixing on a level of hemoglobin andred cell count that probably was establishedinitially by using the population of medicalstudents, physicians, nurses, and so forth as astandard.
Returning to my previous question, I would
like to know if you can diagnose a man with12 grams of hemoglobin and four million red
cells as having "anemia" without knowing this
information from the laboratory. Aside from
the fact that he may have lost a little color,what is wrong with such a person, and are wereally talking about anemia as a significant clini-
cal factor when we are dealing with levels ashigh as this?
Dr. Moore: It is certainly conceivable that
for a given individual such values would benormal. The only way to make reasonablycertain would be to correct any suspected de-ficiency or to treat successfully any disease dis-
covered, and then determine whether erythrocytevalues rise.
Your question asks what harm really resultsto an individual who has a hemoglobin level of12 grams when the normal level for that personmight be 15 grams per 100 ml. There is no
convincing evidence that his health or perform-ance is impaired by a difference of that mag-nitude.
Dr. Finch: I think we get into a problemif we approach deficiency states through anemia.On the one hand, you can raise the questionof what is adequate or optimum iron nutritionand deal with that, but if you have to interposeanemia, which is difficult to diagnose in anyone individual, you raise another question thatobscures the first. I would make a plea forseparating these two and considering thatanemia is only an indication of the intensityof a deficiency state.
Dr. Cohen: All the information we havefrom the surveys and the recommendations forimprovement of "insufficiency" are based onthe fact that a large group of individuals have12 grams of hemoglobin as opposed to a ques-tionable standard of 15 grams. I am not mini-mizing the possibility that the observation mightbe important, but I would like to know whatevidence there is to establish this.
Colonel Conrad: I would like to answer yourquestion by an experiment. If you take anindividual and make him methemoglobinemicby giving him oxidant drugs and you produce25 per cent methemoglobinemia, you have an
individual who is very close to 12 grams ofhemoglobin in terms of functional oxyhemo-
globin. He is symptomatic at this level. Younow take that same individual and give him
methylene blue; the methylene blue will converthis hemoglobin over a period of several hours
back to oxyhemoglobin, but his symptoms dis-
appear almost immediately, indicating that some-thing other than the conversion of methemo-globin to oxyhemoglobin was responsible for his
symptoms. It may be cytochrome or catalasethat is more important in terms of the symptoms
which some of these people certainly claim theyhave.
Dr. Cohen: I am sorry to persist in'this.
I am not sure that an erythrocyte with 25 per
81

cent methemoglobin will function adequately.The presence of this amount of methemoglobincould have a very profound effect on the functionof hemoglobin. But I am worried that we arefixed on a set of numbers. I insist that we mustestablish whether the value of 15 grams ofL _ 1 1L_C.. . . lJ--: ~--eIoglobia iS eCIIIe vaIU UL nU. VdIIU UbIUIr
we go making the world "rustier" than it is bygiving iron to everybody. I am only raising thequestion of whether or not this number reallyhas the meaning that has been read into it inthe traditional view of what constitutes anemia.
Moderator: Probably one of the answers forthe case with four million red cells would beto give the man iron and see whether his hemo-globin goes up, and whether he feels better.In the long run, the old-fashioned clinic willask patients how they feel and what symptomsthey have.
Dr. Cook: On the positive side, if you in-crease the number of subjects in the populationwith a hemoglobin of 12, then you are goingto increase proportionately the number with ahemoglobin of 6. I think in this sense yourexample may be important as a reflection of theseverity of nutritional anemia in the populationas a whole. I also think it is unfair to choosethe male for your example, because the conse-quences of iron-deficiency anemia may be muchless important than in the female.
Dr. Waterlow: I think Dr. Sánchez-Medalgave in his tables 10 grams as the level belowwhich infants were considered to be anemic; itseems to me that we really know extremely littleabout what one might call the normal or ex-pected levels in infants-even less than in adults.Since this is one of the groups with which weare particularly concerned, it is rather an im-portant point.
I wanted to ask another question, too.Dr. Gandra's tables showed that hemoglobinlevels tended to be elevated among people livingat high altitudes in Bolivia and Ecuador. Aretheir diets better, or could one say that if theyneed the iron they absorb it better-just as wefind that infants recovering from malnutrition
absorb 50 to 70 per cent of the iron in theirdiet?
Dr. Gandra: What we know from studiescarried out in Peru is that when people go fromlow to high altitudes the rate of iron absorptionincreases. However, the amount of iron in thefood at high altitudes is not necessariiy differentfrom that in the diet at low altitudes. Of course,this varies according to the data you are con-sidering.
Dr. Waterlow: This is very interesting, be-cause you could argue from this that if some-body has a hemoglobin of 12, that is all heneeds; he would have absorbed more if the stressor need had been present.
Dr. Sánchez-Medal: Dr. Waterlow, whatfigure would you like to fix for speaking ofanemia in infants? I selected 10 grams becauseit has been used most widely.
Dr. Waterlow: I don't know. I am askingfor information, really.
Moderator: Since most statistics on so-called"normal" groups include a good number ofpeople with iron deficiency and low hemoglobin,it is probable that the "cut-off" levels are rathertoo low than too high.
Dr. Finch: I think this is true. The purposeof defining anemia has been to get a level belowwhich the clinician might find disease. Anypoint that is taken will have to include, froma physiologic sense, certain people below theline of separation who are quite normal andothers above the line who are really anemic.We are looking at a system of oxygen transportthat has great reserve in regard to cardiac output,hemoglobin level, and oxygen availabilty. It hasrecently been shown that there is an inversecorrelation between 2 + 3 diphosphoglyceratewhich can shift the oxygen dissociation curveand the hemoglobin level. So I think we haveto presume that a number of factors are in-teracting.
Dr. Gandra: What is normal and what is notis a pretty difficult question to answer. I justwant to say that we have often worked withschoolchildren having less than 10 or 9 grams of
82
hemoglobin, and we have used different treat-ment schemes. Sometimes the general averageof hemoglobin concentration did not reach 11grams per 100 ml. Perhaps part of the answerhas to do with the relationship of hemoglobinconcentration to metabolic activity in thesechildren.
Moderator: Going back just for a minute tothe effect of anemia on the individual, particu-larly his work performance, I think very fewstudies have been done on this subject so far.There is an old paper by Colonel Lane filled withletters that he received from the heads of coolieestates. These people wrote that they were verythankful to him because since the worms hadbeen removed from the coolies they could carrymany more bags of tea in a day; the actual num-ber of bags of tea was mentioned. This is aboutthe only study I know of, but I think it issignificant because it deals with actual workperformed in situ.
I am wondering why there is so littlemotivation to do something about these ane-mias. People don't really complain too muchwhen they have them. Perhaps this explainswhy so little is done. Here in Dr. Chopra'sabstract something is written that amazes me.It says, "Iron enrichment of certain foodstuffsposes few if any technical problems; thus, themeans to prevent the nutritional deficiencyexist." I rather doubt whether the matter isthat easy. If this is true, why isn't food beingenriched and distributed with larger amountsof iron? Is it because the problem does notappear to be very important ?
Dr. Cohen: Does a nutritional deficiencyexist in someone who has a hemoglobin levelof 12 grams? If it doesn't, is the internationaleffort warranted to try to boost everybody up to15 grams of hemoglobin?
Moderator: In our countries there is noproblem, because there are many people wellbelow that level.
Dr. Kevany: Just to answer your specificquestion about whether or not the means exist,the technical aspects of food processing are such
that there are no serious problems presentedto enriching cereals with iron anywhere in thehemisphere. The major problem is that around50 per cent of the people live in rural areas ona subsistence type of economy, where the foodsupply is at no stage processed outside ofthe household itself or the local village mill.
Moderator: These are the very people whoneed it most.
Dr. Kevany: Iron can be added to salt. Thereis no technical problem that I am aware of,provided you can get a stable iron compoundand reasonably high-quality salt. A lot of salthas chemical impurities and a very high mois-ture content, which makes it more difficult tostabilize as an enrichment vehicle.
Dr. Zubirán: Undoubtedly the problems ofdeficiency are very important, especially inrural areas, but the deficiencies in protein aremuch more important. In Mexico half ourpopulation eats corn. This corn contains suffi-cient quantities of iron. We would not needto enrich it in any way. It would be fineif only we could achieve the absorption of thisiron. In order to provide better nutrition tothe rural population in Mexico, we would haveto enrich their diet with ascorbic acid andsoybean, which we feel are the most appro-priate elements.
I would like to ask Dr. Layrisse for hisopinion on the following question: In a popula-tion that consumes 400 grams of corn per persona day and which has much more than 10 mg ofiron in the diet, would the problem of ironabsorption be solved by adding or supplementingthis corn-and-black-bean fare with soybean?Would we improve nutrition by this addition?
Dr. Layrisse: Is this a course, dry material,or is it cooked?
Dr. Zubirán: It is dry.Dr. Layrisse: We know now that inorganic
iron absorption is reduced about 80 per centwhen mixed with corn. For instance, if yougive, let us say, 1.0 mg of supplemented ironwith 100 grams of corn, you will get somethinglike 0.03 mg of absorption from inorganic
83

iron. I think we have to know more aboutthe interaction between inorganic iron andvarious foods before we start programs onfood iron fortification.
Moderator: Do the people in Asia eat muchsoybean?
Colonel Conrad: The diet in Asia variesconsiderably from one country to another. Soy-bean is eaten in some countries in fairly largeamounts because it is imported or grown. Inseacoast countries, fish is eaten because it isavailable. Inland, less fish is available, and Ibelieve there is a greater incidence of irondeficiency.
Moderator: I think we have looked at theiron problem rather thoroughly. One of thethings that impresses me in the whole matteris the fact that iron, unlike many of the metab-olites in food, is vulnerable and seems to bealways on a borderline of sorts. Even thosepeople who absorb enough iron have verylittle in the way of reserve, so that the least
loss over what is normal can cause importantchanges.
Another thing that is impressive-I thinkDr. Finch showed this-is the slowness of ironmetabolism and the fact that the effect of anevent that takes place today may show itselfman .months later. For example, in the case
of phlebotomy, the effect on iron absorptionstill appears one year later. This explains also-I failed to mention it when I discussed thehookworm situation-why the impact of amarked, short-lived infection may show itselfmany months later, especially when iron ab-sorption is very low.
I am still puzzled as to why somethingmore drastic or aggressive is not being doneabout the iron situation. I think that at leastthe school population could be treated routinelywith prophylactic quantities of iron.
One major area in which work should bedone is that related to the effects of anemia andwhat it means from the socioeconomic point ofview.
84