Embed Size (px)
Citation preview

Irish Industrial Market REVIEW 2013/OUTLOOK 2014

2 Review 2013/Outlook 2014
• AggregatetransactionactivityacrosstheIrishregionalindustrialmarketsreached357,700sqmin2013,upfrom262,900sqmrecordedduringthecorrespondingperiodin2012.ThereboundinactivitywassupportedbystrongperformancerecordedintheDublinindustrialmarket,accountingfor83%ofactivityandthehighestannuallevelrecordedsince2007.Activitylevelsintheotherregionalcentrescontinuetofluctuate,thatsaid,grossannualtakeupasaproportionoftheoverallmarketstockisnowbroadlyinlinewiththelongrunaverage.
• TheIrishindustrialmarketscontinuestodisplayawiderangeofvacancyratios,from12%inGalwayto27%inDublin.Supplylevelsremainelevatedacrossalltheregionalcentres,primarilyasaresultoftheongoingreleaseofsecondhandspacebacktothemarket.Thisactivitycontinuestohampernetabsorptionlevelswhichremainathistoricallylowlevels.
• SupplylevelsremainfragmentedwithashortageoflargerGradeAspaceinalltheprimemarkets.AnoccupierwitharequirementforaGradeAunit,greaterthan5,000sqmislimitedtojustsevenbuildingsacrossallregionalcentres.
• PrimerentalvaluesroseinDublinmarketbut18%duringtheyearbuthaveremainedstableacrosstheothercentresover2013asawhole.
Irish Industrial Market
Figure 1
Irish industrial market, annual take up (sq m)
Table 1
Irish Industrial Markets - Key figures 2013
Source:DTZ Sherry FitzGerald Research
Source: DTZ Sherry FitzGerald Research
IndustrialMarket Dublin Galway Cork Limerick
MarketStock 4,058,400 Sq M 480,500 Sq M 1,037,050 Sq M 923,100 Sq M
TakeUp 298,000 Sq M 9,500 Sq M 22,300 Sq M 27,900 Sq M
Availability 1,096,500 Sq M 59,050 Sq M 258,050 Sq M 251,600 Sq M
VacancyRate 27.0 % 12.3 % 19.7 % 27.3 %
UnderConstruction 0 Sq M 0 Sq M 0 Sq M 0 Sq M
ThefollowingreportincorporatesadetailedoverviewoftheIrishregionalindustrialmarketsincludingDublin,Galway,CorkandLimerick.Thismarketanalysiscoversoccupationlevels,vacancylevelsandrentalperformanceineachlocation.

3 Review 2013/Outlook 2014
Figure 2
Dublin industrial take up (sq m), 2013
Source: DTZ Sherry FitzGerald Research
Transaction Activity
Rentalgrowthof18%in2013
As the year progressed so did activity; with activity levels gaining momentum with each passing quarter. The year closed with the strongest quarterly level of industrial activity recorded since the peak of the market in 2007. Over the past number of years, the volume of take up in the Dublin industrial market has steadily increased year on year from a very low base in 2009. 2013 saw transaction activity reach its strongest performance in recent years, with almost 300,000 sq m recorded during the twelve month period. Furthermore, the performance in the year compares
favourably to the long run average.
The stronger than expected recovery has been primarily supported by improving
market fundamentals coupled with an improvement in Ireland’s manufacturing sector. Furthermore, closer aligned pricing to market realities is resulting in increased activity. The strong industrial performance experienced during the year fuelled a resumption of rental growth of approximately 18% over the twelve month period.
Despite an extremely robust level of demand for industrial space during the year, the level of net take up was negative for the year as a whole. This largely stems from a pattern of activity that has become evident in the market whereby occupiers are exiting short-term leases and buying space. In many instances, the space purchased is smaller than the original space leased and returned to the market. These short-term leases were taken out during the crisis, when there
TheDublinindustrialmarketwasoneofthebestperformingsectorsin2013intermsoftransactionactivity.Followingareboundinactivityin2012,theopeningquarterof2013witnessedasurgeintransactionactivitywhichsetthebarhighforproceedingquarters.
Dublin Industrial Market
was a dynamic shift in the market away from freehold purchases to more flexible leasehold transactions as an occupational preference.
This was in response not only to credit securing difficulties but also cautious attitudes with regard to re-location/expansion plans in the economic climate that prevailed at the time.
Furthermore, many are seeing industrial space as an attractive option at the present. The latest DTZ Europe Fair Value Index for Q3 2013 reveals that in terms of sectors, the industrial sector recorded the most “Hot” markets. Most notably, the Dublin industrial market is the most under-priced market in Europe, being 33% under-priced according to the Fair Value index.

4 Review 2013/Outlook 2014
Transaction Activity
A total of 91,500 sq m was transacted in the Dublin industrial market during the final quarter of 2013; an increase of 31% on the previous quarter. This brings the volume of transacted space for the year to 298,000 sq m. A comparison with 2012 reveals a 60% increase in activity levels and the highest annual level recorded since 2007. In addition to a notable increase in aggregate take up, there was a strong uplift in the number of individual deals transacted during 2013; up 47% on comparable 2012 levels.
2013 witnessed an increased appetite for medium sized units, reflecting an improvement in confidence among occupiers. An analysis of the profile of space transacted throughout the year reveals a significant boost in the number of larger sized deals transacted during the year compared with 2012. In particular, the final quarter saw six deals greater than 5,000 sq m transact during the three month period. That said, while the average size deal during 2013 was 1,800sq m, demand remains focussed on smaller sized industrial units. The largest
transaction during quarter four was the sale of an industrial unit on the Malahide Road, Coolock, Dublin 17 measuring approximately 8,500 sq m and acquired by an online retailer. Other sizable deals during the quarter include the sale of unit 1&2 measuring approximately 6,300 sq m at the John F Kennedy Park, Naas Road, Dublin 12. The most significant letting during the final quarter was the short-term lease of Unit 200, Northwest Business Park, Ballycoolin, Dublin 15, measuring approximately 5,500 sq m.
2013 saw leasehold transactions dominate activity in the opening half of the year, however, the latter half of the year saw the demand for freehold purchases outstrip lettings as an occupational preference for two consecutive quarters. In the final quarter, sales accounted for 65% of activity during the three month period which provided a boost to the annual total. That said, an analysis of transactions in the year as a whole saw the volume of letting marginally ahead of sales at 54%.
Dublin Industrial Market

5 Review 2013/Outlook 2014
The remaining 46% comprised sales, with owner occupiers dominating activity. This is the highest annual level of sales recorded since 2007.
The level of enquiries for sales have improved also as industrial occupiers are beginning to see real value in the market. The proportion of sales are anticipated to increase during 2014 as occupiers avail of the Capital Gains Tax exemption before the window closes at year end. That said, a lack of available finance may hamper this somewhat.
Active demand during the year continues to be dominated by Grade B space which accounted for 59% of activity during the period. Grade A take up was strong during the year, accounting for 26% of the total space transacted. However, many occupiers are attracted to lower quality space as it is more cost effective to retrofit and modernise the space than to acquire Grade A space and also a fraction of the cost of building. Grade C absorbed the remaining 15% of space.
An analysis of the profile of tenants that occupied space during the year reveals on-going demand from the pharmaceutical sector and data centre operators. Earlier in the year Alexion Pharmaceutical announced expansion plans along with biopharmaceutical company Amgen in Dun Laoghaire. Microsoft is also active in the market and has recently applied for planning permission for the development of a second data centre on lands adjoining their existing facility at
The general consensus in the market is that capital values have begun to stabilise
with various elements of the market experiencing competitive bidding for well-located units. The fact that 46% of transactions in 2013 comprised sales, displayed that real value is being recognised in the market by owner occupiers. Furthermore, there is an expectation that 2014 will see a gradual reduction in the numbers of properties being brought to the market via the receivership process.
Brendan Smyth, Head of Industrial DTZ Sherry FitzGerald
Transaction Activity
Grange Castle in Clondalkin, Dublin 22. Pallas Foods are also active and undertaking a design and build distribution facility in response to a lack of suitable existing space in the market. Furthermore, logistics companies, and in particular third-party logistics providers, remain an active cohort in the market. Historically, the retail sector has accounted for a large share of industrial demand. However, the past couple of years have seen a fluctuation between the pharmaceutical, manufacturing and logistics sectors. Within the retail sector, online retailers constitute a large growth area which has in turn boosted demand for distribution facilities.
The South West industrial corridor remains the most sought after region given its strategic location, with the majority of the top deals transacted during the year located in this region. The South West region accounted for approximately 54% of all transacted space in 2013. This was followed by the North West region which accounted for 24% of all newly occupied space. A further 16% of space was absorbed in the North East, with the remaining space transacted in the South East.
While 2012 saw evidence of rent stabilisation emerge, 2013 witnessed rental growth remerge in the capital for the first time since 2008. Prime headline rents for Grade A space increased to €65 per sq m during the final quarter of 2013, representing an annual increase of 18%. Further improvements in the level of positive net take up witnessed in the latter part of the year should feed through to rental growth in the opening quarters 2014. While the negotiation power remains largely with the tenant, there are signs that landlords are not as flexible as before; particularly in the case of Grade A accommodation over 2,000 sq m.
Dublin Industrial Market

6 Review 2013/Outlook 2014
Table 2
Dublin industrial availability by grade, Q4 2013
Source: DTZ Sherry FitzGerald Research
Grade Availability(SqM) %
GradeA 313,300 29
GradeB 551,700 50
GradeC 231,500 21
Total 1,096,500 100
Availability
Thevacancyratehasclimbedovertheyearto27%
Although the latter half of 2013 saw a modest reduction in supply levels, it was not significant enough to offset the increase witnessed in the opening six months of the year. A comparison with 2012 reveals a 3% increase in supply levels.
The annual increase in supply largely stems from the on-going release of second hand space back to the market. While strong demand would normally result in positive net absorption, 2013 saw net take up remain in negative territory at -37,100 sq m, thus indicating that more occupiers are moving out of space than moving in. This trend can largely be
explained by the expiry of a large quantum of short-term leases taken at the height of the downturn. This trend is expected to continue into 2014,
however, it is hoped that stronger occupier demand and expansions will result in positive net take up. That said, the final quarter of 2013 is expected to witness continued volatility in the level of available space coming to the market.
In line with the modest increase in supply witnessed during the year, the vacancy rate also experienced upward pressure rising to 27% at the end of December. This compares to 26.1% recorded during the corresponding period in 2012. The current vacancy rate remains stubbornly high when compared to an average vacancy rate of 10.5% in 2007, when activity in the market was at its healthiest.
Thevolumeofavailableindustrialspaceremainsstubbornlyhighdespiteasharpupturnofoccupierdemandduring2013.ThequantumofspaceavailableintheDublinindustrialmarketstoodat1,096,500sqmattheendofDecember.
Figure 3
Dublin industrial availability (sq m) & vacancy rate (%), 2013
Source: DTZ Sherry FitzGerald Research
Dublin Industrial Market

7 Review 2013/Outlook 2014
Availability
SupplyoflargeGradeAprimespaceislimited
Supply levels in the industrial market remain fragmented with a shortage of larger Grade A prime space and an excess amount of smaller secondary units. Surprisingly, despite the supply of industrial space in excess of 1 million sq m, there is a limited stock of large good quality vacant buildings. As a result, occupiers are facing limited options. An analysis of the grading of accommodation reveals that Grade A space accounts for 29% of the available space. The availability of existing Grade A stock that is greater than 10,000 sq m is diminishing with just seven units available to satisfy
an increasing number of requirements in the market. Furthermore, there are just two facilities greater than
10,000 sq m available in the South West region, where demand is strongest. The availability of large prime distribution units are expected to decrease further over the next year as existing supply continues to fall short of demand.
On the contrary, the stock of Grade B space is abundant accounting for half of overall supply. That said, demand at present is strongest for Grade B space.
Notably, a significant proportion of the vacant space, 21%, is older stock which is effectively obsolete. In a normal functioning market this space would be redeveloped. However, limited access to finance will result in this space remaining on the market.
This stock is arguably masking the true vacancy rate in the market and when the Grade C space is omitted from the analysis, the vacancy rate falls to 21.3%.
Supply levels are expected to remain at historically high levels with further fluctuations expected in 2014 arising from potential receivership sales, as receivers respond to the solid performance of the market in 2013 by releasing product to the market in 2014.
In terms of the profile of available space, 26% is less than 5.5 metres in height while a further 20% ranges between 5.5 and 6.1 metres in height with low eaves. This would further suggest that much of the available space comprises older stock and as a result may not meet occupier requirements. That said, factors such as location and access to power continue to be instrumental in the decision making process.
The South West region continues to account for the highest proportion of available industrial space with approximately 504,500 sq m or 46% of overall availability located in this region. However, while this region continues to benefit from stronger demand, the rate of second hand stock entering the market in this region remains high. A further 26% of accommodation is located in the North West, while the North East accounts for 24%. The remaining space is available in the South East, where supply remains limited.
Development activity in the Dublin industrial market remains stagnant with no space currently under construction. The financial climate continues to hinder speculative development with limited development expected to take place in 2014. Furthermore, the appetite for new development has been impacted by the current low and extremely competitive rental levels which have affected the viability of design and build options. However, a shortage of suitable accommodation, in particular larger Grade A facilities; and with a sizeable share of available space considered obsolete. Most notably, Pallas Foods are undertaking a design and build distribution facility in response to a lack of suitable existing space in the market. 2014 may see an increase in the number of industrial units in the planning process as occupiers will need to look to pre-lets to secure the right facility.
Dublin Industrial Market
8 Review 2013/Outlook 2014
Galway Industrial Market
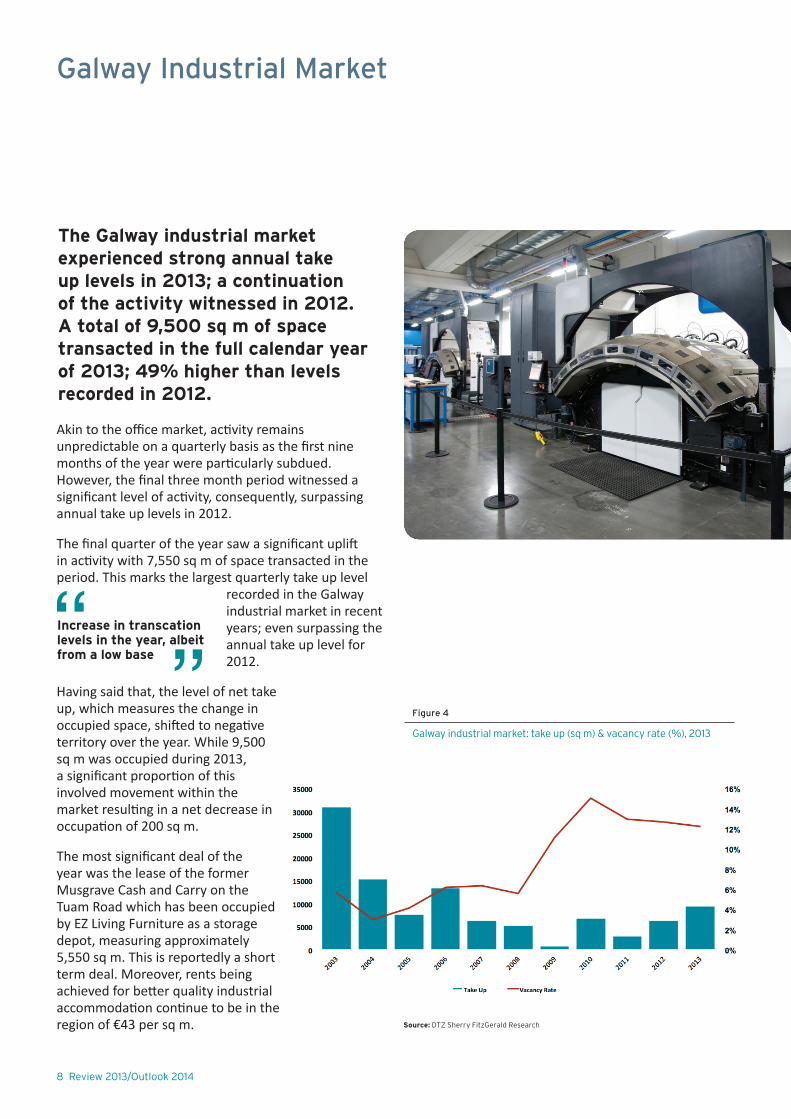
Akin to the office market, activity remains unpredictable on a quarterly basis as the first nine months of the year were particularly subdued. However, the final three month period witnessed a significant level of activity, consequently, surpassing annual take up levels in 2012.
The final quarter of the year saw a significant uplift in activity with 7,550 sq m of space transacted in the period. This marks the largest quarterly take up level
recorded in the Galway industrial market in recent years; even surpassing the annual take up level for 2012.
Having said that, the level of net take up, which measures the change in occupied space, shifted to negative territory over the year. While 9,500 sq m was occupied during 2013, a significant proportion of this involved movement within the market resulting in a net decrease in occupation of 200 sq m.
The most significant deal of the year was the lease of the former Musgrave Cash and Carry on the Tuam Road which has been occupied by EZ Living Furniture as a storage depot, measuring approximately 5,550 sq m. This is reportedly a short term deal. Moreover, rents being achieved for better quality industrial accommodation continue to be in the region of €43 per sq m.
TheGalwayindustrialmarketexperiencedstrongannualtakeuplevelsin2013;acontinuationoftheactivitywitnessedin2012.Atotalof9,500sqmofspacetransactedinthefullcalendaryearof2013;49%higherthanlevelsrecordedin2012.
Increaseintranscationlevelsintheyear,albeitfromalowbase
Figure 4
Galway industrial market: take up (sq m) & vacancy rate (%), 2013
Source: DTZ Sherry FitzGerald Research

9 Review 2013/Outlook 2014
Galway Industrial Market
The total volume of available industrial space declined to 59,050 sq m at the end of December, remaining broadly the same as the comparable period last year. Despite the challenging market conditions the vacancy rate for the Galway industrial market remains considerably lower than the other regional centres at 12.3%. This compares to a vacancy rate of 12.7% the same time last year.
An analysis of the profile of occupied space in the year reveals that grade B space accounted for the majority of transactions, 65%, while grade C space accounted for 28% and A space 7%. All transactions occurred in the North East region, not surprisingly, as the preference remains for accommodation in the outskirts of the city due to the benefits of good road networks. 96% of deals done were let, while 4% of transacted units were sold.
The North East Region absorbs the majority of vacant accommodation, 95%, while the South West accounts for 5%. A further breakdown of available accommodation reveals that approximately 24% of available stock is grade A stock, highlighting the relative shortage of the best quality floor plates. Furthermore, 33% of available accommodation comprises grade B stock while 43% comprises grade C stock.
Notably, there are just 3 available units in the market which measure over 5,000 sq m, however just one unit is of grade A stock.
Demand for industrial accommodation in Galway is being led by distribution/logistics
with preference for out of town locations such as Claregalway and Oranmore. This move by modern occupiers is increasingly leading to a two-tier market with older stock proving difficult to let.
Sean Coyne – Associate Director DTZ Sherry FitzGerald
Table 3
Galway industrial availability by grade, Q4 2013
Source:DTZ Sherry FitzGerald Research
AStockNo.ofUnits
SumofAvailability
SqM%
< 1,000 sq m 7 4,300 7
> 1,000 – 5,000 sq m 2 3,050 5
> 5,000 sq m + 1 6,800 12
Sub-total 10 14,150 24
BStock
< 1,000 sq m 3 1,800 3
> 1,000 – 5,000 sq m 7 12,500 21
> 5,000 sq m + 1 5,150 9
Sub-total 11 19,450 33
CStock
< 1,000 sq m 0 - -
> 1,000 – 5,000 sq m 4 6,200 11
> 5,000 sq m + 1 19,250 32
Sub-total 5 25,450 43
Total 26 59,050 100

10 Review 2013/Outlook 2014
Cork Industrial Market
Figure 5
Cork industrial market: take up (sq m) & vacancy rate (%), 2013
Table 4
Cork industrial availability by grade, Q4 2013
Source: DTZ Sherry FitzGerald Research
Source:DTZ Sherry FitzGerald Research
Activity remains focussed on smaller sized deals as just 7% of all occupations in the year comprised deals measuring over 1,000 sq m.
The most significant transaction in the twelve month period occurred in quarter two, with the occupation of a unit in 3 Eastgate, Little island, let on a 12 month
basis to Protech Performance Plastics; measuring approximately 2,300 sq m. Furthermore, a unit in South Link Park, Tramore Road measuring 1,700 sq m was
taken up and sold for €377 per sq m. The unit was sold to Red Abbey Motors who are already located in the park and required more space. In addition to this, approximately 1,550 sq m was sold to logistics company Schenker in Little island.
Despite strong take up levels, the level of net take up which measures the change in occupied space, decreased further over the year. While 22,300 sq m was occupied during 2013, a significant proportion of this involved movement within the market resulting in a net decrease in occupation of 21,500 sq m.
Rents now stand €38 and €48 per sq m; dependant on quality, location and size. This compares to €40 to €50 at the end of 2012.
MarketactivityremainssubjecttoquarterlyfluctuationsintheCorkindustrialmarket.Followingstrongactivityintheopeninghalfoftheyear,thequantumoftakeupreducedinthethirdquarter,howeveractivityreboundedinthefinalthreemonthperiod.Consequently,robustannualtakeuplevelsof22,300sqmwererecorded.
Activitywasfocusedonsmalldeals
AStockNo.ofUnits
SumofAvailabilitySqM
%
< 1,000 sq m 68 30,650 12
> 1,000 – 5,000 sq m 29 56,500 22
> 5,000 sq m + 5 51,300 20
Sub-total 102 138,450 54
BStock
< 1,000 sq m 50 18,150 7
> 1,000 – 5,000 sq m 16 31,900 12
> 5,000 sq m + 3 39,450 15
Sub-total 69 89,100 34
CStock
< 1,000 sq m 23 10,100 4
> 1,000 – 5,000 sq m 11 20,400 8
> 5,000 sq m + 0 - -
Sub-total 34 30,500 12
Total 205 258,050 100

Demand was strongest for space in the South West region, accounting for 54% of transactions in the period. Moreover, the North East absorbed 32% of all occupied space while the remaining 14% is accounted for in the South East, North West and the City Centre regions.
An analysis of the profile of occupied space in the period reveals that grade A space accounted for 50% of all transactions, while grade B and C space accounted for 34% and 16% respectively.
A further analysis of transacted space reveals that 70% of all completed transactions comprised lettings; indicating that leasehold transactions remain the occupier preference.
The upward trajectory in supply levels continues in the Cork industrial market, with availability levels now standing at 258,050 sq m. This represents an annual increase of 9%. This is largely due to the release of a small number of larger sized units to the market. For example, in the final quarter of the year, three units in Ringport Business Park became available; measuring 21,650 sq m.
Furthermore, the elevated supply levels are highlighted by an examination of the vacancy rate. The vacancy rate for the market at the end of December stands at 19.7%, substantially higher than a rate of 17.6% recorded in the corresponding period in 2012.
An analysis of the location of available space reveals the South West region accounts for the largest proportion of available space, 37%. A further 33% is located in the North East region. In addition, the South East and North West regions account for 14% and 10% respectively, while the remaining space was located in the city centre.
A further breakdown of available accommodation reveals that approximately 54% of available stock is grade A stock. Furthermore, 34% of available accommodation comprises grade B stock while 12% comprises grade C stock. Notably, just 5 units of Grade A accommodation over 5,000 sq m are currently available in the market.
11 Review 2013/Outlook 2014
Cork Industrial Market
With capital values now significantly below construction cost, there is no expectation that
there will be a return to any speculative development in the short to medium term.
Philip Horgan , Surveyor DTZ Sherry FitzGerald

12 Review 2013/Outlook 2014
Limerick Industrial Market
Notably the final three months of the year saw a significant increase in activity with approximately 11,000 sq m recorded during the quarter. Activity in the final three month period was largely boosted by a letting of a unit in the Raheen Industrial Estate, absorbing a total of 7,050 sq m; representing the largest transaction of 2013.
As a result of reduced transaction activity and demand during the year, annual take up levels of 27,900 sq m were recorded. This represents a decrease of 32%, when compared to the same period in 2012. The quantum and volume of transaction activity both witnessed a reduction, while just 20% of deals comprised units
measuring over 1,000 sq m; indicating that appetite in the market remains focussed on smaller sized deals.
Furthermore, the level of net take up, which measures the
change in occupied space, decreased over the year. While 27,900 sq m was occupied during 2013, a significant proportion of this involved movement within the market resulting in a marginal net increase in occupation of 650 sq m.
An example of significant deals in the market in the year include the occupation of 4,150 sq m in the Shannon Free Zone to Maidenform Brands International Ltd and the occupation of 4,100 sq m over four units in the Annacotty Business Park, North East region. The re-emergence of larger sized deals is an indicator that confidence is slowly returning to the market.
2013hasproventobearelativelystrongyearfortheLimerickindustrialmarketwithatotalof27,900sqmofspacetransacting.ActivityintheLimerickindustrialmarketstrengthenedconsiderablyattheendof2012andthisdevelopmentcontinuedintothefirstquarterof2013withsignificanttakeuplevels,howeveractivitybegantoweakeninthesubsequenttwoquarters.
2013sawdemandforlargersizeddealshasre-emerged
Source: DTZ Sherry FitzGerald Research
Figure 6
Limerick industrial market: take up (sq m) & vacancy rate (%), 2013
Notably, the former Dell Facility in the Raheen Industrial Estate has been sold, measuring approximately 36,350 sq m; which will bode very well for take up levels in 2014 as this unit alone accounts for 14% of total supply levels. A New York-based biopharmaceutical company, Regeneron Pharmaceuticals, is applying for planning permission to establish a production plant here. The company is reportedly seeking planning permission for a €218m investment at the city site, which has been vacant since 2009.
An analysis of transactions reveals that flexible leasehold transactions continue to dominate sales. 80% of all transactions comprised lettings, while 20% comprised sales. Notably, in 2012, lettings comprised 98% of market activity. In many cases, tenants who have leases which have now expired are looking at purchase options rather than renting due to the value that is available in the market at present. Furthermore, the majority of enquiries are on a purchase basis rather than lettings.

13 Review 2013/Outlook 2014
Limerick Industrial Market
Demand during the year was strongest in the South West, accounting for 36% of all newly occupied space during the twelve month period. A further 29% was absorbed in the North East and 19% in the Shannon Free Zone. Of the remaining space, the South East and the North West regions accounted for 14% and 2% respectively.
An analysis of the profile of occupied space in the period reveals that grade A space accounted for 17% of all transactions, while grade B and C space accounted for 27% and 56% respectively. Demand for grade C space dominates as a result of lower capital values and rental values. Furthermore, a significant proportion of accommodation taken up was required for storage purposes rather than good office content.
The total quantity of available space in the Limerick market fell by 2% in the final quarter of the year to reach 251,600 sq m at the end of December. Availability levels were broadly the same when compared with the same period in 2012. The moderate reduction in supply reflects the large quantity of second hand space which came onto the market during the year. That said, the occupation of the former Dell Facility in Raheen should lower both supply and vacancy levels quite significantly in the coming months.
At the end of December, the South West region accounted for approximately 35% of the space currently available in Limerick. The Shannon Free Zone and North East account for a further 29% and 17% respectively. A further 12% is available in the South East with the remaining space located in the North West.
Table 5
Limerick office availability by grade A, Q4 2013
Source:DTZ Sherry FitzGerald Research
AStockNo.ofUnits
SumofAvailability
SqM%
< 1,000 sq m 14 6,250 2
> 1,000 – 5,000 sq m 4 6,850 3
> 5,000 sq m + 1 31,600 12
Sub-total 19 44,700 17
BStock
< 1,000 sq m 23 11,800 5
> 1,000 – 5,000 sq m 10 21,150 8
> 5,000 sq m + 1 36,350 14
Sub-total 34 69,300 27
CStock
< 1,000 sq m 49 25,400 10
> 1,000 – 5,000 sq m 39 73,400 28
> 5,000 sq m + 5 38,800 18
Sub-total 93 137,600 56
Total 146 251,600 100
Whilst letting transactions dominated the market in 2013, the level of units sold may
increase in 2014 with a number of units now on the market for sale. Furthermore, a trend we may see emerging in 2014 is the redevelopment of some of the older industrial stock on key sites and locations.
Ciara McCarthy, Associate Director DTZ Sherry FitzGerald
A further breakdown of available accommodation reveals that approximately 17% of available stock is grade A stock, highlighting the lack of good quality floor plates. Furthermore, 27% of available accommodation comprises grade B stock while 56% comprises grade C stock. A total of 8 units in the market measure over 5,000 sq m, however just one unit is of grade A stock and one unit of grade B stock. Consequently, this may result in demand for design and builds in 2014.
An examination of the overall market vacancy rate for the market reveals the rate has reduced marginally to 27.3% at the end of December.

14 Review 2013/Outlook 2014
Outlook
TheoutlookfortheIrishindustrialmarkethasimprovedmarkedlyoverthepasttwelvemonths;thisisparticularlynotableinDublinwhereitsawareboundintransactionactivityoverthecourseoftheyear.Thestrongperformanceintheyearcomparesfavourablytothelongrunaverage.
While activity levels across Cork, Limerick and Galway remained somewhat mixed, the markets have made significant inroads on the path to recovery. The volume of transaction activity is expected to pick-up during 2014 across all regions in response to more dynamic occupier demand and a stronger recovery in the Irish economy.
Despite an abundant supply of industrial space across all four market, there is a limited stock of the right product in the right location which is likely to put pressure on prime rents in the short to medium term; most notably in the Dublin industrial market where demand is strongest.
2013 saw leasehold transactions continue to dominate activity, however, demand for freehold purchases continued to regain lost ground. This was particularly
evident in Dublin and to a lesser extent across the regions as industrial occupiers are beginning to see real value in the market. The proportion of sales are anticipated to increase during 2014 as occupiers avail of the Capital Gains Tax exemption before the window closes at year end. That said, a lack of available finance may hamper this somewhat.
Development activity remains stagnant with no space currently under construction across the industrial markets. The financial climate continues to hinder speculative development with limited development expected to take place in 2014. However, a shortage of suitable accommodation, in particular larger Grade A facilities, may see occupiers undertaking design and build projects in response to a lack of suitable existing space in the market.

15 Review 2013/Outlook 2014
Appendix
Location Dublin Cork Galway Limerick
Units<1,000sqm €Rent/CapitalValueperSqM
€Rent/CapitalValueperSqM
€Rent/CapitalValueperSqM
€Rent/CapitalValueperSqM
SouthEast €70*/€700 €40/€400 €43/€431 €32/€322
SouthWest €65/€590 €43/€450 €43/€431 €32/€322
NorthEast €60/€540 €40/€400 €43/€431 €32/€322
NorthWest €60/€540 €38/€375 €43/€431 €32/€322
Units>1,000sqm
SouthEast €65*/€700 €25/€325 €32/€377 €27/€215
SouthWest €60/€590 €25/€350 €32/€377 €27/€215
NorthEast €55/€540 €25/€350 €32/€377 €27/€215
NorthWest €55/€540 €25/€325 €32/€377 €27/€215
Table 6
Indicative regional rents and capital values for modern industrial buildings, Q4 2013
Source: DTZ Sherry FitzGerald Research
*Due to the limited supply of buildings in the South East, rents of €70/€65 per sq m are being achieved

16 Review 2013/Outlook 2014
Market Definitions
DublinIndustrialMarketDefinitions:
Clear Internal Height: The height between the structural floor and the underside of the lowest point of the structural ceiling or roof.
EavesHeight:
A. Internal - -The height between the floor surface and the underside of the roof covering, supporting purlins or underlining (whichever is lower) at the eaves on the internal wall face.
B. External --The height between the ground surface and the exterior of the roof covering at the eaves on the external wall face ignoring any parapet.t.
GradeA: Newly developed or comprehensively refurbished to a new standard. Steel frame construction with twin skin metal cladding.
GradeB: Buildings of good specification, floor plate efficiency and image usually but not exclusively ten years old or less. Must not include any element of asbestos in the construction type.
GradeC: Remaining poorer quality stock.
RegionalIndustrialMarketDefinitions:
First Phase: (3.7m) Headroom, 1960’s.
Second Phase: (4.6m) Headroom, Early 1970’s.
Third Phase: (5.5m) Headroom, Mid 70’s - Mid 90’s.
Fourth Phase: (6.1m) Headroom, Mid 90’s - Present.
Current Phase: Large Distribution Centres, (9.1m) Headroom plus.
PrimeModernIndustrialBuildings:
A standard industrial unit with approximately 10-15% office content and an eaves height in excess of 6.1m.
Vacancy rate: This is the ratio of availability to market stock. The vacancy rate for the Cork industrial market excludes the South East region and Ringaskiddy.

AUTHORSMarian FinneganChief Economist, DirectorResearch+353 (0) 1 237 6341marian.fi [email protected]
Siobhan MoloneyAssociate Director+353 (0) 1 237 [email protected]
Tanya DuffyResearch Assistant+353 (0) 1 237 [email protected]
CONFIDENTIALITY CLAUSE
This information is to be regarded as confi dential to the party to whom it is addressed and is intended for the use of that party only. Consequently and in accordance with current practice, no responsibility is accepted to any third party in respect of the whole or any part of its contents. Before any part of it is reproduced, or referred to, in any document, circular or statement, our written approval as to the form and context of such publication must be obtained.
AboutDTZSherryFitzGeraldDTZ Sherry FitzGerald is the sole Irish affi liate of DTZ, a global leader in property services. With Irish offi ces in Dublin, Cork, Galway, Limerick and an associated offi ce in Belfast, we are the largest commercial property advisory network in Ireland and are part of Sherry FitzGerald Group, Ireland’s largest real estate adviser.
We provide occupiers and investors around the world with best-in-class, end-to-end property solutions comprised of leasing agency and brokerage, integrated property management, capital markets, investment, asset management and valuation. www.dtz.ie
© 2014