Embed Size (px)
Citation preview

Understanding Irish Labour Force Participation
Stephen Byrne & Martin O’BrienIrish Economic Analysis
May 11, 2016
Overview
I Introduction and motivation
I Approach and contribution
I Decomposition of the participation rate
I Individual characteristics and labour market transitions
I Cohort-based model of labour force participation
I Summary and conclusion
Stephen Byrne & Martin O’Brien Irish Economic Analysis 2 / 30

Introduction and Motivation
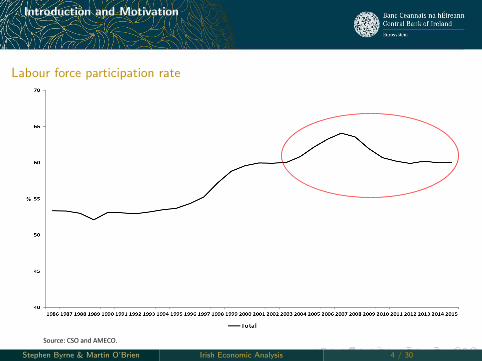
Introduction and Motivation
I Increase in labour force participation rate (LFPR) a notable feature of theCeltic Tiger and subsequent construction boom
I Females in 1990’sI Immigration in 2000’s
I As in other countries, decline in LFPR during the Great Recession
I As in other countries, LFPR relatively absent feature in subsequent recovery
I Important for policy analysis and design to understand the relative role of:
I Cyclical factors (weak labour market, high unemployment)I Structural factors (demographics, social norms, etc.)
I Implications for actual and potential output growth
I Policy responses?
Stephen Byrne & Martin O’Brien Irish Economic Analysis 3 / 30
Introduction and Motivation
Labour force participation rate
Source: CSO and AMECO.
Stephen Byrne & Martin O’Brien Irish Economic Analysis 4 / 30

Introduction and Motivation
Some simple growth accounting...
Source: Own estimates based on data from CSO, Eurostat and AMECO. Stephen Byrne & Martin O’Brien Irish Economic Analysis 5 / 30

Approach and Contribution
Approach and contribution
I We build on a number of recent empirical analyses in other countries concerning
flows into/out of labour force and the stock LFPRI Theoretical framework following Diamond-Mortenson-Pissarides search/matching model (Erceg and Levin, 2014;
Shimer 2013; Krussell et al 2012)I Transition probabilities between participation and inactivity (Poterba and Summers, 1995; Alba-Ramirez, 1999;
Fabrizi and Mussida, 2009; Rotaru, 2014)I Cohort-based models (Fallick and Pingle, 2007; Aaronson et al, 2014; Kudlyak, 2013; Balleer et al, 2014)
I Some related work in an Irish contextI LFPR in the context of wider macro model (Newell and Symons, 1990; Barry and Bradley, 1991)I Focussing on the determinants of transitions into/out of the labour force, particularly for females (Walsh, 1993;
Russell and O’Connell, 2004)I Descriptive analysis in a comparative context (McCarthy and McQuinn, 2008)
I Take a micro (flows/transtions) and macro (age-cohort-cycle model) perspective
on LFPR developmentsI Examine relative importance and response of particular demographic groupsI Highlight structural/trend factors and the impact of the cycle on LFPR (stock and flow)I Projections of LFPR under various scenarios
Stephen Byrne & Martin O’Brien Irish Economic Analysis 6 / 30

Decomposition of the participation rate
Decomposing LFPR developments
I Aggregate LFPR is population (Pop) weighted sum of LFPR by active agedemographic groups (i):
LFPRt =∑i
s itLFPRit
s it =Popi
tPopt
I Use QNHS data to show the relative importance of changes in s it and LFPRit
I Examine alternative counterfactuals from 2003 and 2008
Stephen Byrne & Martin O’Brien Irish Economic Analysis 7 / 30

Decomposition of the participation rate
LFPR by gender, nationality, and age group
Source: CSO and Eurostat.
Stephen Byrne & Martin O’Brien Irish Economic Analysis 8 / 30

Decomposition of the participation rate
The impact of different demographic groups (2)
Source: CSO and author’s calculations.
Stephen Byrne & Martin O’Brien Irish Economic Analysis 9 / 30

Decomposition of the participation rate
The impact of different demographic groups (3)
Source: CSO and author’s calculations.
Stephen Byrne & Martin O’Brien Irish Economic Analysis 10 / 30

Decomposition of the participation rate
LFPR by birth cohort
Source: CSO.
Stephen Byrne & Martin O’Brien Irish Economic Analysis 11 / 30
Individual characteristics and labour market transitions
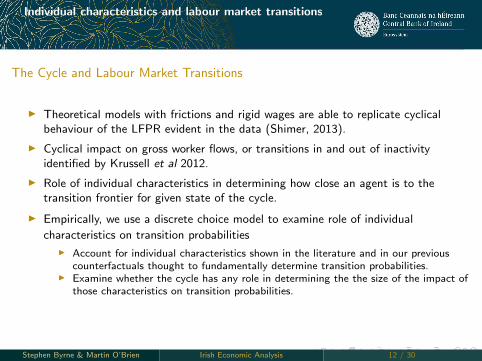
The Cycle and Labour Market Transitions
I Theoretical models with frictions and rigid wages are able to replicate cyclicalbehaviour of the LFPR evident in the data (Shimer, 2013).
I Cyclical impact on gross worker flows, or transitions in and out of inactivityidentified by Krussell et al 2012.
I Role of individual characteristics in determining how close an agent is to thetransition frontier for given state of the cycle.
I Empirically, we use a discrete choice model to examine role of individual
characteristics on transition probabilities
I Account for individual characteristics shown in the literature and in our previouscounterfactuals thought to fundamentally determine transition probabilities.
I Examine whether the cycle has any role in determining the the size of the impact ofthose characteristics on transition probabilities.
Stephen Byrne & Martin O’Brien Irish Economic Analysis 12 / 30
Individual characteristics and labour market transitions
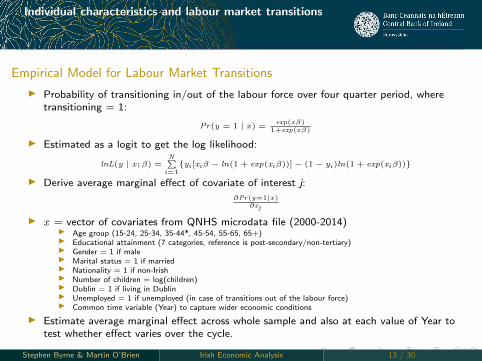
Empirical Model for Labour Market Transitions
I Probability of transitioning in/out of the labour force over four quarter period, wheretransitioning = 1:
Pr(y = 1 | x) =exp(xβ)
1+exp(xβ)
I Estimated as a logit to get the log likelihood:
lnL(y | x ; β) =N∑
i=1{yi [xiβ − ln(1 + exp(xiβ))]− (1− yi )ln(1 + exp(xiβ))}
I Derive average marginal effect of covariate of interest j:
∂Pr(y=1|x)∂xj
I x = vector of covariates from QNHS microdata file (2000-2014)I Age group (15-24, 25-34, 35-44*, 45-54, 55-65, 65+)I Educational attainment (7 categories, reference is post-secondary/non-tertiary)I Gender = 1 if maleI Marital status = 1 if marriedI Nationality = 1 if non-IrishI Number of children = log(children)I Dublin = 1 if living in DublinI Unemployed = 1 if unemployed (in case of transitions out of the labour force)I Common time variable (Year) to capture wider economic conditions
I Estimate average marginal effect across whole sample and also at each value of Year totest whether effect varies over the cycle.
Stephen Byrne & Martin O’Brien Irish Economic Analysis 13 / 30

Individual characteristics and labour market transitions
Logit ResultsTable: Average Marginal Effects for Transitions
State @ Quartert Labour Force InactiveState @ Quartert+4 Inactive Labour ForceAverage Transition Probability 0.049 0.069
15-24 Year Olds 0.086*** 0.012***25-34 Year Olds 0.003** 0.021***55-64 Year Olds 0.021*** -0.065***65+ Year Olds 0.080*** -0.105***Male -0.036*** 0.038***Second Level Education 0.010*** -0.006*Third Level Education -0.001 0.018***Dublin 0.002** 0.006***Number of Children 0.003*** -0.004***Married -0.003** -0.012***Unemployed 0.171*** -Foreign National 0.009*** 0.004
Observations 209,442 145,322
Source: Authors’ calculations. Reference for age categories are 35-44 year olds. Referencefor educational attained categories is post-secondary/non-tertiary. Year dummy included.***, **, *, indicate statistical significance at the 1, 5 and 10 per cent levels.
Stephen Byrne & Martin O’Brien Irish Economic Analysis 14 / 30

Individual characteristics and labour market transitions
Average Marginal Effects at Different Points in the Cycle - Unemployment.1
4.1
5.1
6.1
7.1
8.1
9.2
Ave
rage
Mar
gina
l Effe
cts
2000 2005 2010 2015
Unemployed - Labour Force to Inactive
Stephen Byrne & Martin O’Brien Irish Economic Analysis 15 / 30

Cohort-based model of labour force participation
Cohort-based model of LFPR (1)
I Age and birth-year cohort effects thought of as determinants of the long-runLFPR trend
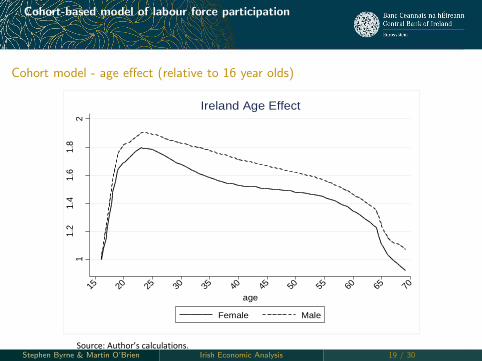
I Common age effects such as impact of tertiary education, family formation,retirement
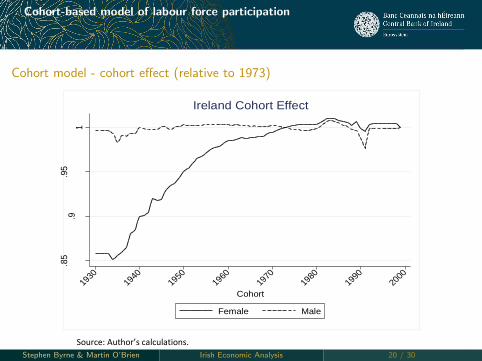
I Cohort effects reflecting impact of changes in social norms and institutionsthrough time
I Estimate cohort-based model similar to Aaronson et al (2014), Kudlyak(2013) and Balleer et al (2014)
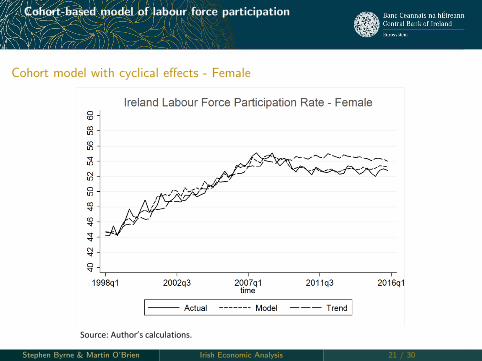
I Complement basic model with cyclical determinants similar to Walsh (1993)and consistent with factors highlighted in search/matching models such asShimer (2013)
I Identify the relative role of trend and cycle in LFPR developments
Stephen Byrne & Martin O’Brien Irish Economic Analysis 16 / 30

Cohort-based model of labour force participation
Cohort-based model of LFPR (2)
I Trend is estimated for males and females seperately:
lnLFPRit = α+ lnαi +
1998∑b=1928
Cb,i,t lnβb + εi,t
I Pooled quarterly data from QNHS micro-data file, t = 1998q1-2014q4I LFPRi
t = participation rate of each single year age/gender group (16-70+)I αi = fixed effect for age/gender group iI Cb,i,t = 1 if i in period t includes people born in year b, 0 otherwiseI βb = cohort specific fixed effect for people born in year b
I Estimates for the aggregate trend LFPR are derived by:
L̂FPRit = exp( ̂lnLFPRi
t +σ2ε2)
L̂FPRt =∑isit L̂FPR
it
Stephen Byrne & Martin O’Brien Irish Economic Analysis 17 / 30
Cohort-based model of labour force participation
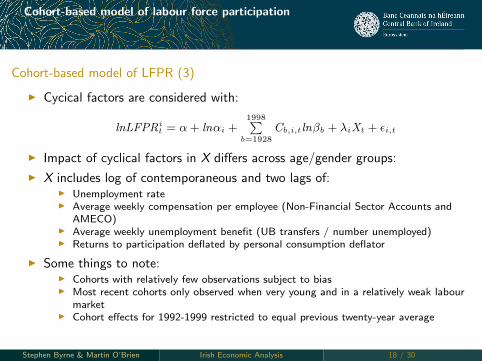
Cohort-based model of LFPR (3)
I Cycical factors are considered with:
lnLFPRit = α+ lnαi +
1998∑b=1928
Cb,i,t lnβb + λiXt + εi,t
I Impact of cyclical factors in X differs across age/gender groups:
I X includes log of contemporaneous and two lags of:I Unemployment rateI Average weekly compensation per employee (Non-Financial Sector Accounts and
AMECO)I Average weekly unemployment benefit (UB transfers / number unemployed)I Returns to participation deflated by personal consumption deflator
I Some things to note:I Cohorts with relatively few observations subject to biasI Most recent cohorts only observed when very young and in a relatively weak labour
marketI Cohort effects for 1992-1999 restricted to equal previous twenty-year average
Stephen Byrne & Martin O’Brien Irish Economic Analysis 18 / 30
Cohort-based model of labour force participation
Cohort model - age effect (relative to 16 year olds)
Source: Author’s calculations.
11
.21
.41
.61
.82
15 20 25 30 35 40 45 50 55 60 65 70
age
Female Male
Ireland Age Effect
Stephen Byrne & Martin O’Brien Irish Economic Analysis 19 / 30
Cohort-based model of labour force participation
Cohort model - cohort effect (relative to 1973)
Source: Author’s calculations.
.85
.9.9
5
1
1930
1940
1950
1960
1970
1980
1990
2000
Cohort
Female Male
Ireland Cohort Effect
Stephen Byrne & Martin O’Brien Irish Economic Analysis 20 / 30
Cohort-based model of labour force participation
Cohort model with cyclical effects - Female
Source: Author’s calculations.
Stephen Byrne & Martin O’Brien Irish Economic Analysis 21 / 30

Cohort-based model of labour force participation
Cohort model with cyclical effects - Male
Source: Author’s calculations.
Stephen Byrne & Martin O’Brien Irish Economic Analysis 22 / 30
Cohort-based model of labour force participation
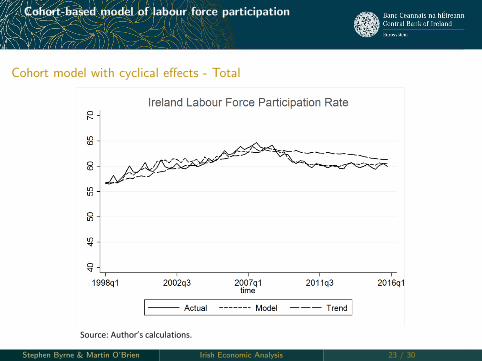
Cohort model with cyclical effects - Total
Source: Author’s calculations.
Stephen Byrne & Martin O’Brien Irish Economic Analysis 23 / 30

Cohort-based model of labour force participation
Trend LFPR Projections
Trend Participation Rate With Alternative Population Assumptions
Female Male Total
2015 2020 2025 2015 2020 2025 2015 2020 2025
Eurostat 2013 Main 54.4 53.1 51.4 68.4 64.3 60.5 61.0 58.3 55.6
Eurostat 2013 No Migration 54.4 53.5 52.2 68.4 65.0 61.8 61.0 58.8 56.6
Eurostat 2013 Higher Life Expectancy 54.4 53.0 51.3 68.4 64.2 60.4 61.0 58.2 55.5
Eurostat 2013 Reduced Migration 54.4 53.1 51.6 68.4 64.4 60.8 61.0 58.4 55.8
CSO 2011 No Net Migration (M0) 54.4 53.4 52.0 68.4 64.7 61.1 61.0 58.7 56.2
CSO 2011 High Net Immigration (M1) 54.4 53.6 53.0 68.4 64.9 62.2 61.0 58.9 57.3
CSO 2011 Low Net Immigration (M2) 54.4 53.4 52.2 68.4 64.7 61.3 61.0 58.6 56.4
CSO 2011 Low Net Emigration (M3) 54.4 53.0 51.4 68.4 64.3 60.4 61.0 58.2 55.6
Average 54.4 53.3 51.9 68.4 64.6 61.1 61.0 58.5 56.1
Female Age Effect Counterfactual (M2) 57.2 55.8 54.1 68.4 64.7 61.3 62.5 60.0 57.5
Source: Author’s calculations, CSO 2016-2046 Population Projections (2011) and Eurostat Population Projections (2013).
Projections used from the CSO have a common total fertility rate assumption of 2.1 alongside a gradual reduction in mortality rates.
See the CSO publication for more details on these and the M0, M1, M2 and M3 migration assumptions. Projections from Eurostat
have a common total fertility rate assumption of 2.01. The Main Eurostat projection also assumes a mortality rate of 0.0054 by
2025 and net migration remaining negative out to 2025. The Eurostat Higher Life Expectancy scenario assumes a mortality rate of
0.0052 by 2025, whereas the Reduced Net Migration scenario assumes net emigration being twenty per cent lower than the Main
scenario. The Female Age Effect Counterfactual sets the shape of the age effect for females from 25-55 years of age to be
proportionate to the male effect for these age groups and uses the M2 CSO scenario for the population projections.
Stephen Byrne & Martin O’Brien Irish Economic Analysis 24 / 30

Cohort-based model of labour force participation
Stephen Byrne & Martin O’Brien Irish Economic Analysis 25 / 30

Cohort-based model of labour force participation
Summary and conclusionsI Strong level of inward migration boosted LFPR during the mid-2000s above what
would have been expected at start of the century.
I LFPR developments during the crisis and recovery driven by reaction of young menin particular.
I Unable to identify economically significant effects of the cycle on fundamentaltransition probabilities.
I Evidence that the decline in LFPR since 2008 for both males and femalesdominated by cyclical effects.
I Age and cohort effects are dragging down trend male LFPR, with little scope forfurther positive cohort effects to boost female LFPR.
I In absence of strong cyclical response, trend LFPR will weigh on actual LFPR over
the next decadeI Contribution of labour supply to actual and potential output growth diminished.I Policy changes to promote higher female participation will support trend LFPR but
not sufficient to fully offset decline in the male trend.I Higher immigration, particuarly non-Irish, would boost trend and actual LFPR.
Stephen Byrne & Martin O’Brien Irish Economic Analysis 25 / 30

References
I Aaronson, Stephanie, Tomaz Cajner, Bruce C. Fallick, Felix Galbis-Reig, Christopher Smith and William L. Wascher(2014). “Labour Force Participation: Recent Developments and Future Prospects”, Brookings Papers on EconomicActivity, Vol. 49(2), pages 197-275.
I Balleer, Almut, Ramon Gomez-Salvador and Jarkko Turunen (2014). “Labour Force Participation Across Europe: ACohort-Based Analysis”, Empirical Economics, Vol. 46, pages 1385-1415.
I Barry, Frank and John Bradley (1991). “On the Causes of Ireland’s Unemployment”, The Economic and Social Review,Vol. 22(4), pages 253-286.
I Benhabib, Jess, Richard Rogerson and Randall Wright (1991). “Homework in Macroeconomics: Household Productionand Aggregate Fluctuations”, The Journal of Political Economy, Vol. 99(6), pages 1166-1187.
I Bergin, Adele, Elish Kelly and Seamus McGuinness (2015). “Changes in Labour Market Transitions in Ireland Over theGreat Recession: What Role for Policy?”, IZA Journal of European Labour Studies, Vol. 4(1).
I Conefrey, Thomas, Martina Lawless and Suzanne Linehan (2015). “Developments in the Irish Labour Market During theCrisis: What Lessons for Policy”, The Journal of the Statistical and Social Inquiry Society of Ireland, Vol. 44, pages18-32.
I Erceg, Christopher J. and Andrew T. Levin (2014). “Labour Force Participation and Monetary Policy in the Wake of theGreat Recession”, Journal of Money, Credit and Banking, Vol. 46(2), pages 3-49.
I Fabrizi, Enrico and Chiara Mussida (2009). “The Determinants of Labour Market Transitions”, Giornale degli Economistie Annali di Economia, Vol. 68(2), pages 233-265.
I Fallick, Bruce C. and Jonathan Pingle (2007). “A Cohort-Based Model of Labour Force Participation”, Federal ReserveBoard Finance and Economics Discussion Series, No. 2007-09.
I Haefke, Christian and Michael Reiter (2006). “Endogenous Labour Market Participation and the Business Cycle”, IZADiscussion Paper Series, No. 2029.
I Hall, Robert E. (2005). “Employment Fluctuations with Equilibrium Wage Stickyness”, American Economic Review, Vol.95(1), pages 50-65.
Stephen Byrne & Martin O’Brien Irish Economic Analysis 26 / 30
References
I Krussell, Per, Toshihiko Mukoyama, Richard Rogerson and Aysegul Sahin (2012). “Gross Worker Flows Over theBusiness Cycle”, mimeo.
I Kudlyak, Marianna (2013). “A Cohort Model of Labour Force Participation”, Federal Reserve Bank of RichmondEconomic Quarterly, Vol. 99(1), pages 25-43.
I McCarthy, Yvonne and Kieran McQuinn (2008). “Changing Participation Rates in the euro area: The Case of the CelticTiger”, Central Bank of Ireland Quarterly Bulletin Special Article, No. 2 April, pages 69-87.
I Newell, Andrew and J. Symons (1990). “The Causes of Ireland’s Unemployment”, The Economic and Social Review,Vol. 21(4), pages 409-429.
I Pissarides, Christopher A. (2000). Equilibrium Unemployment Theory, Cambridge, Massachusetts: The MIT Press.
I Poterba, J and Lawrence H. Summers (1995), “Unemployment Benefits and Labour Market Transitions: A MultinomialLogit Model with Errors in Classification”, Review of Economics and Statistics, Vol. 77(2), pages 2017-216.
I Rotaru, Cristian Ionel (2014). “Transitioning Out of Unemployment: Analysis Using the ABS Longitudinal Labour ForceSurvey File”, Australian Journal of Labour Economics, Vol. 17(2), pages 111-137.
I Russell, Helen and Philip J. O’Connell (2004). “Women Returning to Employment, Education and Training in Ireland:An Analysis of Transitions”, The Economic and Social Review, Vol. 35(1), pages 1-25.
I Shimer, Robert (2013). “Job Search, Labour-Force Participation, and Wage Rigidities” in Daron Acemoglu, ManuelArellano and Eddie Dekel, eds., Advances in Economics and Econometrics: Tenth World Congress, pages 197-234,Cambridge University Press.
I Veracierto, Marcelo (2008). “On the Cyclical Behaviour of Employment, Unemployment and Labour ForceParticipation”, Journal of Monetary Economics, Vol. 55(6), pages 1143-1157.
I Walsh, Brendan M. (1993). “Labour Force Participation and the Growth of Women’s Employment, Ireland 1971-1991”,The Economic and Social Review, Vol. 24(4), pages 369-400.
Stephen Byrne & Martin O’Brien Irish Economic Analysis 27 / 30

References
Transition Probabilities In/Out of the Labour Force
0
1
2
3
4
5
6
7
8
9
1998 1999 2000 2001 2002 2003 2004 2005 2006 2007 2008 2009 2010 2011 2012 2013 2014 2015
%
Transition Probabilities
LF to Inactive
Inactive to LF
Stephen Byrne & Martin O’Brien Irish Economic Analysis 28 / 30

References
Average Marginal Effects at Different Points in the Cycle - Age Categories
-.01
0.0
1.0
2.0
3.0
4.0
5
2000 2005 2010 2015
15 to 24
-.01
0.0
1.0
2.0
3.0
4.0
5.0
6
2000 2005 2010 2015
25 to 34
-.09
-.08
-.07
-.06
-.05
-.04
-.03
2000 2005 2010 2015
55 to 64
-.14
-.13
-.12
-.11
-.1-.0
9-.0
8
2000 2005 2010 2015
65 Plus
.06
.07
.08
.09
.1.1
1
2000 2005 2010 2015
15 to 24
-.01
0.0
1.0
2
2000 2005 2010 2015
25 to 34
0.0
1.0
2.0
3
2000 2005 2010 2015
55 to 64
.03
.04
.05
.06
.07
.08
.09
.1
2000 2005 2010 2015
65 Plus
Age Category - Average Marginal Effects
Inac
tive
to L
abou
r For
ceLa
bour
For
ce to
Inac
tive
Stephen Byrne & Martin O’Brien Irish Economic Analysis 29 / 30

References
Average Marginal Effects at Different Points in the Cycle - Gender and Nationality0
.01
.02
.03
.04
.05
.06
Inac
tive
to L
abou
r For
ce
2000 2005 2010 2015
Male
-.02
-.01
0.0
1.0
2
2000 2005 2010 2015
Foreign National
-.05
-.04
-.03
-.02
Labo
ur F
orce
to In
activ
e
2000 2005 2010 2015
Male
-.03
-.02
-.01
0.0
1.0
2.0
3
2000 2005 2010 2015
Foreign National
Gender and Nationality - Average Marginal Effects
Stephen Byrne & Martin O’Brien Irish Economic Analysis 30 / 30