Embed Size (px)
Citation preview
PULSE REPORT
IRI Pulse Report Confectionery
Welcome to the Pulse H1 2015 edition for confectionery. Please do
not hesitate to contact us if you have any questions or comments at
H1 2015
IRIworldwide.com
PULSE REPORT
About the Report
2
• This confectionery report is one of 10 super category reports designed to show high-level
comparison and analysis for retail markets across major countries in Europe.
• This report contains data gathered from around Europe. This market was consolidated into
one super category.
• The report highlights key metrics such as total sales figures, market trends, category
shares, winners and losers for Europe and for individual countries.
• The data has been sourced from IRI retail databases and Eurostat – the statistical branch
of administration for the European Commission.
• Countries included in the report are: France, Germany, Italy, the Netherlands, Spain and
the United Kingdom (UK).
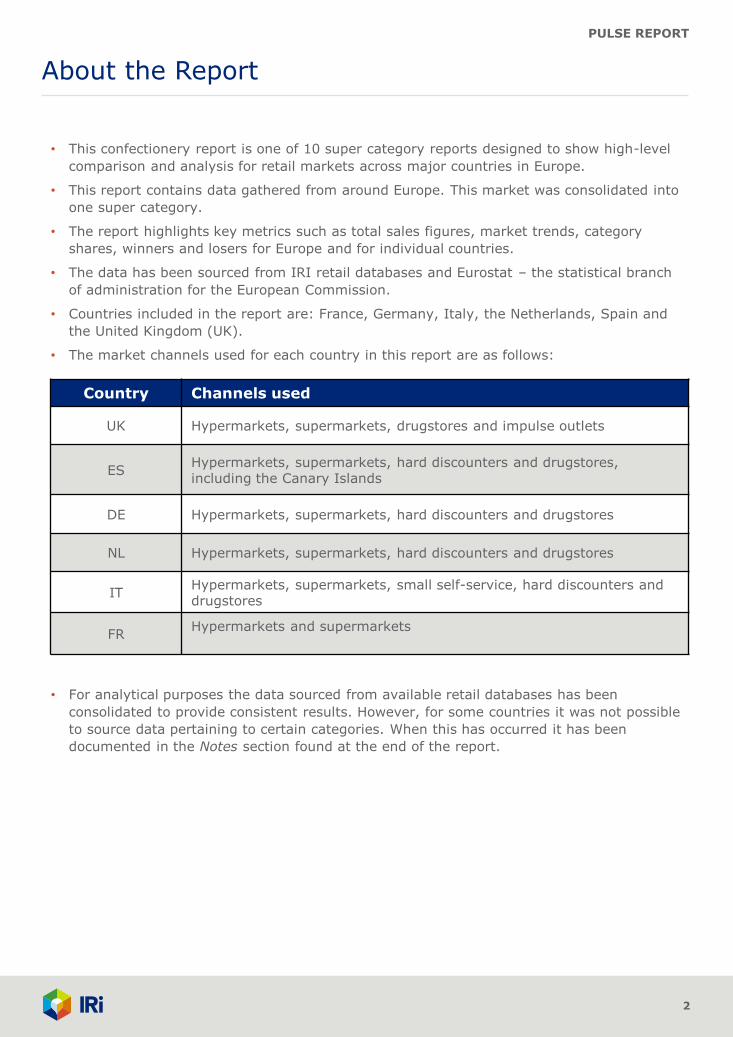
• The market channels used for each country in this report are as follows:
Country Channels used
UK Hypermarkets, supermarkets, drugstores and impulse outlets
ES Hypermarkets, supermarkets, hard discounters and drugstores, including the Canary Islands
DE Hypermarkets, supermarkets, hard discounters and drugstores
NL Hypermarkets, supermarkets, hard discounters and drugstores
IT Hypermarkets, supermarkets, small self-service, hard discounters and drugstores
FR Hypermarkets and supermarkets
• For analytical purposes the data sourced from available retail databases has been
consolidated to provide consistent results. However, for some countries it was not possible
to source data pertaining to certain categories. When this has occurred it has been
documented in the Notes section found at the end of the report.
PULSE REPORT
On the Radar
3
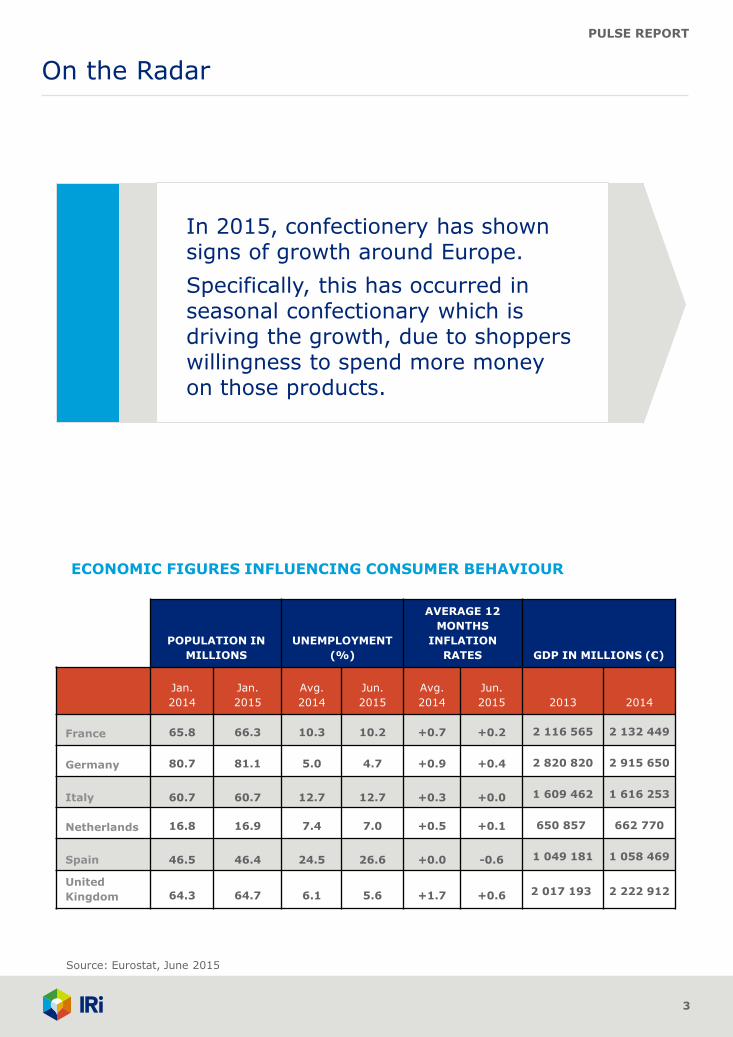
ECONOMIC FIGURES INFLUENCING CONSUMER BEHAVIOUR
In 2015, confectionery has shown signs of growth around Europe.
Specifically, this has occurred in seasonal confectionary which is driving the growth, due to shoppers willingness to spend more money on those products.
POPULATION IN
MILLIONS
UNEMPLOYMENT
(%)
AVERAGE 12
MONTHS
INFLATION
RATES GDP IN MILLIONS (€)
Jan.
2014
Jan.
2015
Avg.
2014
Jun.
2015
Avg.
2014
Jun.
2015 2013 2014
France 65.8 66.3 10.3 10.2 +0.7 +0.2 2 116 565 2 132 449
Germany 80.7 81.1 5.0 4.7 +0.9 +0.4 2 820 820 2 915 650
Italy 60.7 60.7 12.7 12.7 +0.3 +0.0 1 609 462 1 616 253
Netherlands 16.8 16.9 7.4 7.0 +0.5 +0.1 650 857 662 770
Spain 46.5 46.4 24.5 26.6 +0.0 -0.6 1 049 181 1 058 469
United
Kingdom 64.3 64.7 6.1 5.6 +1.7 +0.6 2 017 193 2 222 912
Source: Eurostat, June 2015
PULSE REPORT
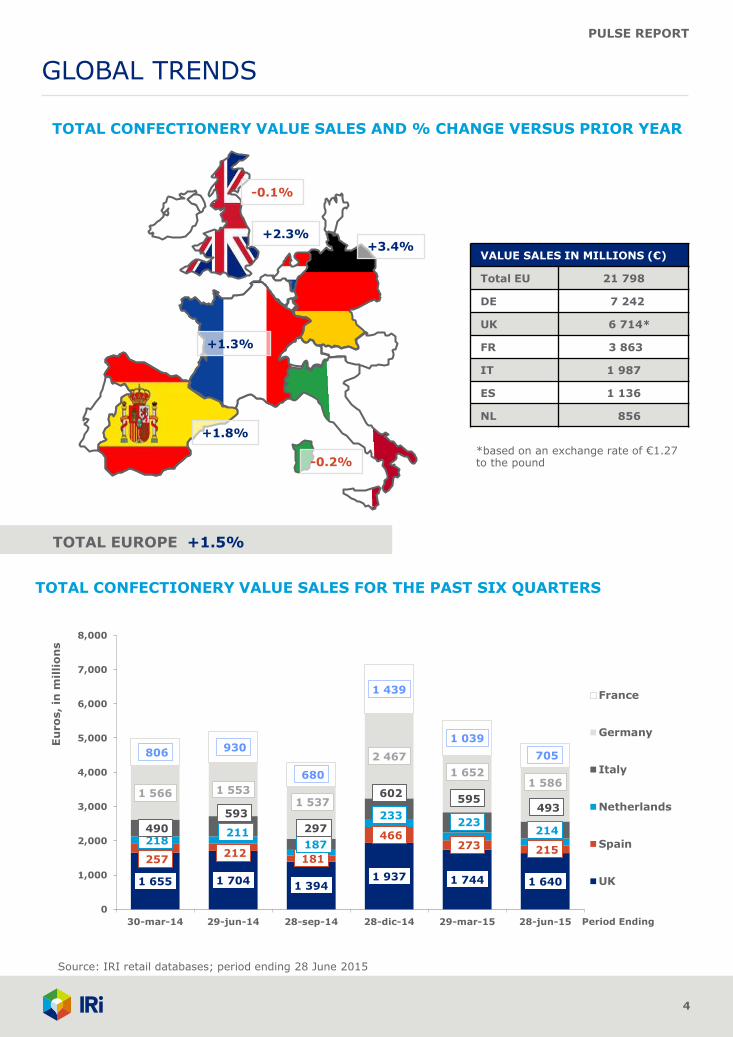
1 655 1 704 1 394
1 937 1 744 1 640
257 212
181
466 273 215
218 211
187
233 223
214 490
593
297
602 595
493
1 566 1 553 1 537
2 467
1 652 1 586
806 930
680
1 439
1 039
705
0
1,000
2,000
3,000
4,000
5,000
6,000
7,000
8,000
30-mar-14 29-jun-14 28-sep-14 28-dic-14 29-mar-15 28-jun-15
Eu
ro
s, in
millio
ns
Period Ending
France
Germany
Italy
Netherlands
Spain
UK
GLOBAL TRENDS
4
-0.2%
+3.4%
-0.1%
TOTAL EUROPE +1.5%
VALUE SALES IN MILLIONS (€)
Total EU 21 798
DE 7 242
UK 6 714*
FR 3 863
IT 1 987
ES 1 136
NL 856
TOTAL CONFECTIONERY VALUE SALES AND % CHANGE VERSUS PRIOR YEAR
*based on an exchange rate of €1.27 to the pound
+1.8%
+1.3%
+2.3%
TOTAL CONFECTIONERY VALUE SALES FOR THE PAST SIX QUARTERS
Source: IRI retail databases; period ending 28 June 2015
PULSE REPORT
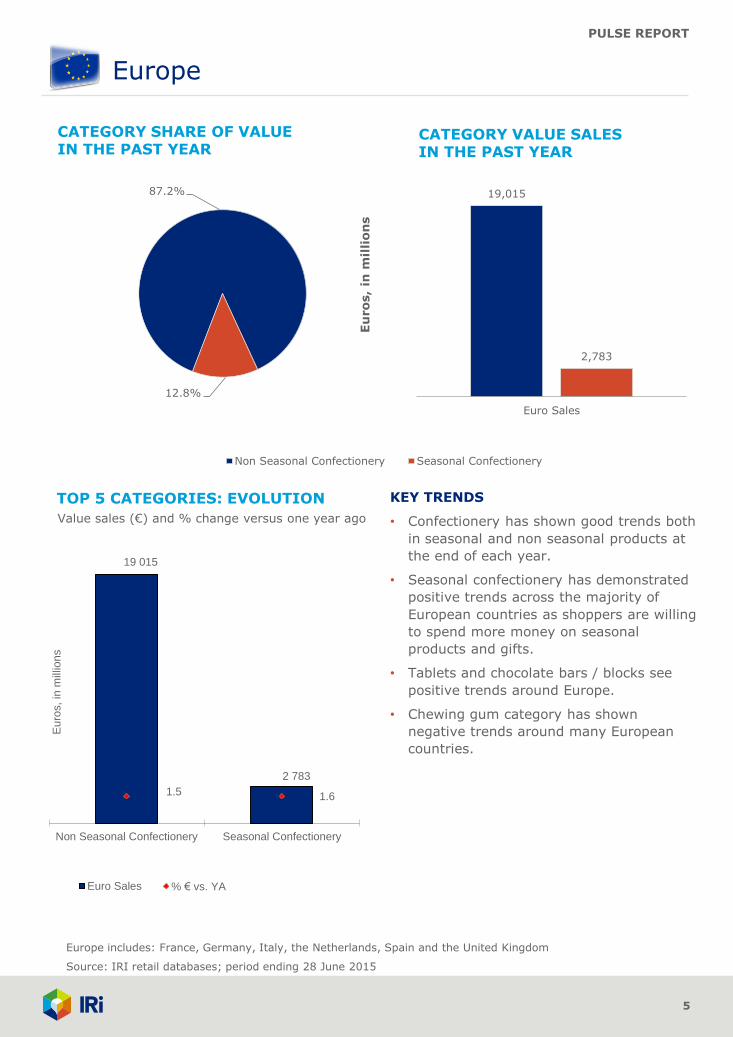
19 015
2 783
1.5 1.6
Non Seasonal Confectionery Seasonal Confectionery
Eu
ros,
in m
illio
ns
Euro Sales % € vs. YA
87.2%
12.8%
Non Seasonal Confectionery Seasonal Confectionery
Europe
5
19,015
2,783
Euro Sales
Eu
ros,
in m
illi
on
s
CATEGORY VALUE SALES IN THE PAST YEAR
CATEGORY SHARE OF VALUE IN THE PAST YEAR
Europe includes: France, Germany, Italy, the Netherlands, Spain and the United Kingdom
TOP 5 CATEGORIES: EVOLUTION
Value sales (€) and % change versus one year ago
Source: IRI retail databases; period ending 28 June 2015
KEY TRENDS
• Confectionery has shown good trends both
in seasonal and non seasonal products at
the end of each year.
• Seasonal confectionery has demonstrated
positive trends across the majority of
European countries as shoppers are willing
to spend more money on seasonal
products and gifts.
• Tablets and chocolate bars / blocks see
positive trends around Europe.
• Chewing gum category has shown
negative trends around many European
countries.
PULSE REPORT
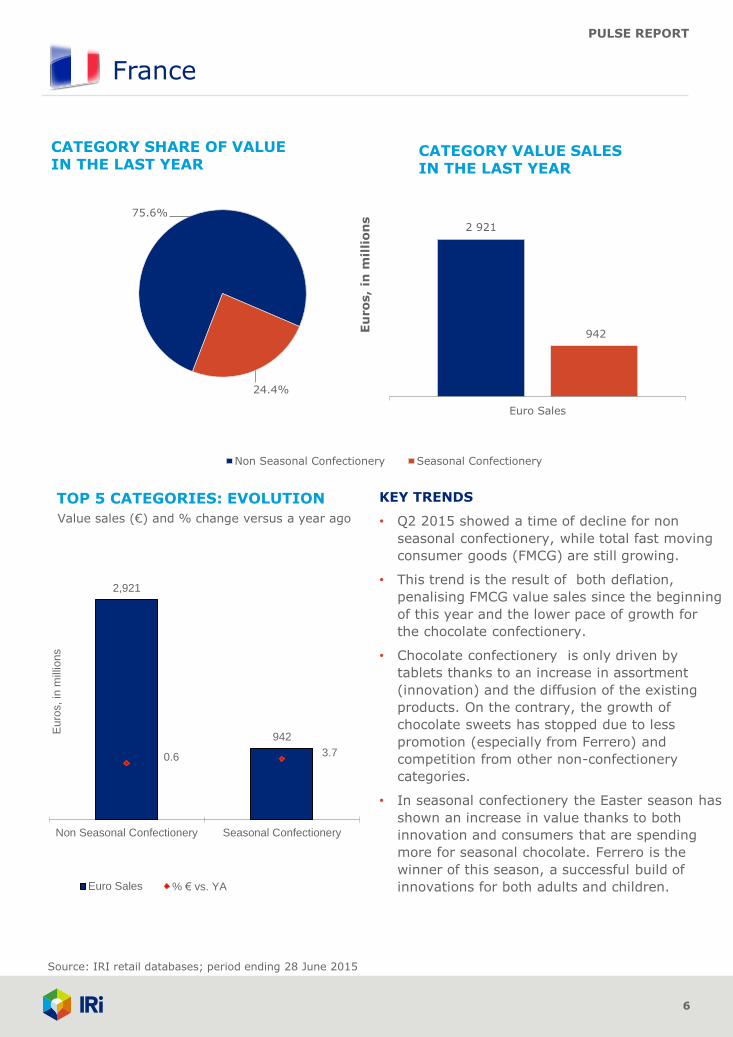
2,921
942
0.6 3.7
Non Seasonal Confectionery Seasonal Confectionery
Eu
ros,
in m
illio
ns
Euro Sales % € vs. YA
75.6%
24.4%
Non Seasonal Confectionery Seasonal Confectionery
France
6
KEY TRENDS
• Q2 2015 showed a time of decline for non
seasonal confectionery, while total fast moving
consumer goods (FMCG) are still growing.
• This trend is the result of both deflation,
penalising FMCG value sales since the beginning
of this year and the lower pace of growth for
the chocolate confectionery.
• Chocolate confectionery is only driven by
tablets thanks to an increase in assortment
(innovation) and the diffusion of the existing
products. On the contrary, the growth of
chocolate sweets has stopped due to less
promotion (especially from Ferrero) and
competition from other non-confectionery
categories.
• In seasonal confectionery the Easter season has
shown an increase in value thanks to both
innovation and consumers that are spending
more for seasonal chocolate. Ferrero is the
winner of this season, a successful build of
innovations for both adults and children.
2 921
942
Euro Sales
Eu
ros,
in m
illi
on
s
CATEGORY VALUE SALES IN THE LAST YEAR
CATEGORY SHARE OF VALUE IN THE LAST YEAR
Source: IRI retail databases; period ending 28 June 2015
TOP 5 CATEGORIES: EVOLUTION
Value sales (€) and % change versus a year ago
PULSE REPORT
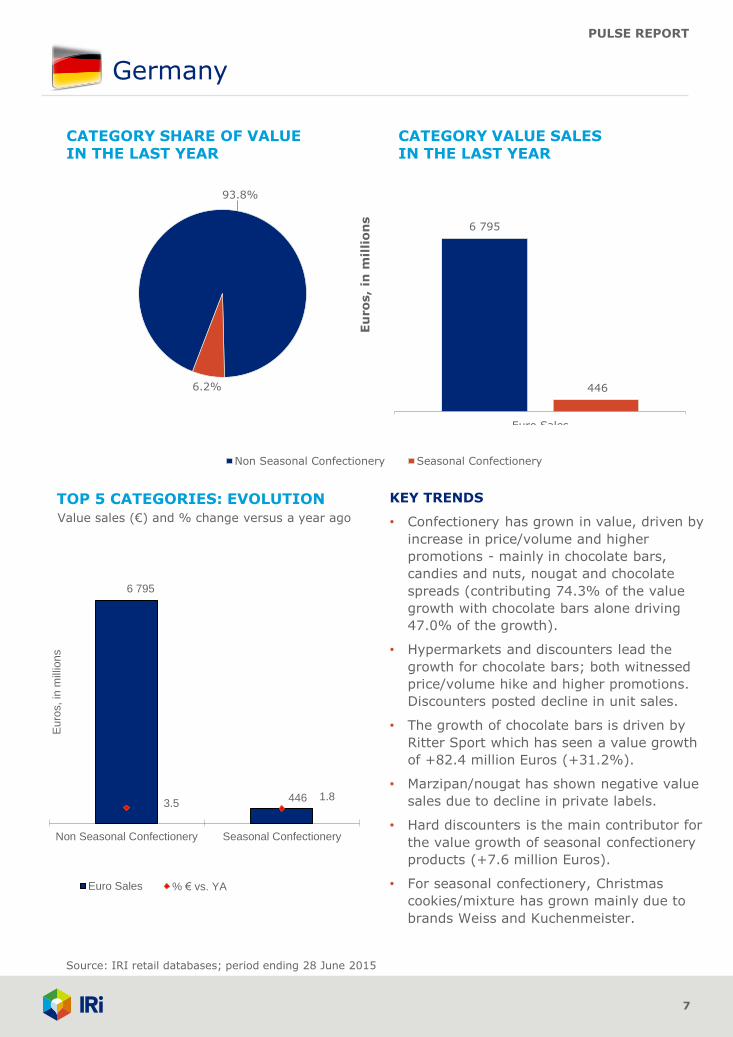
6 795
446 3.5
1.8
Non Seasonal Confectionery Seasonal Confectionery
Eu
ros,
in m
illio
ns
Euro Sales % € vs. YA
93.8%
6.2%
Non Seasonal Confectionery Seasonal Confectionery
Germany
7
KEY TRENDS
• Confectionery has grown in value, driven by
increase in price/volume and higher
promotions - mainly in chocolate bars,
candies and nuts, nougat and chocolate
spreads (contributing 74.3% of the value
growth with chocolate bars alone driving
47.0% of the growth).
• Hypermarkets and discounters lead the
growth for chocolate bars; both witnessed
price/volume hike and higher promotions.
Discounters posted decline in unit sales.
• The growth of chocolate bars is driven by
Ritter Sport which has seen a value growth
of +82.4 million Euros (+31.2%).
• Marzipan/nougat has shown negative value
sales due to decline in private labels.
• Hard discounters is the main contributor for
the value growth of seasonal confectionery
products (+7.6 million Euros).
• For seasonal confectionery, Christmas
cookies/mixture has grown mainly due to
brands Weiss and Kuchenmeister.
6 795
446
Euro Sales
Eu
ros,
in m
illi
on
s
CATEGORY VALUE SALES IN THE LAST YEAR
CATEGORY SHARE OF VALUE IN THE LAST YEAR
TOP 5 CATEGORIES: EVOLUTION
Value sales (€) and % change versus a year ago
Source: IRI retail databases; period ending 28 June 2015
PULSE REPORT
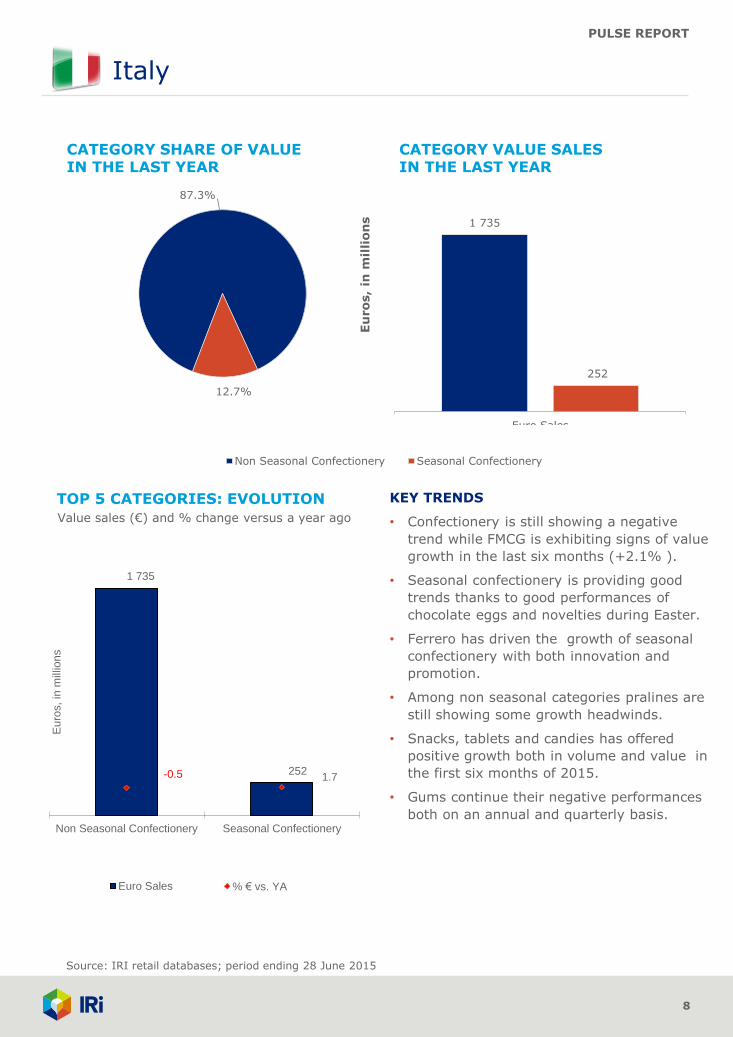
1 735
252 -0.5 1.7
Non Seasonal Confectionery Seasonal Confectionery
Eu
ros,
in m
illio
ns
Euro Sales % € vs. YA
87.3%
12.7%
Non Seasonal Confectionery Seasonal Confectionery
Italy
8
KEY TRENDS
• Confectionery is still showing a negative
trend while FMCG is exhibiting signs of value
growth in the last six months (+2.1% ).
• Seasonal confectionery is providing good
trends thanks to good performances of
chocolate eggs and novelties during Easter.
• Ferrero has driven the growth of seasonal
confectionery with both innovation and
promotion.
• Among non seasonal categories pralines are
still showing some growth headwinds.
• Snacks, tablets and candies has offered
positive growth both in volume and value in
the first six months of 2015.
• Gums continue their negative performances
both on an annual and quarterly basis.
1 735
252
Euro Sales
Eu
ros,
in m
illi
on
s
CATEGORY VALUE SALES IN THE LAST YEAR
CATEGORY SHARE OF VALUE IN THE LAST YEAR
Source: IRI retail databases; period ending 28 June 2015
TOP 5 CATEGORIES: EVOLUTION
Value sales (€) and % change versus a year ago
PULSE REPORT
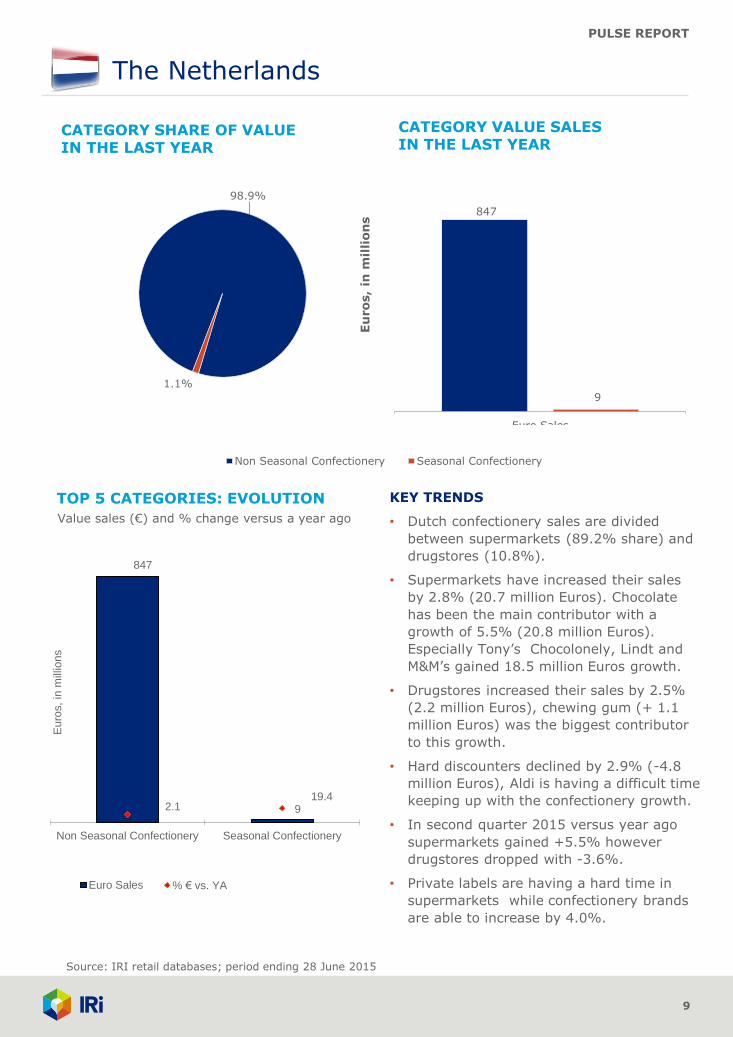
847
9 2.1 19.4
Non Seasonal Confectionery Seasonal Confectionery
Eu
ros,
in m
illio
ns
Euro Sales % € vs. YA
98.9%
1.1%
Non Seasonal Confectionery Seasonal Confectionery
The Netherlands
9
847
9
Euro Sales
Eu
ros,
in m
illi
on
s
CATEGORY VALUE SALES IN THE LAST YEAR
CATEGORY SHARE OF VALUE IN THE LAST YEAR
TOP 5 CATEGORIES: EVOLUTION
Value sales (€) and % change versus a year ago
Source: IRI retail databases; period ending 28 June 2015
KEY TRENDS
• Dutch confectionery sales are divided
between supermarkets (89.2% share) and
drugstores (10.8%).
• Supermarkets have increased their sales
by 2.8% (20.7 million Euros). Chocolate
has been the main contributor with a
growth of 5.5% (20.8 million Euros).
Especially Tony’s Chocolonely, Lindt and
M&M’s gained 18.5 million Euros growth.
• Drugstores increased their sales by 2.5%
(2.2 million Euros), chewing gum (+ 1.1
million Euros) was the biggest contributor
to this growth.
• Hard discounters declined by 2.9% (-4.8
million Euros), Aldi is having a difficult time
keeping up with the confectionery growth.
• In second quarter 2015 versus year ago
supermarkets gained +5.5% however
drugstores dropped with -3.6%.
• Private labels are having a hard time in
supermarkets while confectionery brands
are able to increase by 4.0%.
PULSE REPORT
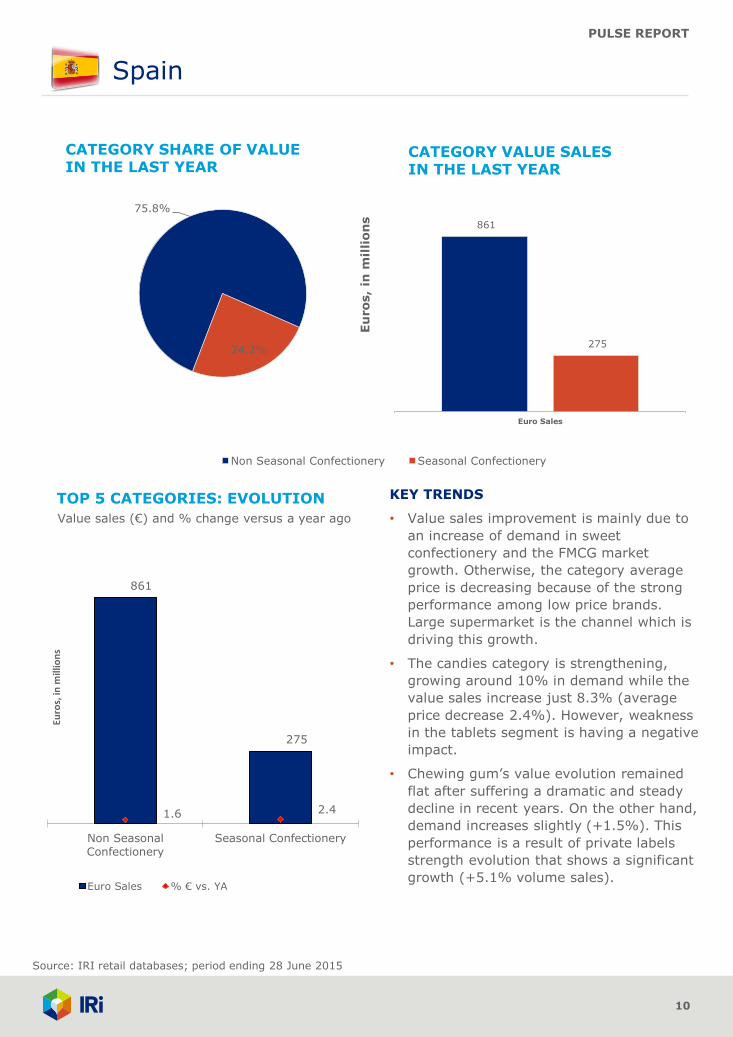
861
275
1.6 2.4
Non SeasonalConfectionery
Seasonal Confectionery
Euro
s, in
mill
ion
s
Euro Sales % € vs. YA
75.8%
24.2%
Non Seasonal Confectionery Seasonal Confectionery
Spain
10
KEY TRENDS
• Value sales improvement is mainly due to
an increase of demand in sweet
confectionery and the FMCG market
growth. Otherwise, the category average
price is decreasing because of the strong
performance among low price brands.
Large supermarket is the channel which is
driving this growth.
• The candies category is strengthening,
growing around 10% in demand while the
value sales increase just 8.3% (average
price decrease 2.4%). However, weakness
in the tablets segment is having a negative
impact.
• Chewing gum’s value evolution remained
flat after suffering a dramatic and steady
decline in recent years. On the other hand,
demand increases slightly (+1.5%). This
performance is a result of private labels
strength evolution that shows a significant
growth (+5.1% volume sales).
861
275
Euro Sales
Eu
ros,
in m
illi
on
s
CATEGORY VALUE SALES IN THE LAST YEAR
CATEGORY SHARE OF VALUE IN THE LAST YEAR
TOP 5 CATEGORIES: EVOLUTION
Value sales (€) and % change versus a year ago
Source: IRI retail databases; period ending 28 June 2015
PULSE REPORT
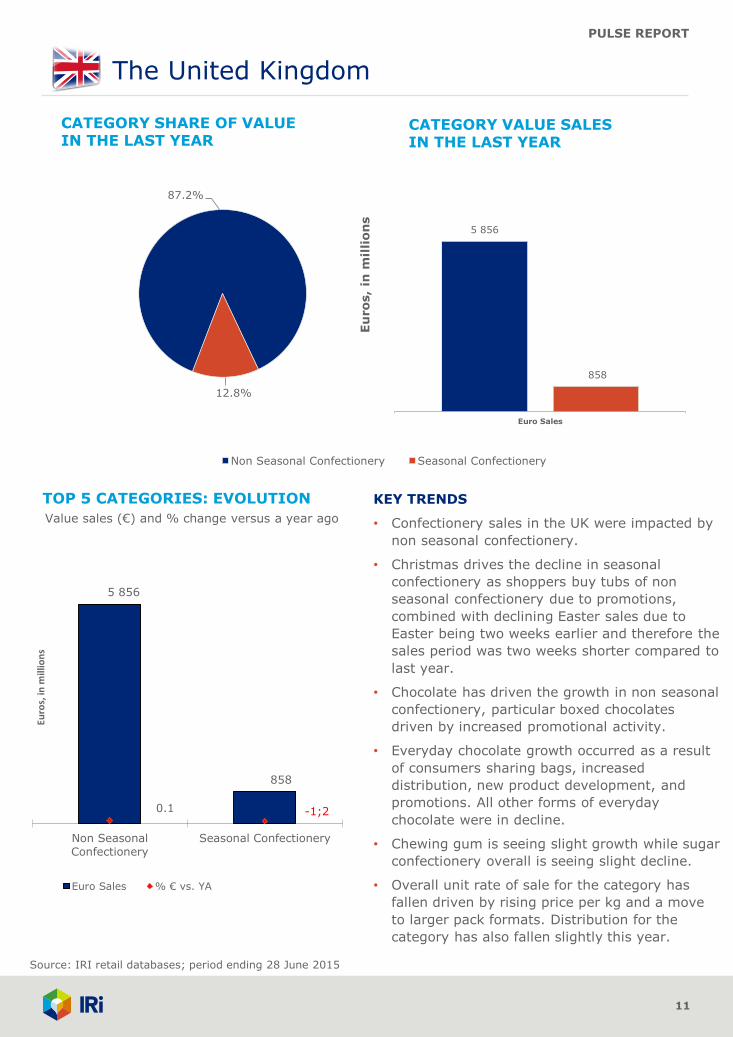
5 856
858
0.1 -1;2
Non SeasonalConfectionery
Seasonal Confectionery
Euro
s, in
mill
ion
s
Euro Sales % € vs. YA
87.2%
12.8%
Non Seasonal Confectionery Seasonal Confectionery
The United Kingdom
11
KEY TRENDS
• Confectionery sales in the UK were impacted by
non seasonal confectionery.
• Christmas drives the decline in seasonal
confectionery as shoppers buy tubs of non
seasonal confectionery due to promotions,
combined with declining Easter sales due to
Easter being two weeks earlier and therefore the
sales period was two weeks shorter compared to
last year.
• Chocolate has driven the growth in non seasonal
confectionery, particular boxed chocolates
driven by increased promotional activity.
• Everyday chocolate growth occurred as a result
of consumers sharing bags, increased
distribution, new product development, and
promotions. All other forms of everyday
chocolate were in decline.
• Chewing gum is seeing slight growth while sugar
confectionery overall is seeing slight decline.
• Overall unit rate of sale for the category has
fallen driven by rising price per kg and a move
to larger pack formats. Distribution for the
category has also fallen slightly this year.
5 856
858
Euro Sales
Eu
ros,
in m
illi
on
s
CATEGORY VALUE SALES IN THE LAST YEAR
CATEGORY SHARE OF VALUE IN THE LAST YEAR
TOP 5 CATEGORIES: EVOLUTION
Value sales (€) and % change versus a year ago
Source: IRI retail databases; period ending 28 June 2015
PULSE REPORT
Final Notes
12
Notes on category definitions for countries
Due to the diverse products found in individual countries across this market it was necessary to
consolidate the available data into the categories in this report. In some cases it wasn’t always
possible to align products across all six countries hence the need to highlight any anomalies in
the report. Those exceptions are listed below:
Confectionery
• The Netherlands and Italy data in this report includes toffee products whereas the other
countries do not.
PULSE REPORT
Resources
13
About IRI. IRI is a leader in delivering powerful market and shopper information, predictive analysis and the foresight
that leads to action. We go beyond the data to ignite extraordinary growth for our clients in the CPG, retail and over-
the-counter healthcare industries by pinpointing what matters and illuminating how it can impact their businesses
across sales and marketing. Move your business forward at IRIworldwide.eu
Arlington Square, Downshire Way, Bracknell, Berkshire RG12 1WA, Tel +44 (0) 1344 746000
Copyright © 2015 Information Resources, Inc. (IRI). All rights reserved. IRI, the IRI logo and the names of IRI products and services
referenced herein are either trademarks or registered trademarks of IRI. All other trademarks are the property of their respective owners.
FOR MORE INFORMATION
Please contact Cristina Lazzaroni, Consultant, IRI at
+ 39 02 52579 333with questions or comments about this report.
To gain insight into opportunities across specific categories, segments, channels, or retailers,
contact your IRI client service representative regarding custom analysis leveraging the
following resources:
• InfoScan Census® is a syndicated retail tracking service that enables manufacturers and
retailers to acquire industry insights used to make better business decisions. InfoScan
Census utilizes the data that IRI collects from grocery, drug, and mass merchandise retailers
to provide the most comprehensive and accurate syndicated data offering in the FMCG
sector. With access to accurate, granular detail by category, geography, measure, and time
period, clients have the tools needed to develop marketing and sales strategies based on
product performance, distribution, and promotion responsiveness. All data about
confectionery comes from InfoScan Census.
• IRI Consulting provides strategic insights and advice leveraging a variety of data sources,
predictive analytics, enabling technologies, and business analyses to help FMCG
manufacturers and retailers address significant sales and marketing issues effectively.