Embed Size (px)
Citation preview
IRD glaciological activities in the tropical Andes
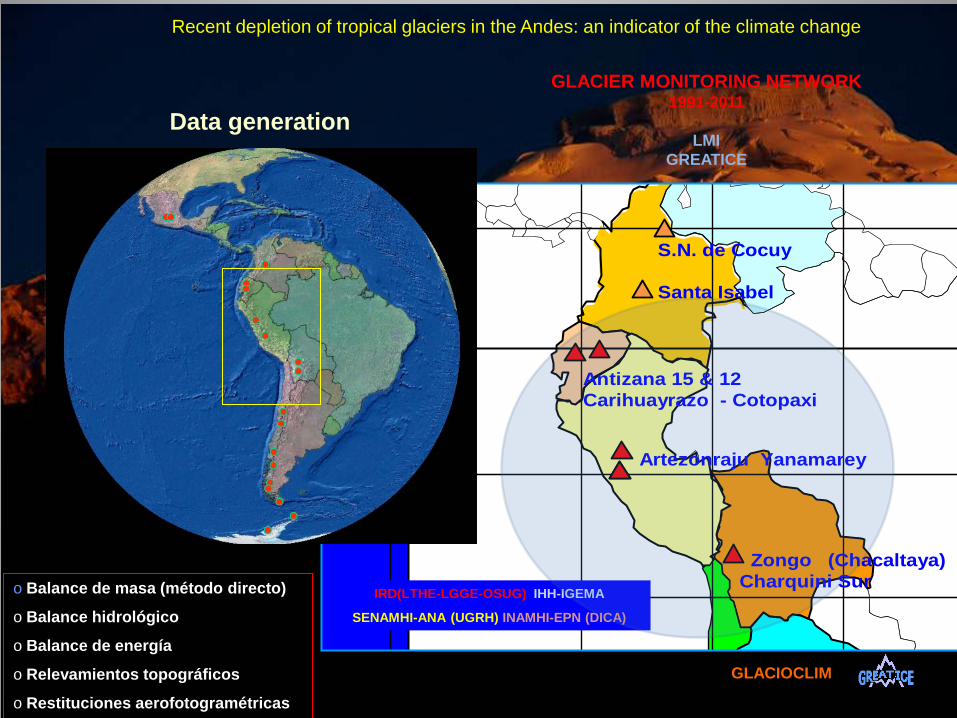
The recent depletion of tropical glaciers in the Andes: an indicator of climate change
evidences, analysis & institutional background
Jean Emmanuel Sicart and Bernard Francou, IRD, La Paz, Bolivia
Laboratorio Mixto Internacional LMI
©BF
GLACIOCLIM, a global network
GLACIOCLIM : a global observation network
Brésil Pérou
Equateur
Chili
French Alps (LGGE) Saint Sorlin, Argentière (45°N) Gébroulaz, Mer de Glace, Sarennes
Andes / Himalaya (IRD et local partners) Antizana (Ecuador, 0°) Zongo (Bolivia, 16°S) Chhota Shigri (India, 32°N) Mera (Nepal, 27°N)
Antarctica (LGGE-IPEV)
Cap Prud’Homme (67°S) Dôme C (75°S)
Global network including glacio-meteo-hydrological observations : >50 yrs (Alps), >20 yrs (Andes), 8 yrs (Himalaya) et 7 yrs (Antarctica)
http://www-lgge.ujf-grenoble.fr/ServiceObs/index.htm
Venezuela
0°
10 °S
20 °S
10 °N
S.N. de Cocuy Santa Isabel
Antizana 15 & 12 Carihuayrazo - Cotopaxi
Artezonraju Yanamarey ó
Zongo (Chacaltaya) Charquini Sur
Data generation
IRD(LTHE-LGGE-OSUG) IHH-IGEMA
SENAMHI-ANA (UGRH) INAMHI-EPN (DICA)
GLACIOCLIM
GLACIER MONITORING NETWORK 1991-2011
LMI
GREATICE
Recent depletion of tropical glaciers in the Andes: an indicator of the climate change
o Balance de masa (método directo)
o Balance hidrológico
o Balance de energía
o Relevamientos topográficos
o Restituciones aerofotogramétricas
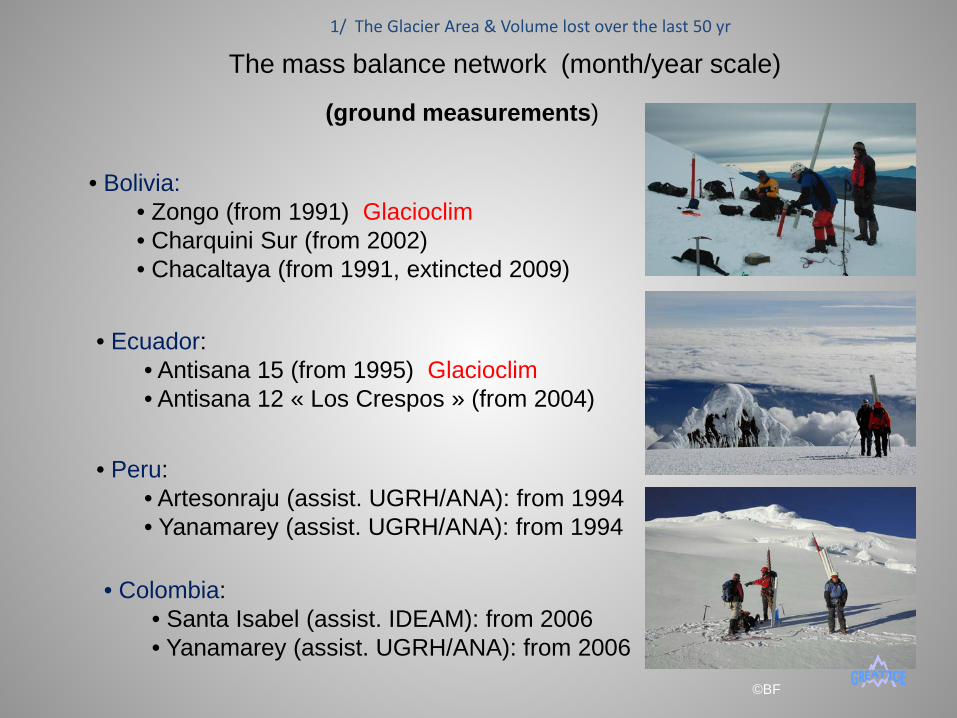
The mass balance network (month/year scale)
(ground measurements)
• Bolivia: • Zongo (from 1991) Glacioclim • Charquini Sur (from 2002) • Chacaltaya (from 1991, extincted 2009)
• Ecuador: • Antisana 15 (from 1995) Glacioclim • Antisana 12 « Los Crespos » (from 2004)
• Peru: • Artesonraju (assist. UGRH/ANA): from 1994 • Yanamarey (assist. UGRH/ANA): from 1994
• Colombia: • Santa Isabel (assist. IDEAM): from 2006 • Yanamarey (assist. UGRH/ANA): from 2006
1/ The Glacier Area & Volume lost over the last 50 yr
©BF
Exemple : le Glacier Zongo (Bolivie, 16°S), zone tropicale externe
Vue aérienne du glacier Zongo (août 2000 )
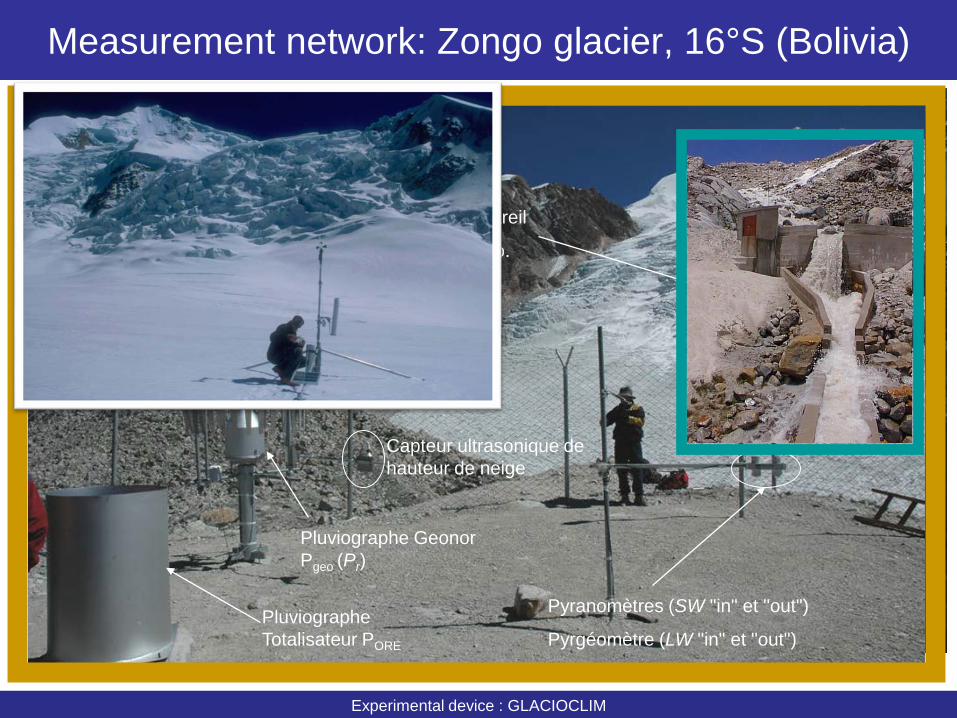
Measurement network: Zongo glacier, 16°S (Bolivia)
Experimental device : GLACIOCLIM
Balises d’ablation Carottages d’accumulation
Bilans : • glaciologique
Station hydrographique Pluviomètres
• hydrologique
Stations météo sur et hors glacier
• d’énergie
Pluviographe Geonor Pgeo (Pr)
Pluviographe Totalisateur PORE
Pyranomètres (SW "in" et "out")
Pyrgéomètre (LW "in" et "out")
Capteur ultrasonique de hauteur de neige
Appareil
photo.
Station SO/GlacioClim
©BF
1/ THE GLACIER AREAS & VOLUME LOST OVER THE LAST 50 YR 2/ LINKING GLACIER MASS BALANCE & CLIMATE VARIABILITY: the « Pacific forcing » 3/ LINKING ATMOSPHERE & GLACIER: the ablation processes 4/ INSTITUTIONNAL ORGANIZATION: the LMI GREAT ICE
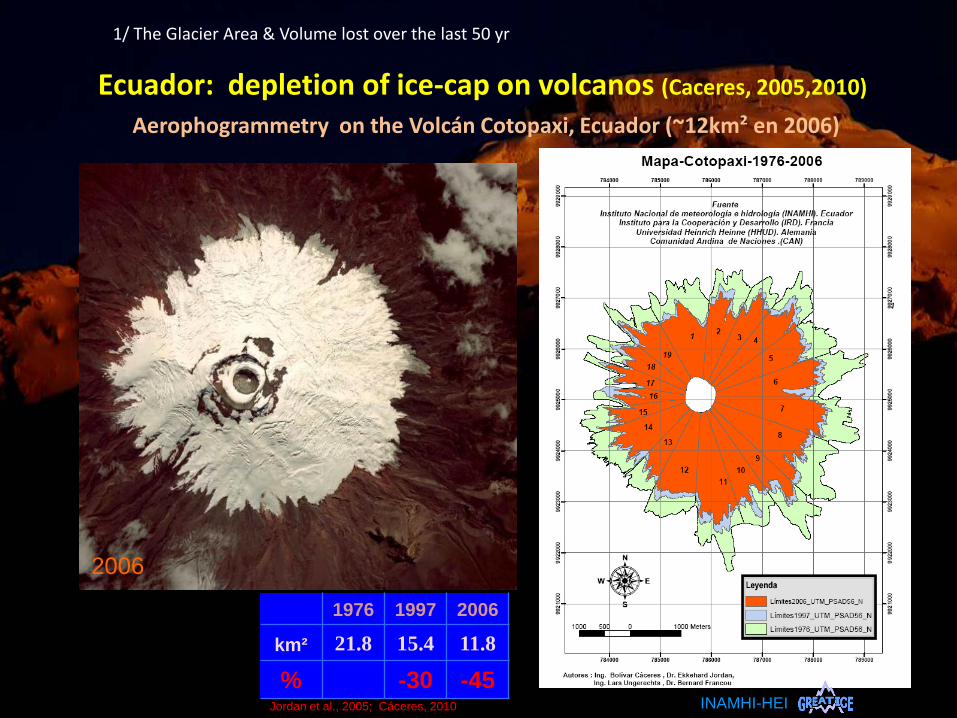
Ecuador: depletion of ice-cap on volcanos (Caceres, 2005,2010)
Aerophogrammetry on the Volcán Cotopaxi, Ecuador (~12km² en 2006)
1976 1997 2006
km² 21.8 15.4 11.8
% -30 -45 INAMHI-HEI
2006
1/ The Glacier Area & Volume lost over the last 50 yr
Jordan et al., 2005; Cáceres, 2010
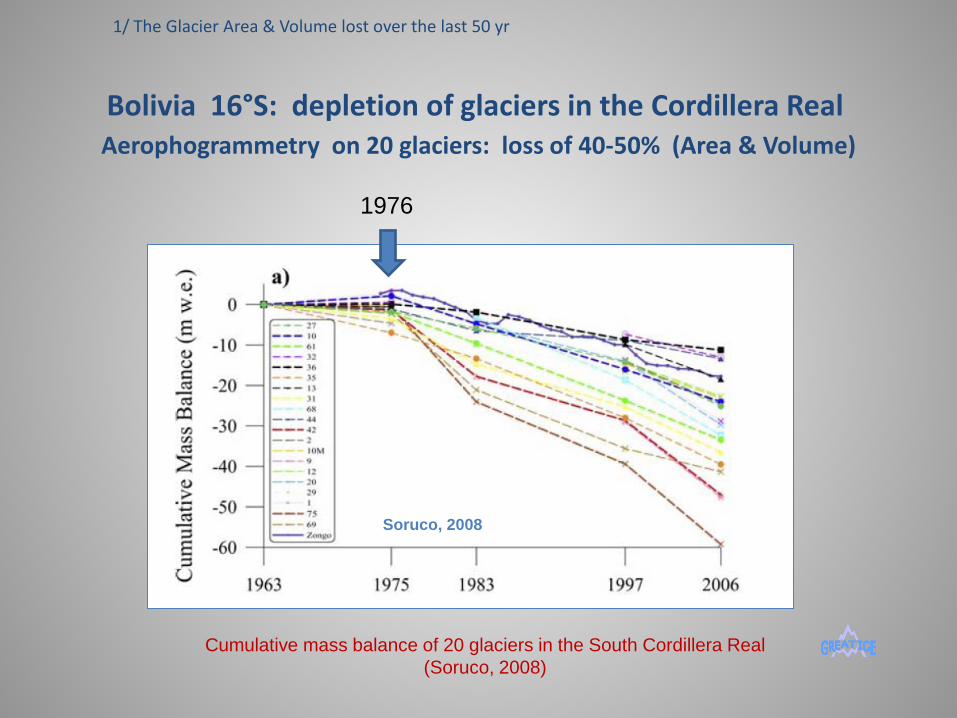
Cumulative mass balance of 20 glaciers in the South Cordillera Real (Soruco, 2008)
Soruco, 2008
Bolivia 16°S: depletion of glaciers in the Cordillera Real Aerophogrammetry on 20 glaciers: loss of 40-50% (Area & Volume)
1/ The Glacier Area & Volume lost over the last 50 yr
1976
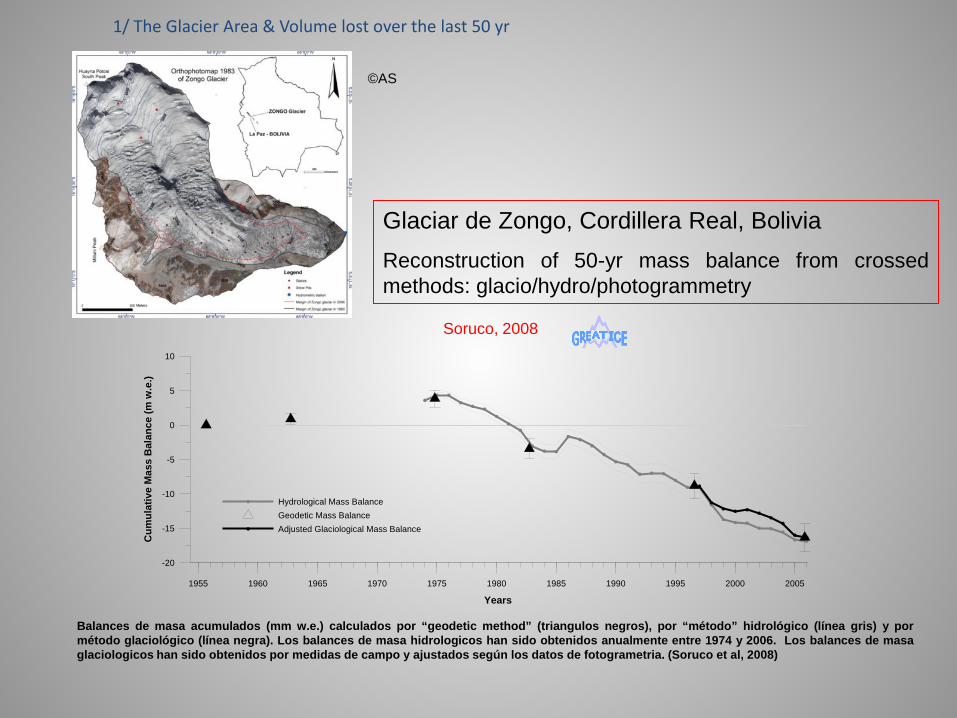
Glaciar de Zongo, Cordillera Real, Bolivia Reconstruction of 50-yr mass balance from crossed methods: glacio/hydro/photogrammetry
1955 1960 1965 1970 1975 1980 1985 1990 1995 2000 2005
Years
-20
-15
-10
-5
0
5
10
Cum
ulat
ive
Mas
s B
alan
ce (m
w.e
.)
Hydrological Mass BalanceGeodetic Mass BalanceAdjusted Glaciological Mass Balance
Balances de masa acumulados (mm w.e.) calculados por “geodetic method” (triangulos negros), por “método” hidrológico (línea gris) y por método glaciológico (línea negra). Los balances de masa hidrologicos han sido obtenidos anualmente entre 1974 y 2006. Los balances de masa glaciologicos han sido obtenidos por medidas de campo y ajustados según los datos de fotogrametria. (Soruco et al, 2008)
Soruco, 2008
1/ The Glacier Area & Volume lost over the last 50 yr
©AS
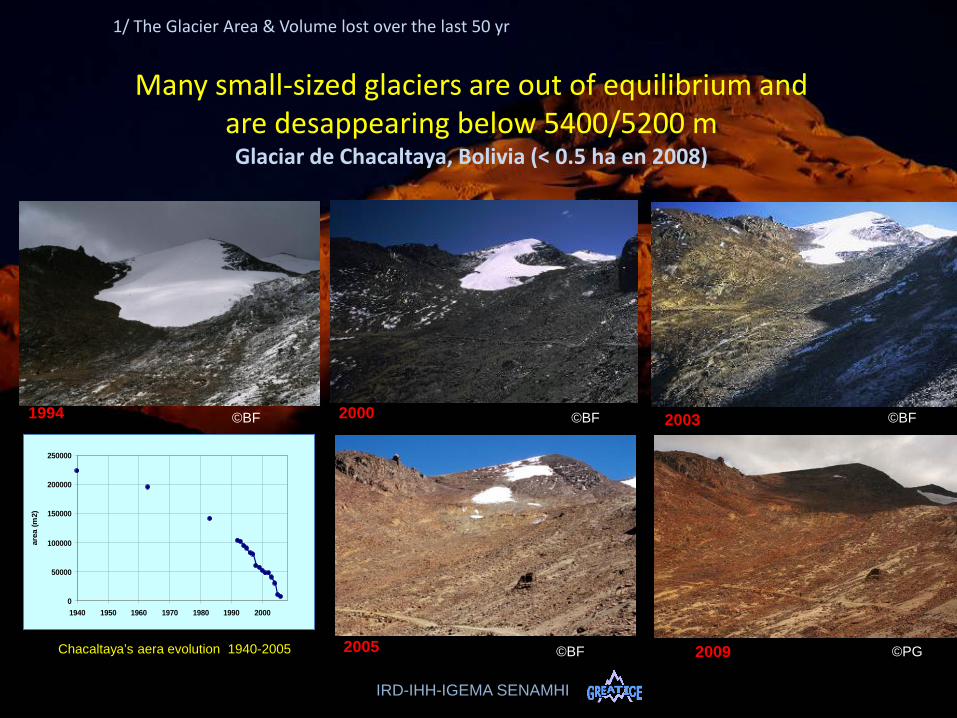
Many small-sized glaciers are out of equilibrium and are desappearing below 5400/5200 m Glaciar de Chacaltaya, Bolivia (< 0.5 ha en 2008)
0
50000
100000
150000
200000
250000
1940 1950 1960 1970 1980 1990 2000
area
(m2)
2000 2003
2005
1994
IRD-IHH-IGEMA SENAMHI
Chacaltaya’s aera evolution 1940-2005 2009
1/ The Glacier Area & Volume lost over the last 50 yr
©BF ©BF ©BF
©BF ©PG
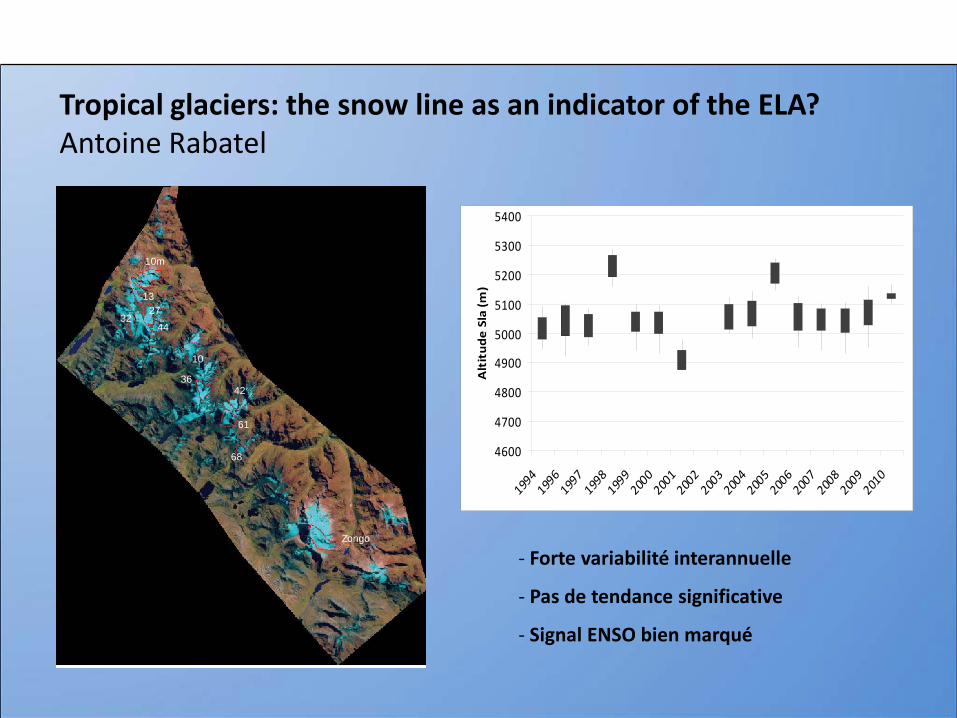
Tropical glaciers: the snow line as an indicator of the ELA? Antoine Rabatel
10m
13
3227
44
10
3642
61
68
Zongo
4600
4700
4800
4900
5000
5100
5200
5300
5400
1994
1996
1997
1998
1999
2000
2001
2002
2003
2004
2005
2006
2007
2008
2009
2010
Alt
itud
e Sl
a (m
)
- Forte variabilité interannuelle
- Pas de tendance significative
- Signal ENSO bien marqué
0
1
2
3
4
1600 1700 1800 1900 2000Years (AD)
Are
a (k
m²)
Huayna Potosi
Condoriri
Ichu Kota
Charquini
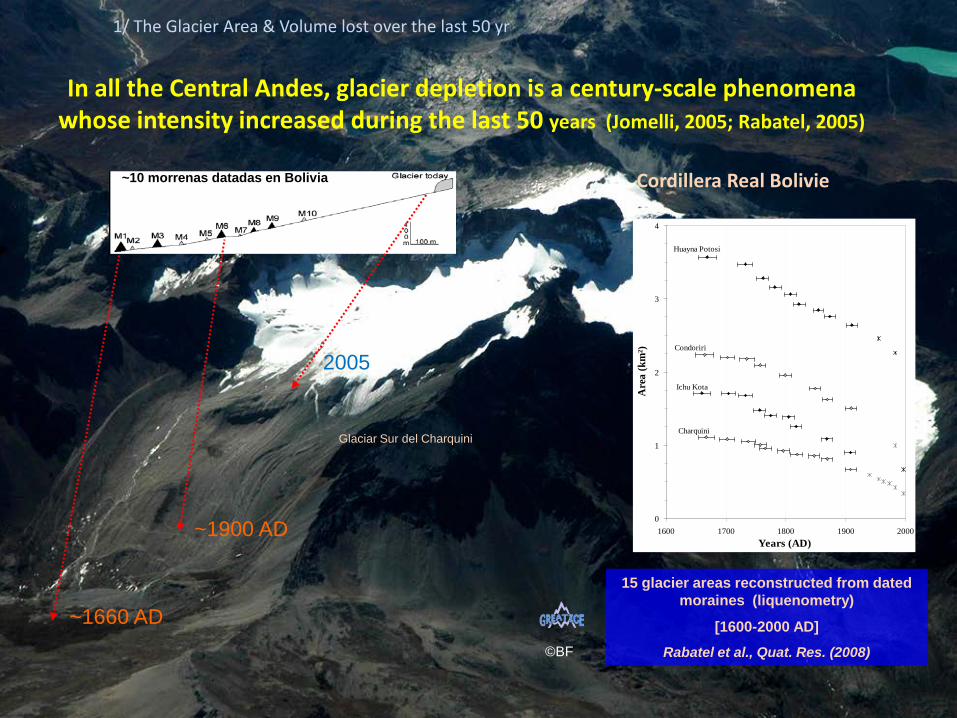
15 glacier areas reconstructed from dated moraines (liquenometry)
[1600-2000 AD] Rabatel et al., Quat. Res. (2008)
~10 morrenas datadas en Bolivia
~1660 AD
~1900 AD
2005
In all the Central Andes, glacier depletion is a century-scale phenomena whose intensity increased during the last 50 years (Jomelli, 2005; Rabatel, 2005)
Cordillera Real Bolivie
Glaciar Sur del Charquini
1/ The Glacier Area & Volume lost over the last 50 yr
©BF
Some perspectives….
1. Ecuador: Multitemporal aerophotogrammetric analysis of Antisana glaciers (0°28 S Ecuador): Ruben Basantes (PhD, 2012-2015, LGGE/Grenoble (B.Francou,A.Rabatel, Marcos Villacis)
2. Bolivia: terrestrial / areal photogrammetry (Alvaro soruco)
3. Peru : Multitemporal aerophogrammetric analysis of Artesonraju glaciers (9°S) : in project (collaboration)
1/ The Glacier Area & Volume lost over the last 50 yr
WARM
COLD
MEI
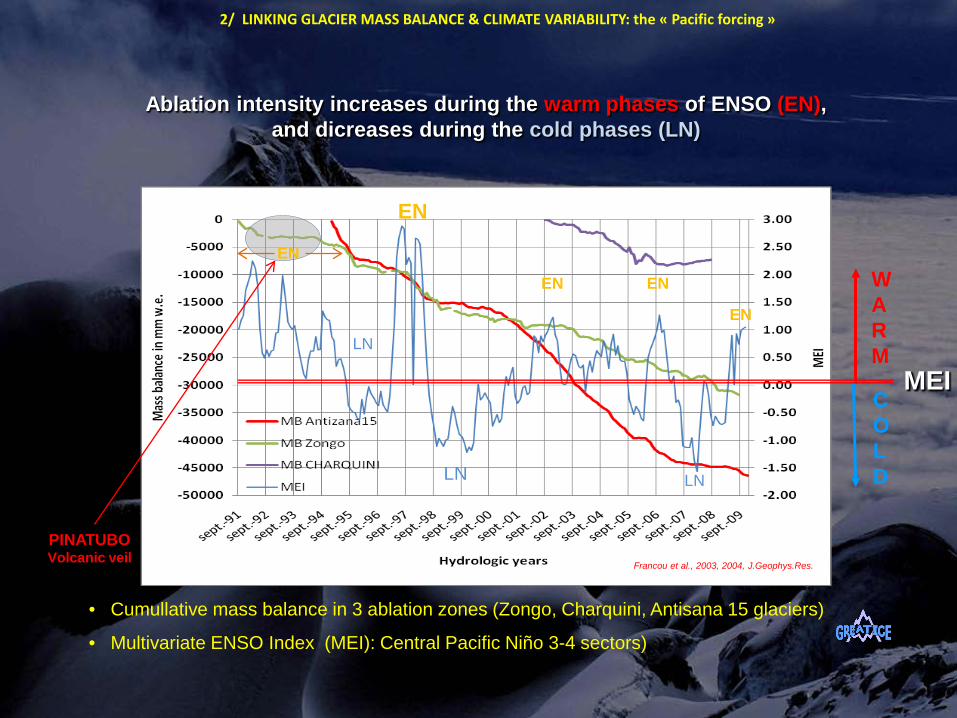
Ablation intensity increases during the warm phases of ENSO (EN), and dicreases during the cold phases (LN)
• Cumullative mass balance in 3 ablation zones (Zongo, Charquini, Antisana 15 glaciers)
• Multivariate ENSO Index (MEI): Central Pacific Niño 3-4 sectors)
EN
EN
EN EN
LN
LN
LN
EN
PINATUBO Volcanic veil
Francou et al., 2003, 2004, J.Geophys.Res.
2/ LINKING GLACIER MASS BALANCE & CLIMATE VARIABILITY: the « Pacific forcing »
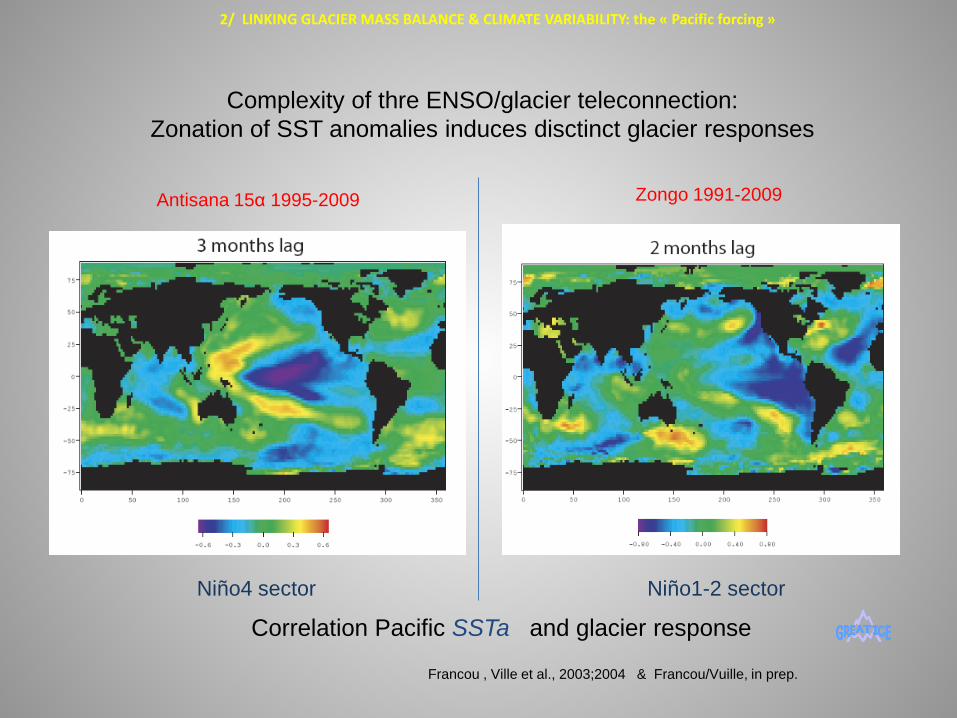
Correlation Pacific SSTa and glacier response
Antisana 15α 1995-2009 Zongo 1991-2009
Niño4 sector Niño1-2 sector
Complexity of thre ENSO/glacier teleconnection: Zonation of SST anomalies induces disctinct glacier responses
Francou , Ville et al., 2003;2004 & Francou/Vuille, in prep.
2/ LINKING GLACIER MASS BALANCE & CLIMATE VARIABILITY: the « Pacific forcing »
Some perspectives…
How glaciers of the tropical Andes do reflect complexity of the climate variability at regional scale?
1) How does the teleconnexion with SST tropical Pacific change with ENSO at multidecal scale (1991-2010: Eastern Pacific El Niño vs Central Pacific El Niño)?
2) How does the atmosphere warming at global scale affect tropical glaciers in the Andes? Observation and modeling.
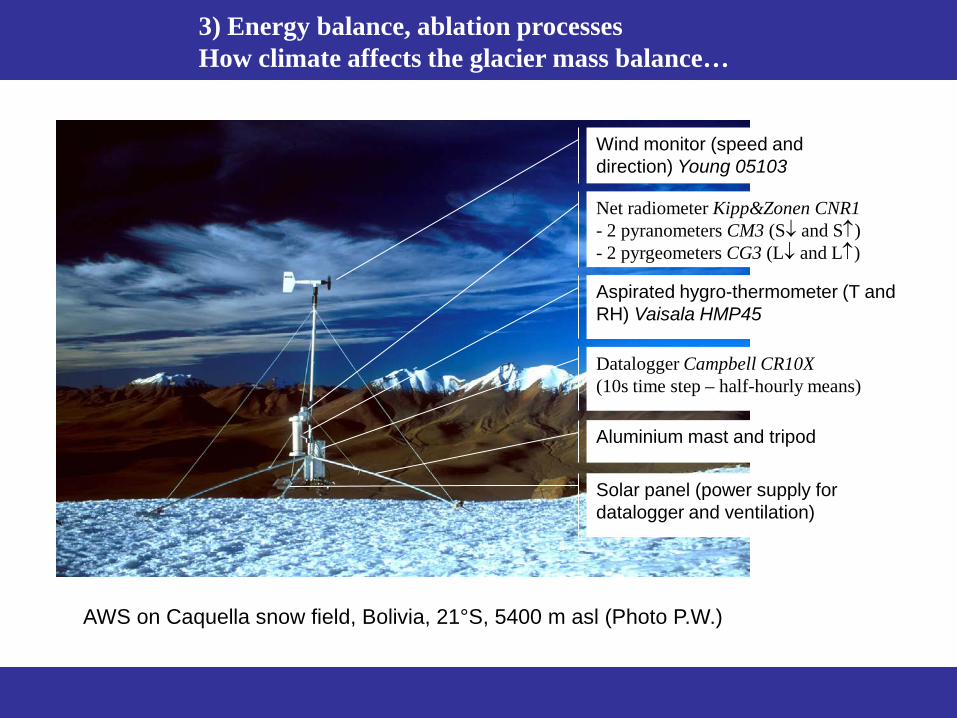
AWS on Caquella snow field, Bolivia, 21°S, 5400 m asl (Photo P.W.)
Wind monitor (speed and direction) Young 05103
Net radiometer Kipp&Zonen CNR1 - 2 pyranometers CM3 (S↓ and S↑) - 2 pyrgeometers CG3 (L↓ and L↑)
Aspirated hygro-thermometer (T and RH) Vaisala HMP45
Datalogger Campbell CR10X (10s time step – half-hourly means)
Solar panel (power supply for datalogger and ventilation)
Aluminium mast and tripod
3) Energy balance, ablation processes How climate affects the glacier mass balance…
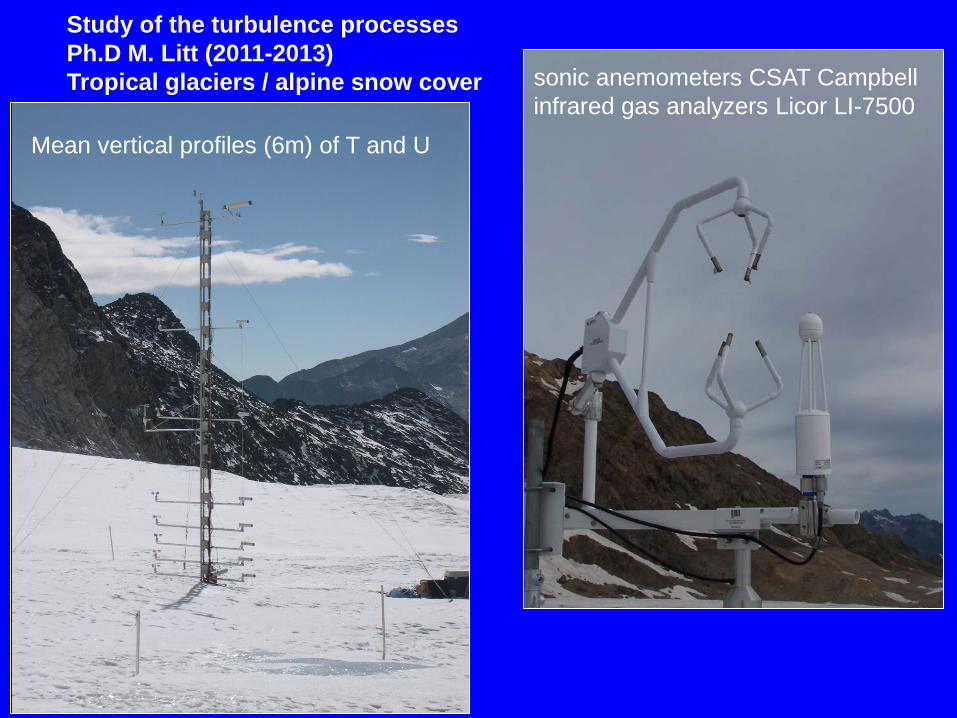
Study of the turbulence processes Ph.D M. Litt (2011-2013) Tropical glaciers / alpine snow cover sonic anemometers CSAT Campbell
infrared gas analyzers Licor LI-7500 Mean vertical profiles (6m) of T and U
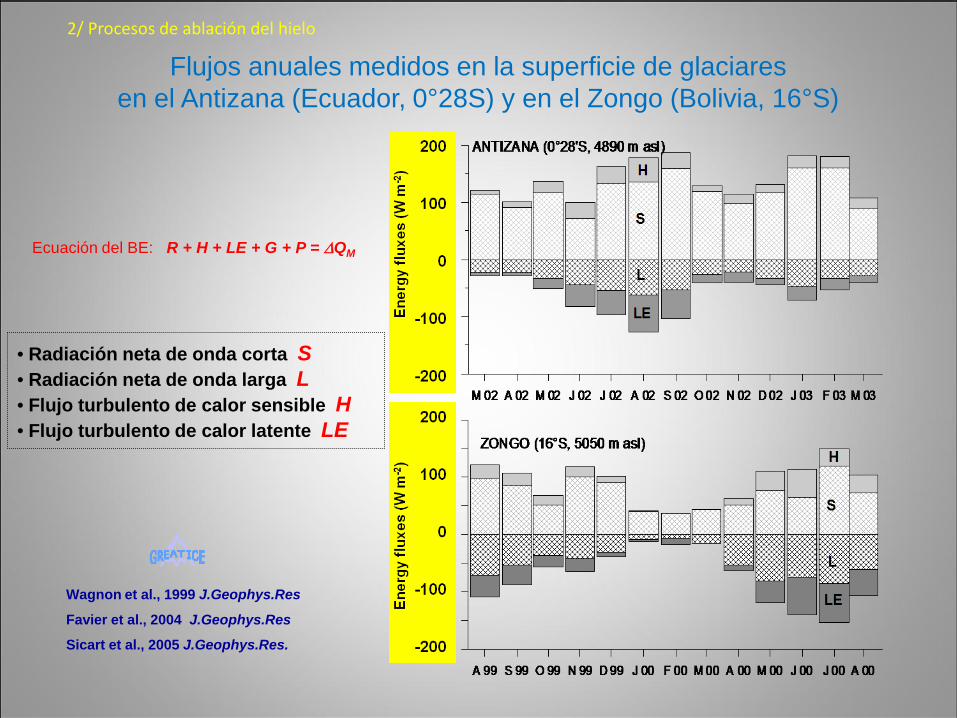
• Radiación neta de onda corta S • Radiación neta de onda larga L • Flujo turbulento de calor sensible H • Flujo turbulento de calor latente LE
Wagnon et al., 1999 J.Geophys.Res
Favier et al., 2004 J.Geophys.Res
Sicart et al., 2005 J.Geophys.Res.
Flujos anuales medidos en la superficie de glaciares en el Antizana (Ecuador, 0°28S) y en el Zongo (Bolivia, 16°S)
Ecuación del BE: R + H + LE + G + P = ∆QM
2/ Procesos de ablación del hielo
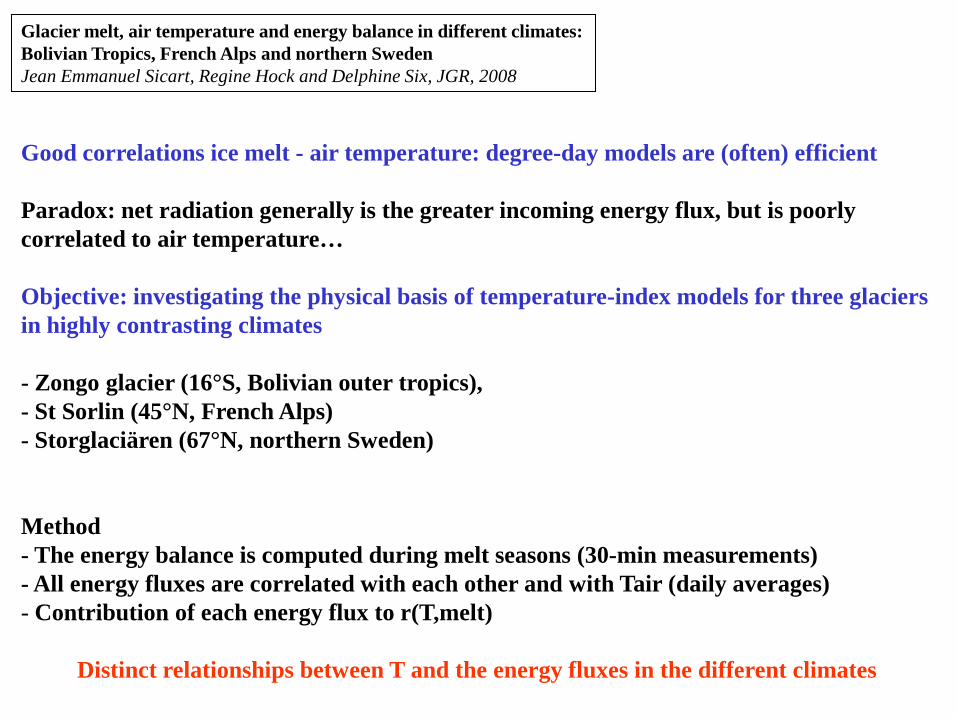
Good correlations ice melt - air temperature: degree-day models are (often) efficient Paradox: net radiation generally is the greater incoming energy flux, but is poorly correlated to air temperature… Objective: investigating the physical basis of temperature-index models for three glaciers in highly contrasting climates - Zongo glacier (16°S, Bolivian outer tropics), - St Sorlin (45°N, French Alps) - Storglaciären (67°N, northern Sweden) Method - The energy balance is computed during melt seasons (30-min measurements) - All energy fluxes are correlated with each other and with Tair (daily averages) - Contribution of each energy flux to r(T,melt)
Distinct relationships between T and the energy fluxes in the different climates
Glacier melt, air temperature and energy balance in different climates: Bolivian Tropics, French Alps and northern Sweden Jean Emmanuel Sicart, Regine Hock and Delphine Six, JGR, 2008
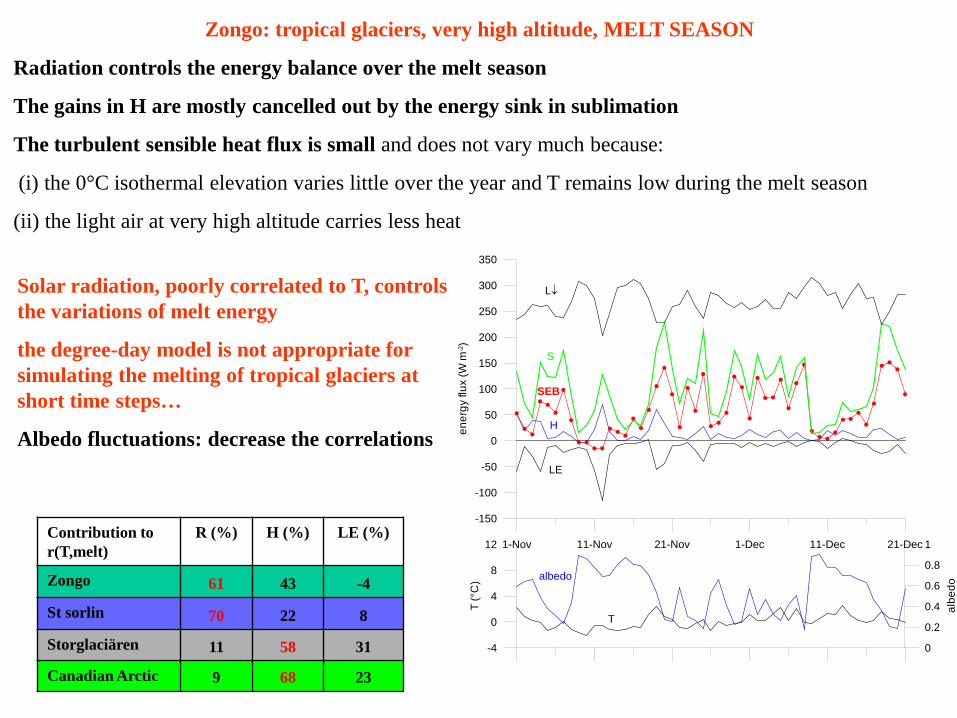
Zongo: tropical glaciers, very high altitude, MELT SEASON
Radiation controls the energy balance over the melt season
The gains in H are mostly cancelled out by the energy sink in sublimation
The turbulent sensible heat flux is small and does not vary much because:
(i) the 0°C isothermal elevation varies little over the year and T remains low during the melt season
(ii) the light air at very high altitude carries less heat
1-Nov 11-Nov 21-Nov 1-Dec 11-Dec 21-Dec
-150
-100
-50
0
50
100
150
200
250
300
350
ener
gy fl
ux (W
m-2)
-4
0
4
8
12
T (°
C)
0
0.2
0.4
0.6
0.8
1
albe
do
L↓
S
SEB
H
LE
albedo
T
Solar radiation, poorly correlated to T, controls the variations of melt energy
the degree-day model is not appropriate for simulating the melting of tropical glaciers at short time steps…
Albedo fluctuations: decrease the correlations
Contribution to r(T,melt)
R (%) H (%) LE (%)
Zongo 61 43 -4
St sorlin 70 22 8
Storglaciären 11 58 31
Canadian Arctic 9 68 23
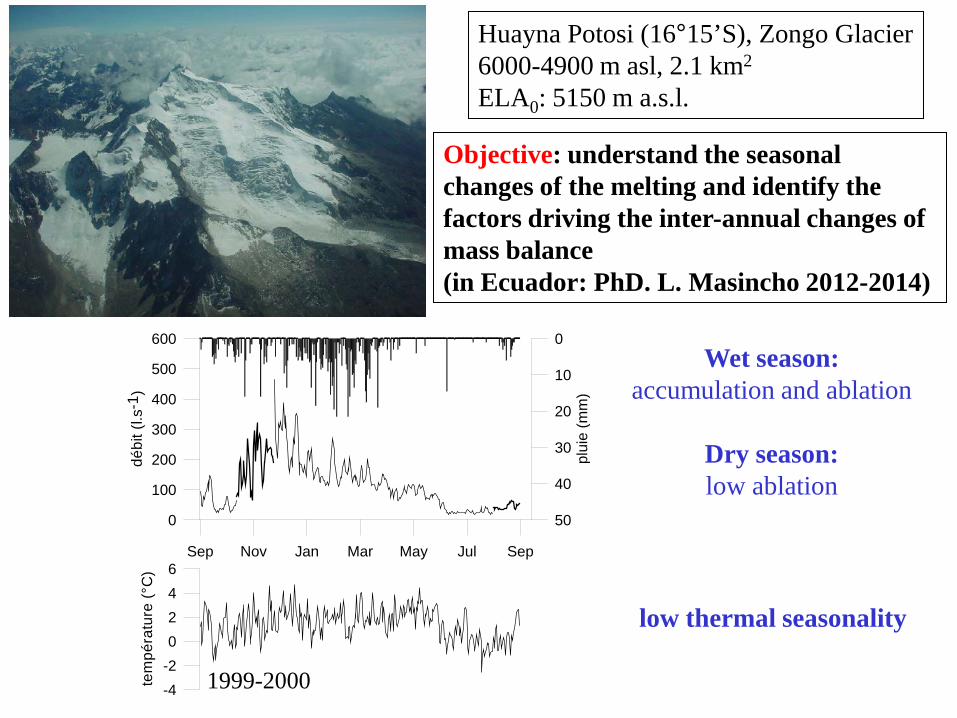
low thermal seasonality
Wet season: accumulation and ablation
Dry season: low ablation
Sep Nov Jan Mar May Jul Sep
0
100
200
300
400
500
600
débi
t (l.s
-1)
50
40
30
20
10
0
plui
e (m
m)
-4-20246
tem
péra
ture
(°C
)
1999-2000
Huayna Potosi (16°15’S), Zongo Glacier 6000-4900 m asl, 2.1 km2 ELA0: 5150 m a.s.l.
Objective: understand the seasonal changes of the melting and identify the factors driving the inter-annual changes of mass balance (in Ecuador: PhD. L. Masincho 2012-2014)
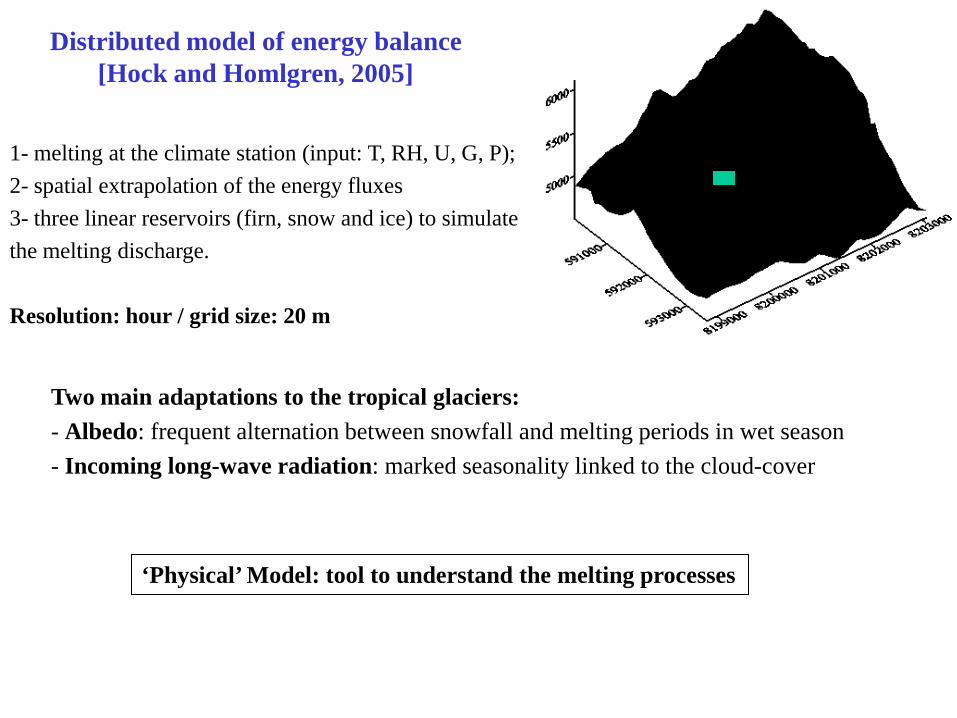
Distributed model of energy balance [Hock and Homlgren, 2005]
1- melting at the climate station (input: T, RH, U, G, P); 2- spatial extrapolation of the energy fluxes 3- three linear reservoirs (firn, snow and ice) to simulate the melting discharge. Resolution: hour / grid size: 20 m
‘Physical’ Model: tool to understand the melting processes
Two main adaptations to the tropical glaciers: - Albedo: frequent alternation between snowfall and melting periods in wet season - Incoming long-wave radiation: marked seasonality linked to the cloud-cover
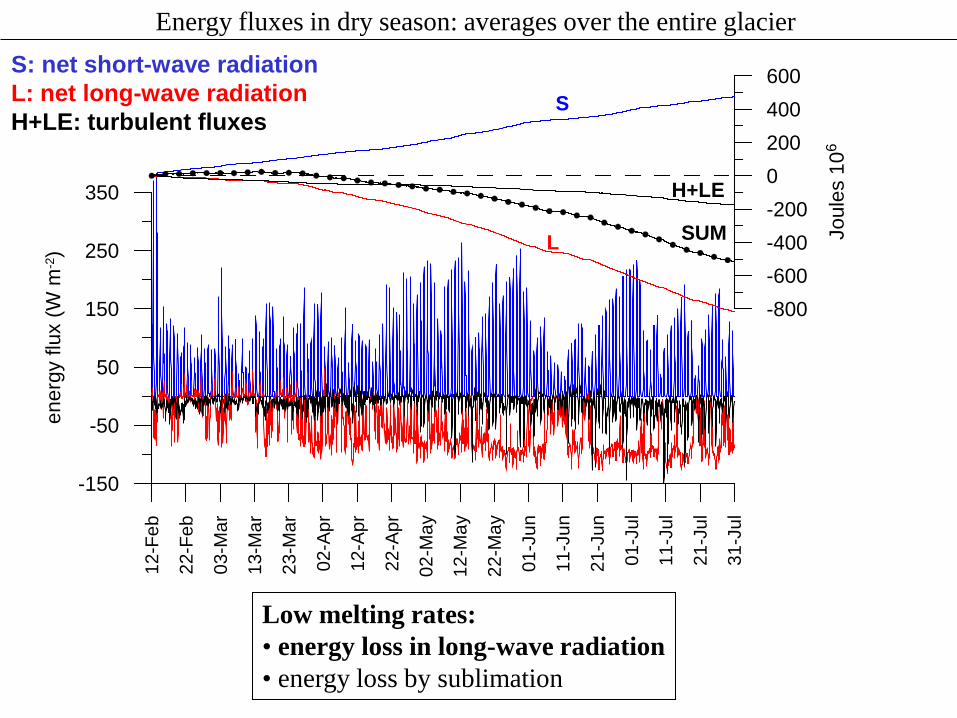
Energy fluxes in dry season: averages over the entire glacier
Low melting rates: • energy loss in long-wave radiation • energy loss by sublimation
12-F
eb
22-F
eb
03-M
ar
13-M
ar
23-M
ar
02-A
pr
12-A
pr
22-A
pr
02-M
ay
12-M
ay
22-M
ay
01-J
un
11-J
un
21-J
un
01-J
ul
11-J
ul
21-J
ul
31-J
ul
-150
-50
50
150
250
350
ener
gy fl
ux (W
m-2)
-800-600-400-2000200400600
Joul
es 1
06
S
H+LE
SUML
S: net short-wave radiation L: net long-wave radiation H+LE: turbulent fluxes
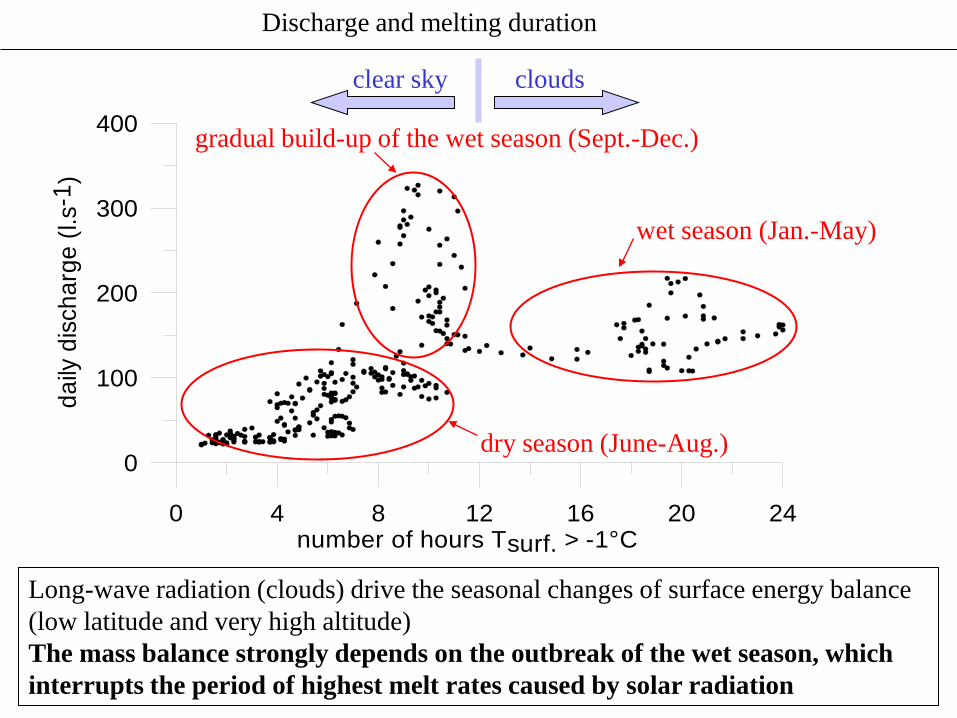
clouds clear sky
Discharge and melting duration
0 4 8 12 16 20 24number of hours Tsurf. > -1°C
0
100
200
300
400
daily
dis
char
ge (l
.s-1
)
Long-wave radiation (clouds) drive the seasonal changes of surface energy balance (low latitude and very high altitude) The mass balance strongly depends on the outbreak of the wet season, which interrupts the period of highest melt rates caused by solar radiation
dry season (June-Aug.)
gradual build-up of the wet season (Sept.-Dec.)
wet season (Jan.-May)
09 10 10 11 12 01 02 03 04 05 06 07 08month
0
2
4
6
8
10
runo
ff (m
m)
0
2
4
6
prec
ipita
tions
(mm
)
0
100
200
300
400
500
sum
pre
cipi
tatio
ns (m
m)
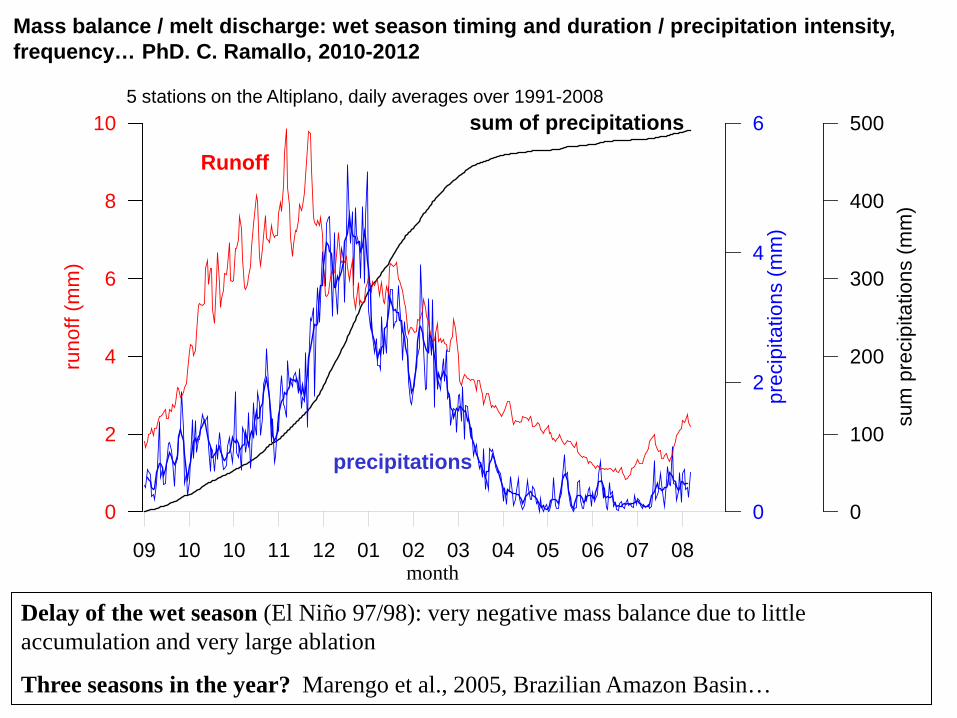
Mass balance / melt discharge: wet season timing and duration / precipitation intensity, frequency… PhD. C. Ramallo, 2010-2012
Runoff
precipitations
sum of precipitations 5 stations on the Altiplano, daily averages over 1991-2008
Delay of the wet season (El Niño 97/98): very negative mass balance due to little accumulation and very large ablation
Three seasons in the year? Marengo et al., 2005, Brazilian Amazon Basin…
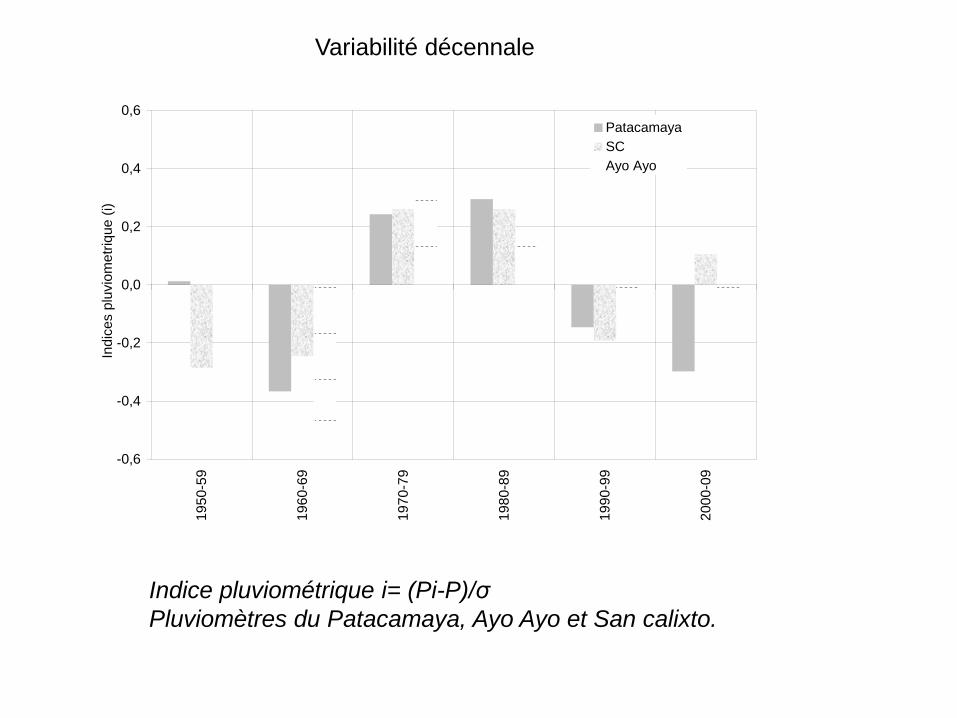
Variabilité décennale
-0,6
-0,4
-0,2
0,0
0,2
0,4
0,6
1950
-59
1960
-69
1970
-79
1980
-89
1990
-99
2000
-09
Indi
ces
pluv
iom
etriq
ue (i
)PatacamayaSCAyo Ayo
Indice pluviométrique i= (Pi-P)/σ Pluviomètres du Patacamaya, Ayo Ayo et San calixto.
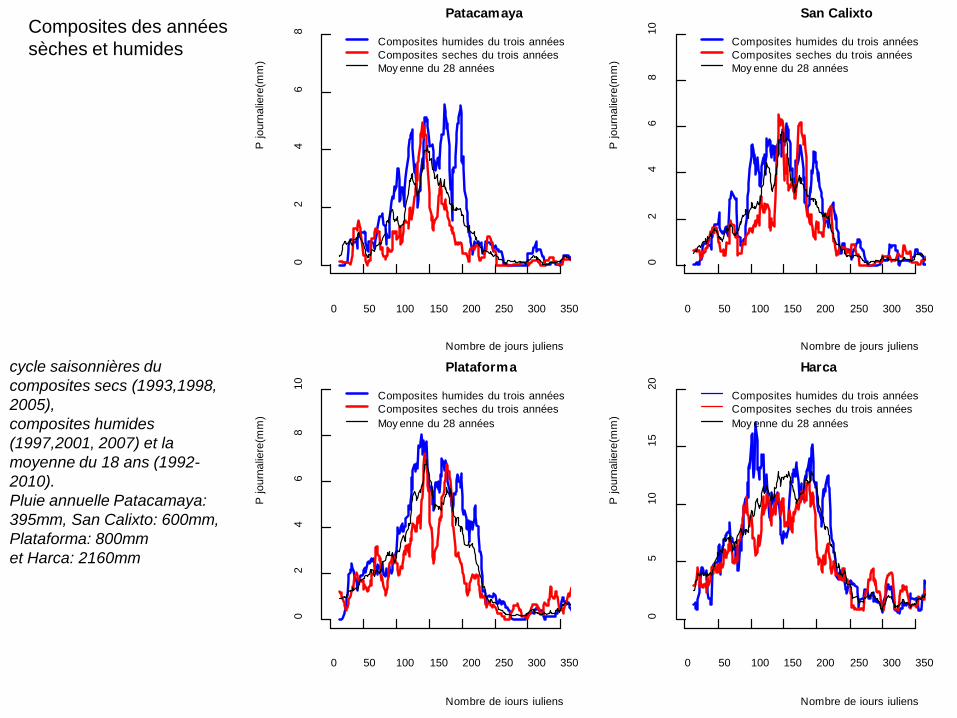
Composites des années sèches et humides
Nombre de jours juliens
P jo
urna
liere
(mm
)
0 50 100 150 200 250 300 3500
24
68
Composites humides du trois annéesComposites seches du trois annéesMoy enne du 28 années
Patacamaya
Nombre de jours juliens
P jo
urna
liere
(mm
)
0 50 100 150 200 250 300 350
02
46
810
Composites humides du trois annéesComposites seches du trois annéesMoy enne du 28 années
San Calixto
Nombre de jours juliens
P jo
urna
liere
(mm
)
0 50 100 150 200 250 300 350
02
46
810
Composites humides du trois annéesComposites seches du trois annéesMoy enne du 28 années
Plataforma
Nombre de jours juliens
P jo
urna
liere
(mm
)
0 50 100 150 200 250 300 3500
510
1520
Composites humides du trois annéesComposites seches du trois annéesMoy enne du 28 années
Harcacycle saisonnières du composites secs (1993,1998, 2005), composites humides (1997,2001, 2007) et la moyenne du 18 ans (1992-2010). Pluie annuelle Patacamaya: 395mm, San Calixto: 600mm, Plataforma: 800mm et Harca: 2160mm
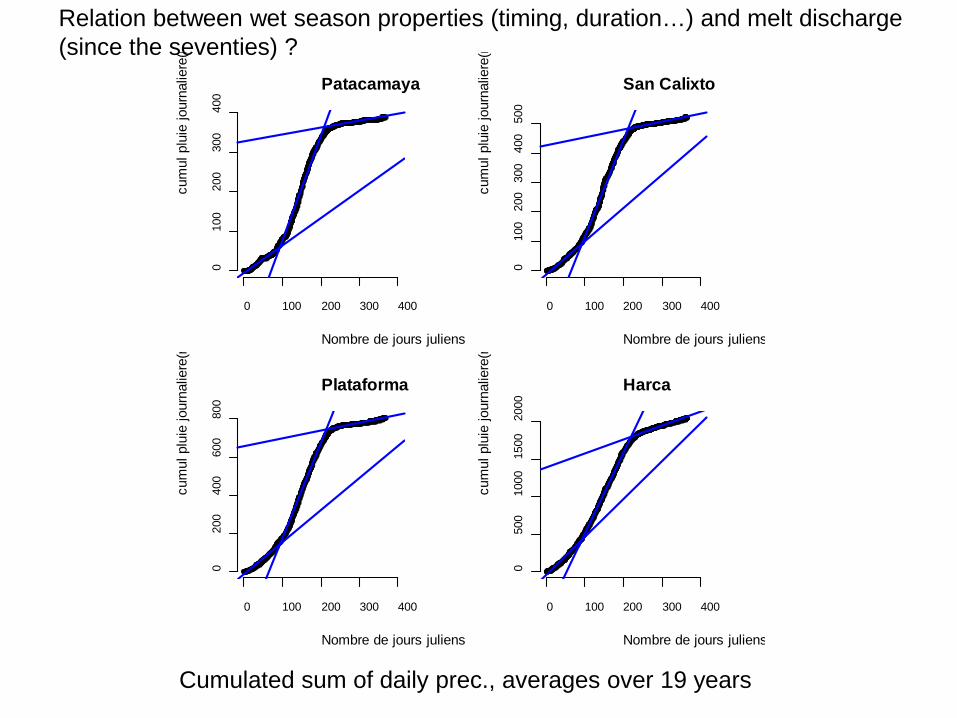
Relation between wet season properties (timing, duration…) and melt discharge (since the seventies) ?
0 100 200 300 400
010
020
030
040
0
Nombre de jours juliens
cum
ul p
luie
jour
nalie
re(m
Patacamaya
0 100 200 300 400
010
020
030
040
050
0
Nombre de jours juliens
cum
ul p
luie
jour
nalie
re(m
San Calixto
0 100 200 300 400
020
040
060
080
0
Nombre de jours juliens
cum
ul p
luie
jour
nalie
re(m
Plataforma
0 100 200 300 400
050
010
0015
0020
00
Nombre de jours juliens
cum
ul p
luie
jour
nalie
re(m
Harca
Cumulated sum of daily prec., averages over 19 years
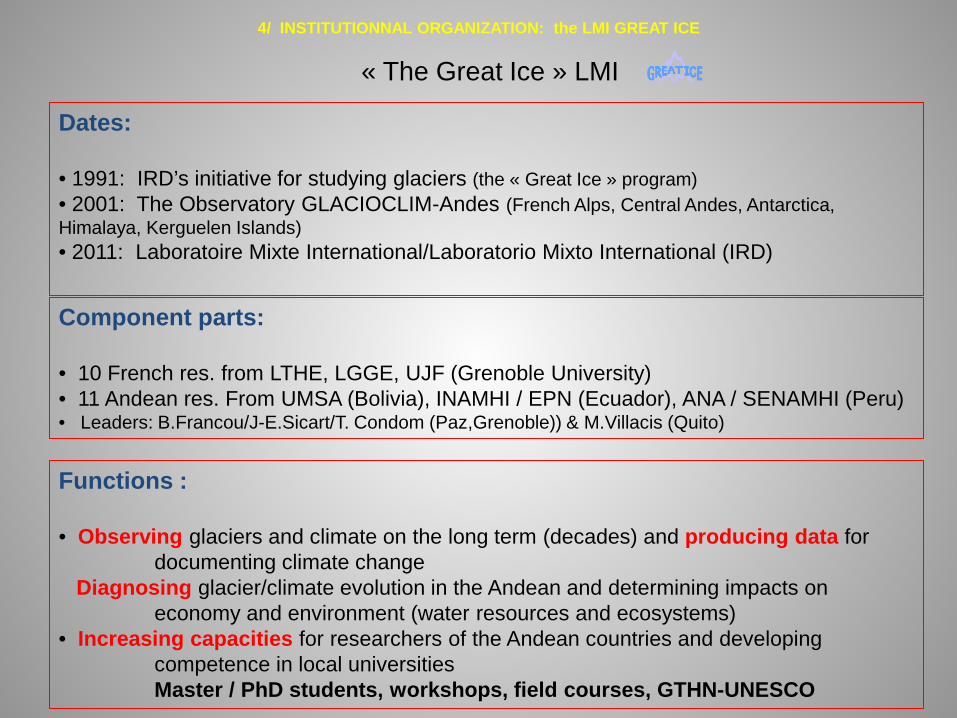
« The Great Ice » LMI
Dates: • 1991: IRD’s initiative for studying glaciers (the « Great Ice » program) • 2001: The Observatory GLACIOCLIM-Andes (French Alps, Central Andes, Antarctica, Himalaya, Kerguelen Islands) • 2011: Laboratoire Mixte International/Laboratorio Mixto International (IRD)
Component parts: • 10 French res. from LTHE, LGGE, UJF (Grenoble University) • 11 Andean res. From UMSA (Bolivia), INAMHI / EPN (Ecuador), ANA / SENAMHI (Peru) • Leaders: B.Francou/J-E.Sicart/T. Condom (Paz,Grenoble)) & M.Villacis (Quito)
Functions : • Observing glaciers and climate on the long term (decades) and producing data for documenting climate change Diagnosing glacier/climate evolution in the Andean and determining impacts on economy and environment (water resources and ecosystems) • Increasing capacities for researchers of the Andean countries and developing competence in local universities Master / PhD students, workshops, field courses, GTHN-UNESCO
4/ INSTITUTIONNAL ORGANIZATION: the LMI GREAT ICE
Some general conclusions… Relations between climate and glaciers - Observations: long-term monitoring program in the central Andes since the nineties (should continue…)
- Studies of the processes (meas.) / modeling (melt model adapted to the tropical glaciers?) - Glacier changes at regional scales, inner/outer tropics - Links to the climatic forcing (student co-supervising?) - Exploration of past climates (Little Ice Age) … THANK YOU