Embed Size (px)
Citation preview
Abstract Existing anthropometric test device heads use a rigid body structure. Therefore, the objective of this
study was to model a new anthropometric test device head incorporating skull‐brain structure, conduct sled
tests for investigating the head’s usability, evaluate the head’s performance at measuring brain‐skull relative
motion. The new anthropometric test device head was constructed based on geometry obtained from an adult
human male medical image. Sled tests corresponding to frontal crashes with the new anthropometric test
device head mounted on a AM50 Hybrid III dummy were carried out. Moreover, a finite element model of the
human head was developed and validated against post‐mortem human subject experiments, and the was
validated from the results of corresponding brain node motion obtained from sled tests simulations. Although
the brain node motion of the ATD head correlated with the simulation model, the maximum displacement of
the ATD head were significantly larger than the human head FE model. Therefore, the novel ATD head showed a
potential as a first concept of a new ATD head incorporating skull and brain structures which is capable of direct
measurement and visualisation of intracranial brain motion, however, the biofidelity is needed to be improved.
Keywords anthropometric test device, frontal crash, physical model of a head, rotational brain injury.,
I. INTRODUCTION
Traumatic brain injury is the major cause of death in road traffic accidents. Acute SubDural Haematoma
(ASDH), is the third most common traumatic brain haemorrhage after sub arachnoid and intra ventricular
haemorrhages when looking at all injuries, but with high mortality rate [1]. Performance evaluation for overall
vehicle safety, and evaluation of devices such as airbags and seatbelts, is based on use of Anthropometric Test
Devices (ATDs).
These ATD heads, however, do not incorporate actual human geometry, have no moving parts representing
the soft tissues, and no special instrumentation to capture the motion of the brain. Attempts to include such
instrumentation in actual ATD heads used for testing, have been made in the past. Reference [2] developed a
two‐mass system model, constructed using a Hybrid III headform which comprises two masses: a skull and a
mass to represent the brain attached to the skull with a damped spring system. References [3‐5] developed two
dimensional (cross section) physical models that allow intra cranial motion measurement. Reference [6] uses a
simplified model using acrylic spherical calvarium and gelatin brain, but no dura, falx or tentorium. All these
previous models lack a complete 3D representation of the shapes of the actual human head and brain in its
entirety. Reference [7] developed a physical model based on actual human anatomy and bio‐mimetic materials,
to study the skull‐brain relative displacement in occipital impacts. However, an ATD head, which is capable of
estimating intracranial brain motion directly and usable in crash tests, has not been developed.
Therefore, the objectives of this study were to develop a new ATD head incorporating skull‐brain structures,
robust instrumentation, and investigate the head responses compared to FE models validated against
post‐mortem human subject (PMHS) experiments, and conduct frontal sled tests to examin the potential of the
new ATD head for the use in crash tests.
II. METHODS
An objective of producing a new ATD head was focused on estimation of skull‐brain relative displacement
,which can be related to ASDH due to bridging vein rupture in particular in road traffic accidents. The model that
Y.Miyazaki is an Associate Professor in the Department of Control and Systems Engineering at Tokyo Institute of Techology, Japan (+81‐3‐5734‐3155 / y‐[email protected]). A Railkar and S.Awamori are MEng Students in Miyazaki Lab at Tokyo Institute of Technology, Japan. A. Kokeguchi, I. Amamori, M. Katagiri and K. Yoshii belong to Takata Corporation, Japan.
Intracranial Brain Motion Measurement in Frontal Sled Tests by using a New Anthropometric Test Dummy Head capable of Direct Brain Motion Evaluation and Visualisation
Y.Miyazaki, A. Railkar, S. Awamori, A. Kokeguchi, I. Amamori, M. Katagiri, K. Yoshii
IRC-17-45 IRCOBI Conference 2017
-284-
was constructed attempted to reproduce the structure of the human skull and brain. The following
requirements were set as design targets for the model: 1.The model should be based on, and as far as possible,
represent an human head. 2.The new ATD head should be usable as a replacement for existing ATD heads such
as the Hybrid III for crash testing. 3. Additionally it should be able to directly visualise and evaluate brain‐skull
relative motion.
In order to meet demands above requirements, firstly, a new ATD head was constructed based on geometry
obtained from an adult human male CT and MRI medical images, made of a silicone gel brain, polycarbonate
skull, silicon rubber skin, polyurethane tentorium and falx, and water for intracranial space material. The
biofidelity of the rigid body motion of the head model was validated with component tests.
Secondly, sled tests corresponding to frontal crashes with the new ATD head mounted on a AM50 Hybrid III
dummy were carried out. A range of seatbelt and airbag Time‐To‐Fires (TTF) were varied. Markers on the skull
and the brain of the ATD head were captured using high speed cameras mounted on the sled. Moreover, six
degrees‐of‐freedom (DOF) rigid body motion of the head were also measured.
Finally, a finite element (FE) model of the human head was developed and validated against post‐mortem
human subject (PMHS) experiments involving brain motion. The head kinematics data obtained from the sled
tests that used the ATD head, was applied to the FE model. The results of corresponding brain node motion
were compared to the displacements from the ATD head, and investigated biofidelity of the ATD head.
Development of a New ATD Head
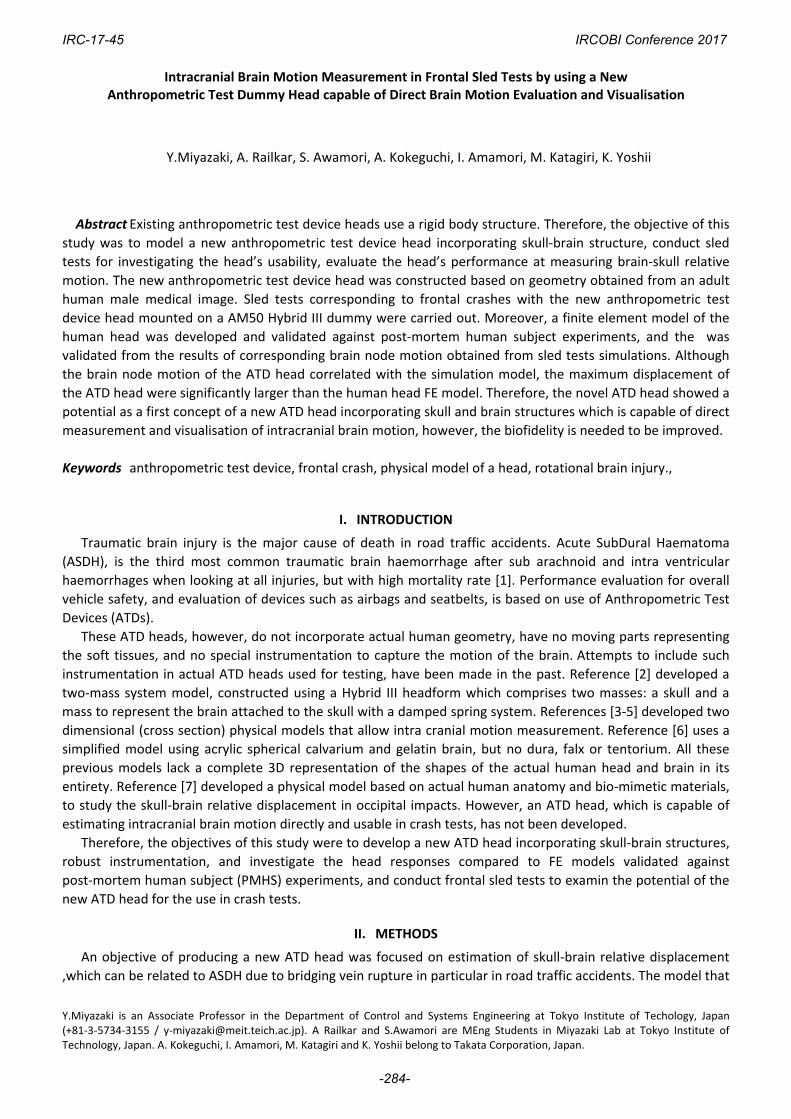
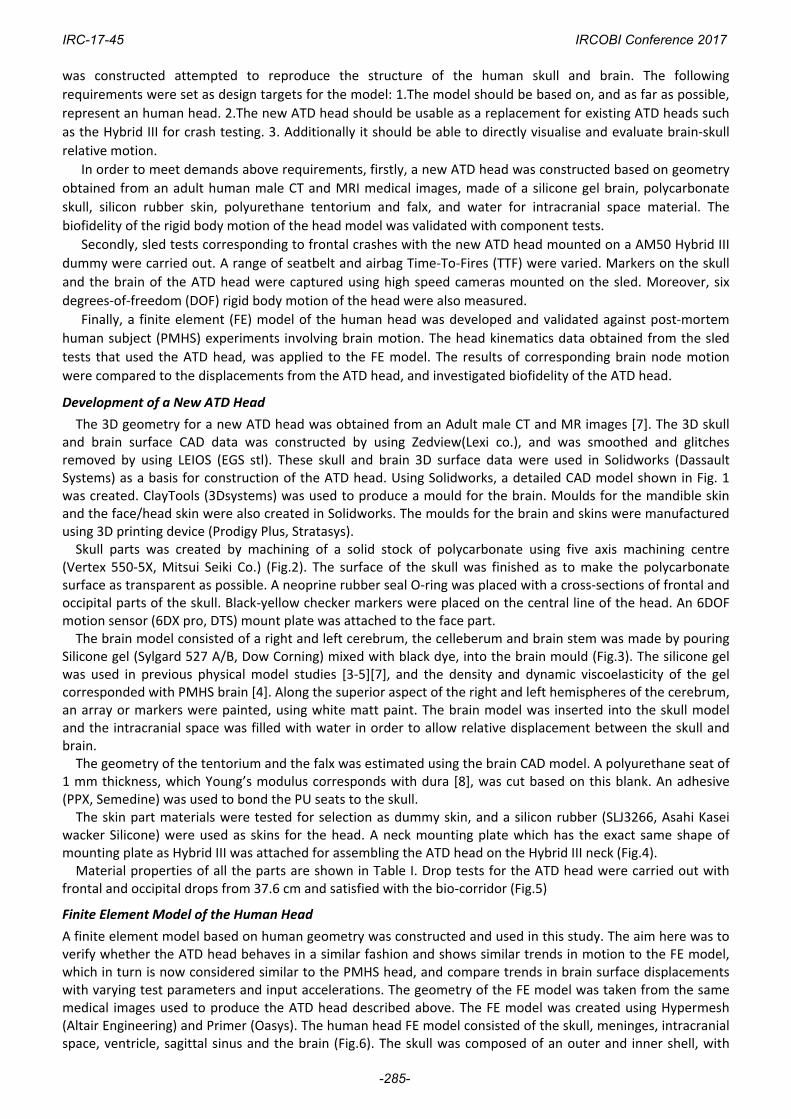
The 3D geometry for a new ATD head was obtained from an Adult male CT and MR images [7]. The 3D skull and brain surface CAD data was constructed by using Zedview(Lexi co.), and was smoothed and glitches removed by using LEIOS (EGS stl). These skull and brain 3D surface data were used in Solidworks (Dassault Systems) as a basis for construction of the ATD head. Using Solidworks, a detailed CAD model shown in Fig. 1 was created. ClayTools (3Dsystems) was used to produce a mould for the brain. Moulds for the mandible skin and the face/head skin were also created in Solidworks. The moulds for the brain and skins were manufactured using 3D printing device (Prodigy Plus, Stratasys). Skull parts was created by machining of a solid stock of polycarbonate using five axis machining centre (Vertex 550‐5X, Mitsui Seiki Co.) (Fig.2). The surface of the skull was finished as to make the polycarbonate surface as transparent as possible. A neoprine rubber seal O‐ring was placed with a cross‐sections of frontal and occipital parts of the skull. Black‐yellow checker markers were placed on the central line of the head. An 6DOF motion sensor (6DX pro, DTS) mount plate was attached to the face part. The brain model consisted of a right and left cerebrum, the celleberum and brain stem was made by pouring Silicone gel (Sylgard 527 A/B, Dow Corning) mixed with black dye, into the brain mould (Fig.3). The silicone gel was used in previous physical model studies [3‐5][7], and the density and dynamic viscoelasticity of the gel corresponded with PMHS brain [4]. Along the superior aspect of the right and left hemispheres of the cerebrum, an array or markers were painted, using white matt paint. The brain model was inserted into the skull model and the intracranial space was filled with water in order to allow relative displacement between the skull and brain. The geometry of the tentorium and the falx was estimated using the brain CAD model. A polyurethane seat of
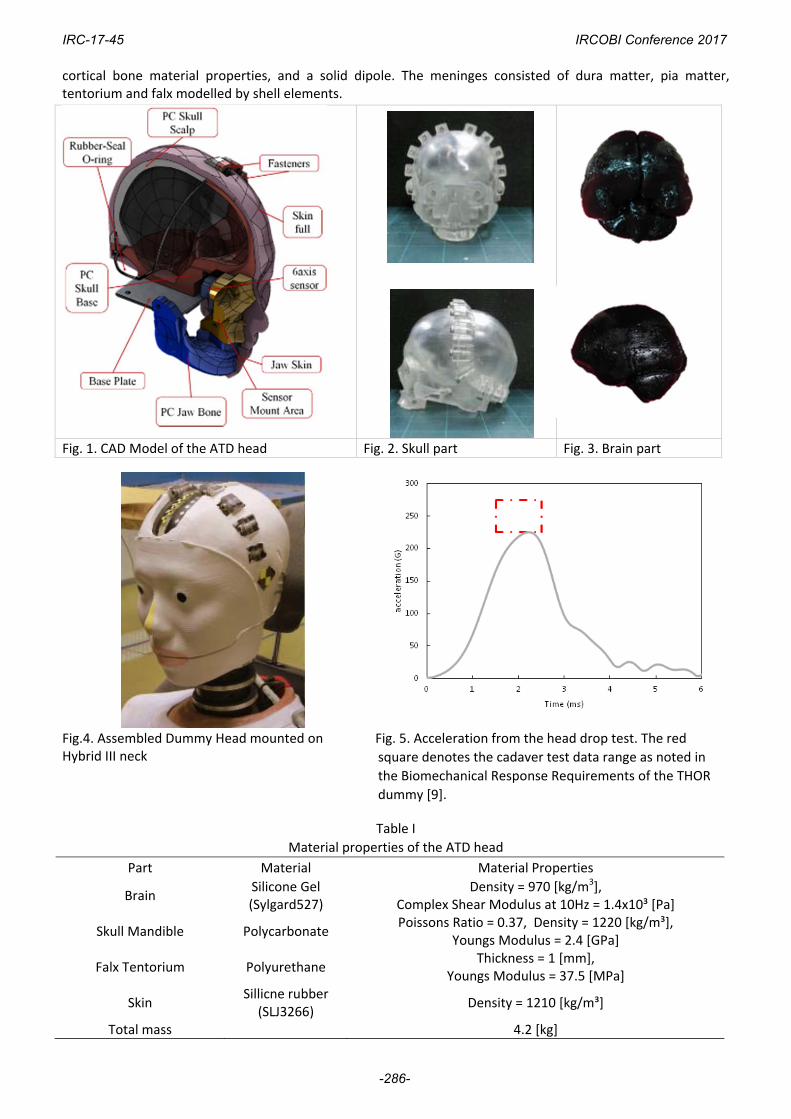
1 mm thickness, which Young’s modulus corresponds with dura [8], was cut based on this blank. An adhesive (PPX, Semedine) was used to bond the PU seats to the skull. The skin part materials were tested for selection as dummy skin, and a silicon rubber (SLJ3266, Asahi Kasei wacker Silicone) were used as skins for the head. A neck mounting plate which has the exact same shape of mounting plate as Hybrid III was attached for assembling the ATD head on the Hybrid III neck (Fig.4). Material properties of all the parts are shown in Table I. Drop tests for the ATD head were carried out with frontal and occipital drops from 37.6 cm and satisfied with the bio‐corridor (Fig.5)
Finite Element Model of the Human Head
A finite element model based on human geometry was constructed and used in this study. The aim here was to verify whether the ATD head behaves in a similar fashion and shows similar trends in motion to the FE model, which in turn is now considered similar to the PMHS head, and compare trends in brain surface displacements with varying test parameters and input accelerations. The geometry of the FE model was taken from the same medical images used to produce the ATD head described above. The FE model was created using Hypermesh (Altair Engineering) and Primer (Oasys). The human head FE model consisted of the skull, meninges, intracranial space, ventricle, sagittal sinus and the brain (Fig.6). The skull was composed of an outer and inner shell, with
IRC-17-45 IRCOBI Conference 2017
-285-
cortical bone material properties, and a solid dipole. The meninges consisted of dura matter, pia matter, tentorium and falx modelled by shell elements.
Table I
Material properties of the ATD head
Part Material Material Properties
Brain Silicone Gel (Sylgard527)
Density = 970 [kg/m3], Complex Shear Modulus at 10Hz = 1.4x10³ [Pa]
Skull Mandible Polycarbonate Poissons Ratio = 0.37, Density = 1220 [kg/m³],
Youngs Modulus = 2.4 [GPa]
Falx Tentorium Polyurethane Thickness = 1 [mm],
Youngs Modulus = 37.5 [MPa]
Skin Sillicne rubber (SLJ3266)
Density = 1210 [kg/m³]
Total mass 4.2 [kg]
Fig. 1. CAD Model of the ATD head Fig. 2. Skull part Fig. 3. Brain part
Fig.4. Assembled Dummy Head mounted on Hybrid III neck
Fig. 5. Acceleration from the head drop test. The red
square denotes the cadaver test data range as noted in
the Biomechanical Response Requirements of the THOR
dummy [9].
IRC-17-45 IRCOBI Conference 2017
-286-
The intracranial space was modelled as three layer of 8‐node blick elements with fixed boundary conditions between the dura and the intracranial space, pia layer. The material properties of intracranial space correspond with water. The brain was modelled as a Maxwel‐Kelvin viscoelastic material. The viscoelastic parameters of the brain were identified from storage and loss modulus of PMHS test [11]. Other materials have been modelled as elastic. Table II lists the materials used in the model [10‐12]. All solid components are modelled using the 8‐node brick element, while all shell elements are modelled using the 4‐node shell. LS‐Dyna v7.1 (LSTC) was used as a solver. PMHS experiments carried out by [13] were used for the validation of the model. Out of the tests listed in
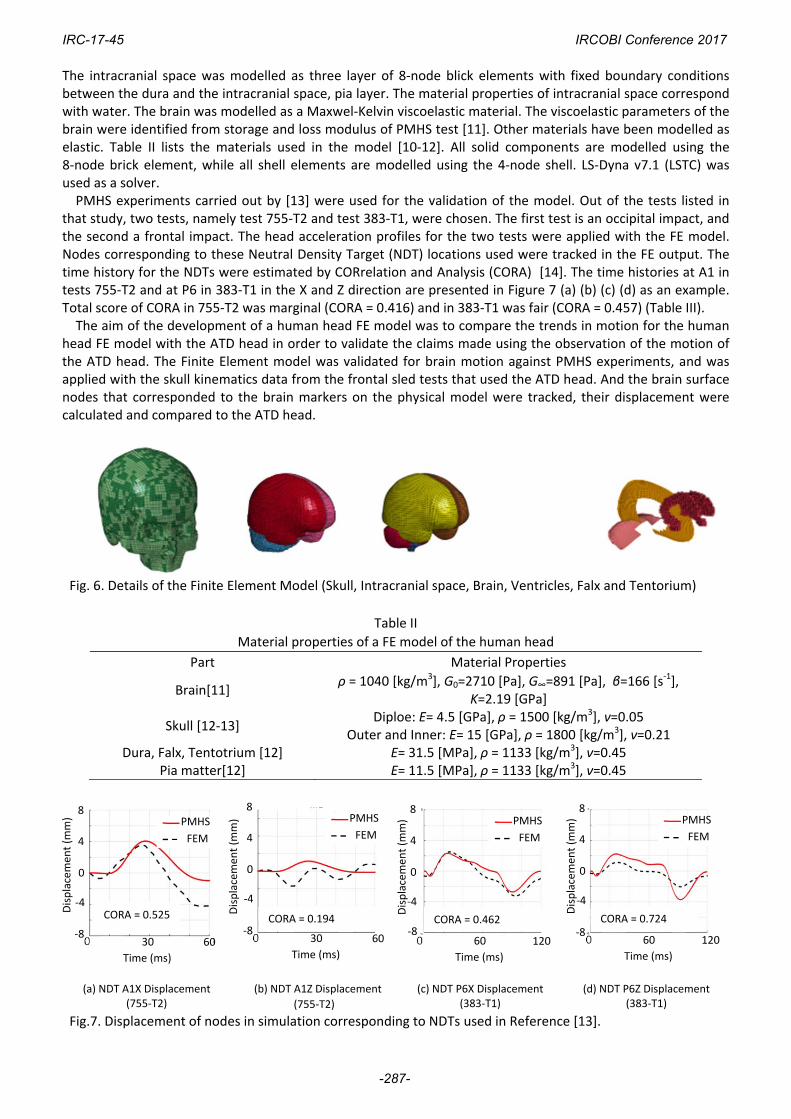
that study, two tests, namely test 755‐T2 and test 383‐T1, were chosen. The first test is an occipital impact, and the second a frontal impact. The head acceleration profiles for the two tests were applied with the FE model. Nodes corresponding to these Neutral Density Target (NDT) locations used were tracked in the FE output. The time history for the NDTs were estimated by CORrelation and Analysis (CORA) [14]. The time histories at A1 in tests 755‐T2 and at P6 in 383‐T1 in the X and Z direction are presented in Figure 7 (a) (b) (c) (d) as an example. Total score of CORA in 755‐T2 was marginal (CORA = 0.416) and in 383‐T1 was fair (CORA = 0.457) (Table III). The aim of the development of a human head FE model was to compare the trends in motion for the human
head FE model with the ATD head in order to validate the claims made using the observation of the motion of the ATD head. The Finite Element model was validated for brain motion against PMHS experiments, and was applied with the skull kinematics data from the frontal sled tests that used the ATD head. And the brain surface nodes that corresponded to the brain markers on the physical model were tracked, their displacement were calculated and compared to the ATD head.
Fig. 6. Details of the Finite Element Model (Skull, Intracranial space, Brain, Ventricles, Falx and Tentorium)
Table II
Material properties of a FE model of the human head
Part Material Properties
Brain[11] ρ = 1040 [kg/m3], G0=2710 [Pa], G∞=891 [Pa], β=166 [s
‐1], K=2.19 [GPa]
Skull [12‐13] Diploe: E= 4.5 [GPa], ρ = 1500 [kg/m3], ν=0.05
Outer and Inner: E= 15 [GPa], ρ = 1800 [kg/m3], ν=0.21 Dura, Falx, Tentotrium [12] E= 31.5 [MPa], ρ = 1133 [kg/m3], ν=0.45
Pia matter[12] E= 11.5 [MPa], ρ = 1133 [kg/m3], ν=0.45
(a) NDT A1X Displacement (755‐T2)
(b) NDT A1Z Displacement
(755‐T2)
(c) NDT P6X Displacement (383‐T1)
(d) NDT P6Z Displacement (383‐T1)
Fig.7. Displacement of nodes in simulation corresponding to NDTs used in Reference [13].
CORA = 0.525 CORA = 0.194 CORA = 0.462 CORA = 0.724
Time (ms)
0 0 60
0
‐4
‐8
4
8
30
Displacemen
t (m
m) PMHS
FEM
Time (ms)
0 0 60
0
‐4
‐8
4
8
30
Displacemen
t (m
m) PMHS
FEM
Time (ms)
0 0 120
0
‐4
‐8
4
8
60
Displacement (m
m) PMHS
FEM
Time (ms)
0 0 120
0
‐4
‐8
4
8
60
Displacemen
t (m
m) PMHS
FEM
IRC-17-45 IRCOBI Conference 2017
-287-
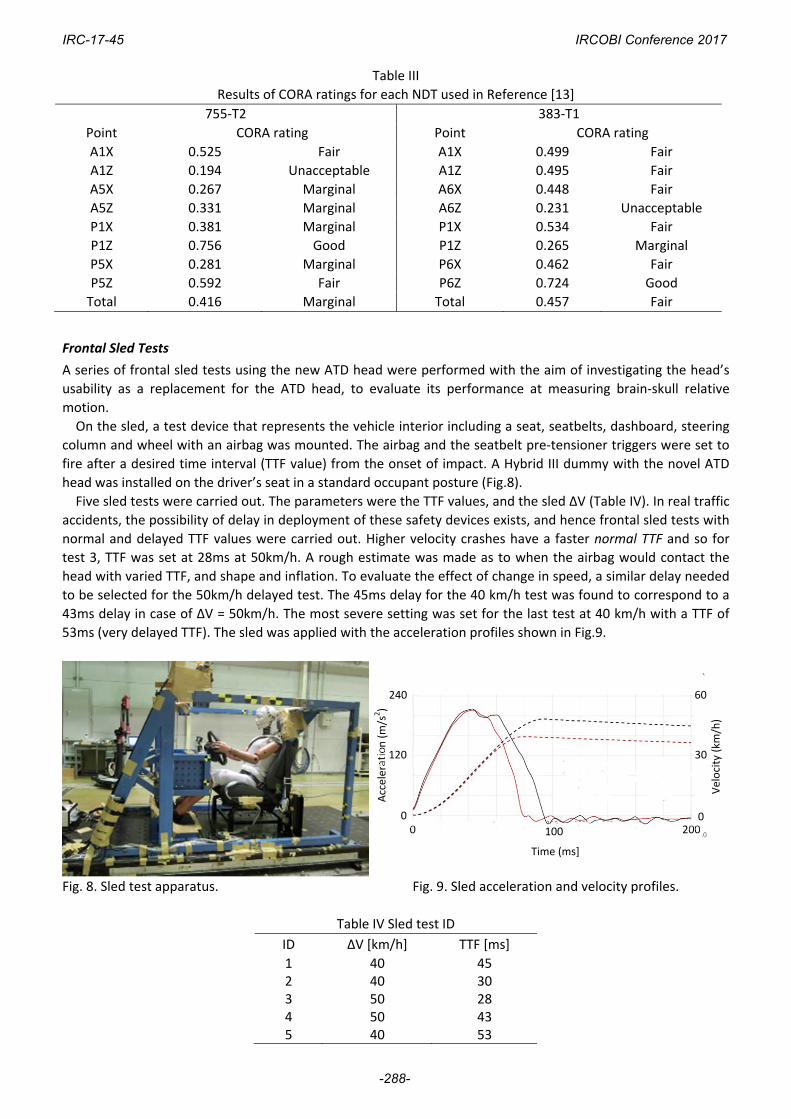
Table III
Results of CORA ratings for each NDT used in Reference [13]
755‐T2 383‐T1
Point CORA rating Point CORA rating
A1X 0.525 Fair A1X 0.499 Fair
A1Z 0.194 Unacceptable A1Z 0.495 Fair
A5X 0.267 Marginal A6X 0.448 Fair
A5Z 0.331 Marginal A6Z 0.231 Unacceptable
P1X 0.381 Marginal P1X 0.534 Fair
P1Z 0.756 Good P1Z 0.265 Marginal
P5X 0.281 Marginal P6X 0.462 Fair
P5Z 0.592 Fair P6Z 0.724 Good
Total 0.416 Marginal Total 0.457 Fair
Frontal Sled Tests
A series of frontal sled tests using the new ATD head were performed with the aim of investigating the head’s
usability as a replacement for the ATD head, to evaluate its performance at measuring brain‐skull relative
motion.
On the sled, a test device that represents the vehicle interior including a seat, seatbelts, dashboard, steering
column and wheel with an airbag was mounted. The airbag and the seatbelt pre‐tensioner triggers were set to
fire after a desired time interval (TTF value) from the onset of impact. A Hybrid III dummy with the novel ATD
head was installed on the driver’s seat in a standard occupant posture (Fig.8).
Five sled tests were carried out. The parameters were the TTF values, and the sled ΔV (Table IV). In real traffic
accidents, the possibility of delay in deployment of these safety devices exists, and hence frontal sled tests with
normal and delayed TTF values were carried out. Higher velocity crashes have a faster normal TTF and so for
test 3, TTF was set at 28ms at 50km/h. A rough estimate was made as to when the airbag would contact the
head with varied TTF, and shape and inflation. To evaluate the effect of change in speed, a similar delay needed
to be selected for the 50km/h delayed test. The 45ms delay for the 40 km/h test was found to correspond to a
43ms delay in case of ΔV = 50km/h. The most severe setting was set for the last test at 40 km/h with a TTF of
53ms (very delayed TTF). The sled was applied with the acceleration profiles shown in Fig.9.
Fig. 8. Sled test apparatus. Fig. 9. Sled acceleration and velocity profiles.
Table IV Sled test ID
ID ΔV [km/h] TTF [ms]
1 40 45 2 40 30 3 50 28 4 50 43 5 40 53
Time (ms]
0
Acceleration (m/s
2)
200
120
100
240
0
30
60
0
Velocity (km
/h)
IRC-17-45 IRCOBI Conference 2017
-288-
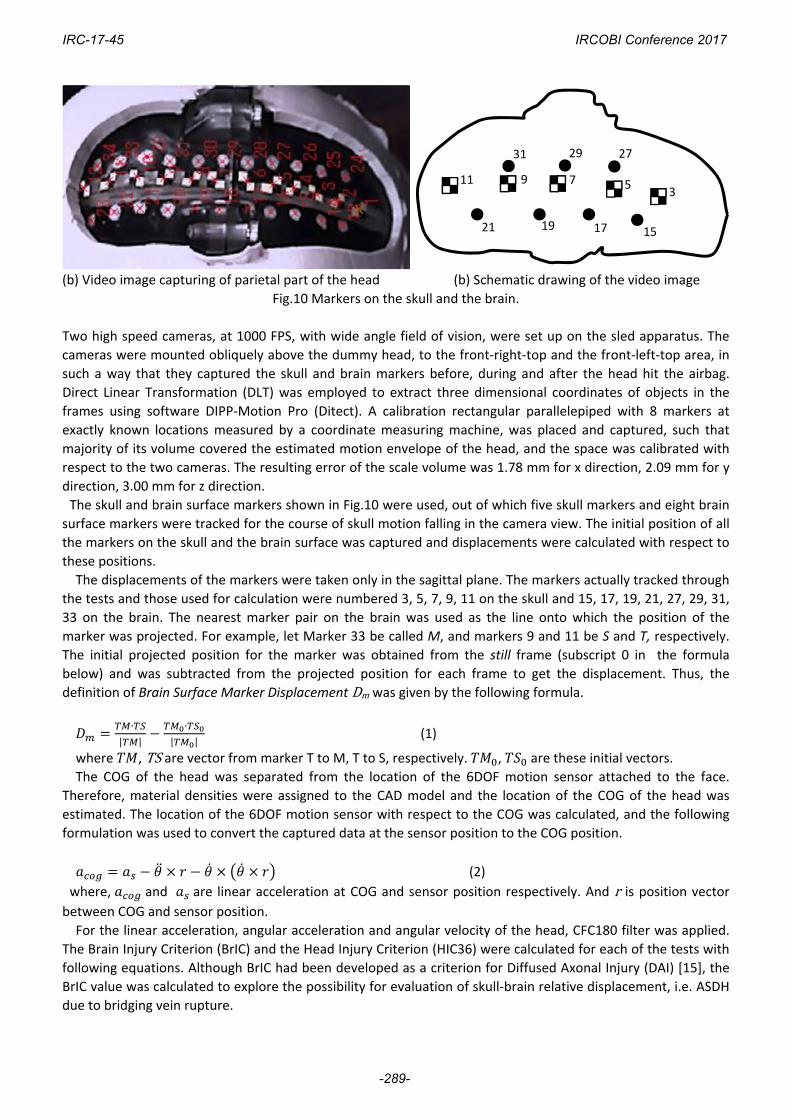
(b) Video image capturing of parietal part of the head (b) Schematic drawing of the video image
Fig.10 Markers on the skull and the brain.
Two high speed cameras, at 1000 FPS, with wide angle field of vision, were set up on the sled apparatus. The
cameras were mounted obliquely above the dummy head, to the front‐right‐top and the front‐left‐top area, in
such a way that they captured the skull and brain markers before, during and after the head hit the airbag.
Direct Linear Transformation (DLT) was employed to extract three dimensional coordinates of objects in the
frames using software DIPP‐Motion Pro (Ditect). A calibration rectangular parallelepiped with 8 markers at
exactly known locations measured by a coordinate measuring machine, was placed and captured, such that
majority of its volume covered the estimated motion envelope of the head, and the space was calibrated with
respect to the two cameras. The resulting error of the scale volume was 1.78 mm for x direction, 2.09 mm for y
direction, 3.00 mm for z direction.
The skull and brain surface markers shown in Fig.10 were used, out of which five skull markers and eight brain
surface markers were tracked for the course of skull motion falling in the camera view. The initial position of all
the markers on the skull and the brain surface was captured and displacements were calculated with respect to
these positions.
The displacements of the markers were taken only in the sagittal plane. The markers actually tracked through
the tests and those used for calculation were numbered 3, 5, 7, 9, 11 on the skull and 15, 17, 19, 21, 27, 29, 31,
33 on the brain. The nearest marker pair on the brain was used as the line onto which the position of the
marker was projected. For example, let Marker 33 be called M, and markers 9 and 11 be S and T, respectively.
The initial projected position for the marker was obtained from the still frame (subscript 0 in the formula
below) and was subtracted from the projected position for each frame to get the displacement. Thus, the
definition of Brain Surface Marker Displacement Dm was given by the following formula.
∙
| |
∙
| |(1)
where , TS are vector from marker T to M, T to S, respectively. , are these initial vectors. The COG of the head was separated from the location of the 6DOF motion sensor attached to the face.
Therefore, material densities were assigned to the CAD model and the location of the COG of the head was
estimated. The location of the 6DOF motion sensor with respect to the COG was calculated, and the following
formulation was used to convert the captured data at the sensor position to the COG position.
(2) where, and are linear acceleration at COG and sensor position respectively. And r is position vector between COG and sensor position.
For the linear acceleration, angular acceleration and angular velocity of the head, CFC180 filter was applied.
The Brain Injury Criterion (BrIC) and the Head Injury Criterion (HIC36) were calculated for each of the tests with
following equations. Although BrIC had been developed as a criterion for Diffused Axonal Injury (DAI) [15], the
BrIC value was calculated to explore the possibility for evaluation of skull‐brain relative displacement, i.e. ASDH
due to bridging vein rupture.
272931
35 7 911
1517 1921
IRC-17-45 IRCOBI Conference 2017
-289-
HIC= (t2-t1)1
(t2-t1)a(t)
t2t1
dt2.5
max (3)
where a(t) is resultant acceleration and t2‐t1 is time interval limited to 36 ms.
BrIC ωx66.25
2+
ωy
56.45
2+
ωz42.87
2 (4)
where ωx, ωy, and ωz are maximum angular velocities about X‐, Y‐, and Z‐axes respectively.
III. RESULTS
Frontal Sled Tests
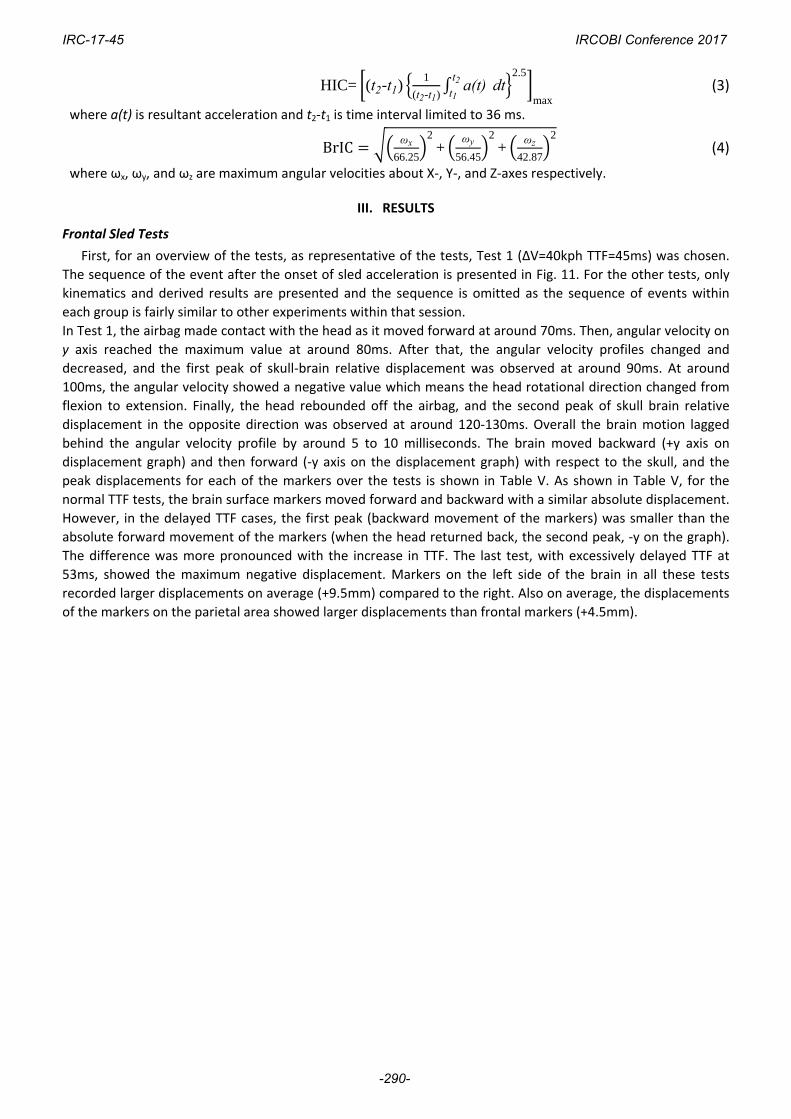
First, for an overview of the tests, as representative of the tests, Test 1 (ΔV=40kph TTF=45ms) was chosen.
The sequence of the event after the onset of sled acceleration is presented in Fig. 11. For the other tests, only
kinematics and derived results are presented and the sequence is omitted as the sequence of events within
each group is fairly similar to other experiments within that session.
In Test 1, the airbag made contact with the head as it moved forward at around 70ms. Then, angular velocity on
y axis reached the maximum value at around 80ms. After that, the angular velocity profiles changed and
decreased, and the first peak of skull‐brain relative displacement was observed at around 90ms. At around
100ms, the angular velocity showed a negative value which means the head rotational direction changed from
flexion to extension. Finally, the head rebounded off the airbag, and the second peak of skull brain relative
displacement in the opposite direction was observed at around 120‐130ms. Overall the brain motion lagged
behind the angular velocity profile by around 5 to 10 milliseconds. The brain moved backward (+y axis on
displacement graph) and then forward (‐y axis on the displacement graph) with respect to the skull, and the
peak displacements for each of the markers over the tests is shown in Table V. As shown in Table V, for the
normal TTF tests, the brain surface markers moved forward and backward with a similar absolute displacement.
However, in the delayed TTF cases, the first peak (backward movement of the markers) was smaller than the
absolute forward movement of the markers (when the head returned back, the second peak, ‐y on the graph).
The difference was more pronounced with the increase in TTF. The last test, with excessively delayed TTF at
53ms, showed the maximum negative displacement. Markers on the left side of the brain in all these tests
recorded larger displacements on average (+9.5mm) compared to the right. Also on average, the displacements
of the markers on the parietal area showed larger displacements than frontal markers (+4.5mm).
IRC-17-45 IRCOBI Conference 2017
-290-
Fig.11. Overall sequence of events for the sled test experiments in the case of Test 1.
Table V Maximum displacement of brain surface markers during flexion and extension phases [mm]
Right ‐ Frontal Markers Right ‐ Parietal Markers
Test ID M15 M17 M19 M21
Flexion Extension Flexion Extension Flexion Extension Flexion Extension
1 13.3 ‐10.3 11.4 ‐10.2 6.9 ‐11.3
2 11.0 ‐9.5 9.4 ‐7.6 8.2 4.7 ‐5.2
3 9.4 ‐7.8 8.4 5.1 ‐4.0
4 11.9 ‐12.4 10.7 ‐10.8 9.8 ‐12.6 7.2 ‐10.6
5 12.4 ‐10.9 10.4 ‐10.4 9.2 ‐13.3 5.9 ‐10.1
Left ‐ Frontal Markers Left ‐ Parietal Markers
Test ID M27 M29 M31 M33
Flexion Extension Flexion Extension Flexion Extension Flexion Extension
1 13.3 ‐21.6 ‐20.1 11.2 ‐20.8 13.7 ‐27.1
2 ‐11.1 8.6 ‐11.2 11.1 ‐14.9
3 ‐8.7 7.4 ‐8.0 9.4 ‐10.4
4 ‐17.7 ‐17.1 9.3 ‐18.4 11.3 ‐22.4
5 9.8 ‐24.8 ‐25.5 9.1 ‐22.7 11.3 ‐32.5
Simulation Results
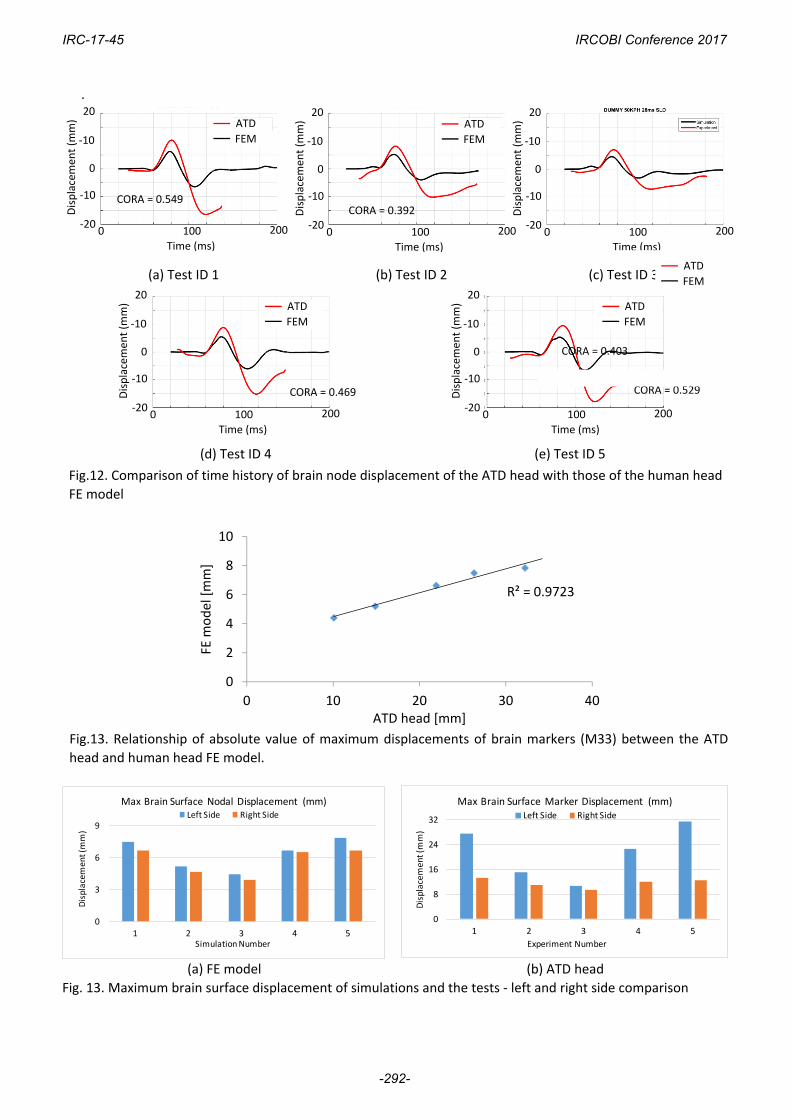
The brain node motion responses were estimated as marginal or fair by CORA (Fig.12). Trends of the
maximum displacements of the ATD head due to change of the sled tests conditions showed strong correlation
with the simulation model (Fig.13). The difference between the simulation and the experiment for the left and
the right markers is plotted in Fig. 14. The overall trend of right and left differences resulted same tendency, i.e.
larger displacement of the left side markers than right sides. However, the maximum value of brain node
displacements in the ATD head were 3‐4 folds larger than those in simulations.
IRC-17-45 IRCOBI Conference 2017
-291-
.
(a) Test ID 1 (b) Test ID 2 (c) Test ID 3
(d) Test ID 4 (e) Test ID 5
Fig.12. Comparison of time history of brain node displacement of the ATD head with those of the human head
FE model
Fig.13. Relationship of absolute value of maximum displacements of brain markers (M33) between the ATD
head and human head FE model.
(a) FE model (b) ATD head
Fig. 13. Maximum brain surface displacement of simulations and the tests ‐ left and right side comparison
R² = 0.9723
0
2
4
6
8
10
0 10 20 30 40
FE m
odel [mm]
ATD head [mm]
0
3
6
9
1 2 3 4 5
Displacement (mm)
Simulation Number
Max Brain Surface Nodal Displacement (mm)Left Side Right Side
0
8
16
24
32
1 2 3 4 5
Displacement (mm)
Experiment Number
Max Brain Surface Marker Displacement (mm)Left Side Right Side
CORA = 0.549 CORA = 0.392
CORA = 0.403
CORA = 0.469 CORA = 0.529
Time (ms)
0 0 200
0
‐10
‐20
‐10
20
100
Displacement (m
m)
Time (ms)
0 0 200
0
‐10
‐20
‐10
20
100
Displacement (m
m)
Time (ms)0 0 200
0
‐10
‐20
‐10
20
100
Displacement (m
m)
Time (ms)0 0 200
0
‐10
‐20
‐10
20
100
Displacement (m
m)
Time (ms)
0 0 200
0
‐10
‐20
‐10
20
100
Displacemen
t (m
m)
ATD
FEM
ATD
FEM
ATD
FEM
ATD
FEM
ATD
FEM
IRC-17-45 IRCOBI Conference 2017
-292-
IV. DISCUSSION
The novel ATD head
The novel ATD head was successfully used in frontal sled tests without failure, leakage or breakage and it
was possible to measure brain displacement directly. By comparing the trends of brain surface marker motion
from the experiments to brain surface node motion from the simulation, we validated the new ATD head.
Although trends of the maximum displacements of the ATD head due to change of the sled tests conditions
showed same tendency as the simulation model, and the brain node motion responses were estimated as
marginal or fair by CORA analysis, the maximum displacement of the ATD head were 3‐4 folds larger than the
human head FE model. Therefore, the novel ATD head showed a potential for the direct measurement and
visualization of intracranial brain motion as first concept of the ATD head incorporating skull and brain structure,
however, the biofidelity is needed to be improved.
Intracranial Brain Motion Observed in the ATD Head and Simulations
From Fig. 11, the maximum sagittal plane displacement of the brain was observed after a head rotational
direction changed from flexion to extension during the head rebounding off the airbag. In addition, the results
obtained from the FE model showed the same tendency as shown in Fig.12. Therefore, rotational direction
change of a head was thought to be a possible mechanism of relative motion between skull and brain in frontal
crashes.
In addition, the head impacts the airbag at a slight angle, and as the head comes fully in contact with the
airbag, its angular velocity in the Z direction also abruptly changed, such that the left side was pushed back
faster than the right, whereas the brain continued to move owing to its inertia, and an increased displacement
was observed for the left side of the brain compared to the right consistently.
However, these mechanisms can depend on how accurately the relative motion between skull and brain is
validated. Therefore, both the ATD head and FE model is needed to be more biofidelic in order to conclude
these mechanisms.
Correlation between Injury Criteria and Brain Surface Displacement
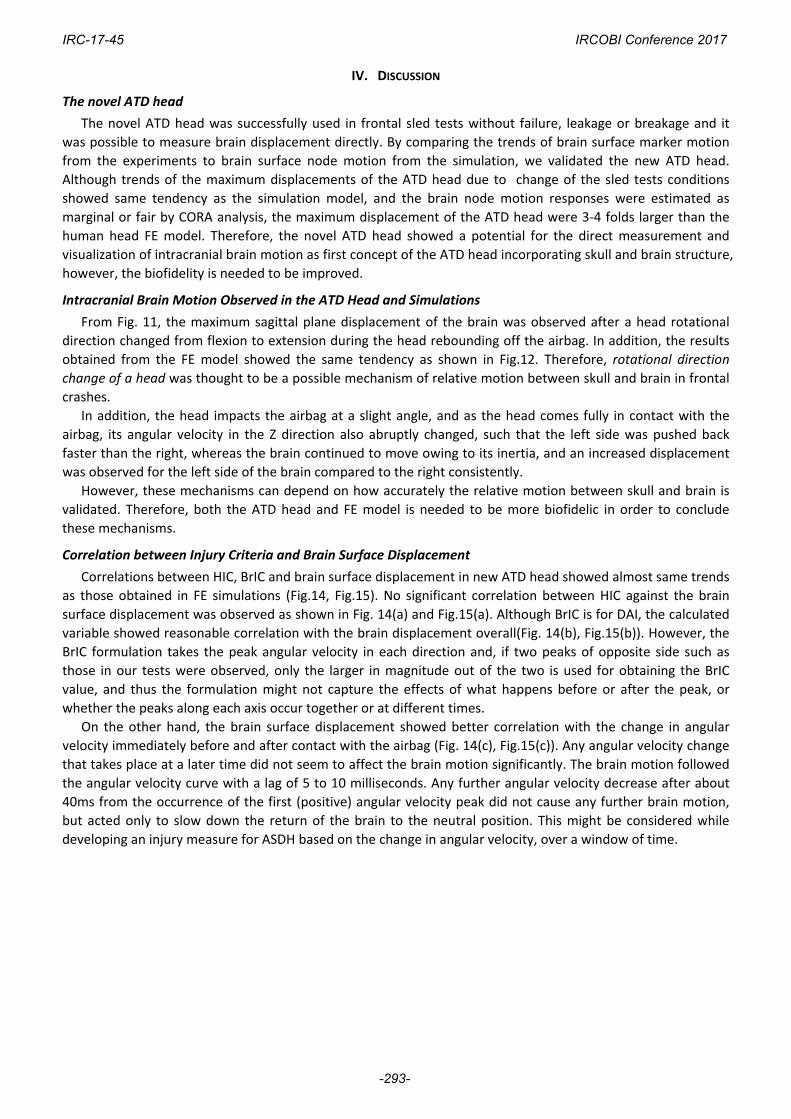
Correlations between HIC, BrIC and brain surface displacement in new ATD head showed almost same trends
as those obtained in FE simulations (Fig.14, Fig.15). No significant correlation between HIC against the brain
surface displacement was observed as shown in Fig. 14(a) and Fig.15(a). Although BrIC is for DAI, the calculated
variable showed reasonable correlation with the brain displacement overall(Fig. 14(b), Fig.15(b)). However, the
BrIC formulation takes the peak angular velocity in each direction and, if two peaks of opposite side such as
those in our tests were observed, only the larger in magnitude out of the two is used for obtaining the BrIC
value, and thus the formulation might not capture the effects of what happens before or after the peak, or
whether the peaks along each axis occur together or at different times.
On the other hand, the brain surface displacement showed better correlation with the change in angular
velocity immediately before and after contact with the airbag (Fig. 14(c), Fig.15(c)). Any angular velocity change
that takes place at a later time did not seem to affect the brain motion significantly. The brain motion followed
the angular velocity curve with a lag of 5 to 10 milliseconds. Any further angular velocity decrease after about
40ms from the occurrence of the first (positive) angular velocity peak did not cause any further brain motion,
but acted only to slow down the return of the brain to the neutral position. This might be considered while
developing an injury measure for ASDH based on the change in angular velocity, over a window of time.
IRC-17-45 IRCOBI Conference 2017
-293-
(a) HIC (b) BrIC (c) Immediate Δω
Fig.14. Correlation between maximum brain surface displacement and injury criteria in the cases of the ATD head
(a) HIC (b) BrIC (c) Immediate Δω
Fig.15. Correlation between maximum brain surface displacement and injury criteria in the case of the human
head FE model
Limitations
Physical model simulations of the human head such as in this study, are not without limitations. It is difficult to reproduce the complex structure of the Pia‐Arachnoid complex. Many aspects of the interface between the brain and the skull are not clear, such as the sliding friction coefficients, the fluid‐structure interactions of the CSF in the trabecular matrix, etc. Large variation in mechanical properties reported for various tissues also adds to the difficulty in physical modelling and finite element simulations. The new ATD head uses biomimetic materials. However, as the meninges are not present, the resistance to relative motion of the brain with respect to the skull is lower than in an actual human. The new ATD head should be improved more biofidelic because the maximum displacement showed 3‐4 folds larger than the human FE model. In addition, the new ATD head is required to be checked its repeatability and reproducibility for a future work.
V. CONCLUSIONS
This study aimed at producing a new ATD head based on actual human geometry capable of direct visualisation and evaluation of skull‐brain relative displacement, using the ATD head in sled tests to evaluate the performance as a new ATD head. The ATD head was successfully used in tests without failure, leakage or breakage. It was possible to measure brain displacement directly. From the sled test results and simulations using a human head FE model which was validated against a PMHS experiment, rotational direction change of a head was thought to be a possible mechanism of skull‐brain relative displacement in frontal crashes. Therefore, a positive relationship was found between the brain surface displacement and the change in angular velocity immediately before and after contact with the airbag in both the sled tests and FE simulation cases. Brain surface marker motion from the experiments were compared to those obtained from human head FE model. Although the brain node motion of the ATD head correlated with the simulation model, the maximum displacement of the ATD head were significantly larger than the human head FE model. Therefore, the novel ATD head showed a potential as a first concept of a new ATD head incorporating skull and brain structures which is capable of direct measurement and visualisation of intracranial brain motion, however, the biofidelity of the ATD head is needed to be improved for the future works.
R² = 0.4847
0
200
400
600
800
0 20 40
HIC
Displacement [mm]
R² = 0.8154
0
0.2
0.4
0.6
0.8
0 20 40
BrIC
Displacement [mm]
R² = 0.8467
0
20
40
60
80
0 20 40
Immed
iate Δω[rad/s]
Displacement [mm]
R² = 0.5583
0
200
400
600
800
0 5 10
HIC
Displacement (mm)
R² = 0.874
0
0.2
0.4
0.6
0.8
0 5 10
BrIC
Displacement (mm)
R² = 0.9203
0
10
20
30
40
50
60
70
0 5 10
immediate Δω (rad/s)
Displacement (mm)
IRC-17-45 IRCOBI Conference 2017
-294-
VI. REFERENCES
[1] Urban J, Whitlow C, Edgerton C, Powers A, Maldjian J, D. Stitzel. Motor vehicle crash‐related subdural hematoma from real‐world head impact data. Journal of Neurotrauma, 2012, 29(18):2774–2781
[2] Willinger R, Baumgartner D, Chinn B, Schuller E. New dummy head prototype: development, validation and injury criteria. International Journal of Crashworthiness, 2001, 6(3):281–294
[3] Margulies S, Thibault L, Gennarelli T. Physical model simulations of brain injury in the primate. Journal of Biomechanics, 1990, 23(8):823–836
[4] Ivarsson J, Viano D, Lovsund P, Aldman B. Strain relief from the cerebral ventricles during head impact: experimental studies on natural protection of the brain. Journal of Biomechanics, 2000, 33(2):181–189
[5] Bradshaw D, Ivarsson J, Morfey C, Viano D. Simulation of acute subdural hematoma and diffuse axonal injury in coronal head impact. Journal of Biomechanics, 2001, 34(1): 85–94
[6] Cheng J, Howard I, Rennison M. Study of an infant brain subjected to periodic motion via a custom experimental apparatus design and finite element modelling. Journal of Biomechanics, 2010, 43(15):2887–2896
[7] Miyazaki Y, Tachiya H, Hojo A, Sakamoto Y. Visualization of relative displacement between skull and brain under occipital impact using a 3D transparent physical head model. Transactions of the Japan Society of Mechanical Engeneers Series A, 2012, 78(785):106–115
[8] Zerris V, James K, Roberts J, Bell E, Heilman C. Repair of the dura mater with processed collagen devices. Journal of Biomedical Materials Research Part B: Applied Biomaterials, 2007, 83(2):580–588
[9] GESAC, Biomechanical response requirements of the THOR NHTSA Advanced Frontal Dummy, Page 37, GESAC05‐03 Technical Report, United States, 2005.
[10] Fallenstein G, Hulce V, Melvin J. Dynamic mechanical properties of human brain tissue. Journal of Biomechanics, 1969, 2(3):217–226
[11] Kleiven S, Holst H. Consequences of head size following trauma to the human head. Journal of Biomechanics, 2002, 35(2):153–160
[12] Raul J, Baumgartner D, Willinger R, Ludes B. Finite element modelling of human head injuries caused by a fall. International Journal of Legal Medicine, 2006, 120 (4):212–218
[13] Hardy W, Foster C, Mason M, Yang K, King A, Tashman S. Investigation of head injury mechanisms using neutral density technology and high‐speed biplanar x‐ray. Stapp Car Crash Journal, 2001, 45:337
[14] Gehre C, Gades H,Wernicke P (2009) Objective rating of signals using test and simulation responses. Proceedings of 21st ESV Conference, 2009, Stuttgart
[15] Takhounts E, Craig M, Moorhouse K, McFadden J, Hasija V. Development of brain injury criteria (BrIC), Stapp Car Crash Journal, 2013, 57:243
IRC-17-45 IRCOBI Conference 2017
-295-
![IRC-20-82 IRCOBI conference 2020 · 2020. 7. 25. · IRC-20-82 IRCOBI conference 2020 709. pressures [21]. It is unclear whether the introduction of the instrumentation causelocal](https://img.pdfslide.us/doc/110x75/6117914610f9c764771658b0/irc-20-82-ircobi-conference-2020-7-25-irc-20-82-ircobi-conference-2020-709.jpg)
![IRC-19-92 IRCOBI conference 2019Martin Östling, Hanna Jeppsson, Nils Lubbe IRC-19-92 IRCOBI conference 2019 626 validated [21] a deterministic analysis method to predict future road](https://img.pdfslide.us/doc/110x75/60a56309ab4a3f476a041ce0/irc-19-92-ircobi-conference-martin-stling-hanna-jeppsson-nils-lubbe-irc-19-92.jpg)


![IRC-20-37 IRCOBI conference 2020 · 2020. 7. 25. · IRC-20-37 IRCOBI conference 2020 231. evaluate ground impact patterns [15–17]. Pedestrian behaviour prior to crash has however](https://img.pdfslide.us/doc/110x75/611b96d4916d69193c362f09/irc-20-37-ircobi-conference-2020-7-25-irc-20-37-ircobi-conference-2020-231.jpg)


![IRC-15-50 IRCOBI Conference 2015 › wordpress › downloads › irc15 › pdf_files › 50.pdf · Insurance Institute for Highway Safety evaluating pedestrian crash scenarios [8]](https://img.pdfslide.us/doc/110x75/5f202c3d280fcc6ef85f3930/irc-15-50-ircobi-conference-a-wordpress-a-downloads-a-irc15-a-pdffiles.jpg)