Embed Size (px)
Citation preview
Iranian Journal of Energy and Environment 8(2): 170-180, 2017
170
Iranian Journal of Energy & Environment Journal Homepage: www.ijee.net
IJEE an official peer review journal of Babol Noshirvani University of Technology, ISSN:2079-2115
1Micro-pollution Research Centre (MPRC),Department of Water and Environmental Engineering, Faculty of Civil & Environmental Engineering, UniversitiTun Hussein Onn Malaysia,86400 Parit Raja, BatuPahat, Johor, Malaysia 2Department of Science Engineering Technology, UMT, Terengganu, Malaysia
P A P E R I N F O
Paper history: Received 13 July 2016 Accepted in revised form 12 August 2017
Keywords: Air Pollution PM10¬
CO NOx Open Air R-Packages Software
A B S T R A C T
Air quality in the residential areas adjacent to the industrial regions is of great concern due to the association with particulate matter and toxic gaseous which has adverse effects on human health.
Therefore, the present study aimed to investigate the air quality in term of PM10 concentrations and
toxic gaseous (CO and NO) at University Hussein Onn Malaysia (UTHM) residential college which is adjacent to a wood processing, electronic and fibre board factories. Four Stations defined as Station
1 (KKM), Station 2 (KKP), Station 3 (KKTDI) and Station 4 (KKTU) were selected for this
investigation. PM10 concentrations were measured using the E-Sampler Particulate Matter for 24 hours period within the dry season (February –May 2016) which was associated with the heavily haze
phenomenon in Malaysia. The distribution of selected toxic gases in UTHM student hostels was
determined using the TSI IAQ (CO) and Dragger X-am 7000 (NO). PM10 and toxic gaseous levels were compared to the Ambient Air Quality Standard (AAQS) and to compute the assumption of the
sources of PM10 by using Open Air R Package Software. Data were analysed using the R Software and
packages (Open-air, BRT, Akima). The highest concentration of PM10 was 114 µg/m3 recorded at KKTDI followed by 58 µg/m3 at KKP. The maximum CO concentrations noted at KKP (1.8 ppm).
However, both PM10 and CO concentrations not exceeded the AAQS of 150 µg/m3 and 30 ppm
respectively. Moreover, concentrations of NO at KKP (0.61 ppm) and KKM (2.18 ppm) exceeded the AAQS (0.17 ppm) indicating the possibility of presence health risk for students at UTHM due to poor
air quality. The air quality is directly associated to level of energy consumption which causes climate
changes and accumulation of greenhouse gases.
doi: 10.5829/ijee.2017.08.02.11
INTRODUCTION1
The rapid urbanization and industrialization in Malaysia
during the last two decades have associated with the
ambient pollutants that may have negative impacts on
human health [1-3]. Malaysia had initiated a strategy in
1991, so called Wawasan 2020 which is the aspiration to
become a fully developed country by 2020. The
urbanization population on 2011 is about 72.8% with the
highest location at Kuala Lumpur followed by Klang and
Johor Bahru [4]. The developments in industrial sector
has increased from 38.5% in 1980 to 44.5% in 2002. This
increases is associated with the decease of air quality, the
results from the study in 2009, using data 1997 to 2006
showed that the average of PM10 concentrations recorded
at different locations of Kuala Lumpur were 56.41 µg/m3,
which is under the permissible value recommended by
Ambient Air Quality Standard (150µg/m3) (AAQS) [5].
* Corresponding author: Mohamed RMSR
E-mail: [email protected]
The high rate of urbanization and industrialization might
also increase the concentration of sulphur dioxide (SO2),
nitrogen oxide (NO), carbon monoxide (CO), lead (Pb)
and ozone (O3) [6]. CO reduces the oxygen carrying
capacity of red blood cells. The health effects depend on
the duration of exposure and the concentration of CO
inhaled. Higher concentration of CO can lead to impaired
vision, disturbed coordination and eventually death. In
contrast, NO irritates the mucosa of eyes, nose, throat and
the lower respiratory tract. NO2 also aggravates existing
chronic respiratory diseases. Long-term exposure to NO2
lead to reduction of lung function and reduces the
resistance to respiratory infections [7].
The effect of particulate matter on human health
depend on the particles size and their concentration in air.
The fine particles (<10µm) are more harmful compare to
the coarse particles, in terms of mortality, cardiovascular
and respiratory effects [8, 9]. It has been revealed that the
exposure to PM2.5 is associated with lung cancer mortality
Determination of Particulate Matter and Toxic Gaseous in Ambient Air Adjacent to
Industrial Area
Mohamed RMSR1*, Al-Gheethi AA1, Fahira MAB 1, Fahimah H.1, Yahaya NZ2 and Amir HK1
Iranian Journal of Energy and Environment 8(2): 170-180, 2017
171
[10]. However, the degree of risk depend also on the time
exposures to the particulate matter [11]. The short term
exposure usually effects on the respiratory symptoms
such as cough, shortness of breath and asthma [12], while
long-term exposure for many years is associated with
reduced lung function and the development of chronic
bronchitis and premature death [1].
On the other hand, the exposure to NO2 might
increase the bronchial reactivity. In study of CO
poisoning, 37% of patients with CO poisoning have
myocardial injury and 38% have died at a median follow-
up of 7.6 years [13]. Many industrial areas in the world
have poor air quality due to presence of industries that
used coal combustion method in their industrial
processes. The highest concentration of PM10 was
400µg/m3 at Delhi, India [9]. In Malaysia, the maximum
PM10 concentrations was recorded in Penang (421μg/m3)
in 2008 which exceeded the AAQS, but this case was
noted only one time due to the haze event that struck the
country in that year [14]. The concentration of PM10 in
some industrial area such as Penang, Selangor and Kuala
Lumpur reached more than 100 µg/m3 as reported by
several investigators [15, 16]. However, these values still
less than AAQS standards limits. According to DSM
[17], the total emission of PM10 into the atmosphere from
the industry activities in Malaysia in year 2011 was 11.3
tons, while CO was 11.9 tons, the maximum
concentrations was for NO2, where 62.5 tons was
generated into the atmosphere. In order to protect the
public health from the adverse effects of air pollutants,
several countries have adopted regulations for air quality
standards based on Particulate Matter (PM10). In
Malaysia, the Ambient Air Quality Guidelines (AAQG)
has recommended that the PM10, should be less than 150
µg/m3/ 24 hours or less than 50 µg/m3/ 12 months. Some
countries such as Australia recommended more stringent
standards where, PM10 should be less than 50 µg/m3/ 24
hours and 0 / 12 months. In Japan, PM10 should be
between 100-200 µg/m3/ 24 hours and 0 /12 months.
In Johor, the concentrations of PM10, NO and CO at
University Tun Hussein Onn Malaysia (UTHM) have
been reported by several investigators [5, 18]. However,
the periodic assessment is needed due to the presence of
many factories around the university and in order to
protect student health from the sudden pollutants as that
happened in 2006, where the concentration of PM10
recorded more than 1291µg/m3 [18]. Moreover, the
concentrations of PM10 and toxic gaseous might depend
on the meteorological factors as recorded previously in
Penang where the PM10 reached 400µg/m3 during haze
season. The air quality is associated with the energy
consumption and climate change [19]. Ozturk [20]
revealed that the increasing in energy consumption by
1% was associated with 0.12, 0.65, 0.12 and 0.11% of
increasing in the greenhouse gas, carbon dioxide,
methane and nitrous oxide emissions, respectively. In the
present study, the concentrations of PM10 as well as the
toxic gaseous (CO and NO) around UTHM Industrial
area were measured. Moreover, the verification in PM10
and toxic gaseous in a response to the haze season which
is a special case cause in Malaysia and Indonesia was
investigated. Detection of haze season and air pollutants
in this work may emphasize the novelty of present study.
The relations between meteorological factors including
temperature, humidity, wind direction and wind speed to
the air quality were examined in order to have the best
understanding their role in the level of distribution of the
PM10 and toxic gaseous in ambient air of the residences
areas adjacent to industrial regions.
The present study aimed to investigate the air quality
in term of PM10 concentrations and toxic gaseous (CO
and NO) at University Hussein Onn Malaysia (UTHM)
residential college which is adjacent to a wood
processing, electronic and fibre board factories.
MATERIAL AND METHODS
Study area
University Hussein Onn Malaysia (UTHM) is a public
university located at Parit Raja nearby an industrial area
(Figure 1). The university is adjacent to the
manufacturing electrical products, packaging services
and wood processing factories. These factories are
operating on the fiber board manufacturing, paper mills
and packaging and semiconductor. Therefore, represent a
source for particulate matter during the operation
processes. Among 70% of the individual emission
measurement from industrial plants and domestic stoves
the PM10 is the major part with 90% of emission [21].
Four stations were selected due to the special
locations around the industrial area with different
distances to determine the level of PM10 and toxic
gaseous distribution. The stations included Melewar
Residential College (about 900 m from the industrial
area) hereafter referred as Station 1 (KKM); Perwira
Residential College (800m) hereafter referred as Station
2 (KKP), TDI Residential College (400 m) hereafter
referred as Station 3 (KKTDI) and Taman University
Residential College (2400m) hereafter referred as Station
4 (KKTU) (see figure 1).
Estimation of PM10 and toxic gaseous concentrations
E-Sampler was used to measure the concentration of
PM10 in ambient air of the specified stations (Figure 2a).
This equipment used to provide meteorological data of
humidity, temperature, wind direction and wind speed
from sampling area. Figure 2 shows the E-Sampler
equipment apparatus and their set-up. The distribution of
CO was determined using the TSI IAQ while NO was
determined using Dragger X-am 7000 (Figures 2b and
2c). Data for PM10, CO and NO concentrations were
Iranian Journal of Energy and Environment 8(2): 170-180, 2017
172
determined at the investigated stations. CO and NO was
estimated only at Station 1 and Station 2 because these
stations represent the student residential area. Each
station was measured at the same time within 24 hours
during the dry season between February and May 2016.
In order to confirm the presence or absence of
polycyclic aromatic hydrocarbons (PAHs) which
includes acenaphthylene, fluorine,
phenanthrene,anthracene,fluoranthene,pyrene,
benzo(a)anthracene andchrysene. The air samples were
analysed by gas chromatography at Universiti
Kebangsaan Malaysia (UKM), Bangi, Malaysia.
Data analysis
The data collected during the period of study was
arranged in the Microsoft Excel using .csv format and
then used to compute the relevant
RESULTS AND DISCUSSION
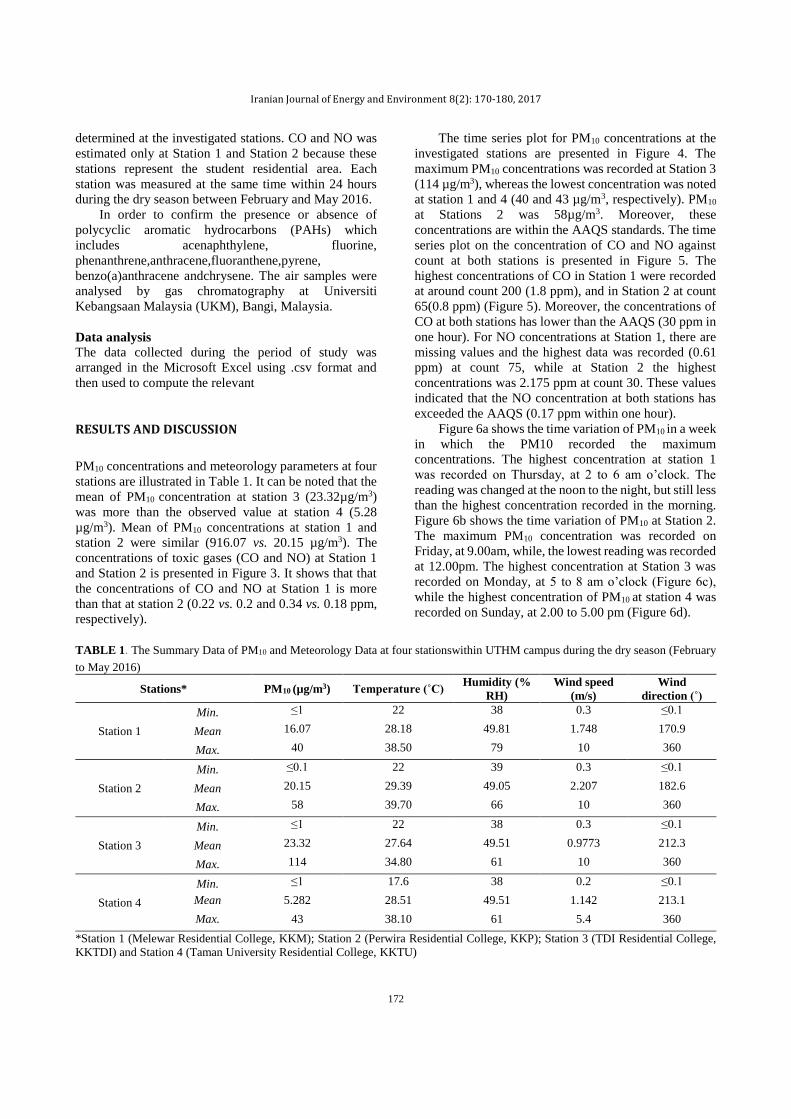
PM10 concentrations and meteorology parameters at four
stations are illustrated in Table 1. It can be noted that the
mean of PM10 concentration at station 3 (23.32µg/m3)
was more than the observed value at station 4 (5.28
µg/m3). Mean of PM10 concentrations at station 1 and
station 2 were similar (916.07 vs. 20.15 µg/m3). The
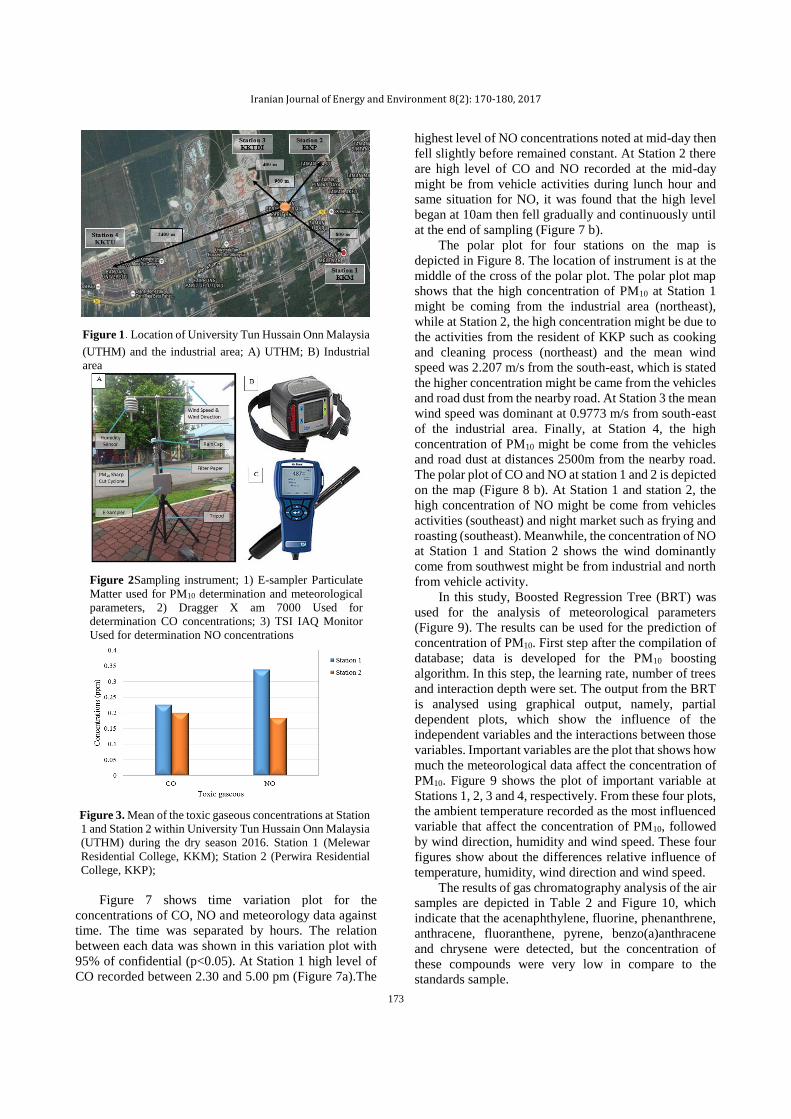
concentrations of toxic gases (CO and NO) at Station 1
and Station 2 is presented in Figure 3. It shows that that
the concentrations of CO and NO at Station 1 is more
than that at station 2 (0.22 vs. 0.2 and 0.34 vs. 0.18 ppm,
respectively).
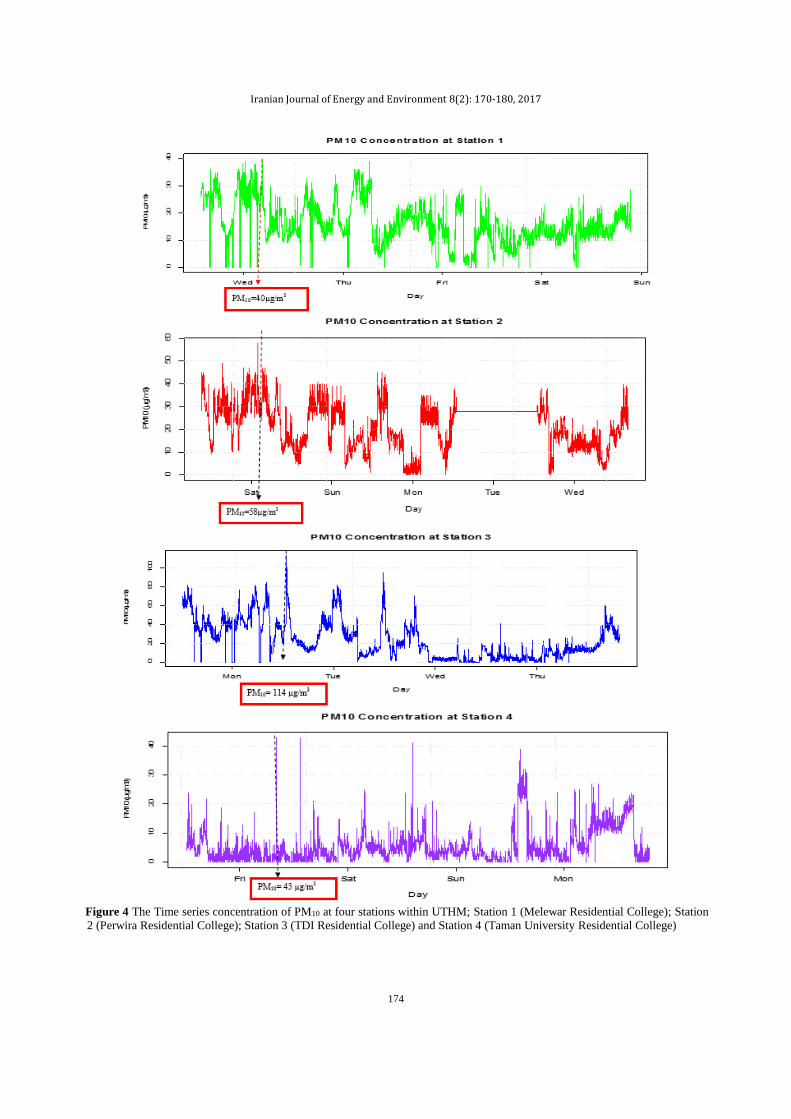
The time series plot for PM10 concentrations at the
investigated stations are presented in Figure 4. The
maximum PM10 concentrations was recorded at Station 3
(114 µg/m3), whereas the lowest concentration was noted
at station 1 and 4 (40 and 43 µg/m3, respectively). PM10
at Stations 2 was 58µg/m3. Moreover, these
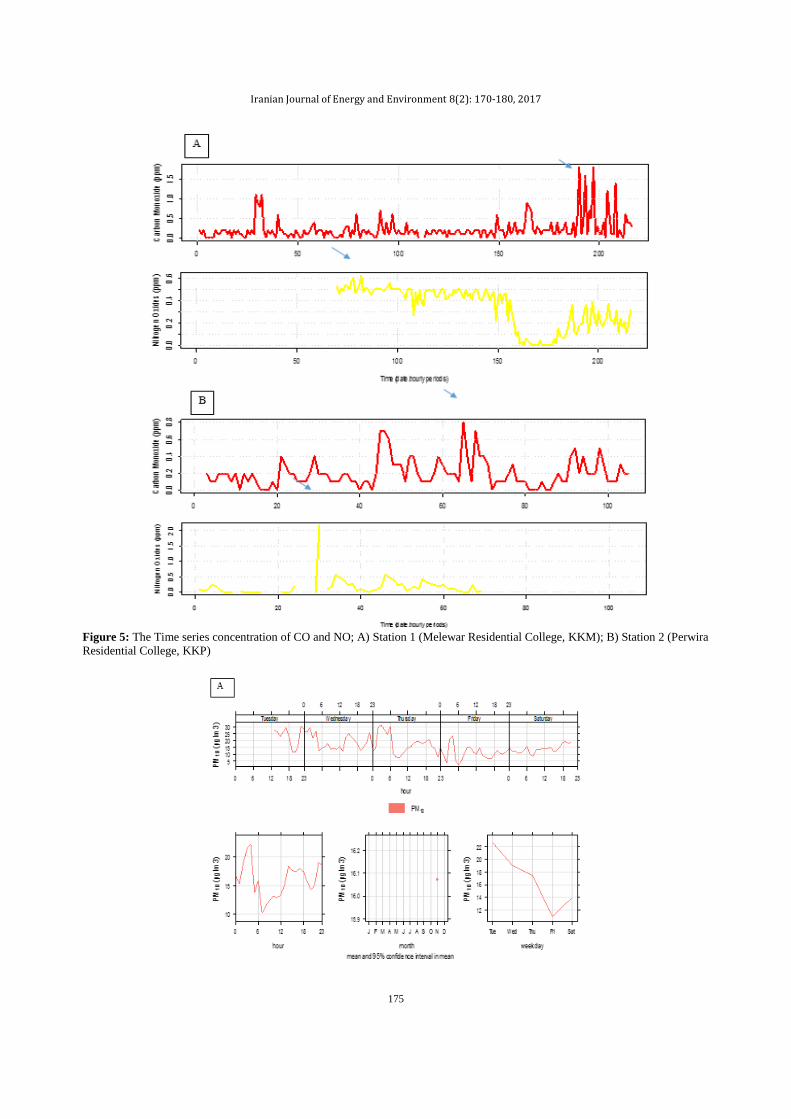
concentrations are within the AAQS standards. The time
series plot on the concentration of CO and NO against
count at both stations is presented in Figure 5. The
highest concentrations of CO in Station 1 were recorded
at around count 200 (1.8 ppm), and in Station 2 at count
65(0.8 ppm) (Figure 5). Moreover, the concentrations of
CO at both stations has lower than the AAQS (30 ppm in
one hour). For NO concentrations at Station 1, there are
missing values and the highest data was recorded (0.61
ppm) at count 75, while at Station 2 the highest
concentrations was 2.175 ppm at count 30. These values
indicated that the NO concentration at both stations has
exceeded the AAQS (0.17 ppm within one hour).
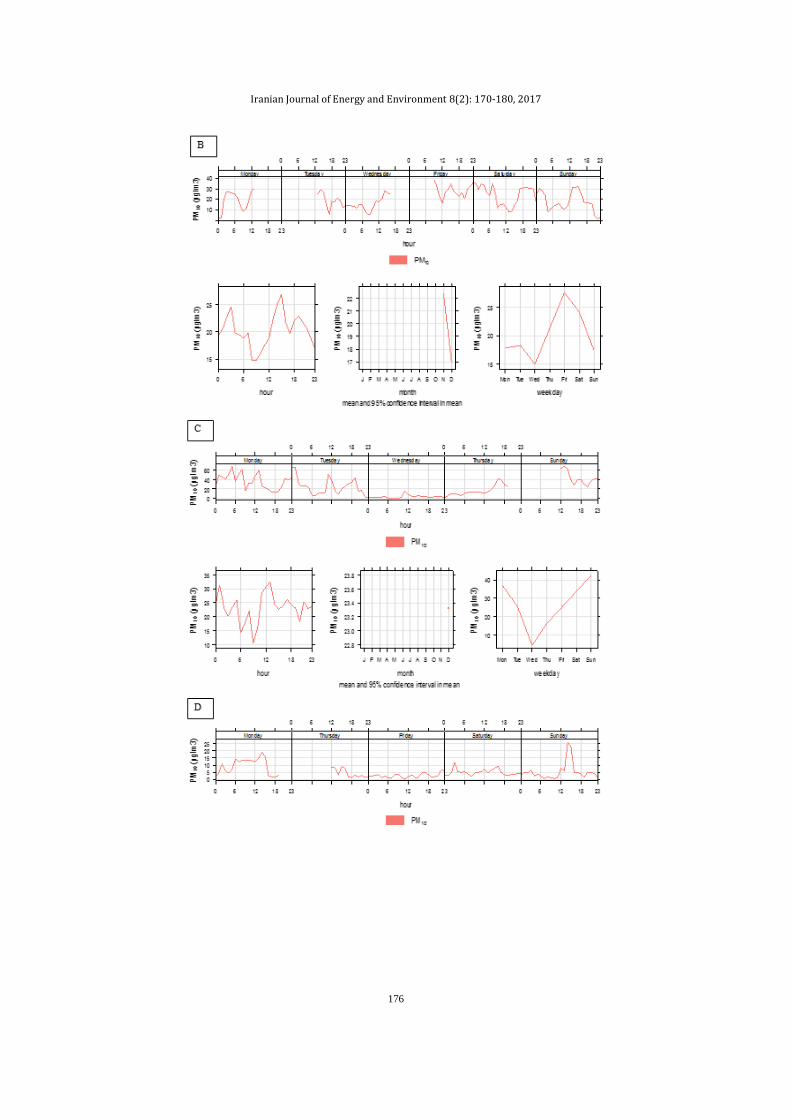
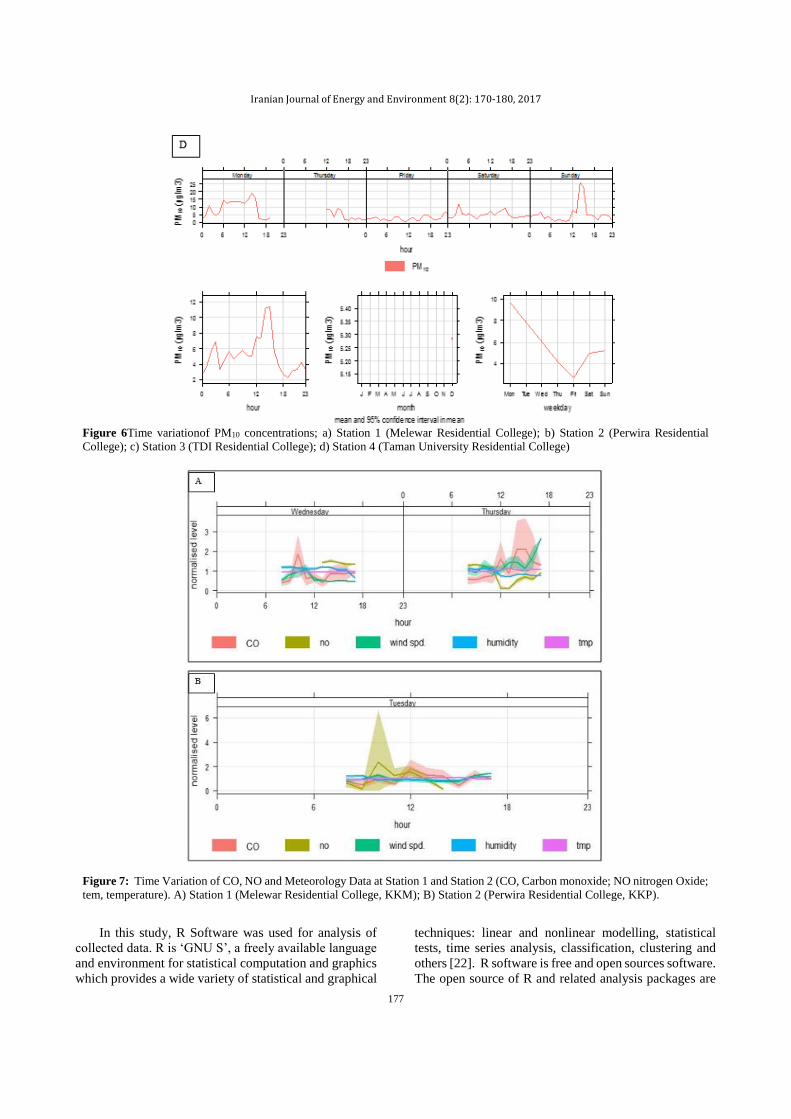
Figure 6a shows the time variation of PM10 in a week
in which the PM10 recorded the maximum
concentrations. The highest concentration at station 1
was recorded on Thursday, at 2 to 6 am o’clock. The
reading was changed at the noon to the night, but still less
than the highest concentration recorded in the morning.
Figure 6b shows the time variation of PM10 at Station 2.
The maximum PM10 concentration was recorded on
Friday, at 9.00am, while, the lowest reading was recorded
at 12.00pm. The highest concentration at Station 3 was
recorded on Monday, at 5 to 8 am o’clock (Figure 6c),
while the highest concentration of PM10 at station 4 was
recorded on Sunday, at 2.00 to 5.00 pm (Figure 6d).
TABLE 1. The Summary Data of PM10 and Meteorology Data at four stationswithin UTHM campus during the dry season (February
to May 2016)
Stations* )3(µg/m10 PM Temperature (˚C) Humidity (%
RH)
Wind speed
(m/s)
Wind
direction (˚)
Station 1
Min. ≤1 22 38 0.3 ≤0.1
Mean 16.07 28.18 49.81 1.748 170.9
Max. 40 38.50 79 10 360
Station 2
Min. ≤0.1 22 39 0.3 ≤0.1
Mean 20.15 29.39 49.05 2.207 182.6
Max. 58 39.70 66 10 360
Station 3
Min. ≤1 22 38 0.3 ≤0.1
Mean 23.32 27.64 49.51 0.9773 212.3
Max. 114 34.80 61 10 360
Station 4
Min. ≤1 17.6 38 0.2 ≤0.1
Mean 5.282 28.51 49.51 1.142 213.1
Max. 43 38.10 61 5.4 360
*Station 1 (Melewar Residential College, KKM); Station 2 (Perwira Residential College, KKP); Station 3 (TDI Residential College,
KKTDI) and Station 4 (Taman University Residential College, KKTU)
Iranian Journal of Energy and Environment 8(2): 170-180, 2017
173
Figure 1. Location of University Tun Hussain Onn Malaysia
(UTHM) and the industrial area; A) UTHM; B) Industrial
area
Figure 2Sampling instrument; 1) E-sampler Particulate
Matter used for PM10 determination and meteorological
parameters, 2) Dragger X am 7000 Used for
determination CO concentrations; 3) TSI IAQ Monitor
Used for determination NO concentrations
Figure 3. Mean of the toxic gaseous concentrations at Station
1 and Station 2 within University Tun Hussain Onn Malaysia
(UTHM) during the dry season 2016. Station 1 (Melewar
Residential College, KKM); Station 2 (Perwira Residential
College, KKP);
Figure 7 shows time variation plot for the
concentrations of CO, NO and meteorology data against
time. The time was separated by hours. The relation
between each data was shown in this variation plot with
95% of confidential (p<0.05). At Station 1 high level of
CO recorded between 2.30 and 5.00 pm (Figure 7a).The
highest level of NO concentrations noted at mid-day then
fell slightly before remained constant. At Station 2 there
are high level of CO and NO recorded at the mid-day
might be from vehicle activities during lunch hour and
same situation for NO, it was found that the high level
began at 10am then fell gradually and continuously until
at the end of sampling (Figure 7 b).
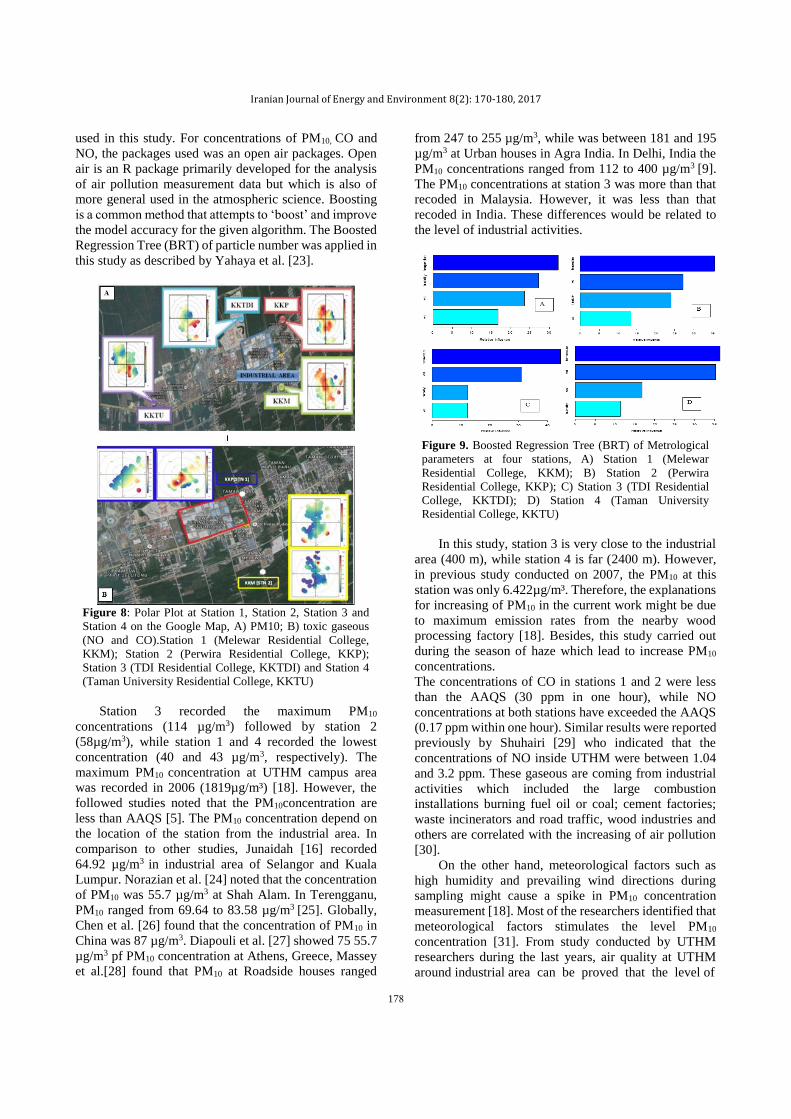
The polar plot for four stations on the map is
depicted in Figure 8. The location of instrument is at the
middle of the cross of the polar plot. The polar plot map
shows that the high concentration of PM10 at Station 1
might be coming from the industrial area (northeast),
while at Station 2, the high concentration might be due to
the activities from the resident of KKP such as cooking
and cleaning process (northeast) and the mean wind
speed was 2.207 m/s from the south-east, which is stated
the higher concentration might be came from the vehicles
and road dust from the nearby road. At Station 3 the mean
wind speed was dominant at 0.9773 m/s from south-east
of the industrial area. Finally, at Station 4, the high
concentration of PM10 might be come from the vehicles
and road dust at distances 2500m from the nearby road.
The polar plot of CO and NO at station 1 and 2 is depicted
on the map (Figure 8 b). At Station 1 and station 2, the
high concentration of NO might be come from vehicles
activities (southeast) and night market such as frying and
roasting (southeast). Meanwhile, the concentration of NO
at Station 1 and Station 2 shows the wind dominantly
come from southwest might be from industrial and north
from vehicle activity.
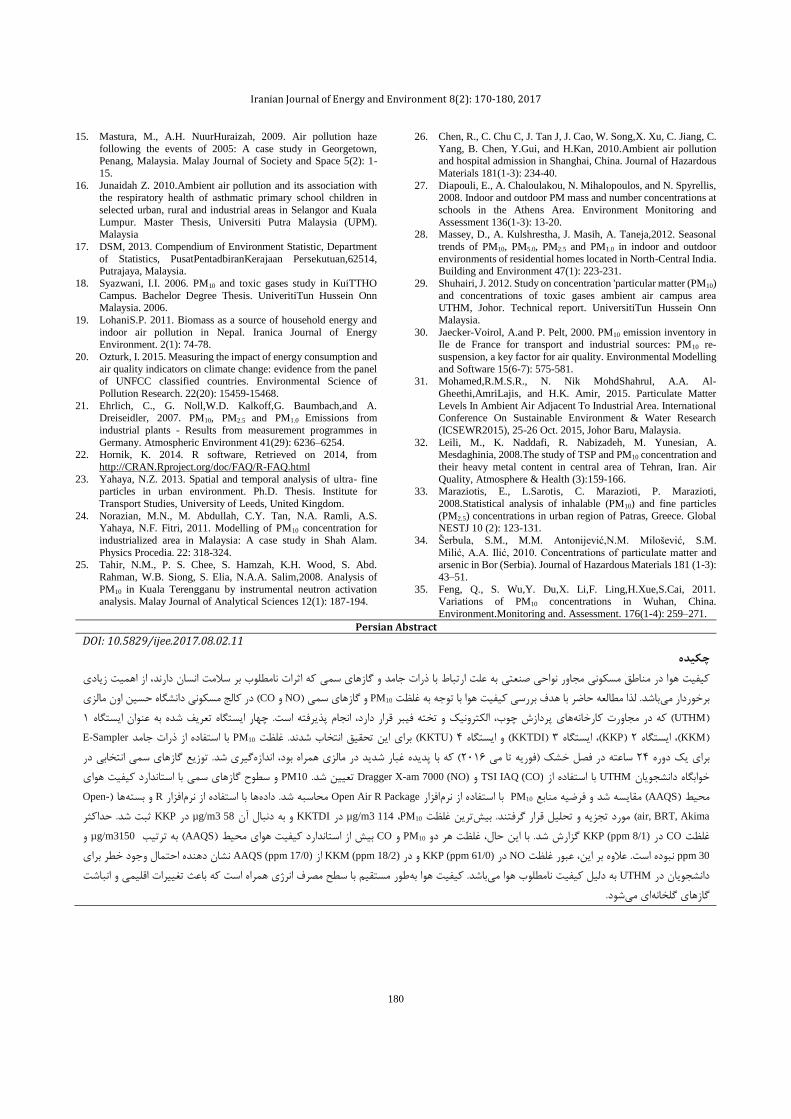
In this study, Boosted Regression Tree (BRT) was
used for the analysis of meteorological parameters
(Figure 9). The results can be used for the prediction of
concentration of PM10. First step after the compilation of
database; data is developed for the PM10 boosting
algorithm. In this step, the learning rate, number of trees
and interaction depth were set. The output from the BRT
is analysed using graphical output, namely, partial
dependent plots, which show the influence of the
independent variables and the interactions between those
variables. Important variables are the plot that shows how
much the meteorological data affect the concentration of
PM10. Figure 9 shows the plot of important variable at
Stations 1, 2, 3 and 4, respectively. From these four plots,
the ambient temperature recorded as the most influenced
variable that affect the concentration of PM10, followed
by wind direction, humidity and wind speed. These four
figures show about the differences relative influence of
temperature, humidity, wind direction and wind speed.
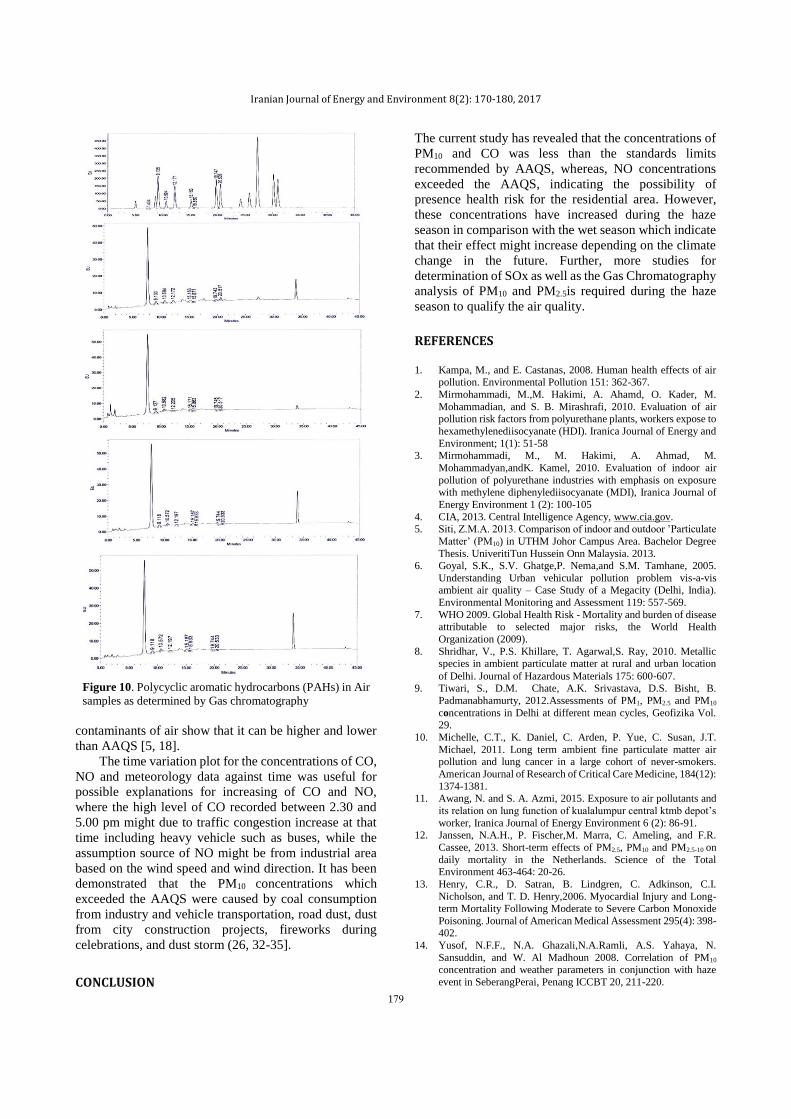
The results of gas chromatography analysis of the air
samples are depicted in Table 2 and Figure 10, which
indicate that the acenaphthylene, fluorine, phenanthrene,
anthracene, fluoranthene, pyrene, benzo(a)anthracene
and chrysene were detected, but the concentration of
these compounds were very low in compare to the
standards sample.
Iranian Journal of Energy and Environment 8(2): 170-180, 2017
174
Figure 4 The Time series concentration of PM10 at four stations within UTHM; Station 1 (Melewar Residential College); Station
2 (Perwira Residential College); Station 3 (TDI Residential College) and Station 4 (Taman University Residential College)
Iranian Journal of Energy and Environment 8(2): 170-180, 2017
175
Figure 5: The Time series concentration of CO and NO; A) Station 1 (Melewar Residential College, KKM); B) Station 2 (Perwira
Residential College, KKP)
Iranian Journal of Energy and Environment 8(2): 170-180, 2017
176
Iranian Journal of Energy and Environment 8(2): 170-180, 2017
177
Figure 6Time variationof PM10 concentrations; a) Station 1 (Melewar Residential College); b) Station 2 (Perwira Residential
College); c) Station 3 (TDI Residential College); d) Station 4 (Taman University Residential College)
Figure 7: Time Variation of CO, NO and Meteorology Data at Station 1 and Station 2 (CO, Carbon monoxide; NO nitrogen Oxide;
tem, temperature). A) Station 1 (Melewar Residential College, KKM); B) Station 2 (Perwira Residential College, KKP).
In this study, R Software was used for analysis of
collected data. R is ‘GNU S’, a freely available language
and environment for statistical computation and graphics
which provides a wide variety of statistical and graphical
techniques: linear and nonlinear modelling, statistical
tests, time series analysis, classification, clustering and
others [22]. R software is free and open sources software.
The open source of R and related analysis packages are
Iranian Journal of Energy and Environment 8(2): 170-180, 2017
used in this study. For concentrations of PM10, CO and
NO, the packages used was an open air packages. Open
air is an R package primarily developed for the analysis
of air pollution measurement data but which is also of
more general used in the atmospheric science. Boosting
is a common method that attempts to ‘boost’ and improve
the model accuracy for the given algorithm. The Boosted
Regression Tree (BRT) of particle number was applied in
this study as described by Yahaya et al. [23].
Figure 8: Polar Plot at Station 1, Station 2, Station 3 and
Station 4 on the Google Map, A) PM10; B) toxic gaseous
(NO and CO).Station 1 (Melewar Residential College,
KKM); Station 2 (Perwira Residential College, KKP);
Station 3 (TDI Residential College, KKTDI) and Station 4
(Taman University Residential College, KKTU)
Station 3 recorded the maximum PM10
concentrations (114 µg/m3) followed by station 2
(58µg/m3), while station 1 and 4 recorded the lowest
concentration (40 and 43 µg/m3, respectively). The
maximum PM10 concentration at UTHM campus area
was recorded in 2006 (1819µg/m³) [18]. However, the
followed studies noted that the PM10concentration are
less than AAQS [5]. The PM10 concentration depend on
the location of the station from the industrial area. In
comparison to other studies, Junaidah [16] recorded
64.92 µg/m3 in industrial area of Selangor and Kuala
Lumpur. Norazian et al. [24] noted that the concentration
of PM10 was 55.7 µg/m3 at Shah Alam. In Terengganu,
PM10 ranged from 69.64 to 83.58 µg/m3 [25]. Globally,
Chen et al. [26] found that the concentration of PM10 in
China was 87 µg/m3. Diapouli et al. [27] showed 75 55.7
µg/m3 pf PM10 concentration at Athens, Greece, Massey
et al.[28] found that PM10 at Roadside houses ranged
from 247 to 255 µg/m3, while was between 181 and 195
µg/m3 at Urban houses in Agra India. In Delhi, India the
PM10 concentrations ranged from 112 to 400 µg/m3 [9].
The PM10 concentrations at station 3 was more than that
recoded in Malaysia. However, it was less than that
recoded in India. These differences would be related to
the level of industrial activities.
Figure 9. Boosted Regression Tree (BRT) of Metrological
parameters at four stations, A) Station 1 (Melewar
Residential College, KKM); B) Station 2 (Perwira
Residential College, KKP); C) Station 3 (TDI Residential
College, KKTDI); D) Station 4 (Taman University
Residential College, KKTU)
In this study, station 3 is very close to the industrial
area (400 m), while station 4 is far (2400 m). However,
in previous study conducted on 2007, the PM10 at this
station was only 6.422µg/m³. Therefore, the explanations
for increasing of PM10 in the current work might be due
to maximum emission rates from the nearby wood
processing factory [18]. Besides, this study carried out
during the season of haze which lead to increase PM10
concentrations.
The concentrations of CO in stations 1 and 2 were less
than the AAQS (30 ppm in one hour), while NO
concentrations at both stations have exceeded the AAQS
(0.17 ppm within one hour). Similar results were reported
previously by Shuhairi [29] who indicated that the
concentrations of NO inside UTHM were between 1.04
and 3.2 ppm. These gaseous are coming from industrial
activities which included the large combustion
installations burning fuel oil or coal; cement factories;
waste incinerators and road traffic, wood industries and
others are correlated with the increasing of air pollution
[30].
On the other hand, meteorological factors such as
high humidity and prevailing wind directions during
sampling might cause a spike in PM10 concentration
measurement [18]. Most of the researchers identified that
meteorological factors stimulates the level PM10
concentration [31]. From study conducted by UTHM
researchers during the last years, air quality at UTHM
around industrial area can be proved that the level of
178
Iranian Journal of Energy and Environment 8(2): 170-180, 2017
Figure 10. Polycyclic aromatic hydrocarbons (PAHs) in Air
samples as determined by Gas chromatography
contaminants of air show that it can be higher and lower
than AAQS [5, 18].
The time variation plot for the concentrations of CO,
NO and meteorology data against time was useful for
possible explanations for increasing of CO and NO,
where the high level of CO recorded between 2.30 and
5.00 pm might due to traffic congestion increase at that
time including heavy vehicle such as buses, while the
assumption source of NO might be from industrial area
based on the wind speed and wind direction. It has been
demonstrated that the PM10 concentrations which
exceeded the AAQS were caused by coal consumption
from industry and vehicle transportation, road dust, dust
from city construction projects, fireworks during
celebrations, and dust storm (26, 32-35].
CONCLUSION
The current study has revealed that the concentrations of
PM10 and CO was less than the standards limits
recommended by AAQS, whereas, NO concentrations
exceeded the AAQS, indicating the possibility of
presence health risk for the residential area. However,
these concentrations have increased during the haze
season in comparison with the wet season which indicate
that their effect might increase depending on the climate
change in the future. Further, more studies for
determination of SOx as well as the Gas Chromatography
analysis of PM10 and PM2.5is required during the haze
season to qualify the air quality.
REFERENCES 1. Kampa, M., and E. Castanas, 2008. Human health effects of air
pollution. Environmental Pollution 151: 362-367.
2. Mirmohammadi, M.,M. Hakimi, A. Ahamd, O. Kader, M.
Mohammadian, and S. B. Mirashrafi, 2010. Evaluation of air pollution risk factors from polyurethane plants, workers expose to
hexamethylenediisocyanate (HDI). Iranica Journal of Energy and
Environment; 1(1): 51-58 3. Mirmohammadi, M., M. Hakimi, A. Ahmad, M.
Mohammadyan,andK. Kamel, 2010. Evaluation of indoor air
pollution of polyurethane industries with emphasis on exposure with methylene diphenylediisocyanate (MDI), Iranica Journal of
Energy Environment 1 (2): 100-105
4. CIA, 2013. Central Intelligence Agency, www.cia.gov. 5. Siti, Z.M.A. 2013. Comparison of indoor and outdoor ’Particulate
Matter’ (PM10) in UTHM Johor Campus Area. Bachelor Degree
Thesis. UniveritiTun Hussein Onn Malaysia. 2013. 6. Goyal, S.K., S.V. Ghatge,P. Nema,and S.M. Tamhane, 2005.
Understanding Urban vehicular pollution problem vis-a-vis ambient air quality – Case Study of a Megacity (Delhi, India).
Environmental Monitoring and Assessment 119: 557-569.
7. WHO 2009. Global Health Risk - Mortality and burden of disease
attributable to selected major risks, the World Health
Organization (2009).
8. Shridhar, V., P.S. Khillare, T. Agarwal,S. Ray, 2010. Metallic species in ambient particulate matter at rural and urban location
of Delhi. Journal of Hazardous Materials 175: 600‐607. 9. Tiwari, S., D.M. Chate, A.K. Srivastava, D.S. Bisht, B.
Padmanabhamurty, 2012.Assessments of PM1, PM2.5 and PM10
concentrations in Delhi at different mean cycles, Geofizika Vol. 29.
10. Michelle, C.T., K. Daniel, C. Arden, P. Yue, C. Susan, J.T.
Michael, 2011. Long term ambient fine particulate matter air pollution and lung cancer in a large cohort of never-smokers.
American Journal of Research of Critical Care Medicine, 184(12):
1374-1381. 11. Awang, N. and S. A. Azmi, 2015. Exposure to air pollutants and
its relation on lung function of kualalumpur central ktmb depot’s
worker, Iranica Journal of Energy Environment 6 (2): 86-91. 12. Janssen, N.A.H., P. Fischer,M. Marra, C. Ameling, and F.R.
Cassee, 2013. Short-term effects of PM2.5, PM10 and PM2.5-10 on
daily mortality in the Netherlands. Science of the Total Environment 463-464: 20-26.
13. Henry, C.R., D. Satran, B. Lindgren, C. Adkinson, C.I.
Nicholson, and T. D. Henry,2006. Myocardial Injury and Long-term Mortality Following Moderate to Severe Carbon Monoxide
Poisoning. Journal of American Medical Assessment 295(4): 398-402.
14. Yusof, N.F.F., N.A. Ghazali,N.A.Ramli, A.S. Yahaya, N.
Sansuddin, and W. Al Madhoun 2008. Correlation of PM10 concentration and weather parameters in conjunction with haze
event in SeberangPerai, Penang ICCBT 20, 211-220.
179
Iranian Journal of Energy and Environment 8(2): 170-180, 2017
15. Mastura, M., A.H. NuurHuraizah, 2009. Air pollution haze
following the events of 2005: A case study in Georgetown, Penang, Malaysia. Malay Journal of Society and Space 5(2): 1-
15.
16. Junaidah Z. 2010.Ambient air pollution and its association with the respiratory health of asthmatic primary school children in
selected urban, rural and industrial areas in Selangor and Kuala
Lumpur. Master Thesis, Universiti Putra Malaysia (UPM). Malaysia
17. DSM, 2013. Compendium of Environment Statistic, Department
of Statistics, PusatPentadbiranKerajaan Persekutuan,62514, Putrajaya, Malaysia.
18. Syazwani, I.I. 2006. PM10 and toxic gases study in KuiTTHO
Campus. Bachelor Degree Thesis. UniveritiTun Hussein Onn Malaysia. 2006.
19. LohaniS.P. 2011. Biomass as a source of household energy and
indoor air pollution in Nepal. Iranica Journal of Energy Environment. 2(1): 74-78.
20. Ozturk, I. 2015. Measuring the impact of energy consumption and
air quality indicators on climate change: evidence from the panel
of UNFCC classified countries. Environmental Science of
Pollution Research. 22(20): 15459-15468.
21. Ehrlich, C., G. Noll,W.D. Kalkoff,G. Baumbach,and A. Dreiseidler, 2007. PM10, PM2.5 and PM1.0 Emissions from
industrial plants - Results from measurement programmes in
Germany. Atmospheric Environment 41(29): 6236–6254. 22. Hornik, K. 2014. R software, Retrieved on 2014, from
http://CRAN.Rproject.org/doc/FAQ/R-FAQ.html
23. Yahaya, N.Z. 2013. Spatial and temporal analysis of ultra- fine particles in urban environment. Ph.D. Thesis. Institute for
Transport Studies, University of Leeds, United Kingdom.
24. Norazian, M.N., M. Abdullah, C.Y. Tan, N.A. Ramli, A.S. Yahaya, N.F. Fitri, 2011. Modelling of PM10 concentration for
industrialized area in Malaysia: A case study in Shah Alam.
Physics Procedia. 22: 318-324. 25. Tahir, N.M., P. S. Chee, S. Hamzah, K.H. Wood, S. Abd.
Rahman, W.B. Siong, S. Elia, N.A.A. Salim,2008. Analysis of
PM10 in Kuala Terengganu by instrumental neutron activation analysis. Malay Journal of Analytical Sciences 12(1): 187-194.
26. Chen, R., C. Chu C, J. Tan J, J. Cao, W. Song,X. Xu, C. Jiang, C.
Yang, B. Chen, Y.Gui, and H.Kan, 2010.Ambient air pollution and hospital admission in Shanghai, China. Journal of Hazardous
Materials 181(1-3): 234-40.
27. Diapouli, E., A. Chaloulakou, N. Mihalopoulos, and N. Spyrellis, 2008. Indoor and outdoor PM mass and number concentrations at
schools in the Athens Area. Environment Monitoring and
Assessment 136(1-3): 13-20. 28. Massey, D., A. Kulshrestha, J. Masih, A. Taneja,2012. Seasonal
trends of PM10, PM5.0, PM2.5 and PM1.0 in indoor and outdoor
environments of residential homes located in North-Central India. Building and Environment 47(1): 223-231.
29. Shuhairi, J. 2012. Study on concentration 'particular matter (PM10)
and concentrations of toxic gases ambient air campus area UTHM, Johor. Technical report. UniversitiTun Hussein Onn
Malaysia.
30. Jaecker-Voirol, A.and P. Pelt, 2000. PM10 emission inventory in Ile de France for transport and industrial sources: PM10 re-
suspension, a key factor for air quality. Environmental Modelling
and Software 15(6-7): 575-581.
31. Mohamed,R.M.S.R., N. Nik MohdShahrul, A.A. Al-
Gheethi,AmriLajis, and H.K. Amir, 2015. Particulate Matter
Levels In Ambient Air Adjacent To Industrial Area. International Conference On Sustainable Environment & Water Research
(ICSEWR2015), 25-26 Oct. 2015, Johor Baru, Malaysia.
32. Leili, M., K. Naddafi, R. Nabizadeh, M. Yunesian, A. Mesdaghinia, 2008.The study of TSP and PM10 concentration and
their heavy metal content in central area of Tehran, Iran. Air
Quality, Atmosphere & Health (3):159-166. 33. Maraziotis, E., L.Sarotis, C. Marazioti, P. Marazioti,
2008.Statistical analysis of inhalable (PM10) and fine particles
(PM2.5) concentrations in urban region of Patras, Greece. Global NESTJ 10 (2): 123-131.
34. Šerbula, S.M., M.M. Antonijević,N.M. Milošević, S.M.
Milić, A.A. Ilić, 2010. Concentrations of particulate matter and arsenic in Bor (Serbia). Journal of Hazardous Materials 181 (1-3):
43–51.
35. Feng, Q., S. Wu,Y. Du,X. Li,F. Ling,H.Xue,S.Cai, 2011. Variations of PM10 concentrations in Wuhan, China.
Environment.Monitoring and. Assessment. 176(1-4): 259–271.
Persian Abstract DOI: 10.5829/ijee.2017.08.02.11
چکیده
ادییز یتکه اثرات نامطلوب بر سالمت انسان دارند، از اهم یسم یبه علت ارتباط با ذرات جامد و گازها یصنعت یمجاور نواح یهوا در مناطق مسکون یفیتک
یاون مالز ینحس نشگاهدا ی( در کالج مسکونCOو NO) یسم یهاو گاز 10PMهوا با توجه به غلظت یفیتک ی. لذا مطالعه حاضر با هدف بررسباشدیبرخوردار م
(UTHMکه در مجاورت کارخانه )1 یستگاهشده به عنوان ا یفتعر یستگاهاست. چهار ا یرفتهقرار دارد، انجام پذ یبرو تخته ف یکپردازش چوب، الکترون یها
(KKMا ،)2 یستگاه (KKPا ،)3 یستگاه (KKTDIو ا )4 یستگاه (KKTUب )10انتخاب شدند. غلظت یقتحق ینا یراPM با استفاده از ذرات جامدSampler-E
در یانتخاب یسم یگازها یعشد. توز یریگهمراه بود، اندازه یدر مالز یدغبار شد یده( که با پد2112 یا مت یهساعته در فصل خشک )فور 24دوره یک یبرا
یهوا یفیتبا استاندارد ک یسم یو سطوح گازها PM10. دش یینتع Dragger X-am 7000 (NO)و TSI IAQ (CO)با استفاده از UTHM یانخوابگاه دانشجو
Open-ها )و بسته Rافزار ها با استفاده از نرممحاسبه شد. داده Open Air R Packageافزار با استفاده از نرم 10PMمنابع یهشد و فرض یسه( مقاAAQS) یطمح
air, BRT, Akima10 ظتغل ترینیشقرار گرفتند. ب یلو تحل یه( مورد تجزPM ،µg/m3 114 درKKTDI و به دنبال آنµg/m3 58 درKKP ثبت شد. حداکثر
و µg/m3150 یب( به ترتAAQS) یطمح یهوا یفیتاز استاندارد ک یشب COو 10PMحال، غلظت هر دو ینگزارش شد. با ا KKP (ppm 8/1)در COغلظت
ppm 30 عبور غلظت ین،نبوده است. عالوه بر اNO درKKP (ppm 61/0) و درKKM (ppm 18/2) ازAAQS (ppm 17/0) ینشان دهنده احتمال وجود خطر برا
انباشت و یمیاقل ییراتث تغهمراه است که باع یبا سطح مصرف انرژ یمطور مستقهوا به یفیت. کباشدینامطلوب هوا م یفیتک یلبه دل UTHMدر یاندانشجو
.شودیم یاگلخانه یگازها
180