Embed Size (px)
Citation preview
w w
w .
i c
g g
r o
u p
. c
o m
June 2011
I R A N’ S ECO N O M Y O UT LO O K
A presentation prepared by I C G Group
November 2015

w w
w .
i c
g g
r o
u p
. c
o m
November 2015
A g e n d a Iran at a Glance Iran’s Economic Situation Economy (Recent
Status) Plans For the Future Business Prospects Conclusion & Forecast
w w
w .
i c
g g
r o
u p
. c
o m
November 2015
w w
w .
i c
g g
r o
u p
. c
o m
Iran at a Glance

w w
w .
i c
g g
r o
u p
. c
o m
November 2015
Iran at a Glance
Population 77,8 millions (Sept 2014)
Population growth 1.2% (2014)
Life expectancy 68.8 years for men; 71.9 years for women
Median age 27 years (65% of population under 30 years old)
Urban population rate 70%
Literacy rate 93% (for Iranians from 19 to 40 years)
Number of Iranian with a university degree 10.5 millions
Rate of women with a university degree 18,4%
Rate of men with a university degree 18,2%
President of the Islamic Republic Hassan Rohani since June 2013
National languagePersian – official language- (53%), Azeri Turkish and Turkish
dialects (18%), Kurdish (10%), Others (20%)
GDP/capita* US$ 4974 USD (2014/2015)
Currency1USD / 34,000 IRR in 2014/2015 (-10% compared to past
year)
Inflation 16% (2014/2015)
Source: CBI & SCI & Unesco
Turkey: 95%
Turkey: 8.5%
Turkey: 75 mil

w w
w .
i c
g g
r o
u p
. c
o m
November 2015
w w
w .
i c
g g
r o
u p
. c
o m
Iran’s
Economic Situation
w w
w .
i c
g g
r o
u p
. c
o m
November 2015
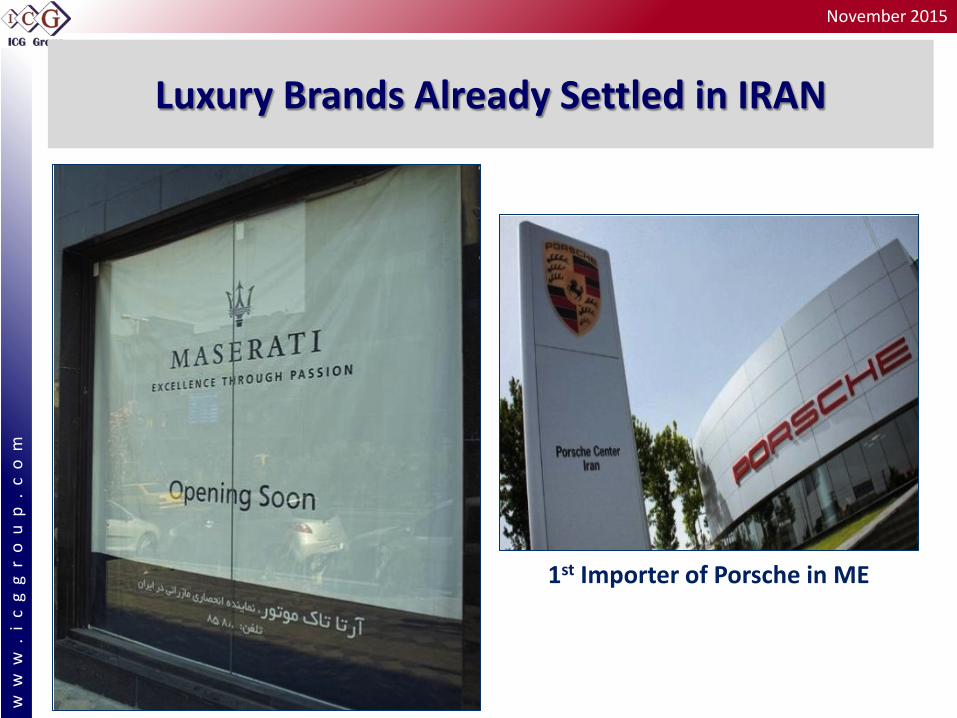
Luxury Brands Already Settled in IRAN
1st Importer of Porsche in ME

w w
w .
i c
g g
r o
u p
. c
o m
November 2015

w w
w .
i c
g g
r o
u p
. c
o m
November 2015
Main Indicators
Source: IMF –CBI- ICG
+ NDF (US$50
bln)
Population (Millions) 73.6 74.7 75.1 75.5 76 77.8Exchange rate (US$/IRR year average) - Managed Floating
10,000 10,000 17,000 22,000 30,000 34,000
360 430 367 304 313 382(3.6 trillion Rls) (4.3 trillion Rls) (6.1 trillion Rls) (6.7 trillion Rls) (9.4 trillion Rls) (13 trillion Rls)
GDP growth (%) 3% 6.5% 4.3% -6.8% -1.90% 3%Unemployment (%) 11.9% 12% 12.5% 13.2% 14.0% 15.0%Inflation (Year average, %) 10.8% 12.4% 21.5% 30.5% 34.7% 16.0%Exports of Goods and Services (US$ Bln)
$ 87.5 $ 107 $ 145 $ 97 $ 93 $ 85
Of which crude oil (excluding gas & condensate)
$ 64 $ 72 $ 90 $ 75 $ 45 $ 35
Imports of Goods & Services (US$ Bln)
$ 66 $ 65 $ 78 $ 66 $ 50 $ 52
Reserves (US$ Bln) $ 68 $ 75 $ 84 $ 80 $ 75 $ 120 In months of following year imports
10 11.5 12 15 12 24
External Debt (Percent of GDP) 21.5 (6.5%) 22 (6.7%) 20 (5.6%) 20 (6.6%) 20 (8.3%) 20 (5.1%)
March 2014-15 (est.)
Nominal GDP (US$ Bn)
March 2009-10 March 2010-11 March 2011-12 March 2012-13 March 2013-14
w w
w .
i c
g g
r o
u p
. c
o m
November 2015
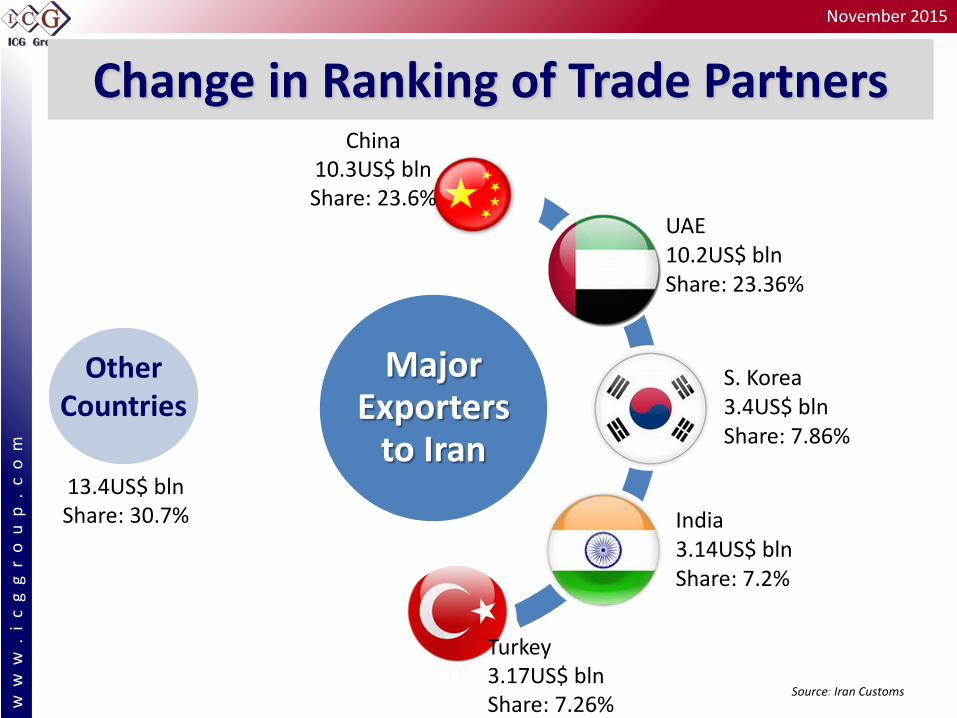
Change in Ranking of Trade Partners
Major Exporters
to Iran
UAE 10.2US$ bln Share: 23.36%
S. Korea 3.4US$ bln Share: 7.86%
India 3.14US$ bln Share: 7.2%
Turkey 3.17US$ bln Share: 7.26%
China 10.3US$ bln Share: 23.6%
13.4US$ bln Share: 30.7%
Source: Iran Customs
Other Countries

w w
w .
i c
g g
r o
u p
. c
o m
November 2015
GDP Share Comparison
Source: IMF –CBI- ICG
Banking, Trade, Real Estate, etc.
GDP Share average 2005-2010 (US$111 bln -US$430 bln)
GDP Share average 2011-2014 (US$359 bln-US$382 bln)
Oil; 17%
Agriculture; 9%
Industry; 23%
Services; 53%

w w
w .
i c
g g
r o
u p
. c
o m
November 2015
Industry: Major Sectors Share
Petchem and Pharmaceutical
26%
Basic metals 22%
Non metal minerals
13%
Auto 11%
Food & beverages
9%
Other 19%
2013-14
Source: Ministry of Industry

w w
w .
i c
g g
r o
u p
. c
o m
November 2015
w w
w .
i c
g g
r o
u p
. c
o m
Ministry of Industry’s Plan for
Non-Oil Economy

w w
w .
i c
g g
r o
u p
. c
o m
November 2015
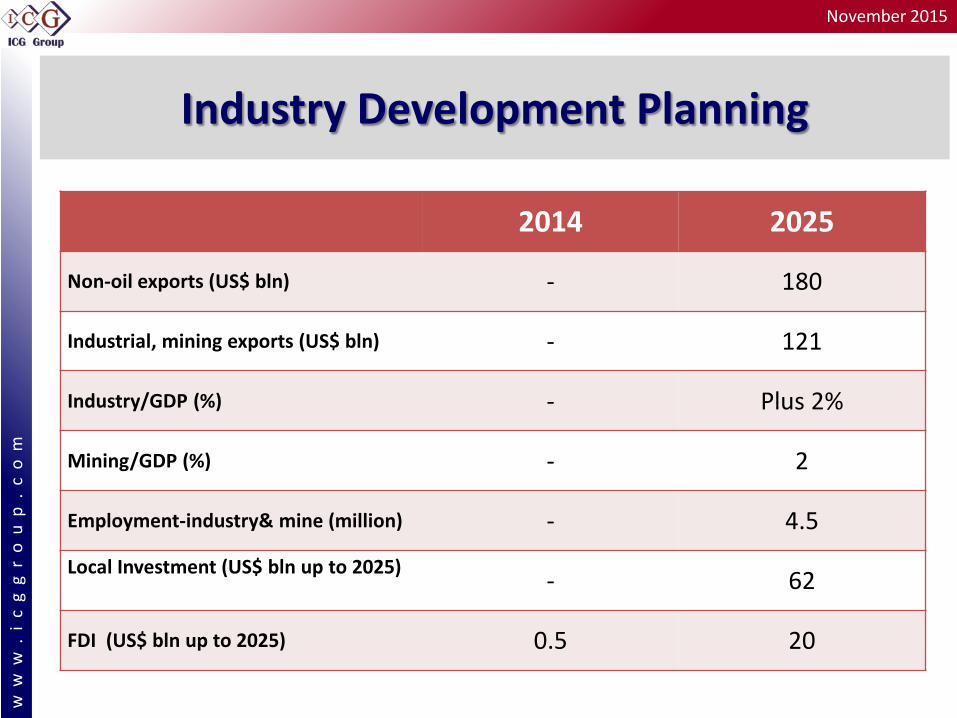
Industry Development Planning
Industries are prioritized based on capacity to achieve goals:
1. Oil products 2. Chemical/pharmaceutical
products 3. Non metal minerals 4. Auto industry 5. Mining (extraction) 6. Basic metals 7. Advanced technologies
Plan by govt. ending 2025
Relies on : Privatization Foreign investment Investment in
Export oriented products
w w
w .
i c
g g
r o
u p
. c
o m
November 2015
Industry Development Planning
2014 2025
Non-oil exports (US$ bln) - 180
Industrial, mining exports (US$ bln) - 121
Industry/GDP (%) - Plus 2%
Mining/GDP (%) - 2
Employment-industry& mine (million) - 4.5
Local Investment (US$ bln up to 2025) - 62
FDI (US$ bln up to 2025) 0.5 20

w w
w .
i c
g g
r o
u p
. c
o m
November 2015
Example of Selected Industries: Auto Industry
Targets 1st in region 5th in Asia 11th in world 3.2 M target prod.
Facts Output=2% of the world 2011-12: 13th with 1.6 million
cars produced (20th now after drop in output) 14% of industry sector value
added 3% of GDP 12% of employment

w w
w .
i c
g g
r o
u p
. c
o m
November 2015
Example of Selected Industries: Cement Targets 3rd in world output
capacity 1st in output capacity in
region 1st in World exports
Facts Output=1.7% of the
world 2014: 4th with 75
million tons produced (3rd in Asia, 1st in region) 2014 2025
Production capacity (million tons) 80 120 Exports (million tons) 18.9 32 Share in industry sector (%) 3.5 4

w w
w .
i c
g g
r o
u p
. c
o m
November 2015
Oil, Gas and Petrochemical Industry in the 2025 Horizon
1st producer of Petrochemical Products in the region (value)
2nd OPEC producer with the oil production capacity of 7% of the world demand
3rd world gas producer with the share of 8-10% of the world gas trade

w w
w .
i c
g g
r o
u p
. c
o m
November 2015
1. Oil Production Target (priority: Shared Fields)
Increase: Crude output 5 million/d by the end 6th Plan
(March 2016-March 2021)+1 million condensates/d
gas condensates output up to 1 million bpd (priority: South Pars)
Improve structure of oil contracts

w w
w .
i c
g g
r o
u p
. c
o m
November 2015
Increase gas production from South Pars & other shared fields to 1.2 Bcm/d by the end 6th Plan (March 2016-March 2021)
Export gas via pipelines;
Export LNG;
2. Gas Production and Gas Exports (Priority: Shared Fields)

w w
w .
i c
g g
r o
u p
. c
o m
November 2015
Refineries Production (actual)
Name of Refineries Intake (bpd) Abadan 410,000 Arak 251,000 Isfahan 361,000 Bandar Abbas 327,000 Tabriz 110,000 Tehran 210,000 Shiraz 59,000 Kermanshah 21,000 Lavan 65,000 Total 1.814 million

w w
w .
i c
g g
r o
u p
. c
o m
November 2015
3. New Refinery + Optimization Plans Actual refining capacity : 1.8 MB New refinery: Persian Gulf Star Gas Condensate Refinery:
350,000 bpd>>to produce 36 million liters a day of Euro-4 gasoline.
Starting 8 mini gas condensate refineries (Siraf Project)– Total capacity 480,000 barrels
Optimization Plans in Refineries
Euro-4 Gasoline Production Capacity (Million Liters a Day) Date of Commissioning
Isfahan 7 Soon Lavan <1 Year-End (March 2016) Bandar Abbas 4 Under Construction 1st Phase of Persian Gulf Star 5 to 12 91% Complete – Launch by Year-End
(March 2016) Total 24 ---
Optimization Plans in Refineries
Euro-4 Diesel Production Capacity (Million Liters a Day) Date of Commissioning
Lavan 3 Year-End (March 2016) Bandar Abbas 9 Year-End (March 2016)
Total 12 ---

w w
w .
i c
g g
r o
u p
. c
o m
November 2015
4. Number of Projects in the Major Petrochemical Zones
Location No. of Projects Capacity (million Tons/Y)Mahshar Special Economy Zone 8 1.4Assaluyeh Special Ecoomh Zone 26 35.7Other Regions 33 23.9
61
Iran's Petrochemical Projects (Planned / under construction)
Total

w w
w .
i c
g g
r o
u p
. c
o m
November 2015
Required Investment in Iran’s Oil & Gas Industry 2016-2025
Billion $
Upstream 176$ Downstream 77$ TOTAL 253$

w w
w .
i c
g g
r o
u p
. c
o m
November 2015
Petrochemicals 60 ongoing projects US$20 bln/y value: Plans to double US$74 bln investment needed 8-10 years ~uS$10 bln/y exports
Food industry Climate + Population + Industrial infrastructure This sector employs around 30% of workforce
Construction Mass housing projects, roads, hotels;
Business Prospects

w w
w .
i c
g g
r o
u p
. c
o m
November 2015
Telecommunication Mobile (infrastructure + handsets)
Auto: doubling production: 1.5 Mln>>3 mln Transportation US$25 bln projects Air, rail & road
Power Production: Top of the region. 14th worldwide 5% of the production is exported to neighbors 7%/y consumption growth
Business Prospects

w w
w .
i c
g g
r o
u p
. c
o m
November 2015
Business Prospects: After Sanctions
Good investment law in place (foreigners have 100% shares of Hyperstar and nearly 100% for Nestle factory in Iran ), Novo Nordisk building a 70 million euro ($78 million) Insulin facility , Danon factory
78 m people with proper purchasing power , Educated Iranian experts Acceleration in awarding projects Huge financing and new technologies will be required after many years of
mismanagement and sanctions New hotels , new power plants , oil and gas development projects, roads,
trains etc will be needed during first years New opportunities will come during the first years

w w
w .
i c
g g
r o
u p
. c
o m
November 2015
Strength Large population Reasonable purchasing power Strategic geopolitics Availability of skilled
workforce/educated people Good Infrastructure FIPPA
Weakness Still Too much dependence on Oil Dual exchange rate Complex Bureaucracy Privatization still at its early stages Non-alignment of short term
policies with government targets Weak management skills
Threats Renewal of Sanctions Low oil prices share of oil in budget 30% for 2015-16 was 35% in 2014-15 eventually more than 50% after financing
deficits
Late Payments
Opportunities 10 years of no-investment in the
projects Need for new technologies Few hundred billion Usd projects
introduced Diversification of projects (Energy,
Petchem, Food, Mines, Auto, Construction, Telecomm, etc.)

w w
w .
i c
g g
r o
u p
. c
o m
November 2015
w w
w .
i c
g g
r o
u p
. c
o m
Conclusions

w w
w .
i c
g g
r o
u p
. c
o m
November 2015
Iranian Economy has a good potential and can be improved Bases of economy are very solid (industry,
manufacturing capabilities, banking, service sector, educated population, etc.)
Foreign investment plays a major role In any case structural reforms are needed
(diversification, privatization, etc.)

w w
w .
i c
g g
r o
u p
. c
o m
November 2015
Recommendations
Long term presence Choose your partner wisely Transfer of technology After sales services FDI Re-export of a portion of the production


![Prevalence and Associated Factors of Violence against Hospital … · 2019. 11. 4. · lence against nurses were 7.8% and 71.9% reported nonphys-ical violent [11]. A systematic review](https://img.pdfslide.us/doc/110x75/60e0a583abc7020d4b2e7740/prevalence-and-associated-factors-of-violence-against-hospital-2019-11-4-lence.jpg)


![fSOLATION DETERMINATION PENTANE A ......71.9 C.)anditsisomer,ethylcyclobutane, /CH\2 H2CCH •C2H5 \/ CH, licks-Bruun'] iruun J MethylcyclopentaneinPetroleum 803 s SI 1 I* I 6000 7000](https://img.pdfslide.us/doc/110x75/608f4bf4726d5f275e1f3fad/fsolation-determination-pentane-a-719-canditsisomerethylcyclobutane.jpg)