Embed Size (px)
Citation preview

Using Advanced Tools, Techniques, and Methodologies
IR ApplicationsVolume 28, September 24, 2010
©Copyright 2010, Association for Institutional Research
Supporting quality data and decisions for higher education.
AbstractQuality measurement is essential in every form of research,
including institutional research and assessment. This paper addresses the erroneous assumptions institutional researchers often make with regard to survey research and provides an alternative method to producing more valid and reliable measures. Rasch measurement models are discussed and a demonstration is provided, thus highlighting the utility of the Rasch models in higher education research and practice.
Making Meaningful Measurement in Survey Research: A Demonstration of the Utility of the Rasch Model
Perhaps the greatest limitation of higher education research today pertains to quality measurement. In 1959, S. S. Stevens provided the widely cited definition of measurement in the social sciences. That is, “measurement is the assignment of numerals to events or objects according to rule” (p. 25). Unfortunately, many who read this work ignored his latter statement in the same text:
When operations are available to determine only rank order, it is of questionable propriety to compute means and standard deviations... If we want to interpret the result of averaging a set of data as an arithmetic mean in the usual sense, we need to begin with more than an ordinal assignment of numerals. (p. 29)
Distinguishing the difference between ordinal and interval scales is essential to quality measurement in the social sciences, especially survey research. Most survey researchers typically incorporate some form of an ordinal scale to coincide with the measurement of survey items. Then, the data are treated as if they
Kenneth D. Royal, Ph.D.American Board of Family MedicinePsychometrician/University of Kentucky Adjunct Professor 1648 McGrathiana Pkwy, Ste. 550Lexington, KY [email protected]
Making Meaningful Measurement in Survey Research: A Demonstration of the Utility of the Rasch Model
Page 2 IR Applications, Number 28, Making Meaningful Measurement in Survey Research
were interval, and linear statistical techniques are applied. Unfortunately, most survey researchers fail to realize most rating scales simply distinguish rank among response options. That is, one response option indicates more or less of something than the other options. These scales are not interval measures and should not be treated as such.
Consider the following example of survey items provided by Bond and Fox (2001). A sample of grade school children was asked two questions:1) I am afraid that I will make mistakes when I use
my computer.2) I am so afraid of computers I avoid using them.
A rating scale containing the following response options are provided: Strongly Disagree, Disagree, Neutral, Agree, and Strongly Agree. In theory, we expect our rating scale to look something like this:
Less Anxious More Anxious1) Mistake SD D N A SA2) Avoid using SD D N A SA
But, in reality, it may look something more like this:
Less Anxious More Anxious1) Mistake SD D N A SA2) Avoid using SD D N A SA
Under the classical approach, our problems only multiply when we add values (or scores) to these data. Hypothetical results might provide a mean of 4.0 with a standard deviation of .8 for question #1, and a mean of 2.0 with a standard deviation of .8 for question #2. What can one truly say about these items given simply a mean and standard deviation for each? Can one really make any meaningful inferences about individual respondents or their responses relative to other respondents? Typically, when interpreting the results, one would compare the two items and say that people generally agreed with the former statement more than the latter. One would then look at the mean scores and standard deviations and try to get a sense of the average level of agreement/disagreement indicated by these scores. Further clouding this picture, one would try to imagine how standard deviations affect all this. Of course, this excludes any discussion
about sampling strategy, whether the sample data are representative of the population, and other methodological concerns. What is learned is that adding another item suddenly imposes additional problems for one’s interpretation of results.
In the scenario given above, yet another erroneous assumption is made. This time, it is a failure to realize that all survey items are not equally important. Given the example provided, the second item clearly demonstrates a greater fear of computers. Suppose students generally disagreed (rating = 2.0) with the statement “I am so afraid of computers that I avoid using them,” yet also generally disagreed (rating = 2.0) with the statement “I am afraid that I will make mistakes when I use my computer.” Since these items seem to have different locations on a scale related to a student’s anxiousness about computers, does it really make any sense to score both of these items as 2.0 and treat them as though they represented the same attitude?
In the fields of assessment and institutional research, these mistakes are made all too often. Most institutional researchers and assessment professionals are unaware that the conventional techniques to analyze data fall under a methodological approach called “classical test theory” (CTT). Although CTT has its purposes, it often masks a great deal of important information. Since the 1950s, the psychometrics literature has increasingly advanced in its sophistication of methodological techniques to handle various types of data. The more recent development is an approach called item response theory (IRT), or “modern test theory.” Although IRT techniques have been around for over 50 years, this important research has not trickled down into mainstream higher education literature largely due to higher education graduate programs’ lack of measurement training (Hutchinson & Lovell, 2004) and their lack of familiarity with and use of complex measurement software (Royal & Bradley, 2008). The following section will provide an overview of CTT and IRT and will make an argument for using IRT techniques, particularly the Rasch measurement model (Rasch, 1960), when attempting to make meaningful measures.

Page 3 IR Applications, Number 28, Making Meaningful Measurement in Survey Research
Classical Test Theory Versus Item Response Theory
Charles Spearman is largely considered the father of classical test theory, as he introduced the techniques in 1904. CTT is based on the linear relationship X = T + E, where the observed score (X) is equal to the true score (T) plus random error (E). Popular statistical techniques such as Pearson’s correlation and Cronbach’s alpha are products of this form of statistical modeling. Although CTT is great for providing overall, descriptive summaries of data, it is inadequate for truly objective measurement. Measurement pioneers like Bogardus with the Social Distance Scale (Bogardus, 1926) and L. L. Thurstone with the Thurstone Scale (Thurstone, 1928) certainly provided an excellent foundation for measurement in the social sciences. However, it was not until the work of Thurstone was expanded nearly 30 years after its inception that measurement theorists were able to produce measurement models that met the rigorous requirements comparable to those found in the physical sciences. More discussion about the history of IRT will be provided later in this text.
To provide an example that distinguishes the differences between CTT and IRT, consider the following popular example from the testing world: Two students are given the same test. The test items are arranged in hierarchical order with the least difficult item listed first and the most difficult item listed last.
Here, 1s indicate a correct answer, 0s indicate an incorrect answer. Notice, both students answered five items correctly. However, Ken got the five easiest items correct and missed the five most difficult items. Conversely, Tom missed the five easiest items, yet got the five most difficult items correct. Under the CTT approach, both Ken and Tom would receive credit for getting 5 of 10 items correct and both would be given a score of 50% for the exam. That is, both Ken and Tom would be considered to have equal ability as measured by the exam. Although Ken and Tom received the
same grade, their abilities are not really equal. A number of things could have caused Tom to miss the first five questions. Perhaps Tom arrived late, perhaps his test booklet did not contain the first five items, or perhaps these were word problems, and Tom is a foreign student for whom English is a second language? What is clear is that there is more to the story. Item response theory (IRT) can help investigate the characteristics of each item, as well as patterns of person responses to each item. The IRT perspective is far more informative than that of traditional statistical analyses.
Overview of Item Response Theory
As mentioned previously, the concept of IRT has been around since the 1920s, but it was not until the 1950s and 1960s that IRT grew as a theory. The two most notable IRT pioneers from this time were Frederic Lord, a psychometrician at Education Testing Services (ETS), and a Danish mathematician named Georg Rasch. Although the two were attempting to solve many of the same issues in the assessment arena, their approaches differed significantly. In fact, the differences were so profound that IRT was divided into two very distinct avenues. The primary difference between Lord’s approach and Rasch’s approach pertained to how the relationship between data and theory were conceptualized. Lord contended that measurement models must fit the data. Rasch’s approach contended data must conform to the measurement model. It should be noted that these philosophical differences are still the subject of much debate today, although today’s psychometricians tend to be more accepting of others’ viewpoints. Nonetheless, clear battle lines have historically existed between Rasch advocates and those who advocate the 2-parameter logistic (2PL) and 3-parameter logistic (3PL) approaches. In fact, in 1992, Ben Wright and Ron Hambleton had a very heated debate at the American Educational Research Association (AERA) annual conference before an audience of several hundred members that left a long-lasting impression on the tensions between these two camps (Wright, 1992).
Another defining difference between Rasch models and other IRT models pertains to each
Easy Hard
Ken 1111100000
Tom 0000011111

Page 4 IR Applications, Number 28, Making Meaningful Measurement in Survey Research
approach’s perspective on parameterization. Person parameters might represent factors such as a person’s ability or the strength of one’s attitude. Item parameters might include factors such as difficulty, discrimination, and guessing. From the Rasch perspective, factors such as discrimination and guessing violate the strict theoretical underpinnings of the model, as a requirement for objective measurement is to measure only one construct at a time. That is to say that Rasch models do not encompass two and three parameters. Other IRT models, on the other hand, are concerned with producing models designed to fit the data. There is an IRT model that is 1-parameter and is virtually identical to the Rasch model. It is considered a special case of the 2PL model and is often referred to as the 1PL model (Birnbaum, 1968; Lord & Novick, 1968). However, this model is used to statistically model data and is accordingly associated with the Lord tradition of IRT. For further information about how these models differ see Linacre (2005).
Today, the Rasch model is the most popular and widely used IRT technique. This is due largely to the Rasch model’s concern with only one parameter (such as ability on a test, or in the case of a survey, the strength of one’s attitude), as two and three parameters (which control for factors such as discrimination and guessing) often do not apply. Further, 2PL and 3PL approaches are very complex, require significantly larger sample sizes than the 1PL Rasch model, and 2PL and 3PL models require a great deal of technical expertise to perform the analyses. It is, in part, for these reasons that this paper will focus on the application of the Rasch model. However, should one wish to learn more about all IRT models, Embretson and Reise (2000) provide an excellent overview.
Differences Between CTT and Rasch Measurement
With regard to the specifics of CTT and Rasch approaches, it is important to point out many of the fundamental and philosophical differences. Perhaps one of the most significant differences involves the treatment of error. CTT techniques produce a standard error of measurement that spans the entire spectrum of person abilities (Becker, 2001). That is, under the CTT approach, all persons
would fall along a homoscedastic line, essentially suggesting that every individual in the dataset has the exact same amount of error associated with his or her measures. Rasch measurement, on the other hand, produces a standard error for each person and item. Having standard error estimates for each person is incredibly useful for creating confidence bands to inform the researcher to what extent each person or item measure is stable, and perhaps useful (or not). Under Rasch techniques, persons with extreme scores will typically possess larger standard errors than those located in the middle of the range, as one might intuitively expect.
Another very important distinction between CTT and Rasch models pertains to test independence. As demonstrated in the testing example above, under CTT models, person ability is dependent upon the test. That is to say, persons will score higher on easier tests and score lower on harder tests. Under Rasch analysis, person ability is considered invariant, meaning an objective estimate of a person’s ability can be obtained regardless of the difficulty of the items. It is this principle that is largely the reason why many involved in the high-stakes testing arena have moved away from CTT and gravitated toward IRT techniques.
Other important distinctions include the treatment of missing data. For CTT models, missing data are problematic (Montiel-Overall, 2006; Moulton, 2009; Peugh & Enders, 2004). This is important to mention because traditional statistical analyses often use various data imputation techniques to handle missing data, such as computing expected averages and other proxy measures in the place of missing data, thus literally creating data to fill in the gaps where actual data are missing (Allison, 2001; Graham, 2009; Rubin, 1996). For Rasch models, missing data are not a problem, as measurement becomes imprecise at only certain places (Fisher, 1995; Ludlow & O’Leary, 1999). With Rasch models, measurement error is at its highest at the extreme ends of the continuum and becomes increasingly smaller as it advances toward the middle of the scale. Therefore, unless one has a sample full of extreme responses or a truly

Page 5 IR Applications, Number 28, Making Meaningful Measurement in Survey Research
excessive amount of data are missing, measurement precision is not a problem for Rasch models. There are other significant distinctions between CTT and Rasch: CTT approaches are sample dependent, require normally distributed data and large samples, and necessitate representative data (Bond & Fox, 2001; Bunderson, 2000; Hambleton, Swaminathan, & Rogers, 1991). Rasch models do not share these problems, as the goal is not to construct models to describe the data, but rather to fit the data to a measurement model.
Defining Objective Measurement
Although there are numerous IRT models, the Rasch model is the only model that is considered objective measurement. The Rasch model only takes into account item difficulty, whereas 2PL and 3PL models control for the ability of the item to differentiate individuals based on their knowledge or opinion and to adjust the estimated probability for the likelihood of guessing a correct response. Some consider 2PL and 3PL models to be superior IRT models because they can account for additional parameters, especially if multidimensionality is a problem. Rasch proponents argue that this is an instance where more does not necessarily mean better, as 2PL and 3PL models estimate item parameters that mask the variation that would otherwise be identified as problematic. With that said, there are additional Rasch models that maintain the structure and philosophy of the dichotomous Rasch model, but are considered extensions of the model to accommodate different purposes. For instance, the dichotomous Rasch model (1), models the probability of right/wrong responses or the probability of agreement/disagreement. Particularly useful for survey research that utilizes a common rating scale, or tests that all use the same number of ordered response options per question, is the Rating Scale model (2) developed by David Andrich (1978). Similarly, should one administer a survey that utilizes a rating scale that varies from item to item (for example, item #1 has a 5-point rating scale, whereas item #2 has a 4-point rating scale) then the Partial Credit model (3) would be more appropriate (Rasch, 1960;
Wright, 1999). These models are presented below with their formulae:
1) The (1PL) Rasch model for dichotomously scored items (Wright & Stone, 1979):
ln (Pni1/Pni0) = Bn – Di
2) The Rating Scale model for surveys with the same number of response options (Andrich, 1978):
ln (Pnij/Pni (j–1)) = Bn – Di – Fj 3) The Partial Credit model for surveys with
response scales that vary from item to item (Masters, 1982).
ln (Pnij/Pni (j–1)) = Bn – Di – Fij = Bn – Dij
where,Pnij is the probability that person n encountering item i is observed in category j,Bn is the “ability” measure of person n, Di is the “difficulty” measure of item i, the point where the highest and lowest categories of the item are equally probable.Fj is the “calibration” measure of category j relative to category j-1, the point where categories j-1 and j are equally probable relative to the measure of the item. No constraints are placed on the possible values of Fj.
Typically, resistance to the Rasch model is met with criticisms of unidimensionality. That is, the notion that only one thing is measured at a time. For some critics, the notion of measuring a unidimensional construct seems too simplistic. These critics are usually unaware that unidimensionality is a requirement of objective measurement. As Mike Linacre argues:
Physical measurement takes great pains to measure one thing at a time. We don’t want the patient’s temperature reading to be biased by his weight, or height, or blood pressure. It is only when we have clearly isolated one dimension that we can understand the meaning of the measure, and then study how that measure relates to measures on other dimensions. (Linacre, 1996, p. 513)

Page 6 IR Applications, Number 28, Making Meaningful Measurement in Survey Research
Additionally, other critics of objective measurement often claim that interval scaling is not always necessary. This perspective has been coined “the rubber ruler” by measurement scholars. Think of a physical ruler. Would it be of any use if the measures separating each inch varied in distance? Would the ruler be useful if it changed each time we wanted to make a measure? In the world of mental constructs and psychometrics, do we want to create rulers that are based on normative groups, rulers that bend each time the sample changes? People concerned with objective measurement will argue “no.”
Perhaps the greatest limitation of the Rasch model is in its use. Contrary to how some researchers use it, the Rasch model is not a causal model, and it is advised that researchers do not use it for this purpose. The Rasch model is a relational model and is excellent at identifying relationships, but as introductory statistics teaches us, association does not imply causation.
Identifying Factors Within Surveys
Currently, there is a widespread practice of using factor analysis and structural equation modeling on survey data. Although factor analysis is useful for reducing data in an exploratory manner, it is bound by the characteristics of the sample and requires larger sample sizes (Kline, 1994). Rasch measurement, on the other hand, is not a sample-dependent technique. Several studies have investigated the use of factor analysis compared to Rasch modeling. Chang (1996) found both Rasch and factor analysis resulted in similar results, but Rasch results were more informative, more stable, and easier to interpret. The author found factor analysis is good for identifying proximity to the underlying variable, but not so good at identifying location in a vector space of other variables. Rasch analysis, on the other hand, provided locations for both persons and items on the variable. This is especially helpful in developing a construct theory. Smith (1996) suggests when the goal is exploratory in nature, use factor analyses first if the data equally consist of uncorrelated factors. However, if one factor emerges as dominant, use Rasch. If one begins by factor analyzing the data, it is a good idea to separate the items and analyze them further
via Rasch analysis. Green (1996) found both factor analysis and Rasch can produce factor structures, but humorously stated “But isn’t that the fun of factor analysis? If each of us uses a different variance partitioning, rotation and obliqueness, then each of us can produce a different factor structure—our own personal existential ‘truth’!” (Green, 1996, p. 57). She went on to stress the importance of building from the known into the unknown in theory development to avoid such issues. Ben Wright (1994) argued a better approach for identifying factors is the use of a Rasch-based principal components analysis (PCA), as it is designed to measure the construct of interest. He went on to say if a factor cannot be established or confirmed through Rasch analysis then its existence is doubtful.
Structural Equation Modeling (SEM) is generally considered a positive step forward for statistical theory (Ludlow, 2002). SEM allows researchers to specify which variables they want to investigate (usually based on some theoretical reason), as well as specify the relationships between the variables along with associated error components. The data are then analyzed to determine the extent to which they fit a given structure. An investigation of residuals can be extremely useful in identifying areas of the theory that need to be improved, modified, or removed. In some ways, Rasch modeling can be considered a form of SEM. They share a similar philosophy in that data should fit the model, as opposed to generating models that describe data. This is certainly a step in the right direction with regard to making meaningful measurement.
The Concept of Model and Data Fit
As mentioned previously, a major concern about using Rasch modeling is its need for unidimensionality. Some believe most surveys contain multidimensional constructs and question how the Rasch model can tease these apart. To begin, Rasch models require data to fit the model. An investigation of fit statistics largely determines whether the data are unidimensional in nature. Both infit and outfit statistics are evaluated to determine how data-to-model fit occurs for each item and person. Infit statistics are fit statistics that

Page 7 IR Applications, Number 28, Making Meaningful Measurement in Survey Research
are sensitive to the inlier pattern of observations. Outfit statistics are sensitive to outlier observations. To illustrate the concept, consider the “idealized” Guttman scale (Guttman, 1944) presented in Figure 1.
Figure 1. Idealized Guttman scale.
If the data were to appear something like this,
we would expect larger infit statistics because the 1s occurring in the middle-right section of the continuum, and the 0s appearing in the middle-left section of the continuum are unexpected. Conversely, if the data were to appear something like this,
we would expect outfit statistics to be larger because observations at the extreme ends of the continuum are unexpected. In survey research, infit and outfit statistics are incredibly useful for identifying problematic items or persons who appear to have “flat-lined” by randomly marking items or simply marking all items with a particular rating. Investigating fit statistics is an excellent quality control element as evidence of data adequately fitting the model is a key indicator of validity. Therefore, it is advised each time a Rasch analysis is performed. Further, removing extreme person and item data that grossly misfit the model’s expectations is perfectly acceptable, as removing misfitting persons and items improves the precision of the measures produced.
Additionally, suppose the data fit the model quite well. It is possible that multidimensionality is still present within the data. A Principal Components Analysis (PCA) can detect multidimensionality by explaining the variance associated with both persons and items. Keyform mapping is another technique with great utility. The author will provide a keyform map and provide a demonstration of its utility later in this text.
Demonstration of the Rasch Model’s Person and Item Maps
To exhibit the power and utility of Rasch measurement, a demonstration of one of its powerful techniques, particularly the use of person and item maps, will be provided in this section. These maps are extremely valuable as they illustrate the construct hierarchy that is being measured by an assessment. These maps are useful for exposing the empirical hierarchy of the dataset, which lends to testing and evaluating existing theories, or possibly generating new theories. It should be noted that under CTT models and traditional statistical software packages, this technique cannot be performed.
With a basic understanding of the components appearing on the map, person and item maps can be incredibly easy to interpret. These maps have the ability to place both persons and items on the same scale, demonstrating how individuals and groups of persons interact with each of the items. This is paramount for making truly meaningful comparisons of results. Figure 2 presents an item map produced from a previously published article by Bradley, Royal, Cunningham, Weber, and Eli (2008). The survey instrument sought to solicit graduate students’ and university faculty’s perceptions of what constitutes “good” education research. Respondents were asked to rate their agreement with a series of items making up three primary constructs: methods, theory, and ethics. Because the items were rather lengthy, they were coded simply by construct. For example, M1, M2, M3, etc., referred to items pertaining to methodological issues. Items E1, E2, E3… and T1, T2, T3, etc., referred to items pertaining to ethical and theoretical issues, respectively. For the purposes
Easiest Items
Least Able Person
Most Able Person
1 2 3 4 5 6
1 0 0 0 0 0
1 1 0 0 0 0
1 1 1 0 0 0
1 1 1 1 0 0
1 1 1 1 1 0
1
2
3
4
5
Hardest Items
1 1 1 0 0 1 1 0 0 0
0 0 1 1 1 0 0 0 1 1

Page 8 IR Applications, Number 28, Making Meaningful Measurement in Survey Research
of this demonstration, only a few select items are highlighted to illustrate the interpretation of the map. This method is intended to allow readers of
this manuscript to envision their data in the map, as opposed to focusing too much on the survey content provided.
Figure 2. Map of survey items by difficulty to endorse (logits).
<more> <difficult to endorse>
<less> <difficult to endorse>
EACH ' # ' IS 2.
4
3
2
1
0
-1
-2
-3
M12 M15
M13 M14
M2T8T6M10 M17 M5T4 T5E9 T11 T12 T7E8
E4 E7 M3 T3M16 T1 T10 T9E5 M1 T2E6 M11E10E2 M7 M8M4 M9
M6E1E3
T
S T
M
S
S
T M
S
T
.##
#.##.##
#######
.##############
.#######.######
########.#######
.#####
##.
.

Page 9 IR Applications, Number 28, Making Meaningful Measurement in Survey Research
Understanding the Map
First, it is helpful to understand the layout and design of the map. The numbered, vertical column on the left indicates logit measures. Before proceeding further it is important to briefly provide some background to explain logit measures. Logits are the measures produced from raw scores when computed via the Rasch model. That is, the ordinal data that would appear as raw scores in a survey (i.e., ratings of 1, 2, 3, and 4) are converted to their natural logarithm, thus producing a measure that has interval properties. As mentioned previously, this conversion to truly interval data is at the heart of quality measurement and is one of the key distinctions of sound measurement. Once the raw score to logit conversion is complete, results are then interpretable. So, the numerical column on the left ranging from 4 to -3 indicates a ruler of logit scores. It should be noted that Rasch analysis produces logits for both persons and items, estimates which contain four decimal places and are quite exact. Person and item maps simply serve as a visualization of these findings. Therefore, precise logit measures would need to be found in other forms of Rasch output.
Second, notice the map is delineated into two halves. The left side of the map contains person measures, and the right side contains item measures. Also, note that both person and item measures are placed along the same ruler, thus making it useful for easy and meaningful interpretation. Next, let us consider the marker line running vertically in the middle of the map. This line separates the two halves of the map. Notice, both sides of the map contain the symbols M, S, and T. These markers denote the mean (M), one standard deviation (S), and two standard deviations (T) for both persons and items. In this particular example, we can see that the person mean falls around 1.8 logits, and the item mean falls at 0 logits. We can also see that two of the items, M12 and M15, fall at approximately 3 logits, and both items are beyond two standard deviations from the item mean.
The final step in interpreting the item map is understanding the hierarchy produced. It is possible to produce the hierarchy in various ascending and
descending order with regard to person and item distributions. However, for this demonstration, the default hierarchy generated from these maps will be illustrated. In this example, persons at the top of the map indicate they found it easier to endorse (or agree with) items than persons situated below them on the map. Essentially, persons at the top had the least difficulty endorsing items, while persons at the very bottom had the most difficulty endorsing items. Items can be interpreted in a similar manner. Items at the very top of the map were the most difficult to endorse, whereas items at the bottom of the map were the easiest to endorse.
Interpreting the Map
To provide some context to the example provided and to aid in the interpretation of results, survey items will be provided in full for items at the extreme ends of the item map. That is, item M12 refers to the statement “High-quality research requires random sampling,” and M15 refers to the statement “High-quality research can be determined solely by examining the research methodology.” Additionally, item E1 refers to the statement “High-quality research abides by ethical standards,” and item E3 refers to the statement “High-quality research should protect the safety and welfare of participants.”
Based on the map, items M12 and M15 fell at the top, which indicates they were the two most difficult items to endorse. If one imagines a horizontal line spanning across the entire map from this row of items, one could see the proportion of persons who found these two items easy to endorse as well as the proportion of persons who found these items difficult to endorse. Here, persons who fell in the range of 3 to 4 logits easily endorse these items. The vast majority of persons fell 3 logits and below, suggesting respondents had a more difficult time endorsing these items. Depending on how far the person measures are away from 3 logits essentially answers the question of how difficult it was for each of the various respondents to endorse these items. The farther down the map the persons fell, the more difficulty they would have endorsing the two items at the top.

Page 10 IR Applications, Number 28, Making Meaningful Measurement in Survey Research
Also, notice the items at the bottom of the map, in particular, items E3 and E1. Following the same procedure as before, if one were to draw a line across these items through the person side of the map one would not find any persons at or below the measure. In fact, one would have to go up to approximately -0.3 logits on the scale before the lower end of the person measures appeared. This means that items that fell at or below approximately -0.3 logits were rather easy for respondents to endorse.
To add a quality control element to this example, consider investigating the abbreviated items in the map. Items M12 and M15 read “High-quality research requires random sampling,” and “High-quality research can be determined solely by examining the research methodology.” It makes sense that these items would be the most difficult to endorse, as these perspectives are likely to represent a minority perspective among faculty and graduate students who conduct research on educational issues. Items E1 and E3 read “High-quality research abides by ethical standards,” and “High-quality research should protect the safety and welfare of participants.” Because one would expect this sample frame to generally agree with these statements, it is safe to assume the empirical hierarchy is ascending/descending in the direction consistent with this interpretation, thus providing evidence of construct validity.
To make the map more user-friendly and interpretable, one can convert the logits to a scale that is more meaningful. For instance, if one wanted to create a scale that ranged from 0–100, one could use the “scaling calculator” function to do so. Essentially, the idea would be to take the lowest logit value and convert it to 0, while taking the highest logit value and converting it to 100. Using this function converts the scale while maintaining all its interval properties, thus making it potentially easier to read.
If one wanted to take the analysis of the map even further, one can actually calculate the distance between persons and items to calculate a probability that one is likely to endorse a particular item. It should be noted that although this is
possible, it can be rather tricky. In fact, it is a rather tedious and time-consuming endeavour and is probably unadvised unless one is working with very few people and items or has a strong reason for actually wanting to know this information. However, should one choose to do this, the following will need to be done. First, identify the person and item measures for which you are interested in learning the probability that someone is likely to endorse the item. For example, say a survey respondent has a logit value of 1.5, and you are interested in the probability of someone endorsing an item that has a difficulty estimate of 0.3. Simply subtract the difference between the person and item: 1.5 – 0.3 = 1.2. Then, open an Excel spreadsheet and enter the formula:
=EXP(1.2)/(1+EXP(1.2))
This will produce a value of 0.768524783, or a probably of 77% that this person would endorse this particular item.
Keyform Mapping
Keyform maps arrange constructs and visually display how items hold with (and in comparison to) one another (see Figure 3). Keyform maps ask the question “what is the average rating that we expect to observe for persons of a particular measure?” Using the same dataset from Bradley et al. (2008), data are mapped to keyform. Here, the column on the right indicates the items appearing on the survey. The 1s, 2s, 3s, and 4s appearing within the map indicate survey respondents’ responses to each item. To interpret this map, one would essentially draw a vertical line in a column and make comparisons. For example, for item M15, the average response to this item was 2 (Disagree). However, going straight down the map we see items T6, M10, and M17 (among others) possess a 3 (indicating Agree). Going even further down the map, items E10, M7, and E2 (among others) have ratings of 4 (Strongly Agree). This tells us that respondents who typically disagreed with item M15, happened to agree with items T6, M10, and M17, and strongly agreed with items E10, M7, and E2. To provide some qualitative context, let us consider the content of the item with which most

Page 11 IR Applications, Number 28, Making Meaningful Measurement in Survey Research
EXPECTED SCORE: MEAN (Rasch-score-point threshold, " :" indicates Rasch-half-point threshold)(ILLUSTRATED BY AN OBSERVED CATEGORY)
NUM ITEM
NUM ITEM
1 PARTS21211 1
12851209260582221T S M S T
–6 –4 –2 0 2 4 6 8
–6 –4 –2 0 2 4 6 8
111111111111111111111111111111111111111
1 : 2 : 3 : 41 : 2 : 3 : 4
1 : 2 : 3 : 41 : 2 : 3 : 4
1 : 2 : 3 : 41 : 2 : 3 : 41 : 2 : 3 : 4
1 : 2 : 3 : 41 : 2 : 3 : 41 : 2 : 3 : 41 : 2 : 3 : 41 : 2 : 3 : 4
1 : 2 : 3 : 41 : 2 : 3 : 41 : 2 : 3 : 41 : 2 : 3 : 4
1 : 2 : 3 : 41 : 2 : 3 : 41 : 2 : 3 : 4
1 : 2 : 3 : 41 : 2 : 3 : 41 : 2 : 3 : 41 : 2 : 3 : 41 : 2 : 3 : 41 : 2 : 3 : 4
1 : 2 : 3 : 41 : 2 : 3 : 41 : 2 : 3 : 4
1 : 2 : 3 : 41 : 2 : 3 : 4
1 : 2 : 3 : 41 : 2 : 3 : 4
1 : 2 : 3 : 41 : 2 : 3 : 41 : 2 : 3 : 41 : 2 : 3 : 4
1 : 2 : 3 : 41 : 2 : 3 : 4
1 : 2 : 3 : 4
444444444444444444444444444444444444444
15121314
235331017
5313234392638252124
33016373628
12229112327
719
8496
1820
M15M12M13M14M2T8T6M10M17M5T4T5T7T12E9T11E8E4E7M3T3M16T10T9T1M1E5T2M11E6E10M7E2M8M4M9M6E1E3
Figure 3. Keyform map.

Page 12 IR Applications, Number 28, Making Meaningful Measurement in Survey Research
respondents disagreed compared to the three items from this example with which they strongly agreed. Item M15 asks the question “High-quality research can be determined solely by examining the research methodology.” Items E10, M7, and E2 indicate “High-quality research should abide by the ethical guidelines recognized by the related professional organization in that field”; “High-quality research should follow a clear logic of inquiry”; and “High-quality research informs participants about the consent to research,” respectively. Understanding this information can provide survey researchers with much more informative and meaningful information about the constructs present in their surveys.
Software and Analytical Techniques
Data analysis for this demonstration was performed using Winsteps measurement software (Linacre, 2009). Traditional statistical analyses involve coding data, importing/uploading to a statistical software program, choosing appropriate statistical techniques, performing analyses, and so on. In many ways, Winsteps measurement software is no different, but the ability to effectively write program code can greatly streamline the process. Similar to a traditional statistical analysis, a data file must be prepared. However, measurement software requires a control file, which contains commands for telling the program where to read the data, as well as what output to produce. Numerous examples of control files that should require minor modifications to fit your data are available on the Winsteps program’s website. Also, a user-friendly data set-up feature is available to provide an alternative method for creating the control file. Typically, a check of summary statistics on the number of person and item data read by the program can provide an initial quality control check to ensure all the data were read into the program properly.
Like becoming acquainted to any analytical software package, understanding programs like Winsteps involves a learning curve. Online manuals contain most everything one would need to know, and countless examples can be found at the software’s homepage. For those interested in trying Winsteps measurement software, an evaluation/
student version called MINISTEP is available free of charge at www.winsteps.com. The evaluation/student version allows analyses of records containing up to 75 persons and 25 items. This would be ideal for researchers wishing to survey a sample of less than 75 persons with a questionnaire containing 25 survey items or less. The full version has the capacity to analyze data sets containing up to 30,000 items and 10,000,000 persons.
Other popular measurement software packages include RUMM and ConQuest. Both of these software packages are equipped to handle survey data and can produce similar output. RUMM can be downloaded from http://www.rummlab.com.au/. Although an evaluation copy is not available, those with an interest in potentially purchasing the software can request a limited-time license by contacting the RUMM Laboratory. ConQuest software is available from www.assess.com. A fully functional copy can be downloaded for 30 days for anyone interested in a trial version.
Conclusion
There are a number of useful techniques one can use to analyze survey data, all of which have their own strengths and weaknesses and generally require varying degrees of assumptions. Traditional approaches are incredibly popular, but provide only a limited amount of utility. CTT techniques rely on calculating raw scores and often make erroneous assumptions about the levels of measurement of the variables. Exploring datasets and instruments with IRT techniques can provide an alternative view, especially now that computer software is readily available and affordable. IRT analysis, particularly the Rasch measurement model, can convert ordinal raw scores to truly interval measures and correct many of the erroneous assumptions made by CTT models. Additionally, the output produced from Rasch models can provide a fresh perspective of findings, and may be potentially more meaningful.
It is the researcher’s hope that assessment and institutional research practitioners will explore issues of measurement within their own research. It is important to understand that Rasch measurement is not intended to take the place of statistics, but rather to complement the use of statistics. Utilizing

Page 13 IR Applications, Number 28, Making Meaningful Measurement in Survey Research
a theoretically sound and mathematically just approach like Rasch measurement eliminates assumptions researchers often make regarding methodological issues. Therefore, once proper measurement takes place, appropriate statistical techniques can then be applied, and the results will become more precise—and possibly more meaningful.
Editor’s Note:
In the beginning of time, before there was time, there were also no computing facilities other than a Monroe electromechanical desk calculator that could be raced with a Freidan by dividing a real number by zero.i When statistics were selected for dealing with analytical questions, criteria included the appropriateness of the model, the ability to explain the methodology and results, and the ease of computations. Graduate classes spent time on how to accelerate computations and calculations.
At that point of analytical emergence, the weak-true-score model found a basis in the linear modeling that supported correlation, Analysis of Variance, and regression analysis. Over time, we realized that the world was not unidimensional, so Factor Analysis, Cluster Analysis, and several other multivariate methodologies emerged. The general linear model and classical test theory of true score plus random error (typically normally distributed) maintained its dominance. Royal’s discussion is to remind us that the world has changed. The generalized linear model does not fit all. We should be somewhat prepared for this revelation with the popularity of the Logistic model, Log-Linear analysis, and Event Modeling/Survival Analysis. The barrier of computations has basically disappeared. It is appropriate that this article also helps lower
i The Friden was faster but tended to jam so the Monroe usually won. We didn’t have a Marchant (http://infolab.stanford.edu/pub/voy/museum/pictures/DisplayHector/121CalcFriden.jpg) .
the barrier of understanding and explaining non-linear models. How do you respond to the author’s question, “Why has our profession been hesitant to consider models that were conceptualized 50 years ago?” If the answer is complexity, why has there been the much greater acceptance of Data Mining and Hierarchical Linear Modeling, which are certainly complex methodologies, than there has been for Item Response Theory?
After reflecting on the slowness to accept the IRT alternative, and the possible lack of it in our instruction and research, the second question that Royal advances is “Which type of IRT is the most appropriate?” In other words, do we fit the model to the data or do we fit the data to the model? What are the ways to compose questions so that they are more likely to fit the Rasch model that assumes local independence and measure a single factor?
The presentation of results with the person and item map is a viable alternative to the complexity of explaining results. The same is true of the keyform map. The metrics of In-fit and Out-fit may be a bit more challenging to explain. Finally the computation of the likelihood an individual will endorse (Pass) an item has great relevance to our discussions, but is, as noted in the article, a bit trickier.
In summary, I think this is a very valuable example of a tool that can be appropriate for some of our research. I will caution, however, that when one goes beyond the traditional measure of ability as the overall performance on a sum of items, then the measure of the underlying ability is a bit more challenging.
We have been provided with a road map, with some of the more common models for multiple situations, with the location of the computer software for the alternatives and with the challenge to learn and use new methodologies. This is a challenge that we need to seriously consider.
Page 14 IR Applications, Number 28, Making Meaningful Measurement in Survey Research
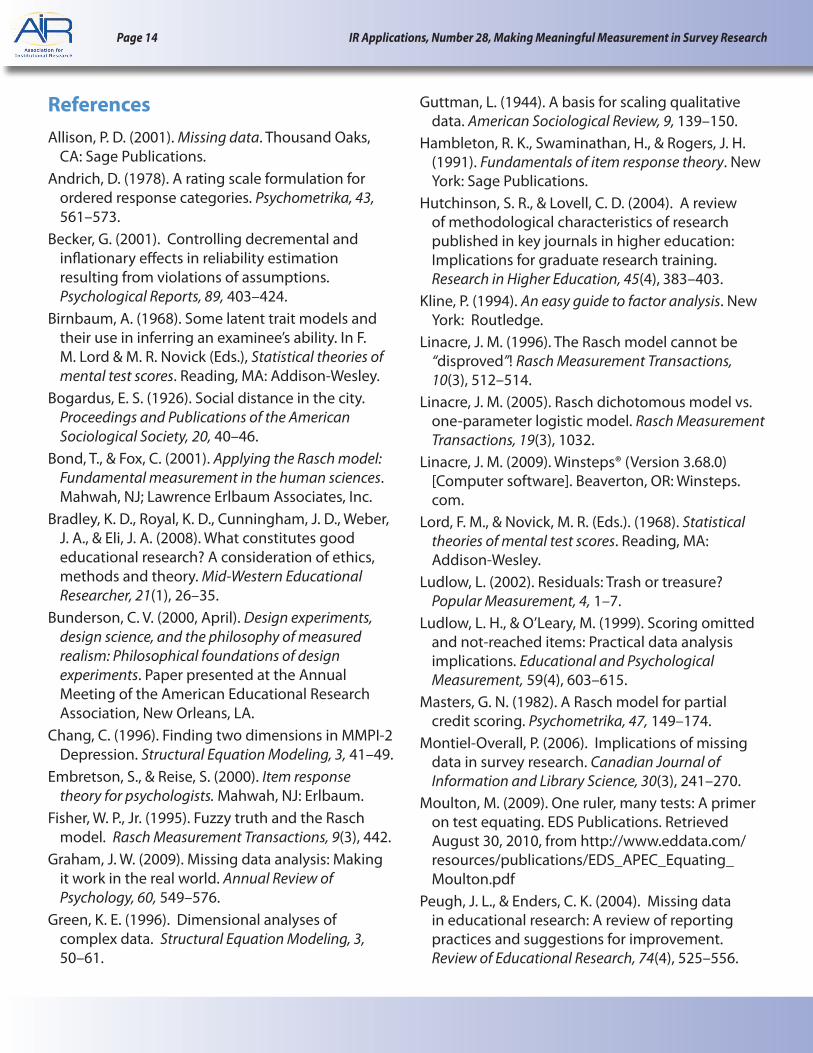
ReferencesAllison, P. D. (2001). Missing data. Thousand Oaks,
CA: Sage Publications.Andrich, D. (1978). A rating scale formulation for
ordered response categories. Psychometrika, 43, 561–573.
Becker, G. (2001). Controlling decremental and inflationary effects in reliability estimation resulting from violations of assumptions. Psychological Reports, 89, 403–424.
Birnbaum, A. (1968). Some latent trait models and their use in inferring an examinee’s ability. In F. M. Lord & M. R. Novick (Eds.), Statistical theories of mental test scores. Reading, MA: Addison-Wesley.
Bogardus, E. S. (1926). Social distance in the city. Proceedings and Publications of the American Sociological Society, 20, 40–46.
Bond, T., & Fox, C. (2001). Applying the Rasch model: Fundamental measurement in the human sciences. Mahwah, NJ; Lawrence Erlbaum Associates, Inc.
Bradley, K. D., Royal, K. D., Cunningham, J. D., Weber, J. A., & Eli, J. A. (2008). What constitutes good educational research? A consideration of ethics, methods and theory. Mid-Western Educational Researcher, 21(1), 26–35.
Bunderson, C. V. (2000, April). Design experiments, design science, and the philosophy of measured realism: Philosophical foundations of design experiments. Paper presented at the Annual Meeting of the American Educational Research Association, New Orleans, LA.
Chang, C. (1996). Finding two dimensions in MMPI-2 Depression. Structural Equation Modeling, 3, 41–49.
Embretson, S., & Reise, S. (2000). Item response theory for psychologists. Mahwah, NJ: Erlbaum.
Fisher, W. P., Jr. (1995). Fuzzy truth and the Rasch model. Rasch Measurement Transactions, 9(3), 442.
Graham, J. W. (2009). Missing data analysis: Making it work in the real world. Annual Review of Psychology, 60, 549–576.
Green, K. E. (1996). Dimensional analyses of complex data. Structural Equation Modeling, 3, 50–61.
Guttman, L. (1944). A basis for scaling qualitative data. American Sociological Review, 9, 139–150.
Hambleton, R. K., Swaminathan, H., & Rogers, J. H. (1991). Fundamentals of item response theory. New York: Sage Publications.
Hutchinson, S. R., & Lovell, C. D. (2004). A review of methodological characteristics of research published in key journals in higher education: Implications for graduate research training. Research in Higher Education, 45(4), 383–403.
Kline, P. (1994). An easy guide to factor analysis. New York: Routledge.
Linacre, J. M. (1996). The Rasch model cannot be “disproved”! Rasch Measurement Transactions, 10(3), 512–514.
Linacre, J. M. (2005). Rasch dichotomous model vs. one-parameter logistic model. Rasch Measurement Transactions, 19(3), 1032.
Linacre, J. M. (2009). Winsteps® (Version 3.68.0) [Computer software]. Beaverton, OR: Winsteps.com.
Lord, F. M., & Novick, M. R. (Eds.). (1968). Statistical theories of mental test scores. Reading, MA: Addison-Wesley.
Ludlow, L. (2002). Residuals: Trash or treasure? Popular Measurement, 4, 1–7.
Ludlow, L. H., & O’Leary, M. (1999). Scoring omitted and not-reached items: Practical data analysis implications. Educational and Psychological Measurement, 59(4), 603–615.
Masters, G. N. (1982). A Rasch model for partial credit scoring. Psychometrika, 47, 149–174.
Montiel-Overall, P. (2006). Implications of missing data in survey research. Canadian Journal of Information and Library Science, 30(3), 241–270.
Moulton, M. (2009). One ruler, many tests: A primer on test equating. EDS Publications. Retrieved August 30, 2010, from http://www.eddata.com/resources/publications/EDS_APEC_Equating_Moulton.pdf
Peugh, J. L., & Enders, C. K. (2004). Missing data in educational research: A review of reporting practices and suggestions for improvement. Review of Educational Research, 74(4), 525–556.

Page 15 IR Applications, Number 28, Making Meaningful Measurement in Survey Research
Rasch, G. (1960). Probabilistic models for some intelligence and attainment tests. Chicago: University of Chicago Press.
Royal, K. D., & Bradley, K. D. (2008). Rethinking measurement in higher education research. (ERIC Document Reproduction Service No. ED506513)
Rubin, D. B. (1996). Multiple imputation after 18+ years. Journal of the American Statistical Association, 91(434), 473–489.
Smith, R. M. (1996). A comparison of methods for determining dimensionality in Rasch measurement. Structural Equation Modeling, 3, 25–40.
Spearman, C. (1904). “General intelligence” objectively determined and measured. American Journal of Psychology, 15, 201–293.
Stevens, S. S. (1959). Measurement, psychophysics and utility. In C. W. Churchman & P. Ratoosh (Eds.), Measurement: Definitions and theories. New York: John Wiley.
Thurstone, L. L. (1928). Attitudes can be measured. American Journal of Sociology, 33, 529–554.
Wright, B. D. (1992). IRT in the 1990s: Which models work best? Rasch Measurement Transactions, 6(1), 196–200.
Wright, B. D. (1994). Comparing Rasch measurement and factor analysis. Structural Equation Modeling, 3, 3–24.
Wright, B. D. (1999). Model selection: Rating scale or partial credit? Rasch Measurement Transactions, 12(3), 641–642.
Wright, B. D., & Stone, M. H. (1979). Best test design. Chicago: The University of Chicago, MESA Press.

IR Applications is an AIR refereed publication that publishes articles focused on the application of advanced and specialized methodologies. The articles address applying qualitative and quantitative techniques to the processes used to support higher education management.
IR Applications Number 28 Page 16
EDITOR:
Dr. Gerald W. McLaughlinAssociate Vice President
for Institutional Planning
and Research
DePaul University1 East Jackson, Suite 1501Chicago, IL 60604-2216Phone: 312-362-8403Fax: [email protected]
ASSOCIATE EDITOR:
Dr. Glenn W. JamesDirector of Institutional ResearchTennessee Technological University314 Derryberry Hall1 William L. Jones Drive, Box 5161Cookeville, TN 38505-0001Phone: 931- 372-6144Fax: [email protected]
MANAGING EDITOR:
Dr. Randy L. SwingExecutive DirectorAssociation for Institutional Research1435 E. Piedmont Drive Suite 211Tallahassee, FL 32308Phone: 850-385-4155Fax: [email protected]
AIR IR APPLICATIONS EDITORIAL BOARD
Authors can submit contributions from various sources such as a Forum presentation or an individual article. The articles should be 10-15 double-spaced pages, and include an abstract and references. Reviewers will rate the quality of an article as well as indicate the appropriateness for the alternatives. For articles accepted for IR Applications, the author and reviewers may be asked for comments and considerations on the application of the methodologies the articles discuss.
Articles accepted for IR Applications will be published on the AIR Web site and will be available for download by AIR members as a PDF document. Because of the characteristics of Web-publishing, articles will be published upon availability providing members timely access to the material.
Please send manuscripts and/or inquiries regarding IR Applications to Dr. Gerald McLaughlin.
© 2010, Association for Institutional Research
Dr. Trudy H. BersSenior Director of
Research, Curriculum and Planning
Oakton Community CollegeDes Plaines, IL
Dr. Stephen L. ChambersDirector of Institutional Research
and Assessment Coconino Community College
Flagstaff, AZ
Dr. Anne Marie DelaneyDirector of
Institutional ResearchBabson CollegeBabson Park, MA
Dr. Paul B. DubyAssociate Vice President of
Institutional ResearchNorthern Michigan University
Marquette, MI
Dr. Philip GarciaDirector of
Analytical StudiesCalifornia State University-Long Beach
Long Beach, CA
Mr. Jacob P. GrossAssociate Director for Research
Indiana University/Project on Academic Success
1900 E 10th Ste 630Bloomington, IN
Dr. Ronald L. Huesman Jr.Assistant Director,
Office of Institutional ResearchUniversity of Minnesota
Minneapolis, MN
Dr. Glenn W. JamesDirector of
Institutional ResearchTennessee Technological University
Cookeville, TN
Dr. David Jamieson-DrakeDirector of
Institutional ResearchDuke University
Durham, NC
Dr. Julie P. Noble,Principal Research Associate
ACT, Inc.Iowa City, Iowa
Dr. Harlan M. SchweerDirector, Office of Institutional Research
College of DuPageGlen Ellyn, IL
Dr. Jeffrey A. SeybertDirector of
Institutional ResearchJohnson County Community College
Overland Park, KS
Dr. Bruce SzelestAssociate Director ofInstitutional Research
SUNY-AlbanyAlbany, NY
Mr. Daniel Jones-WhiteAnalyst
University of MinnesotaMinneapolis, MN