Embed Size (px)
Citation preview
©Copyright 2004, Association for Institutional Research
Using Advanced Tools, Techniques, and Methodologies
Association forInstitutional Research
Enhancing knowledge. Expanding networks.Professional Development, Informational Resources & Networking
IR Applications
Time to Bachelor’s Degree Attainment: An Application ofDescriptive, Bivariate, and Multiple Regression Techniques
William E. Knight, Bowliing Green State University
Volume 2, September 8, 2004
The author wishes to acknowledge the very helpfulfeedback that was provided by the Editor and reviewers.
Abstract
This manuscript summarizes an institutional researchstudy carried out at Bowling Green State University (BGSU)concerning factors affecting time to bachelor’s degreeattainment. Tuition sensitivity and concern about efficientuse of institutional resources point to the need fordecreasing students’ time-to-degree. This study enlargesupon an earlier one; it investigated the effects of state-and institutionally-sponsored policies that were designedto decrease time-to-degree, and also some additionalfactors such as student participation in learningcommunities and first year programs. Time-to-degreedecreased in four years since the previous study.Participation in a tuition discount program, total studentcredit hours earned, average credit hour load per semester,and student credit hours transferred were among thestrongest predictors of time-to-degree. The study highlightsthe use of descriptive and bivariate statistical techniques,as well as important considerations in the use of appliedmultiple regression.
Introduction
This manuscript summarizes an institutional researchstudy carried out at Bowling Green State University (BGSU)concerning factors affecting time to bachelor’s degreeattainment. While the full study report was meant for theBGSU administrative audience and necessarily includedan extended discussion of the topic’s relevance to policyand practice and an extended presentation of the resultsand discussion of the implications, this presentation willfocus on the issue of greater interest to institutional
researchers: the methodology (Bers & Seybert, 1999).The full study report including an expanded narrative, morereferences, and more results tables is available (BGSU,2003).
Concerns on the part of students, parents, governmentalagencies, and the media about ever-increasing tuitionlevels have led to calls to improve higher educationeffectiveness and efficiency. This external accountabilitymandate accompanied with institutional sensitivity aboutefficient use of scarce resources has pointed to the needfor decreasing undergraduates’ time to bachelor’s degreeattainment.
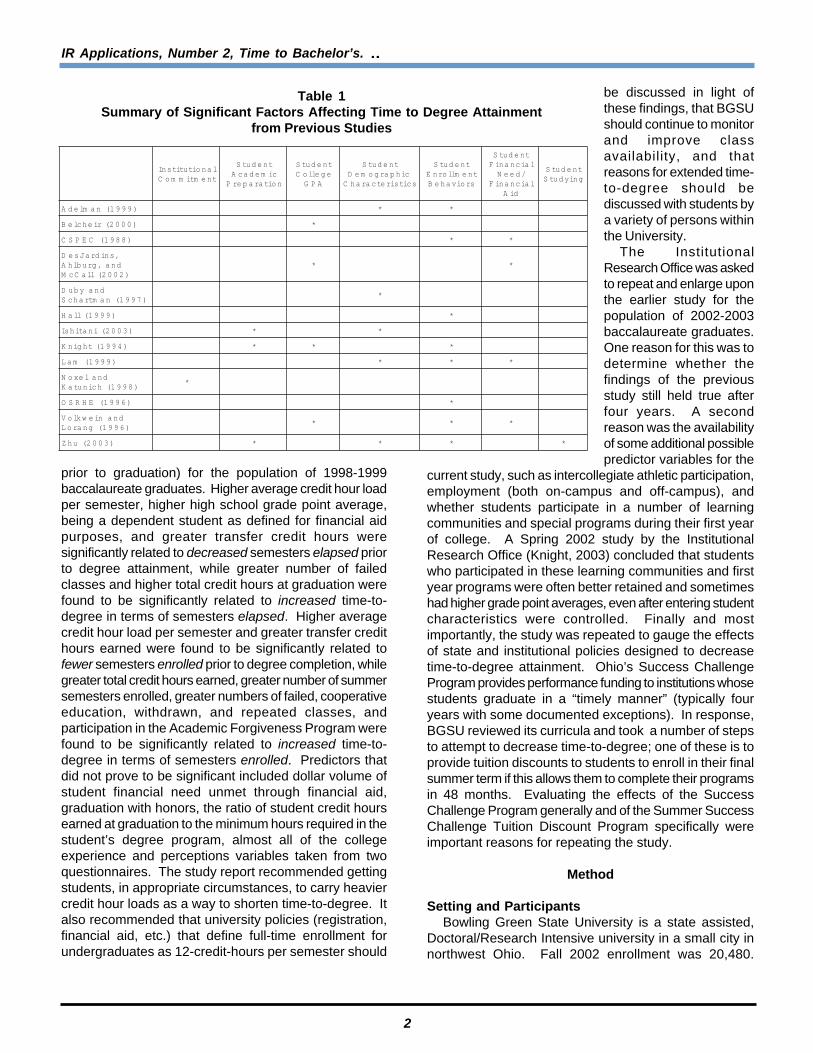
A small but growing literature has been developedduring recent years concerning effects upon time-to-degree.Table 1 (pg. 2) provides a summary of this literature.Student academic preparation includes high school gradepoint average and standardized test scores. Studentenrollment behaviors include stopping out, transferringbetween institutions, average credit hour load completedper term, dropping classes, and changing majors. Studentfinancial need/financial aid includes types and amounts ofaid and employment. Student enrollment behaviors havebeen found to have the greatest impact on time-to-degreeattainment. Student academic preparation, college gradepoint average, demographic characteristics, and financialneed/financial aid have also been found to have pervasiveeffects on time-to-degree.
The BGSU’s Institutional Research Office carried out acomprehensive study in the Spring of 2000 (Knight, 2002)of the effects of a large set of potential predictor variables(student background characteristics, remedial class andsummer freshman program participation, pre-enrollmentperceptions, enrollment behaviors, student experiencesand perceptions, financial aid data, and academicoutcomes) on time- to-degree attainment (measured bothin total terms elapsed and also total actual terms enrolled
IR Applications, Number 2, Time to Bachelor’s. . .. .. .. .. .
2
prior to graduation) for the population of 1998-1999baccalaureate graduates. Higher average credit hour loadper semester, higher high school grade point average,being a dependent student as defined for financial aidpurposes, and greater transfer credit hours weresignificantly related to decreased semesters elapsed priorto degree attainment, while greater number of failedclasses and higher total credit hours at graduation werefound to be significantly related to increased time-to-degree in terms of semesters elapsed. Higher averagecredit hour load per semester and greater transfer credithours earned were found to be significantly related tofewer semesters enrolled prior to degree completion, whilegreater total credit hours earned, greater number of summersemesters enrolled, greater numbers of failed, cooperativeeducation, withdrawn, and repeated classes, andparticipation in the Academic Forgiveness Program werefound to be significantly related to increased time-to-degree in terms of semesters enrolled. Predictors thatdid not prove to be significant included dollar volume ofstudent financial need unmet through financial aid,graduation with honors, the ratio of student credit hoursearned at graduation to the minimum hours required in thestudent’s degree program, almost all of the collegeexperience and perceptions variables taken from twoquestionnaires. The study report recommended gettingstudents, in appropriate circumstances, to carry heaviercredit hour loads as a way to shorten time-to-degree. Italso recommended that university policies (registration,financial aid, etc.) that define full-time enrollment forundergraduates as 12-credit-hours per semester should
be discussed in light ofthese findings, that BGSUshould continue to monitorand improve classavailability, and thatreasons for extended time-to-degree should bediscussed with students bya variety of persons withinthe University.
The InstitutionalResearch Office was askedto repeat and enlarge uponthe earlier study for thepopulation of 2002-2003baccalaureate graduates.One reason for this was todetermine whether thefindings of the previousstudy still held true afterfour years. A secondreason was the availabilityof some additional possiblepredictor variables for the
current study, such as intercollegiate athletic participation,employment (both on-campus and off-campus), andwhether students participate in a number of learningcommunities and special programs during their first yearof college. A Spring 2002 study by the InstitutionalResearch Office (Knight, 2003) concluded that studentswho participated in these learning communities and firstyear programs were often better retained and sometimeshad higher grade point averages, even after entering studentcharacteristics were controlled. Finally and mostimportantly, the study was repeated to gauge the effectsof state and institutional policies designed to decreasetime-to-degree attainment. Ohio’s Success ChallengeProgram provides performance funding to institutions whosestudents graduate in a “timely manner” (typically fouryears with some documented exceptions). In response,BGSU reviewed its curricula and took a number of stepsto attempt to decrease time-to-degree; one of these is toprovide tuition discounts to students to enroll in their finalsummer term if this allows them to complete their programsin 48 months. Evaluating the effects of the SuccessChallenge Program generally and of the Summer SuccessChallenge Tuition Discount Program specifically wereimportant reasons for repeating the study.
Method
Setting and ParticipantsBowling Green State University is a state assisted,
Doctoral/Research Intensive university in a small city innorthwest Ohio. Fall 2002 enrollment was 20,480.
lanoitutitsnItnemtimmoC
tnedutScimedacAnoitaraperP
tnedutSegelloC
APG
tnedutScihpargomeDscitsiretcarahC
tnedutStnemllornEsroivaheB
tnedutSlaicnaniF
/deeNlaicnaniF
diA
tnedutSgniydutS
)9991(namledA * *
)0002(riehcleB *
)8891(CEPSC * *
,snidraJseDdna,grublhA)2002(llaCcM
* *
dnaybuD)7991(namtrahcS
*
)9991(llaH *
)3002(inatihsI * *
)4991(thginK * * *
)9991(maL * * *
dnalexoN)8991(hcinutaK
*
)6991(EHRSO *
dnaniewkloV)6991(gnaroL
* * *
)3002(uhZ * * * *
Table 1Summary of Significant Factors Affecting Time to Degree Attainment
from Previous Studies
IR Applications, Number 2, Time to Bachelor’s. . .....
3
Academic programs are offered at the associate degreethrough doctoral levels. Approximately one-half ofundergraduates live on campus. The University hasmoderately selective admissions requirements.Approximately 90% of undergraduates are White, 94%are age 18-24, 92% are Ohio residents, and 94% areenrolled full-time. Additional information about BGSU isavailable at http://www.bgsu.edu/offices/ir/factbook/coverpage.htm
The study examined influences upon time-to-degree forthe entire population of BGSU students earning bachelor’sdegrees in 2002-2003 (N=3,097). Transfer students (N=640)were excluded from the population; 2,457 remainingstudents constituted the population for the remainder ofthe analyses. These students were excluded becausesignificant differences between transfer and “native” studentswere found in both total semesters enrolled and semesterselapsed to degree (7.2 semesters enrolled for transferstudents vs. 10.2 semesters for native students and 8.8semesters elapsed for transfer students vs. 13.8 semestersfor native students) and also to allow greater comparabilityto most previously published studies. Please note thatalthough transfer students were excluded from the studypopulation, students may have had transfer credit throughactivities such as the Advanced Placement Program (AP),the College-Level Examination Program (CLEP),simultaneous high school and college enrollment, and throughtaking classes at other institutions, typically in the summerat an institution near to students’ permanent residence.
The full study report (BGSU, 2003) provides an extendedsummary of the study participants, a specification ofwhose characteristics at the time of graduation alsocomprise the descriptive results of the study.
Design and ProcedureData on students’ time-to-degree, demographic and
pre-college educational characteristics, enrollment behaviorvariables, academic outcomes, financial aid, learningcommunity and first year program participation, parents’education levels, and program accreditation status wereassembled into a series of data files by the InstitutionalResearch Office.
There were two dependent variables in the study:semesters elapsed prior to degree attainment (includingstop-out) and semesters actually enrolled prior tograduation. Most of the same potential predictor variables(student background characteristics, enrollment behaviors,financial aid data, and academic outcomes) as were usedin the Institutional Research Office’s 2000 study wereused in the current one in order to test whether the samepattern of results still held, although, as noted earlier,some additional potential predictors that were not availableearlier were also included. Although none of the BGSUFirst Year Student Questionnaire (FYSQ) variables werefound to be significant predictors of time-to-degree in theearlier BGSU study, parents’ education levels were
extracted from FYSQ data for the current study becauseother recent published institutional studies found firstgeneration status to be a significant predictor of longertime to graduation.
Dichotomous potential predictor variables were used ina set of t-tests with semesters elapsed prior to degreecompletion and actual semesters enrolled prior to degreecompletion used as the dependent variables in separateanalyses. Continuous potential predictor variables wereincluded along with the same two dependent variables incorrelation analyses.
Two separate multiple regression analyses were carriedout, one with semesters elapsed prior to degree completionas the dependent variable and another with semestersenrolled prior to degree completion as the dependent variable.
It is important to consider and deal with the issue ofmulticollinearity—strong relationships among theindependent variables that cause instability in regressionweights—before multivariate analyses such as multipleregression are carried out. Various methods of detectingmulticollinearity exist, including inspecting the correlationsbetween independent variables and relying upon thetolerance levels and variance inflation factors (VIFs) thatare produced in the output of statistical analysis software,such as SPSS. For the current study, tolerance valuesclose to zero were judged to indicate multicollinearity(Mertler & Vannatta, 2002). Various options are open tothe researcher when multicollinearity is suspected,including standardizing some of the measures, combiningrelated items into an index based upon the results offactor analysis, using alternative analysis techniques suchas ridge regression, and dropping some independentvariables from the analysis, the later of which was done inthis study. Variables used in the univariate analysesnoted above that were omitted from the regressions becauseof multicollinearity concerns included ACT sub-scores,grade point average at the end of students’ freshman yearand in general education classes, number of fall/springand summer semesters enrolled, and student credit hoursearned in fall/spring and summer semesters.
A special case of multicollinearity may exist whensynthetic relationships occur between independent anddependent variables. This is illustrated in the currentstudy by the use of the average credit hours completedper term variable as a predictor of semesters enrolled priorto degree attainment. Because average credit hours perterm was calculated by dividing total credits hours earnedby total semesters enrolled, a linear dependency existsbetween the independent and dependent variables. Thiscreates a problem because “information provided by someof the variables is completely redundant with the informationavailable from other variables and hence useless for thepurpose of regression analysis” (Pedhazur, 1997). Forthis reason, average credit hours completed per term wasnot included in this study’s multiple regression analysis
IR Applications, Number 2, Time to Bachelor’s. . .. .. .. .. .
4
where total semesters enrolled served as the dependentvariable, but it was included in the analysis where totalsemesters elapsed was the dependent variable, becauseno linear dependency exists there. The author must, ingood conscience, admit that this problem escaped hisattention when the earlier version of the study was carriedout (Knight, 2002).
It should be noted that the two multiple regressionanalyses were also carried out with both dependentvariables converted to their logarithmic and squaredcounterparts in an attempt to determine whether a non-linear relationship better fit the research models. Thepattern of results was essentially the same and there wasless than a 1% change in percentage of variance accountedfor by either model, so the results are presented hereusing the more familiar approach.
The multiple regression analyses were carried out usingthe “direct” method of independent variable entry, whichshows the full set of statistical output for all predictorsentered. An alternative procedure that would have allowedthe output to be considerably decreased would have beento have used the “stepwise” method. Both methods wereused and the results of the stepwise method lookednearly identical to those shown in Tables 5 and 6 belowexcept that the non-significant predictors were omitted.The researcher chose to highlight the results of the directmethod to the BGSU audience so that everyone couldexamine all of the evidence and realize that some anecdotal“truths” (e.g., that race, employment, some forms offinancial aid, etc. significantly impact time-to-degreecompletion) are not borne out.
Multiple regression analyses were carried out separatelyfor females to examine conditional effects on time-to-degree.1 The author initially wished to also examineconditional effects for students with lower than averageACT scores, students of color, and students in eachcollege; however, the small group sizes (which areexacerbated by listwise deletion for missing data) led tosituations where many of the independent variablesfunctioned as constants and the relevancy of the resultswas questionable. While additional analyses could havebeen carried for any number of other possible sub-groups,this set was of greatest interest at the institution.
Multiple regression was used for the current studyrather than path analysis, which was employed for theearlier version (Knight, 2002). While a sufficient theoreticalbasis exists to carry out a path analysis approach, it hasbecome apparent to the researcher that decision makersat his institution do not understand this technique andview its results with suspicion. Despite the possiblemethodological advantages of path analysis, what is mostimportant for institutional research is that the audiencehas confidence in and is able to use the results(McLaughlin, Howard, Balkan, & Blythe, 1998).
Results
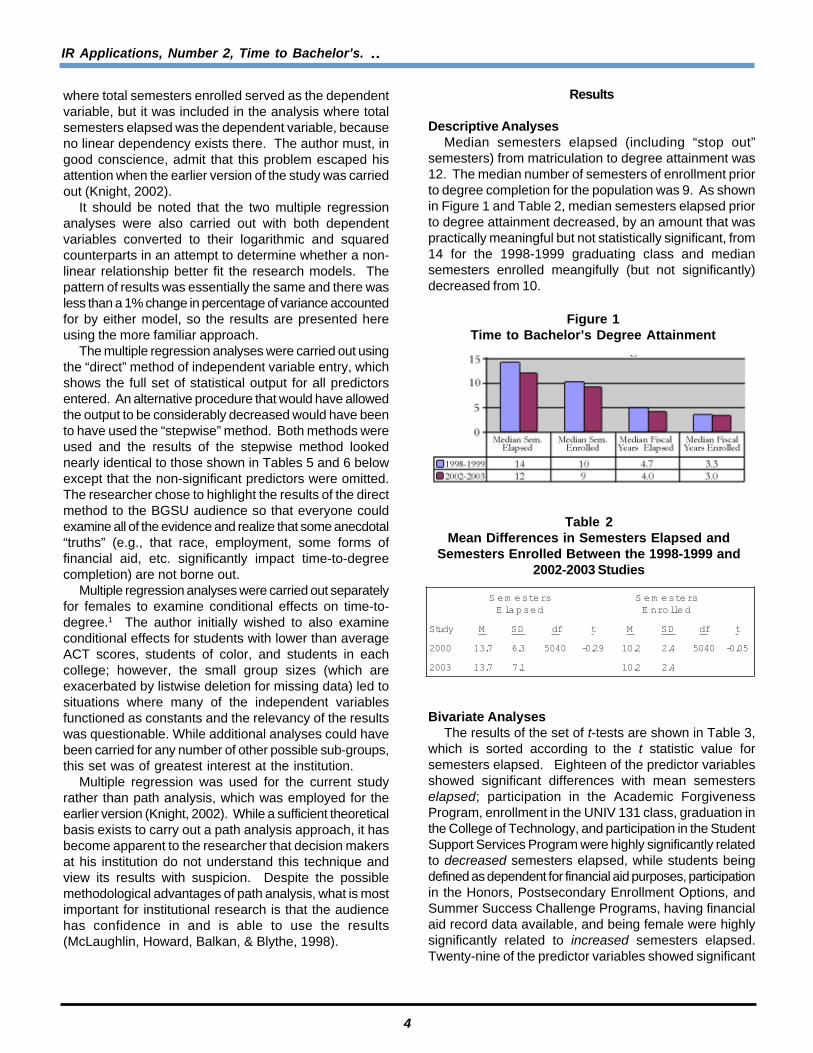
Descriptive AnalysesMedian semesters elapsed (including “stop out”
semesters) from matriculation to degree attainment was12. The median number of semesters of enrollment priorto degree completion for the population was 9. As shownin Figure 1 and Table 2, median semesters elapsed priorto degree attainment decreased, by an amount that waspractically meaningful but not statistically significant, from14 for the 1998-1999 graduating class and mediansemesters enrolled meangifully (but not significantly)decreased from 10.
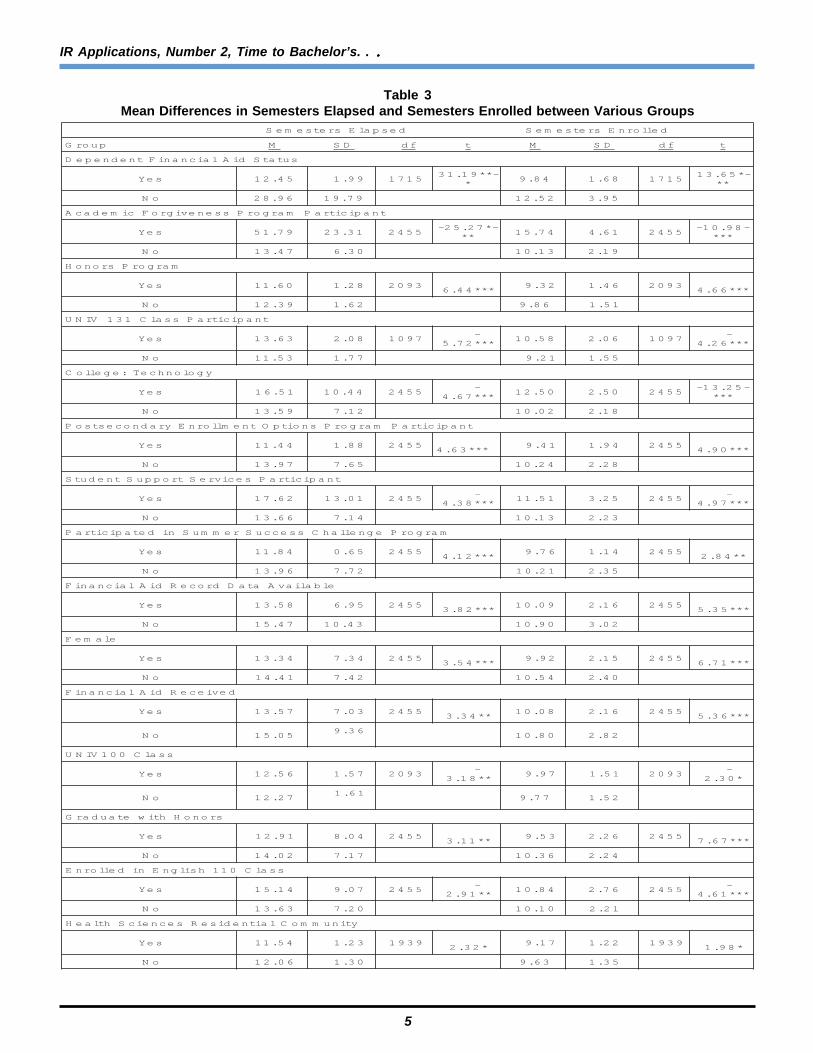
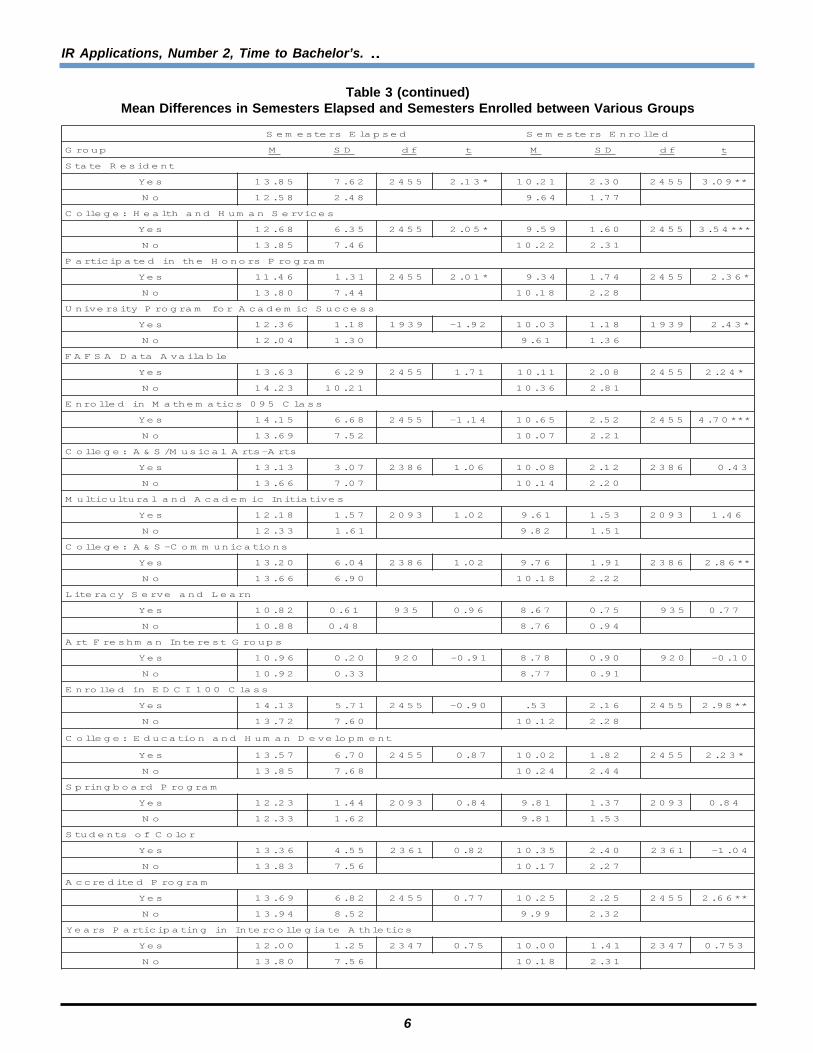
Bivariate AnalysesThe results of the set of t-tests are shown in Table 3,
which is sorted according to the t statistic value forsemesters elapsed. Eighteen of the predictor variablesshowed significant differences with mean semesterselapsed; participation in the Academic ForgivenessProgram, enrollment in the UNIV 131 class, graduation inthe College of Technology, and participation in the StudentSupport Services Program were highly significantly relatedto decreased semesters elapsed, while students beingdefined as dependent for financial aid purposes, participationin the Honors, Postsecondary Enrollment Options, andSummer Success Challenge Programs, having financialaid record data available, and being female were highlysignificantly related to increased semesters elapsed.Twenty-nine of the predictor variables showed significant
sretsemeSdespalE
sretsemeSdellornE
ydutS M DS fd t M DS fd t
0002 7.31 3.6 0405 92.0- 2.01 4.2 0405 50.0-
3002 7.31 1.7 2.01 4.2
Table 2Mean Differences in Semesters Elapsed and
Semesters Enrolled Between the 1998-1999 and2002-2003 Studies
Figure 1Time to Bachelor’s Degree Attainment
IR Applications, Number 2, Time to Bachelor’s. . .....
5
despalEsretsemeS dellornEsretsemeS
puorG M DS fd t M DS fd t
sutatSdiAlaicnaniFtnednepeD
seY 54.21 99.1 5171-**91.13
*48.9 86.1 5171
-*56.31**
oN 69.82 97.91 25.21 59.3
tnapicitraPmargorPssenevigroFcimedacA
seY 97.15 13.32 5542-*72.52-
**47.51 16.4 5542
-89.01-***
oN 74.31 03.6 31.01 91.2
margorPsronoH
seY 06.11 82.1 3902***44.6
23.9 64.1 3902***66.4
oN 93.21 26.1 68.9 15.1
tnapicitraPssalC131VINU
seY 36.31 80.2 7901-
***27.585.01 60.2 7901
-***62.4
oN 35.11 77.1 12.9 55.1
ygolonhceT:egelloC
seY 15.61 44.01 5542-
***76.405.21 05.2 5542
-52.31-***
oN 95.31 21.7 20.01 81.2
tnapicitraPmargorPsnoitpOtnemllornEyradnocestsoP
seY 44.11 88.1 5542***36.4
14.9 49.1 5542***09.4
oN 79.31 56.7 42.01 82.2
tnapicitraPsecivreStroppuStnedutS
seY 26.71 10.31 5542-
***83.415.11 52.3 5542
-***79.4
oN 66.31 41.7 31.01 32.2
margorPegnellahCsseccuSremmuSnidetapicitraP
seY 48.11 56.0 5542***21.4
67.9 41.1 5542**48.2
oN 69.31 27.7 12.01 53.2
elbaliavAataDdroceRdiAlaicnaniF
seY 85.31 59.6 5542***28.3
90.01 61.2 5542***53.5
oN 74.51 34.01 09.01 20.3
elameF
seY 43.31 43.7 5542***45.3
29.9 51.2 5542***17.6
oN 14.41 24.7 45.01 04.2
devieceRdiAlaicnaniF
seY 75.31 30.7 5542**43.3
80.01 61.2 5542***63.5
oN 50.5163.9
08.01 28.2
ssalC001VINU
seY 65.21 75.1 3902-**81.3
79.9 15.1 3902-*03.2
oN 72.2116.1
77.9 25.1
sronoHhtiwetaudarG
seY 19.21 40.8 5542**11.3
35.9 62.2 5542***76.7
oN 20.41 71.7 63.01 42.2
ssalC011hsilgnEnidellornE
seY 41.51 70.9 5542-**19.2
48.01 67.2 5542-
***16.4
oN 36.31 02.7 01.01 12.2
ytinummoClaitnediseRsecneicShtlaeH
seY 45.11 32.1 9391*23.2
71.9 22.1 9391*89.1
oN 60.21 03.1 36.9 53.1
Table 3Mean Differences in Semesters Elapsed and Semesters Enrolled between Various Groups
IR Applications, Number 2, Time to Bachelor’s. . .. .. .. .. .
6
despalEsretsemeS dellornEsretsemeS
puorG M DS fd t M DS fd t
tnediseRetatS
seY 58.31 26.7 5542 *31.2 12.01 03.2 5542 **90.3
oN 85.21 84.2 46.9 77.1
secivreSnamuHdnahtlaeH:egelloC
seY 86.21 53.6 5542 *50.2 95.9 06.1 5542 ***45.3
oN 58.31 64.7 22.01 13.2
margorPsronoHehtnidetapicitraP
seY 64.11 13.1 5542 *10.2 43.9 47.1 5542 *63.2
oN 08.31 44.7 81.01 82.2
sseccuScimedacArofmargorPytisrevinU
seY 63.21 81.1 9391 29.1- 30.01 81.1 9391 *34.2
oN 40.21 03.1 16.9 63.1
elbaliavAataDASFAF
seY 36.31 92.6 5542 17.1 11.01 80.2 5542 *42.2
oN 32.41 12.01 63.01 18.2
ssalC590scitamehtaMnidellornE
seY 51.41 86.6 5542 41.1- 56.01 25.2 5542 ***07.4
oN 96.31 25.7 70.01 12.2
strA-strAlacisuM/S&A:egelloC
seY 31.31 70.3 6832 60.1 80.01 21.2 6832 34.0
oN 66.31 70.7 41.01 02.2
sevitaitinIcimedacAdnalarutlucitluM
seY 81.21 75.1 3902 20.1 16.9 35.1 3902 64.1
oN 33.21 16.1 28.9 15.1
snoitacinummoC-S&A:egelloC
seY 02.31 40.6 6832 20.1 67.9 19.1 6832 **68.2
oN 66.31 09.6 81.01 22.2
nraeLdnaevreSycaretiL
seY 28.01 16.0 539 69.0 76.8 57.0 539 77.0
oN 88.01 84.0 67.8 49.0
spuorGtseretnInamhserFtrA
seY 69.01 02.0 029 19.0- 87.8 09.0 029 01.0-
oN 29.01 33.0 77.8 19.0
ssalC001ICDEnidellornE
seY 31.41 17.5 5542 09.0- 35. 61.2 5542 **89.2
oN 27.31 06.7 21.01 82.2
tnempoleveDnamuHdnanoitacudE:egelloC
seY 75.31 07.6 5542 78.0 20.01 28.1 5542 *32.2
oN 58.31 86.7 42.01 44.2
margorPdraobgnirpS
seY 32.21 44.1 3902 48.0 18.9 73.1 3902 48.0
oN 33.21 26.1 18.9 35.1
roloCfostnedutS
seY 63.31 55.4 1632 28.0 53.01 04.2 1632 40.1-
oN 38.31 65.7 71.01 72.2
margorPdetiderccA
seY 96.31 28.6 5542 77.0 52.01 52.2 5542 **66.2
oN 49.31 25.8 99.9 23.2
scitelhtAetaigellocretnInignitapicitraPsraeY
seY 00.21 52.1 7432 57.0 00.01 14.1 7432 357.0
oN 08.31 65.7 81.01 13.2
Table 3 (continued)Mean Differences in Semesters Elapsed and Semesters Enrolled between Various Groups
IR Applications, Number 2, Time to Bachelor’s. . .....
7
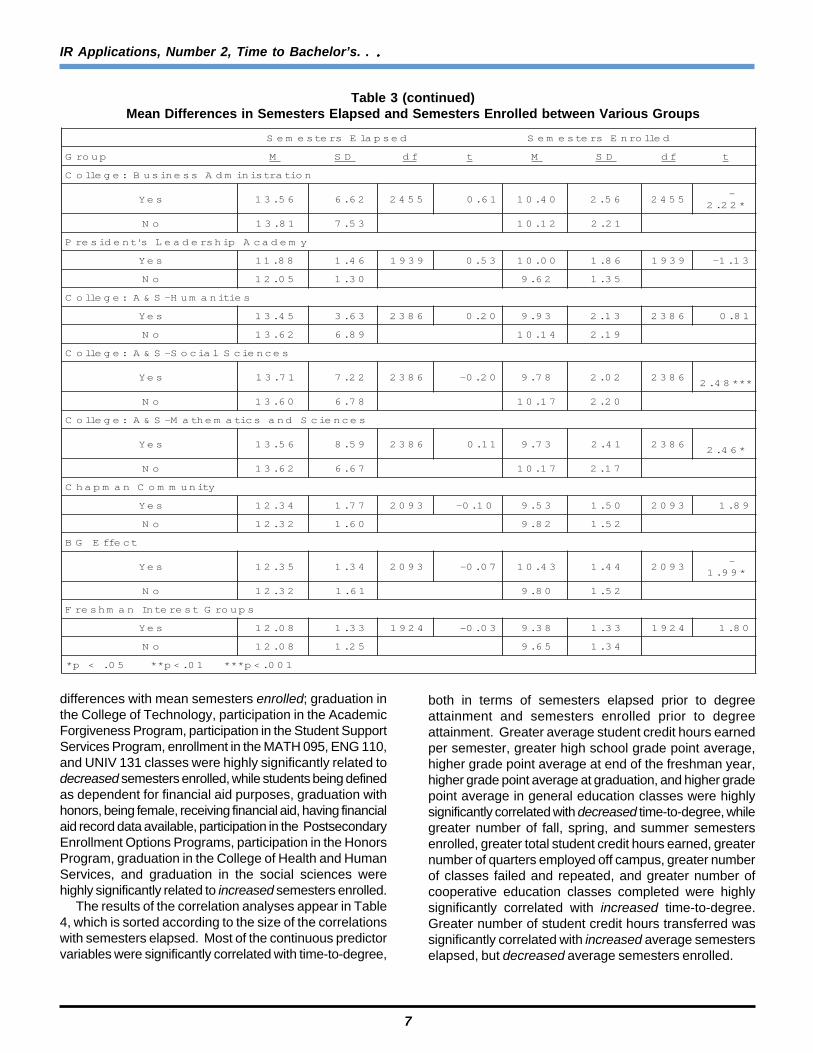
differences with mean semesters enrolled; graduation inthe College of Technology, participation in the AcademicForgiveness Program, participation in the Student SupportServices Program, enrollment in the MATH 095, ENG 110,and UNIV 131 classes were highly significantly related todecreased semesters enrolled, while students being definedas dependent for financial aid purposes, graduation withhonors, being female, receiving financial aid, having financialaid record data available, participation in the PostsecondaryEnrollment Options Programs, participation in the HonorsProgram, graduation in the College of Health and HumanServices, and graduation in the social sciences werehighly significantly related to increased semesters enrolled.
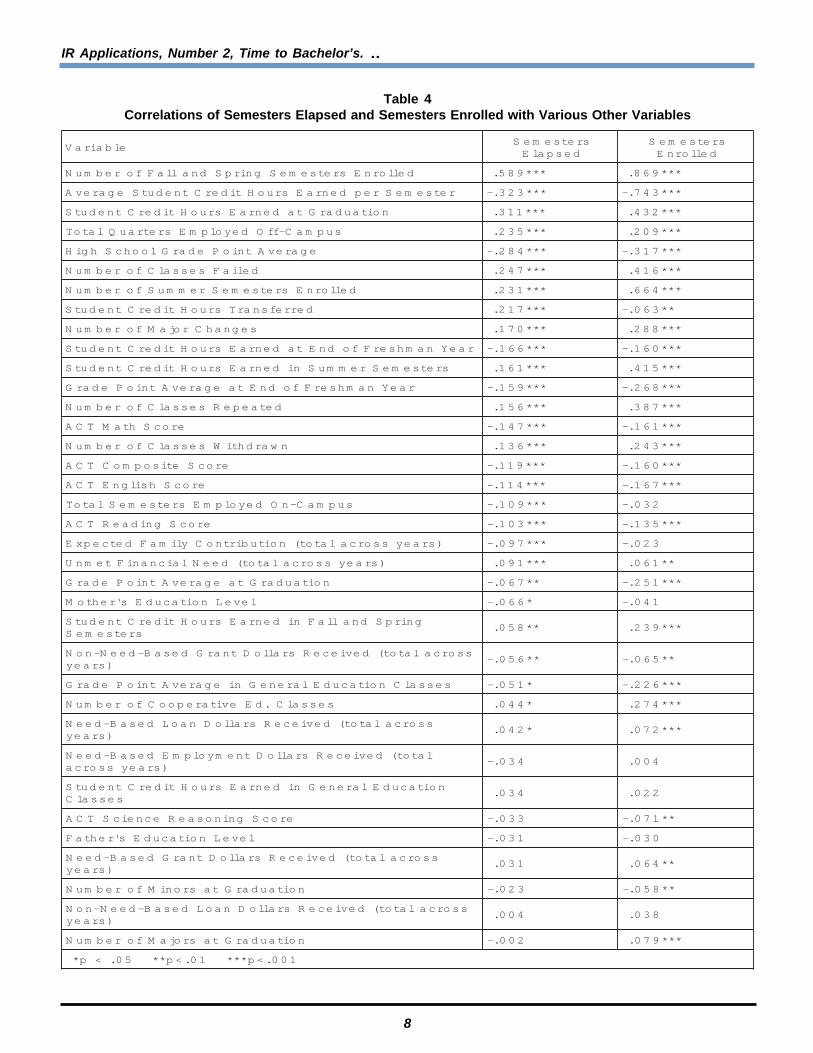
The results of the correlation analyses appear in Table4, which is sorted according to the size of the correlationswith semesters elapsed. Most of the continuous predictorvariables were significantly correlated with time-to-degree,
both in terms of semesters elapsed prior to degreeattainment and semesters enrolled prior to degreeattainment. Greater average student credit hours earnedper semester, greater high school grade point average,higher grade point average at end of the freshman year,higher grade point average at graduation, and higher gradepoint average in general education classes were highlysignificantly correlated with decreased time-to-degree, whilegreater number of fall, spring, and summer semestersenrolled, greater total student credit hours earned, greaternumber of quarters employed off campus, greater numberof classes failed and repeated, and greater number ofcooperative education classes completed were highlysignificantly correlated with increased time-to-degree.Greater number of student credit hours transferred wassignificantly correlated with increased average semesterselapsed, but decreased average semesters enrolled.
despalEsretsemeS dellornEsretsemeS
puorG M DS fd t M DS fd t
noitartsinimdAssenisuB:egelloC
seY 65.31 26.6 5542 16.0 04.01 65.2 5542-*22.2
oN 18.31 35.7 21.01 12.2
ymedacApihsredaeLs'tnediserP
seY 88.11 64.1 9391 35.0 00.01 68.1 9391 31.1-
oN 50.21 03.1 26.9 53.1
seitinamuH-S&A:egelloC
seY 54.31 36.3 6832 02.0 39.9 31.2 6832 18.0
oN 26.31 98.6 41.01 91.2
secneicSlaicoS-S&A:egelloC
seY 17.31 22.7 6832 02.0- 87.9 20.2 6832***84.2
oN 06.31 87.6 71.01 02.2
secneicSdnascitamehtaM-S&A:egelloC
seY 65.31 95.8 6832 11.0 37.9 14.2 6832*64.2
oN 26.31 76.6 71.01 71.2
ytinummoCnampahC
seY 43.21 77.1 3902 01.0- 35.9 05.1 3902 98.1
oN 23.21 06.1 28.9 25.1
tceffEGB
seY 53.21 43.1 3902 70.0- 34.01 44.1 3902-*99.1
oN 23.21 16.1 08.9 25.1
spuorGtseretnInamhserF
seY 80.21 33.1 4291 30.0- 83.9 33.1 4291 08.1
oN 80.21 52.1 56.9 43.1
100.<p***10.<p**50.<p*
Table 3 (continued)Mean Differences in Semesters Elapsed and Semesters Enrolled between Various Groups
IR Applications, Number 2, Time to Bachelor’s. . .. .. .. .. .
8
elbairaVsretsemeS
despalEsretsemeS
dellornE
dellornEsretsemeSgnirpSdnallaFforebmuN ***985. ***968.
retsemeSrepdenraEsruoHtiderCtnedutSegarevA ***323.- ***347.-
noitaudarGtadenraEsruoHtiderCtnedutS ***113. ***234.
supmaC-ffOdeyolpmEsretrauQlatoT ***532. ***902.
egarevAtnioPedarGloohcShgiH ***482.- ***713.-
deliaFsessalCforebmuN ***742. ***614.
dellornEsretsemeSremmuSforebmuN ***132. ***466.
derrefsnarTsruoHtiderCtnedutS ***712. **360.-
segnahCrojaMforebmuN ***071. ***882.
raeYnamhserFfodnEtadenraEsruoHtiderCtnedutS ***661.- ***061.-
sretsemeSremmuSnidenraEsruoHtiderCtnedutS ***161. ***514.
raeYnamhserFfodnEtaegarevAtnioPedarG ***951.- ***862.-
detaepeRsessalCforebmuN ***651. ***783.
erocShtaMTCA ***741.- ***161.-
nwardhtiWsessalCforebmuN ***631. ***342.
erocSetisopmoCTCA ***911.- ***061.-
erocShsilgnETCA ***411.- ***761.-
supmaC-nOdeyolpmEsretsemeSlatoT ***901.- 230.-
erocSgnidaeRTCA ***301.- ***531.-
)sraeyssorcalatot(noitubirtnoCylimaFdetcepxE ***790.- 320.-
)sraeyssorcalatot(deeNlaicnaniFtemnU ***190. **160.
noitaudarGtaegarevAtnioPedarG **760.- ***152.-
leveLnoitacudEs'rehtoM *660.- 140.-
gnirpSdnallaFnidenraEsruoHtiderCtnedutSsretsemeS
**850. ***932.
ssorcalatot(devieceRsralloDtnarGdesaB-deeN-noN)sraey
**650.- **560.-
sessalCnoitacudElareneGniegarevAtnioPedarG *150.- ***622.-
sessalC.dEevitarepooCforebmuN *440. ***472.
ssorcalatot(devieceRsralloDnaoLdesaB-deeN)sraey
*240. ***270.
latot(devieceRsralloDtnemyolpmEdesaB-deeN)sraeyssorca
430.- 400.
noitacudElareneGnidenraEsruoHtiderCtnedutSsessalC
430. 220.
erocSgninosaeRecneicSTCA 330.- **170.-
leveLnoitacudEs'rehtaF 130.- 030.-
ssorcalatot(devieceRsralloDtnarGdesaB-deeN)sraey
130. **460.
noitaudarGtasroniMforebmuN 320.- **850.-
ssorcalatot(devieceRsralloDnaoLdesaB-deeN-noN)sraey
400. 830.
noitaudarGtasrojaMforebmuN 200.- ***970.
100.<p***10.<p**50.<p*
Table 4Correlations of Semesters Elapsed and Semesters Enrolled with Various Other Variables
IR Applications, Number 2, Time to Bachelor’s. . .....
9
Table 5Regression Analysis Summary for Predicting Semesters Elapsed Prior to Degree Attainment
elbairaV B BES ß
tnapicitraPmargorPegnellahCsseccuSremmuS 976.1 211. ***665.-
noitaudarGtadenraEsruoHtiderCtnedutS 900.0 200. ***912.
retsemeSrepdenraEsruoHtiderCtnedutSegarevA 040.0- 110. ***202.-
tnapicitraPymedacApihsredaeLs'tnediserP 753.0- 821. **031.-
sutatSdiAlaicnaniFtnednepeD 575.0 791. **211.
ssalC001ICDEnidellornE 390.0- 840. 280.-
derrefsnarTsruoHtiderCtnedutS 400.0- 300. 080.-
tnapicitraPmargorPsronoH 170.0 240. 870.
sessalC.dEevitarepooCforebmuN 320.0 710. 270.
seitinamuH-S&A:egelloC 931.0 390. 170.
tnapicitraPmargorPdraobgnirpS 980.0 950. 760.
noitartsinimdAssenisuB:egelloC 850.0 940. 460.
ssorcalatot(devieceRsralloDnaoLdesaB-deeN-noN)sraey
000.0 000. 160.
tnapicitraPmargorPsnoitpOtnemllornEyradnoceStsoP 160.0- 540. 160.-
sronoHhtiwdetaudarG 040.0- 130. 950.-
snoitacinummoC-S&A:egelloC 360.0 550. 750.
tnapicitraPytinummoClaitnediseRsecneicShtlaeH 511.0 870. 550.
noitaudarGtasrojaMforebmuN 870.0- 060. 550.-
secneicSlaicoS-S&A:egelloC 550.0 650. 450.
noitaudarGtasroniMforebmuN 030.0 920. 050.
ecneicSdnahtaM-S&A:egelloC 850.0 460. 940.
noitacudElareneGnidenraEsruoHtiderCtnedutSsessalC
200.0 200. 940.
ygolonhceT:egelloC 101.0- 490. 840.-
detaepeRsessalCforebmuN 820.0 720. 640.
nwardhtiWsessalCforebmuN 130.0- 920. 340.-
)sraeyssorcalatot(devieceRsralloDnaoLdesaB-deeN 000.0 000. 140.
tnediseRetatS 860.0- 170. 140.-
raeYnamhserFfodnEtadenraEsruoHtiderCtnedutS 200.0 300. 930.
margorPdetiderccA 420.0 930. 430.
diAlaicnaniFdevieceR 570.0- 980. 430.-
tnapicitraPspuorGtseretnInamhserF 740.0- 650. 330.-
supmaC-ffOdeyolpmEsretrauQlatoT 300.0 400. 330.
strA-strAlacisuM/S&A:egelloC 830.0 160. 230.
ssorcalatot(devieceRsralloDtnarGdesaB-deeN-noN)sraey
000.0 000. 820.
leveLnoitacudEs'rehtoM 500.0 800. 420.
)sraeyssorcalatot(noitubirtnoCylimaFdetcepxE 000.0- 000. 420.-
erocSetisopmoCTCA 200.0- 500. 220.-
ssalC590HTAMnidellornE 220.0 640. 020.
)roloCfotnedutS(yticinhtE/ecaR 620.0 560. 910.
leveLnoitacudEs'rehtaF 400.0- 800. 810.-
deliaFsessalCforebmuN 010.0- 720. 710.-
secivreSnamuHdnahtlaeH:egelloC 510.0 050. 410.
segnahCrojaMforebmuN 500.0- 410. 410.-
tnapicitraPscitelhtAetaigellocretnI 700.0 320. 210.

IR Applications, Number 2, Time to Bachelor’s. . .. .. .. .. .
10
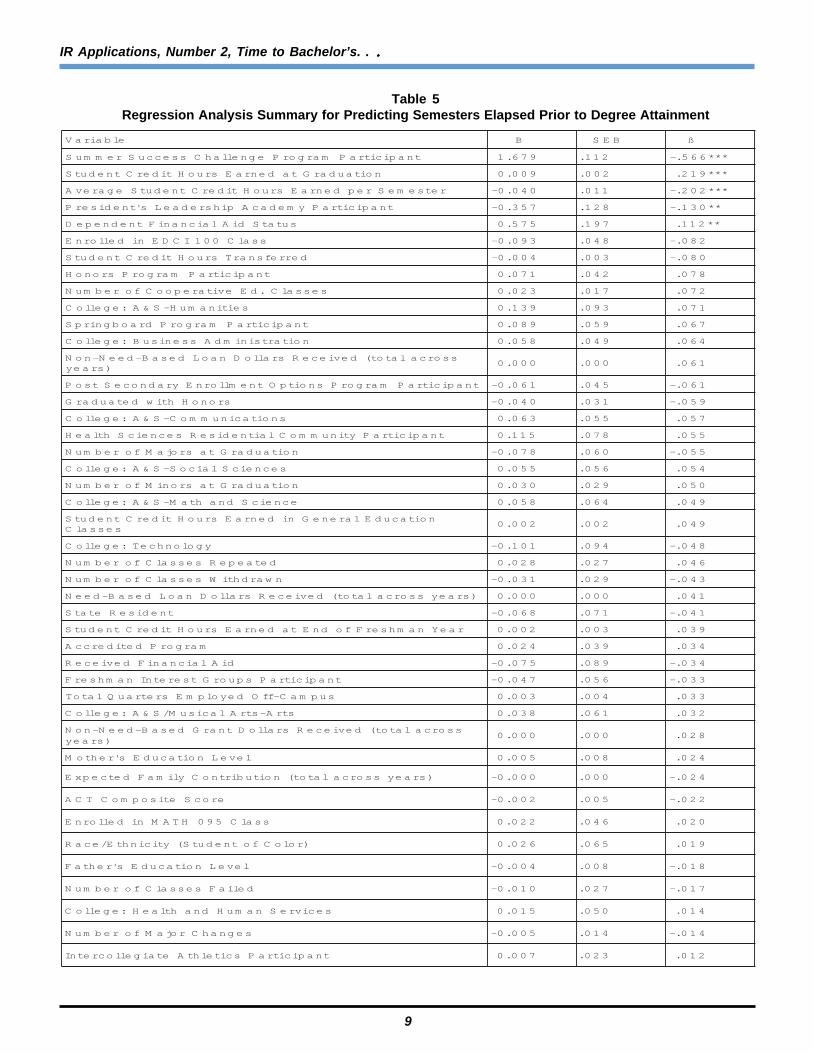
Multivariate AnalysesThe results of the regression analysis with semesters
elapsed prior to degree attainment as the dependentvariable are shown in Table 5. The regression modelexplained 48% of the variance in total semesters elapsedto degree attainment. The significant predictors with thelargest effect sizes included participation in the SummerSuccess Challenge Program, average student credit hoursearned per semester, participation in the President’sLeadership Academy (related to decreased time-to-degreeattainment), student credit hours earned at the time ofgraduation, and students being defined as dependent forfinancial aid purposes (related to increased time-to-degreeattainment).
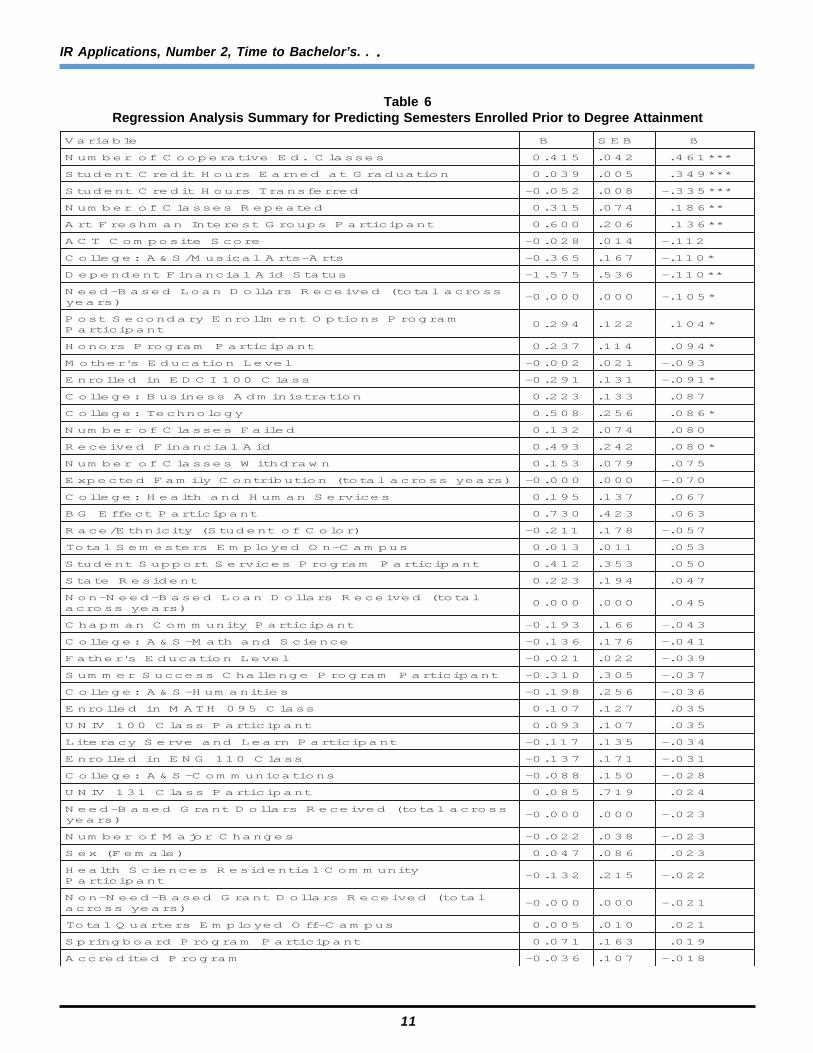
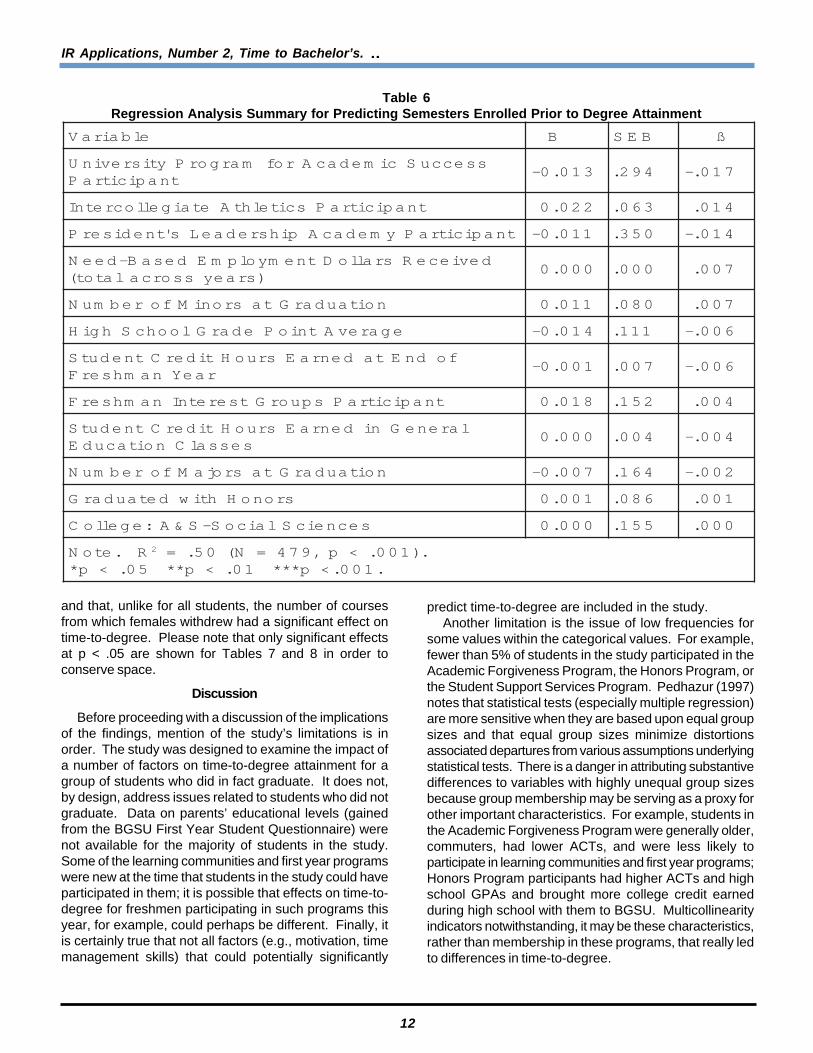
The results of the regression analysis with semestersenrolled prior to degree attainment as the dependentvariable are shown in Table 6. The regression modelexplained 50% of the variance in semesters enrolled todegree attainment. The significant predictors with thelargest effect sizes included student credit hourstransferred, graduation in the arts disciplines, studentsbeing defined as dependent for financial aid purposes,
need-based loan dollars received, students enrolling in theCollege Reading and Learning Skills (EDCI 100) class(related to decreased time-to-degree attainment), thenumber of cooperative education classes completed,student credit hours earned at graduation, the number ofclasses repeated, participation in the Art Freshman InterestGroups Program, participation in the Post SecondaryEnrollment Options Program, participation in the HonorsProgram, graduation from the College of Technology, andstudents receipt of financial aid (related to increased time-to-degree attainment).
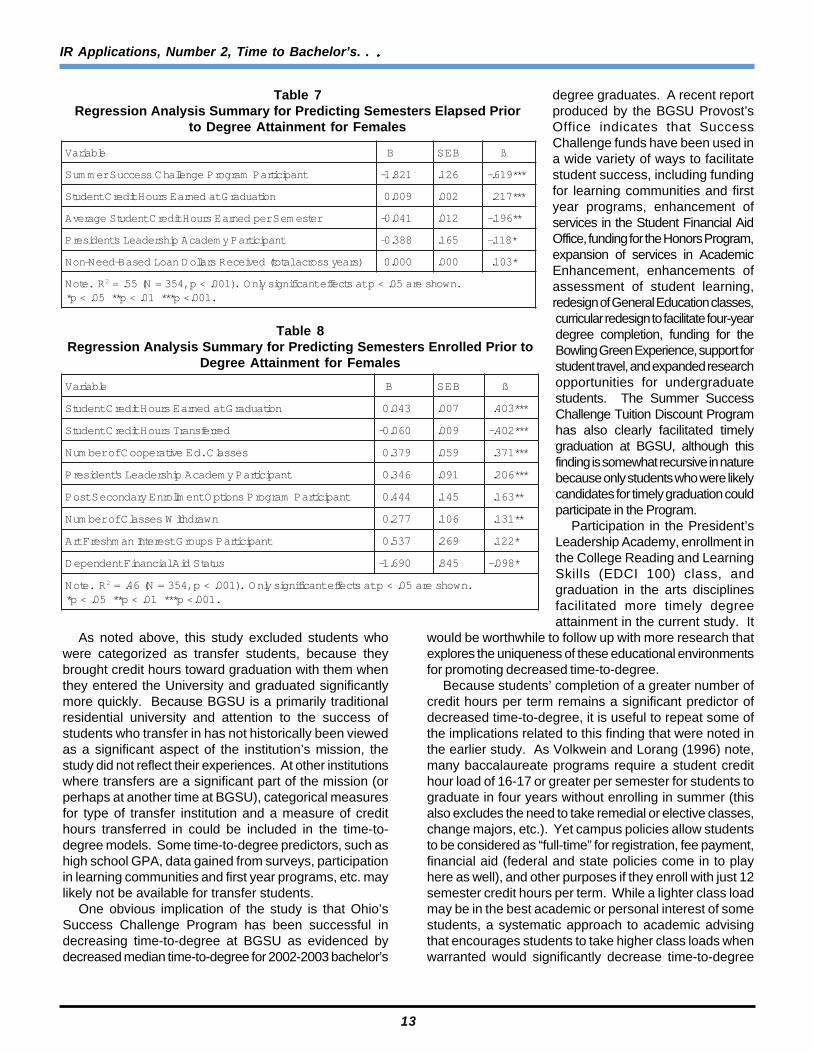
The multiple regression analyses were carried outseparately for females to examine conditional effects ontime-to-degree. The effects for females on semesterselapsed prior to degree attainment (shown in Table 7 onpg. 13) were similar to the results for all students, exceptthat dependent financial aid status was not significant forfemales and average non-need-based loan dollars receivedwas a significant predictor. Table 8 (pg. 13) shows asimilar pattern of effects for females on semesters enrolledprior to degree completion as for the whole population,except that participation in the Post Secondary EnrollmentOptions Program had an even greater effect for females,
elbairaV B BES ß
margorPsecivreStroppuStnedutStnapicitraP
530.0- 921. 210.-
tnapicitraPssalC001VINU 110.0 930. 210.
latot(devieceRsralloDtnarGdesaB-deeN)sraeyssorca
000.0 000. 110.
ssalC011GNEnidellornE 510.0- 260. 010.-
)elameF(xeS 700.0- 130. 900.-
tnapicitraPssalC131VINU 630.0 262. 500.
spuorGtseretnInamhserFtrA tnapicitraP 700.0 670. 400.
egarevAtnioPedarGloohcShgiH 300.0 140. 400.
sseccuScimedacArofmargorPytisrevinUtnapicitraP
700.0- 701. 300.-
supmaC-nOdeyolpmEsretsemeSlatoT 000.0 400. 200.-
tnapicitraPtceffEGB 200.0 551. 000.
tnapicitraPnraeLdnaevreSycaretiL 000.0 940. 000.
R.etoN 2 .)100.<p,974=N(84.=.100.<p***10.<p**50.<p*
Table 5 (continued)Regression Analysis Summary for Predicting Semesters Elapsed Prior to Degree Attainment
IR Applications, Number 2, Time to Bachelor’s. . .....
11
elbairaV B BES ß
sessalC.dEevitarepooCforebmuN 514.0 240. ***164.
noitaudarGtadenraEsruoHtiderCtnedutS 930.0 500. ***943.
derrefsnarTsruoHtiderCtnedutS 250.0- 800. ***533.-
detaepeRsessalCforebmuN 513.0 470. **681.
tnapicitraPspuorGtseretnInamhserFtrA 006.0 602. **631.
erocSetisopmoCTCA 820.0- 410. 211.-
strA-strAlacisuM/S&A:egelloC 563.0- 761. *011.-
sutatSdiAlaicnaniFtnednepeD 575.1- 635. **011.-
ssorcalatot(devieceRsralloDnaoLdesaB-deeN)sraey
000.0- 000. *501.-
margorPsnoitpOtnemllornEyradnoceStsoPtnapicitraP
492.0 221. *401.
tnapicitraPmargorPsronoH 732.0 411. *490.
leveLnoitacudEs'rehtoM 200.0- 120. 390.-
ssalC001ICDEnidellornE 192.0- 131. *190.-
noitartsinimdAssenisuB:egelloC 322.0 331. 780.
ygolonhceT:egelloC 805.0 652. *680.
deliaFsessalCforebmuN 231.0 470. 080.
diAlaicnaniFdevieceR 394.0 242. *080.
nwardhtiWsessalCforebmuN 351.0 970. 570.
)sraeyssorcalatot(noitubirtnoCylimaFdetcepxE 000.0- 000. 070.-
secivreSnamuHdnahtlaeH:egelloC 591.0 731. 760.
tnapicitraPtceffEGB 037.0 324. 360.
)roloCfotnedutS(yticinhtE/ecaR 112.0- 871. 750.-
supmaC-nOdeyolpmEsretsemeSlatoT 310.0 110. 350.
tnapicitraPmargorPsecivreStroppuStnedutS 214.0 353. 050.
tnediseRetatS 322.0 491. 740.
latot(devieceRsralloDnaoLdesaB-deeN-noN)sraeyssorca
000.0 000. 540.
tnapicitraPytinummoCnampahC 391.0- 661. 340.-
ecneicSdnahtaM-S&A:egelloC 631.0- 671. 140.-
leveLnoitacudEs'rehtaF 120.0- 220. 930.-
tnapicitraPmargorPegnellahCsseccuSremmuS 013.0- 503. 730.-
seitinamuH-S&A:egelloC 891.0- 652. 630.-
ssalC590HTAMnidellornE 701.0 721. 530.
tnapicitraPssalC001VINU 390.0 701. 530.
tnapicitraPnraeLdnaevreSycaretiL 711.0- 531. 430.-
ssalC011GNEnidellornE 731.0- 171. 130.-
snoitacinummoC-S&A:egelloC 880.0- 051. 820.-
tnapicitraPssalC131VINU 580.0 917. 420.
ssorcalatot(devieceRsralloDtnarGdesaB-deeN)sraey
000.0- 000. 320.-
segnahCrojaMforebmuN 220.0- 830. 320.-
)elameF(xeS 740.0 680. 320.
ytinummoClaitnediseRsecneicShtlaeHtnapicitraP
231.0- 512. 220.-
latot(devieceRsralloDtnarGdesaB-deeN-noN)sraeyssorca
000.0- 000. 120.-
supmaC-ffOdeyolpmEsretrauQlatoT 500.0 010. 120.
tnapicitraPmargorPdraobgnirpS 170.0 361. 910.
margorPdetiderccA 630.0- 701. 810.-
Table 6Regression Analysis Summary for Predicting Semesters Enrolled Prior to Degree Attainment
IR Applications, Number 2, Time to Bachelor’s. . .. .. .. .. .
12
and that, unlike for all students, the number of coursesfrom which females withdrew had a significant effect ontime-to-degree. Please note that only significant effectsat p < .05 are shown for Tables 7 and 8 in order toconserve space.
Discussion
Before proceeding with a discussion of the implicationsof the findings, mention of the study’s limitations is inorder. The study was designed to examine the impact ofa number of factors on time-to-degree attainment for agroup of students who did in fact graduate. It does not,by design, address issues related to students who did notgraduate. Data on parents’ educational levels (gainedfrom the BGSU First Year Student Questionnaire) werenot available for the majority of students in the study.Some of the learning communities and first year programswere new at the time that students in the study could haveparticipated in them; it is possible that effects on time-to-degree for freshmen participating in such programs thisyear, for example, could perhaps be different. Finally, itis certainly true that not all factors (e.g., motivation, timemanagement skills) that could potentially significantly
predict time-to-degree are included in the study.Another limitation is the issue of low frequencies for
some values within the categorical values. For example,fewer than 5% of students in the study participated in theAcademic Forgiveness Program, the Honors Program, orthe Student Support Services Program. Pedhazur (1997)notes that statistical tests (especially multiple regression)are more sensitive when they are based upon equal groupsizes and that equal group sizes minimize distortionsassociated departures from various assumptions underlyingstatistical tests. There is a danger in attributing substantivedifferences to variables with highly unequal group sizesbecause group membership may be serving as a proxy forother important characteristics. For example, students inthe Academic Forgiveness Program were generally older,commuters, had lower ACTs, and were less likely toparticipate in learning communities and first year programs;Honors Program participants had higher ACTs and highschool GPAs and brought more college credit earnedduring high school with them to BGSU. Multicollinearityindicators notwithstanding, it may be these characteristics,rather than membership in these programs, that really ledto differences in time-to-degree.
elbairaV B BES ß
sseccuScimedacArofmargorPytisrevinUtnapicitraP
310.0- 492. 710.-
tnapicitraPscitelhtAetaigellocretnI 220.0 360. 410.
tnapicitraPymedacApihsredaeLs'tnediserP 110.0- 053. 410.-
devieceRsralloDtnemyolpmEdesaB-deeN)sraeyssorcalatot(
000.0 000. 700.
noitaudarGtasroniMforebmuN 110.0 080. 700.
egarevAtnioPedarGloohcShgiH 410.0- 111. 600.-
fodnEtadenraEsruoHtiderCtnedutSraeYnamhserF
100.0- 700. 600.-
tnapicitraPspuorGtseretnInamhserF 810.0 251. 400.
lareneGnidenraEsruoHtiderCtnedutSsessalCnoitacudE
000.0 400. 400.-
noitaudarGtasrojaMforebmuN 700.0- 461. 200.-
sronoHhtiwdetaudarG 100.0 680. 100.
secneicSlaicoS-S&A:egelloC 000.0 551. 000.
R.etoN 2 .)100.<p,974=N(05.=.100.<p***10.<p**50.<p*
Table 6Regression Analysis Summary for Predicting Semesters Enrolled Prior to Degree Attainment
IR Applications, Number 2, Time to Bachelor’s. . .....
13
As noted above, this study excluded students whowere categorized as transfer students, because theybrought credit hours toward graduation with them whenthey entered the University and graduated significantlymore quickly. Because BGSU is a primarily traditionalresidential university and attention to the success ofstudents who transfer in has not historically been viewedas a significant aspect of the institution’s mission, thestudy did not reflect their experiences. At other institutionswhere transfers are a significant part of the mission (orperhaps at another time at BGSU), categorical measuresfor type of transfer institution and a measure of credithours transferred in could be included in the time-to-degree models. Some time-to-degree predictors, such ashigh school GPA, data gained from surveys, participationin learning communities and first year programs, etc. maylikely not be available for transfer students.
One obvious implication of the study is that Ohio’sSuccess Challenge Program has been successful indecreasing time-to-degree at BGSU as evidenced bydecreased median time-to-degree for 2002-2003 bachelor’s
degree graduates. A recent reportproduced by the BGSU Provost’sOffice indicates that SuccessChallenge funds have been used ina wide variety of ways to facilitatestudent success, including fundingfor learning communities and firstyear programs, enhancement ofservices in the Student Financial AidOffice, funding for the Honors Program,expansion of services in AcademicEnhancement, enhancements ofassessment of student learning,redesign of General Education classes,curricular redesign to facilitate four-yeardegree completion, funding for theBowling Green Experience, support forstudent travel, and expanded researchopportunities for undergraduatestudents. The Summer SuccessChallenge Tuition Discount Programhas also clearly facilitated timelygraduation at BGSU, although thisfinding is somewhat recursive in naturebecause only students who were likelycandidates for timely graduation couldparticipate in the Program.
Participation in the President’sLeadership Academy, enrollment inthe College Reading and LearningSkills (EDCI 100) class, andgraduation in the arts disciplinesfacilitated more timely degreeattainment in the current study. It
would be worthwhile to follow up with more research thatexplores the uniqueness of these educational environmentsfor promoting decreased time-to-degree.
Because students’ completion of a greater number ofcredit hours per term remains a significant predictor ofdecreased time-to-degree, it is useful to repeat some ofthe implications related to this finding that were noted inthe earlier study. As Volkwein and Lorang (1996) note,many baccalaureate programs require a student credithour load of 16-17 or greater per semester for students tograduate in four years without enrolling in summer (thisalso excludes the need to take remedial or elective classes,change majors, etc.). Yet campus policies allow studentsto be considered as “full-time” for registration, fee payment,financial aid (federal and state policies come in to playhere as well), and other purposes if they enroll with just 12semester credit hours per term. While a lighter class loadmay be in the best academic or personal interest of somestudents, a systematic approach to academic advisingthat encourages students to take higher class loads whenwarranted would significantly decrease time-to-degree
elbairaV B BES ß
tnapicitraPmargorPegnellahCsseccuSremmuS 128.1- 621. ***916.-
noitaudarGtadenraEsruoHtiderCtnedutS 900.0 200. ***712.
retsemeSrepdenraEsruoHtiderCtnedutSegarevA 140.0- 210. **691.-
tnapicitraPymedacApihsredaeLs'tnediserP 883.0- 561. *811.-
)sraeyssorcalatot(devieceRsralloDnaoLdesaB-deeN-noN 000.0 000. *301.
R.etoN 2 .nwohsera50.<ptastceffetnacifingisylnO.)100.<p,453=N(55.=.100.<p***10.<p**50.<p*
Table 7Regression Analysis Summary for Predicting Semesters Elapsed Prior
to Degree Attainment for Females
elbairaV B BES ß
noitaudarGtadenraEsruoHtiderCtnedutS 340.0 700. ***304.
derrefsnarTsruoHtiderCtnedutS 060.0- 900. ***204.-
sessalC.dEevitarepooCforebmuN 973.0 950. ***173.
tnapicitraPymedacApihsredaeLs'tnediserP 643.0 190. ***602.
tnapicitraPmargorPsnoitpOtnemllornEyradnoceStsoP 444.0 541. **361.
nwardhtiWsessalCforebmuN 772.0 601. **131.
tnapicitraPspuorGtseretnInamhserFtrA 735.0 962. *221.
sutatSdiAlaicnaniFtnednepeD 096.1- 548. *890.-
R.etoN 2 .nwohsera50.<ptastceffetnacifingisylnO.)100.<p,453=N(64.=.100.<p***10.<p**50.<p*
Table 8Regression Analysis Summary for Predicting Semesters Enrolled Prior to
Degree Attainment for Females
IR Applications, Number 2, Time to Bachelor’s. . .. .. .. .. .
14
attainment for most students. Advising interventions mayalso help to decrease the number of failed, dropped, orrepeated classes.
As was the case in the Spring 2000 study, the fact thatenrollment in cooperative education classes had a relativelystrong effect upon increased time-to-degree illustrates theimportant caveat that timely degree completion is not allthat matters in terms of college student outcomes. Bothanalytical and student self-report evidence supports thefact that enrollment in cooperative education classes,involvement in internships, etc., while extending time-to-degree, significantly improves student learning and skilldevelopment, affective outcomes, career prospects, andthe like. Significantly reducing time-to-degree couldperhaps demand a trade-off against other long-term (andmaybe more important) outcomes. As is often the casein higher education policy and practice, and as has beenobserved by many, the actions we take and the outcomeswe hope to facilitate are ultimately a function of ourvalues. In that vein, decision makers should perhaps bereminded that the graduation (requiring whatever length oftime) of some at-risk students may be at least as importantas the timely graduation of all students.
It should be recognized that some interventions, suchas the efforts funded through the Success ChallengeProgram, can be carried out fairly quickly for currentcohorts of students, while others, such as encouragingenrollment behaviors that support more rapid graduation,will be most effective when applied to entering studentsand thus will take more time for their effects to be seen.Still others, such as recruiting large numbers of freshmenwho already have some college credit and changingfinancial aid policies, may require even longer terminstitutional attention. It should also be noted that not alleffects operate on students consistently during the wholetime that they are enrolled. (G. McLaughlin, personalcommunication, February 2, 2004). For example, students’ability to finance college may be more of a problem at theend of their college careers (as tuition rises, freshman-only scholarships are no longer available, family financialcircumstances change, etc.) than at the beginning, sothat employment may lengthen time-to-degree to a greaterextent in students’ final years. Finally, it is the case thatthe opposite of some factors that inhibit time-to-degreemay not necessarily facilitate it beyond a certain degree;to draw upon the previous example, not having sufficientfunds and needing to be employed may lengthen time-to-degree, but having more than enough funding will notnecessarily shorten it.
Editor’s Notes
This article discusses a topic becoming more importantin many institutions – the time it takes for students tocomplete a degree. As Knight notes – this is becomingan operational definition of the efficiency of an institution.
His use of multiple levels of statistics gives us a feel forwhat can be done with the different levels of sophistication.His use of a large and diverse set of independent measureshelps the reader understand that many of these factorsare related to the time required to complete a degree andtherefore the assessment of an institution’s “efficiency”must deal with the type of student and type of programsthat the institution provides.
There are several key points that are very interesting toconsider.
What is the appropriate measure of “time-to-degree”?When Knight used two alternatives he found that themetric made a difference. One might also use the numberof hours or courses taken. One might count summerterms and distance courses in alternative manners. Thepoint is that the selection of a dependent measure andhow it is measured is not a forgone conclusion. Thepresence of Web courses and independent paced coursesadds to the complication.
What is the best methodology to explain or to anticipate“time-to-degree”? The use of a specific methodology andmore importantly the use of specific variables is dependenton the use of the study. Knight notes the multicollinearity ofsome of the academic skills measures. He concludes thatsome of them should be deleted from the analysis. Onealternative is to use Path Analysis with its multiple equationsand its direct and indirect effects for those multicollinearitiesthat occur at different points like HS GPA, ACT, FreshmanGrades, etc. The limitation of needing to explain results isa real issue and in this case explains his selection of thesimpler linear regression methodology.
There is a third alternative that can be used in thesituation where there are multiple decision points: theselective inclusion of blocks of variables based on what isknown at a given point in time. For example, if one is tryingto estimate time-to-degree prior to admission, only thosemeasures known at that time would be included in theequation. If one were looking at making decisions aboutthe student after the first year, then a larger set of measureswould be included.
This use of blocks of variables based on point-in-timealso deals with the issue of using the average number ofhours that a student took per term. If the equation werebeing developed at the end of a students program then itmight be appropriate to include the average number of hoursper term for a dependent measure which looks at time-to-degree based on entrance to exit. On the other hand if theintent were to anticipate the time-to-degree based oncharacteristics following the first term of enrollment then ameasure of the number of hours taken in the first term wouldbe the independent variable appropriate to include.
What to do about transfer students and hours takenoutside the institution? While the demography for Knight’ssample is such that transfers can be excluded, there is anissue for those who have a large number of transfer
IR Applications, Number 2, Time to Bachelor’s. . .....
15
students. How should these students be included in ananalysis? How do you use prior experience as anindependent variable or set of variables? Do you need tosplit the transfers into different sub-groups and look fordifferent models?
This work joins an increasing exploration of studiesbased on national data bases as well as this type of studybased on a single institution’s data base. These nationalstudies, such as work by Clifford Adelman using theNational Education Longitudinal Study of 1988 (NELS:88)and by Alberto Cabrera using the High School and Beyonddata base (HS&B) are helping us understand that thepaths through our institutions are less and less likely tobe the traditional linear sequence of the past. Knightproperly includes transfer hours despite the exclusion oftransfers because more and more students, even thosewho begin as freshmen, are augmenting the courses intheir primary institution with credits from other sources.
In summary, as with any good research, Knight answersone set of questions – and raises the next set in the process.
References
Adelman, C. (1999). Answers in the tool box: Academicintensity, attendance patterns, and bachelor’s degreeattainment. Washington, DC: U. S. Department ofEducation, Office of Educational Research andImprovement.
Belcheir, M. J. (2000). Predicting the probability ofgraduating after four, five six, and ten years: Researchreport. Boise: Boise State University. (ERIC DocumentReproduction Services No. ED 443339).
Bers, T. H., and Seybert, J. A. (1999). Effectivereporting. Tallahassee, FL: The Association for InstitutionalResearch.
Bowling Green State University, Office of InstitutionalResearch. (2003). Toward a comprehensive predictivemodel of time to bachelor’s degree attainment: Areprise [On-line]. Available: http://www.bgsu.edu/offices/ir/studies/model03/2003.htm
California State Postsecondary Education Commission.(1988). Time to degree in California’s public universities.Factors contributing to the length of time.Sacramento: Author.
DesJardins, S. L., Ahlburg, A. A., and McCall, B. P.(2002). A temporal investigation of factors related totimely degree completion. Journal of Higher Education,73(5), 555-581.
Duby, P. and Schartman, L. (1997, May). Credit hourloads at college onset and subsequent academicperformance: A multi-institutional pilot project. Paperpresented at the Association for Institutional ResearchForum, Orlando, FL.
Hall, M. (1999, May). Why students take more than fouryears to graduate. Paper presented at the Association for
Institutional Research Forum, Seattle, WA.Ishitani, T. (2003, May). Exploring time to graduation:
Effects of pre-college characteristics and enrollmentbehavior on timely degree completion. Paper presented at theAssociation for Institutional Research Forum, Tampa, FL.
Knight, W. E. (1994, May). Why the five-year (orlonger) bachelors degree?: An exploratory study of timeto degree attainment. Paper presented at the Associationfor Institutional Research Forum, New Orleans, LA
Knight, W. E. (2002). Toward a comprehensive modelof influences upon time to bachelor’s degree attainment.AIR Professional File, 85.
Knight, W. E. (2003). Knight, W. E. (2003). Learningcommunities and first year programs: Lessons forplanners. Planning for Higher Education, 31(4), 5-12.
Lam, L. P. T. (1999, May). Assessing financial aidimpacts on time-to-degree for n o n t r a n s f e rundergraduate students at a large urban public university.Paper presented at the Association for InstitutionalResearch Forum, Seattle, WA.
McLaughlin, G. W., Howard, R. D., Balkan, L. A., andBlythe, E. W. (1998). People, processes, and managing data.Tallahassee, FL: The Association for Institutional Research.
Mertler, C. A. and Vannatta, R. A. (2002). Advancedmultivariate statistical methods: Practical application andinterpretation. Los Angeles: Pyrczak.
Noxel, S. and Katunich, L. (1998, May). Navigating forfour years to the baccalaureate degree. Paper presentedat the Association for Institutional Research Forum,Minneapolis, MN.
Oklahoma State Regents for Higher Education. (1996).Time-to-degree completion. A system-wide survey ofOklahoma college and university students. OklahomaCity: Author.
Pedhazur, E. J. (1997). Multiple regression in behavioralresearch (3rd ed.). Fort Worth, TX: Harcourt Brace CollegePublishers.
Volkwein, J. F. and Lorang, W. G. (1996).Characteristics of extenders: Full-time students whotake light credit loads and graduate in more than fouryears. Research in Higher Education, 37(1): 43-68.
Zhu, L. (2003,November). Who attains a bachelor’sdegree in four years? Paper presented at the NortheastAssociation for Institutional research annualconference, Newport, RI.
End Note1 The appropriateness of moderating the regression
equation on gender can be checked by looking at thecombined Error SS from the moderated regressions andthe Error SS from the combined equation. The smallercombined ESS is associated with the decrease in Error dfand the ratio of the decreases is an estimate of varianceindependent of the smaller estimate, so the ratio isdistributed as an f statistic (G. McLaughlin, personalcommunication, May 15, 2004). In this study the ratiowas not statistically significant.
IR Applications, Number 2, Time to Bachelor’s. . .. .. .. .. .
16
Dr. Anne Marie DelaneyDirector
Institutional ResearchBabson College
Babson Park, MA
Dr. Gerald H. GaitherDirector
Institutional ResearchPrairie View A&M University
Prairie View, TX
Dr. David Jamieson-DrakeDirector
Institutional ResearchDuke University
Durham, NC
Dr. Anne MachungPrincipal Policy Analyst
Policy and AnalysisUniversity of California
Oakland, CA
Editor:Gerald W. McLaughlin
Director of Planning and InstitutionalResearch
DePaul University1 East Jackson, Suite 1501
Chicago, IL 60604-2216Phone: 312/362-8403Fax: 312/362-5918
AIR IR Applications Editorial Board
Managing Editor:Dr. Terrence R. Russell
Executive DirectorAssociation for Institutional Research
222 Stone BuildingFlorida State University
Tallahassee, FL 32306-4462Phone: 850/644-4470Fax: 850/[email protected]
Authors can submit contributions from various sources such as a Forum presentation or an individual article. The articlesshould be 10-15 double-spaced pages, and include an abstract and references. Reviewers will rate the quality of an articleas well as indicate the appropriateness for the alternatives. For articles accepted for IR Applications, the author andreviewers may be asked for comments and considerations on the application of the methodologies the articles discuss.
Articles accepted for IR Applications will be published on the AIR Web site and will be available for download by AIRmembers as a PDF document. Because of the characteristics of Web-publishing, articles will be published upon availabilityproviding members timely access to the material.
Please send manuscripts and/or inquiries regarding IR Applications to Dr. Gerald McLaughlin.
IR Applications is an AIR refereed publication that publishes articles focused on the application of advanced andspecialized methodologies. The articles address applying qualitative and quantitative techniques to the processes usedto support higher education management.
Dr. Philip GarciaDirector of
Analytical StudiesCalifornia State University-Long Beach
Long Beach, CA
Dr. David Jamieson-DrakeDirector of
Institutional ResearchDuke University
Durham, NC
Dr. Anne MachungPrincipal Policy AnalystUniversity of California
Oakland, CA
Dr. Marie RichmanAssistant Director ofAnalytical Studies
University of California-IrvineIrvine, CA
Dr. Jeffrey A. SeybertDirector of
Institutional ResearchJohnson County Community College
Overland Park, KS
Dr. Bruce SzelestAssociate Director ofInstitutional Research
SUNY-AlbanyAlbany, NY
Dr. Glenn W. JamesDirector of
Institutional ResearchTennessee Technological University
Cookeville, TN
Dr. Trudy H. BersSenior Director of
Research, Curriculum and Planning
Oakton Community CollegeDes Plaines, IL