Embed Size (px)
Citation preview

IPv4 Address Lifetime
Presented by Nurani Nimpuno, APNIC
Research activityconducted by Geoff Huston
and supported by APNIC

Background
• All four RIRs publish their allocation data– Part of RIR responsibility– Published in response to need and increased interest in IPv4
consumption rates• http://www.aso.icann.org/stats/
• Few attempts in the past to predict future trends and consumption rates– Some based on market predictions, technology growth– Task not easy due to imperfect data
• Recent efforts made by RIRs to clean up data
• Geoff Huston, chief scientist in the Internet area at Telstra, has studied the IPv4 allocation data– Projections based on current and past utilisation rates

Modeling the Process
1. IETF definition of IPv4– Source: IETF standards (RFCs)
• Delegation of address space for IANA administration
2. IANA allocations to RIRs– Source: IANA IPv4 Address Registry
• Allocation of /8 blocks to RIRs and others
3. RIR allocations to ISPs– Source: RIR Stats files
• Allocation of blocks to LIRs
4. ISP announcements – Source: BGP routing table
• Amount of address space advertised

IETF Reserved, 20.1, 8%
Multicast, 16, 6%
Unicast, 219.9, 86%
1. IETF Delegations – IPv4
Breakdown of IPv4 address Space by /8 block equivalents

IETF Reserved, 20.1, 8%
Multicast, 16, 6%
IANA Pool, 89, 35%
IANA Allocated, 130.9, 51%
IANA Allocations - Current
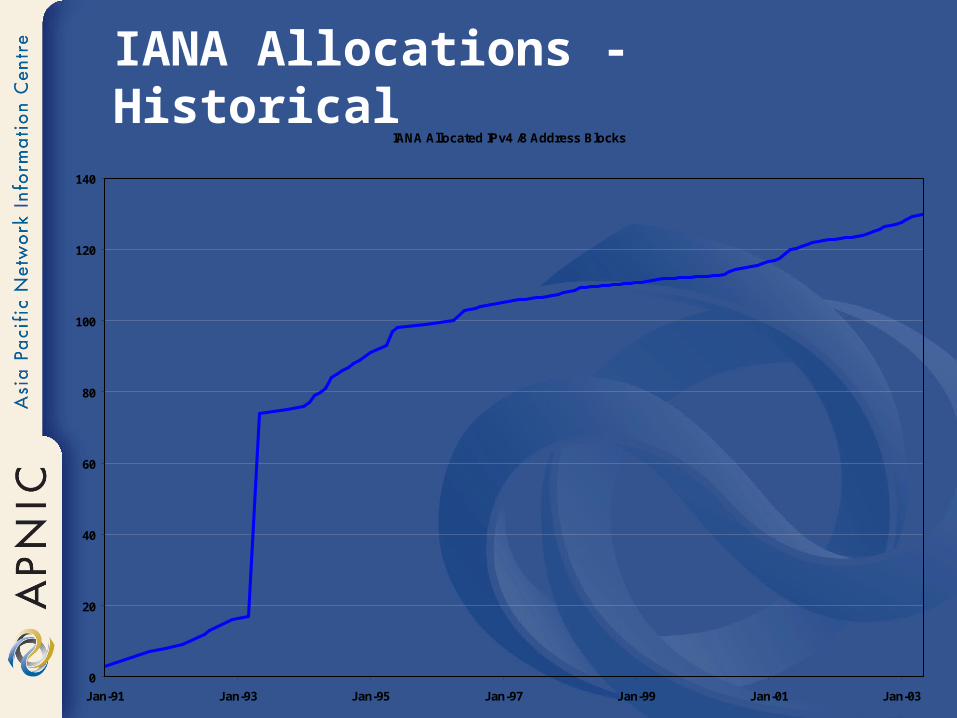
IANA Allocations - HistoricalIANA Allocated IPv4 /8 Address Blocks
0
20
40
60
80
100
120
140
Jan-91 Jan-93 Jan-95 Jan-97 Jan-99 Jan-01 Jan-03

RIR Allocations - Current
IETF Reserved, 20.1, 8%
Multicast, 16, 6%
IANA Pool, 89, 35%
RIR Pool, 14, 5%
Assigned, 116.9, 46%Allocated

RIR Allocations - Historical
RIR Assigned IPv4 /8 Address Blocks
0
20
40
60
80
100
120
Jan-83 Jan-85 Jan-87 Jan-89 Jan-91 Jan-93 Jan-95 Jan-97 Jan-99 Jan-01 Jan-03

BGP Routing Table
• The BGP routing table spans a set of advertised addresses– Representing addresses in use by ISPs
• A similar analysis of usage and projection can be undertaken on this data
• Assumption: BGP routing table represents actual IP address usage– Therefore it “drives” the other trends
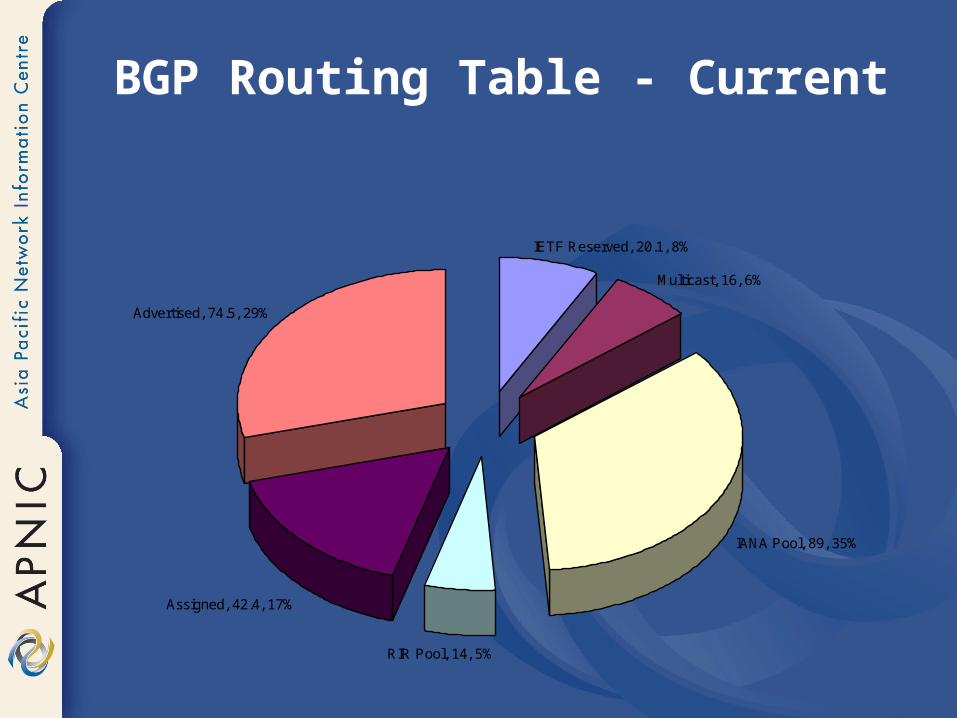
BGP Routing Table - Current
IETF Reserved, 20.1, 8%
Multicast, 16, 6%
IANA Pool, 89, 35%
RIR Pool, 14, 5%
Assigned, 42.4, 17%
Advertised, 74.5, 29%

BGP Announcements - HistoricalBGP Table - Address Span
0
50
100
150
200
Nov
/99
Jan/
00
Mar
/00
May
/00
Jul/0
0
Sep
/00
Nov
/00
Jan/
01
Mar
/01
May
/01
Jul/0
1
Sep
/01
Nov
/01
Jan/
02
Mar
/02
May
/02
Jul/0
2
Sep
/02
Nov
/02
Jan/
03
Mar
/03
May
/03

Combining the DataIPv4 Address Space
0
20
40
60
80
100
120
140
Jan-83 Jan-85 Jan-87 Jan-89 Jan-91 Jan-93 Jan-95 Jan-97 Jan-99 Jan-01 Jan-03
IANA
RIR
BGP

Recent DataIPv4 Address Space
0
20
40
60
80
100
120
140
Dec-99 Mar-00 Jun-00 Sep-00 Dec-00 Mar-01 Jun-01 Sep-01 Dec-01 Mar-02 Jun-02 Sep-02 Dec-02 Mar-03 Jun-03
IANA
RIR
BGP

Projections

Projections
• IANA & RIR Allocations– Any projection is very uncertain because of:
• Sensitivity of allocation rate to prevailing RIR policies• Sensitivity to any significant uptake up of new applications that
require end-to-end IPv4 addressing vs use of NATs
• BGP data– 3 year data baseline to obtain the projection
• Much shorter baseline than the IANA and RIR projections• Considerable uncertainties associated with this projection
– First order differential of total BGP announcement• Until 2000, exponential (accelerating) growth• Since 2000, oscillating differential and overall deceleration• Last 6 months, differential approaching 0 (i.e. no growth)
– Linear fit seems most appropriate for this data

Process model - exponential
2020 2022
0
32
64
96
128
160
192
224
Jan-00 Jan-02 Jan-04 Jan-06 Jan-08 Jan-10 Jan-12 Jan-14 Jan-16 Jan-18 Jan-20 Jan-22 Jan-24 Jan-26 Jan-28
IANA
RIR
BGP

Process model - exponential
2020 2022
2029
0
32
64
96
128
160
192
224
Jan-00 Jan-02 Jan-04 Jan-06 Jan-08 Jan-10 Jan-12 Jan-14 Jan-16 Jan-18 Jan-20 Jan-22 Jan-24 Jan-26 Jan-28
IANA
RIR
BGP
Unnann.
RIR pool
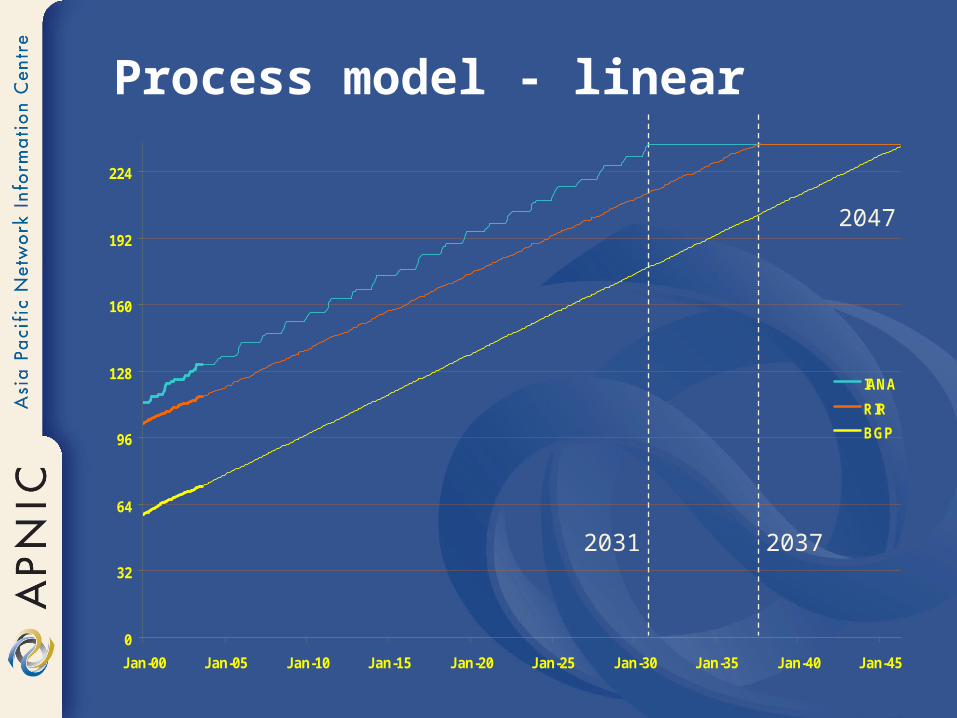
Process model - linear
2047
2031 2037
0
32
64
96
128
160
192
224
Jan-00 Jan-05 Jan-10 Jan-15 Jan-20 Jan-25 Jan-30 Jan-35 Jan-40 Jan-45
IANA
RIR
BGP

Methodology and Caveats
• Projection of based on 2000-2003 data–IANA and RIR allocation practices –BGP-based demand model
• Incorporating– RIR unallocated pool–Total address space including allocated but
unannounced
• Exponential growth model–Address space lasts until 2022–or 2029 if all unannounced space recovered
• Linear growth model–Address space lasts until 2037 (or 2047)

Some Big Issues
• This is just a model - reality will be different!• Will the BGP routing table continue to reflect
allocation rates? • Is the model of the unannounced pools and
RIR holding pools appropriate?• Externalities…
–What are the underlying growth drivers (applications and services) and how are these best modeled?
–What forms of disruptive events would alter this model, and to what extent?

Concluding thoughts…
• IP address management– Result of 20 year evolution on the Internet
• Supported Internet growth to date
• We are not running out of IP addresses now– But impossible to predict future
• Policies change• New technologies can emerge• Market behaviour can change
• What about IPv6?– RIRs support the deployment of IPv6 – Transition will take time
• Necessary to start now
• Responsible management essential to keep the Internet running

Questions?
[email protected]://www.potaroo.net
http://www.potaroo.net/ispcolumn/2003-07-v4-address-lifetime/ale.pdf


![Welcome! []...Presenters Nurani Nimpuno Outreach & Training Champika Wijayatunga ... • Routing chaos • Legacy routing structure, router overload • CIDR & aggregation are now](https://img.pdfslide.us/doc/110x75/5f728cf9bbe87d67442a2dc1/welcome-presenters-nurani-nimpuno-outreach-training-champika-wijayatunga.jpg)