Embed Size (px)
Citation preview
IPAA/TIPROLEADERS IN INDUSTRY LUNCHEON
February 8, 2017
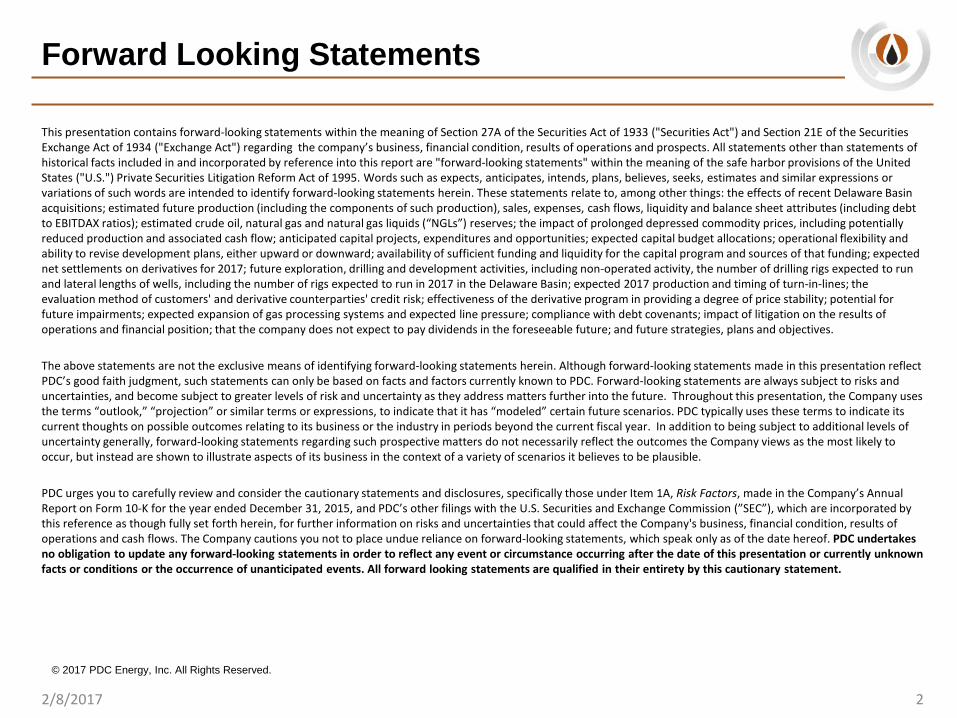
Forward Looking Statements
This presentation contains forward-looking statements within the meaning of Section 27A of the Securities Act of 1933 ("Securities Act") and Section 21E of the Securities Exchange Act of 1934 ("Exchange Act") regarding the company’s business, financial condition, results of operations and prospects. All statements other than statements of historical facts included in and incorporated by reference into this report are "forward-looking statements" within the meaning of the safe harbor provisions of the United States ("U.S.") Private Securities Litigation Reform Act of 1995. Words such as expects, anticipates, intends, plans, believes, seeks, estimates and similar expressions or variations of such words are intended to identify forward-looking statements herein. These statements relate to, among other things: the effects of recent Delaware Basin acquisitions; estimated future production (including the components of such production), sales, expenses, cash flows, liquidity and balance sheet attributes (including debt to EBITDAX ratios); estimated crude oil, natural gas and natural gas liquids (“NGLs”) reserves; the impact of prolonged depressed commodity prices, including potentially reduced production and associated cash flow; anticipated capital projects, expenditures and opportunities; expected capital budget allocations; operational flexibility and ability to revise development plans, either upward or downward; availability of sufficient funding and liquidity for the capital program and sources of that funding; expected net settlements on derivatives for 2017; future exploration, drilling and development activities, including non-operated activity, the number of drilling rigs expected to run and lateral lengths of wells, including the number of rigs expected to run in 2017 in the Delaware Basin; expected 2017 production and timing of turn-in-lines; the evaluation method of customers' and derivative counterparties' credit risk; effectiveness of the derivative program in providing a degree of price stability; potential for future impairments; expected expansion of gas processing systems and expected line pressure; compliance with debt covenants; impact of litigation on the results of operations and financial position; that the company does not expect to pay dividends in the foreseeable future; and future strategies, plans and objectives.
The above statements are not the exclusive means of identifying forward-looking statements herein. Although forward-looking statements made in this presentation reflect PDC’s good faith judgment, such statements can only be based on facts and factors currently known to PDC. Forward-looking statements are always subject to risks and uncertainties, and become subject to greater levels of risk and uncertainty as they address matters further into the future. Throughout this presentation, the Company uses the terms “outlook,” “projection” or similar terms or expressions, to indicate that it has “modeled” certain future scenarios. PDC typically uses these terms to indicate its current thoughts on possible outcomes relating to its business or the industry in periods beyond the current fiscal year. In addition to being subject to additional levels of uncertainty generally, forward-looking statements regarding such prospective matters do not necessarily reflect the outcomes the Company views as the most likely to occur, but instead are shown to illustrate aspects of its business in the context of a variety of scenarios it believes to be plausible.
PDC urges you to carefully review and consider the cautionary statements and disclosures, specifically those under Item 1A, Risk Factors, made in the Company’s Annual Report on Form 10-K for the year ended December 31, 2015, and PDC’s other filings with the U.S. Securities and Exchange Commission (”SEC”), which are incorporated by this reference as though fully set forth herein, for further information on risks and uncertainties that could affect the Company's business, financial condition, results of operations and cash flows. The Company cautions you not to place undue reliance on forward-looking statements, which speak only as of the date hereof. PDC undertakes no obligation to update any forward-looking statements in order to reflect any event or circumstance occurring after the date of this presentation or currently unknown facts or conditions or the occurrence of unanticipated events. All forward looking statements are qualified in their entirety by this cautionary statement.
22/8/2017
© 2017 PDC Energy, Inc. All Rights Reserved.
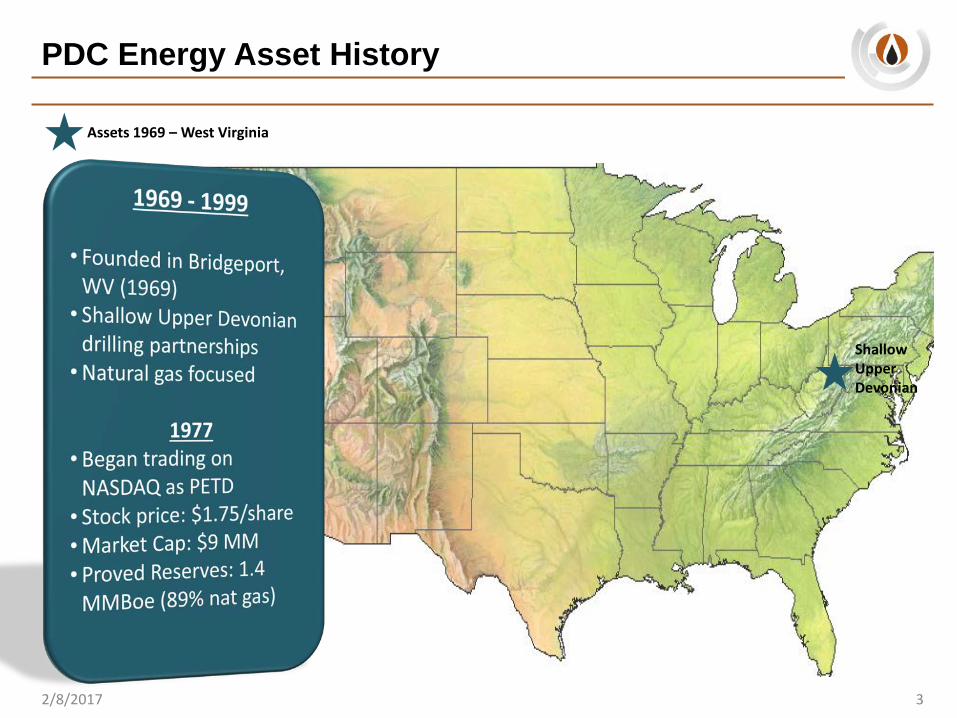
PDC Energy Asset History
32/8/2017
Assets 1969 – West Virginia
Shallow Upper Devonian
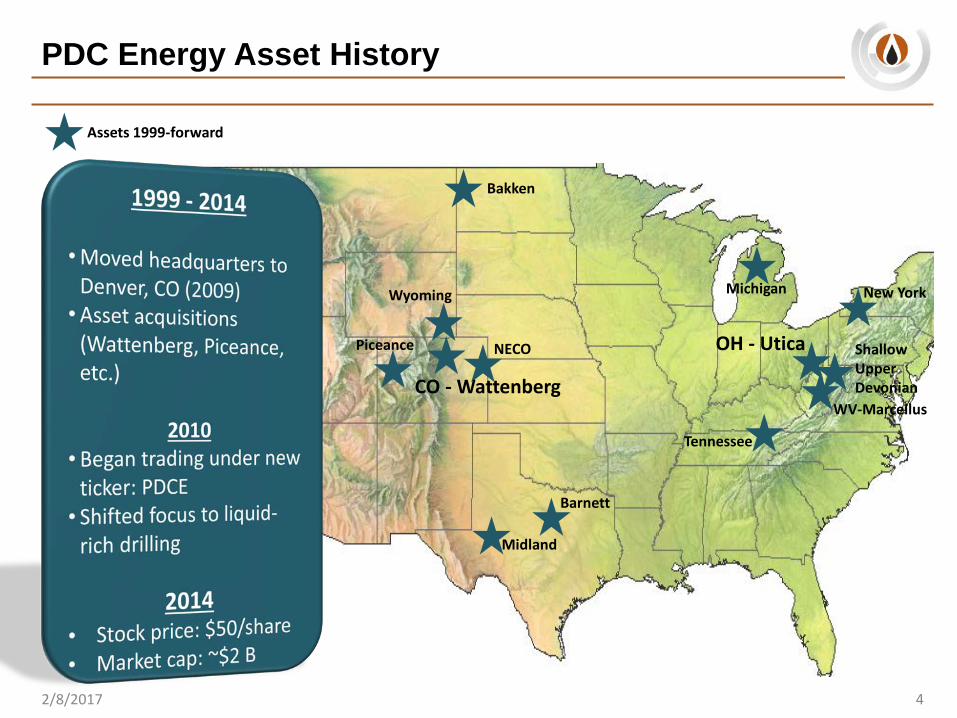
PDC Energy Asset History
42/8/2017
Assets 1999-forward
Michigan
Barnett
Bakken
Wyoming
Piceance NECO
Tennessee
New York
Midland
OH - Utica
CO - Wattenberg
Shallow Upper Devonian
WV-Marcellus
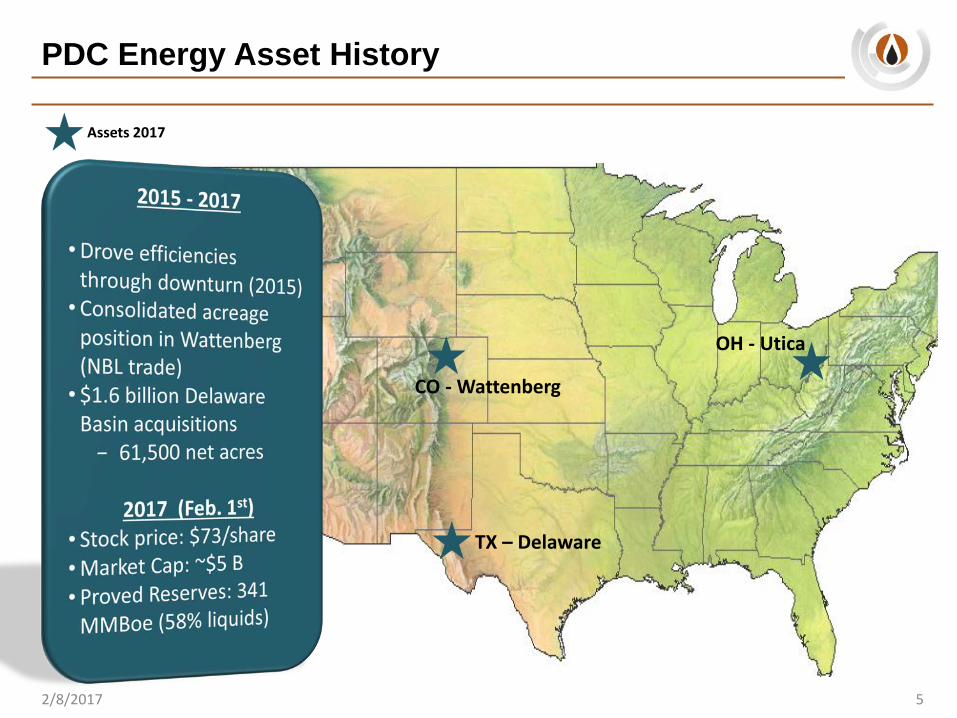
PDC Energy Asset History
52/8/2017
Assets 2017
OH - Utica
CO - Wattenberg
TX – Delaware
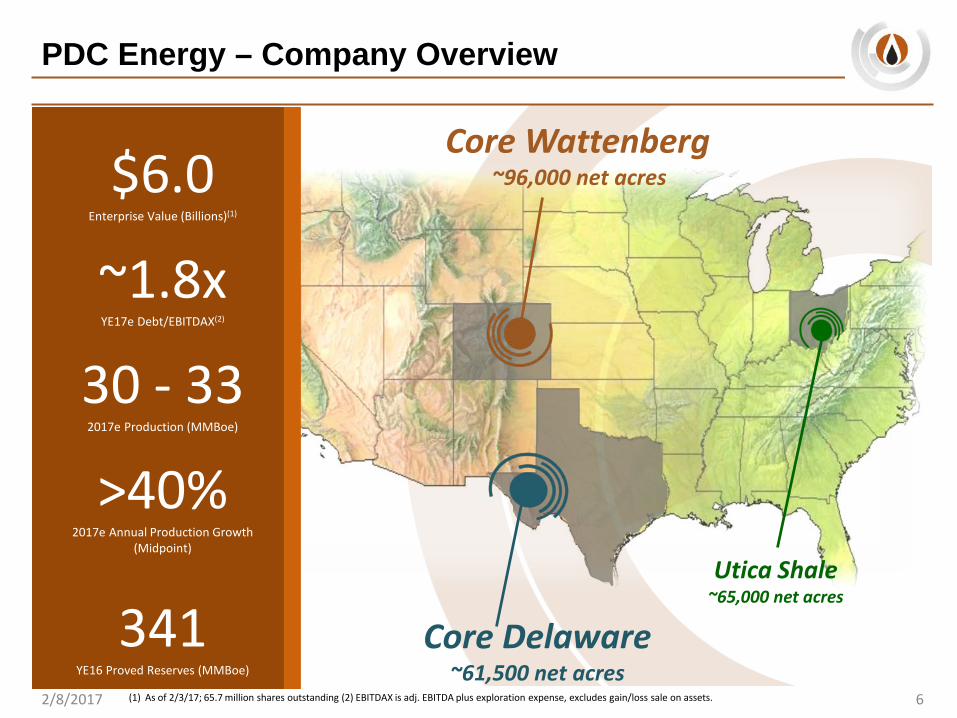
PDC Energy – Company Overview
2/8/2017 6
Core Wattenberg~96,000 net acres
Utica Shale~65,000 net acres
Core Delaware~61,500 net acres
(1) As of 2/3/17; 65.7 million shares outstanding (2) EBITDAX is adj. EBITDA plus exploration expense, excludes gain/loss sale on assets.
$6.0Enterprise Value (Billions)(1)
~1.8xYE17e Debt/EBITDAX(2)
30 - 332017e Production (MMBoe)
>40%2017e Annual Production Growth
(Midpoint)
341YE16 Proved Reserves (MMBoe)
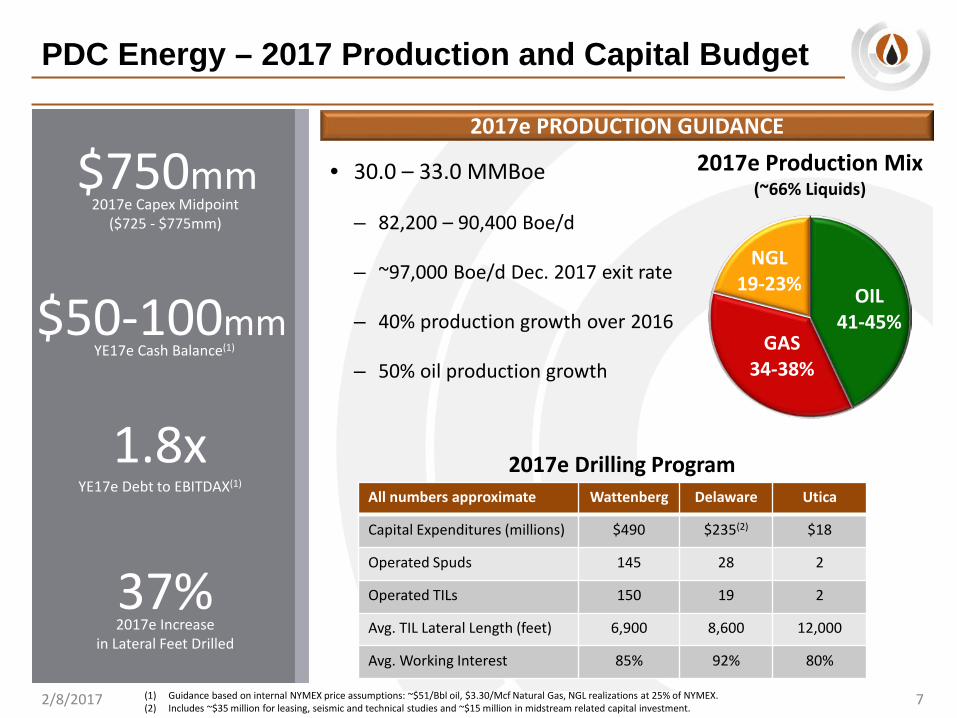
PDC Energy – 2017 Production and Capital Budget
2/8/2017 7
• 30.0 – 33.0 MMBoe
– 82,200 – 90,400 Boe/d
– ~97,000 Boe/d Dec. 2017 exit rate
– 40% production growth over 2016
– 50% oil production growth
2017e PRODUCTION GUIDANCE
$750mm2017e Capex Midpoint
($725 - $775mm)
1.8xYE17e Debt to EBITDAX(1)
37%2017e Increase
in Lateral Feet Drilled
$50-100mmYE17e Cash Balance(1)
All numbers approximate Wattenberg Delaware Utica
Capital Expenditures (millions) $490 $235(2) $18
Operated Spuds 145 28 2
Operated TILs 150 19 2
Avg. TIL Lateral Length (feet) 6,900 8,600 12,000
Avg. Working Interest 85% 92% 80%
2017e Drilling Program
(1) Guidance based on internal NYMEX price assumptions: ~$51/Bbl oil, $3.30/Mcf Natural Gas, NGL realizations at 25% of NYMEX.(2) Includes ~$35 million for leasing, seismic and technical studies and ~$15 million in midstream related capital investment.
OIL41-45%
GAS34-38%
NGL19-23%
2017e Production Mix(~66% Liquids)
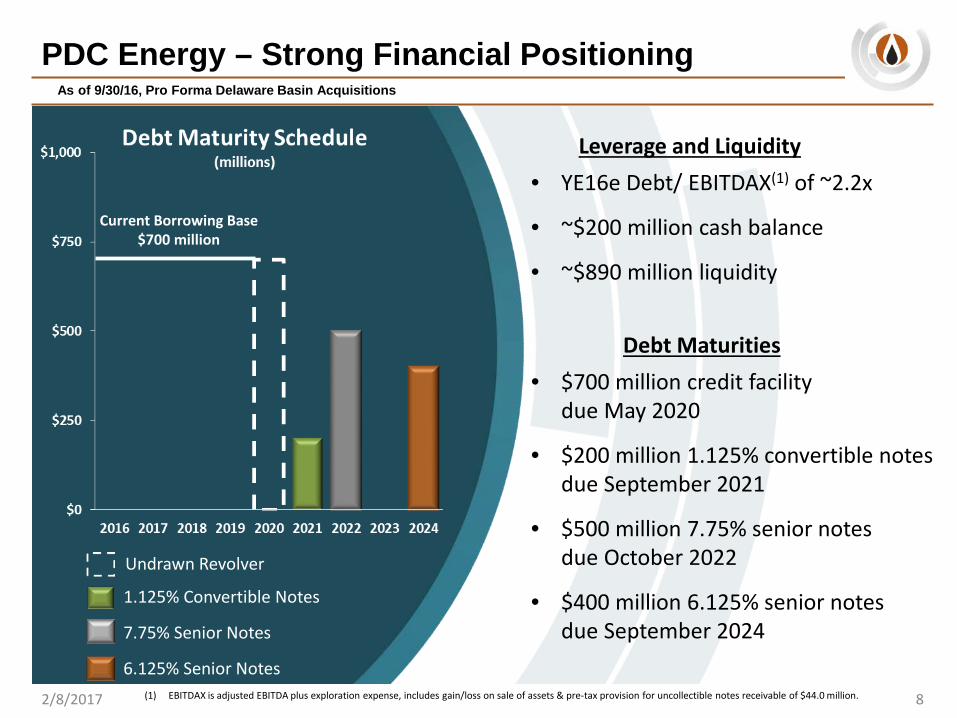
PDC Energy – Strong Financial Positioning
Leverage and Liquidity• YE16e Debt/ EBITDAX(1) of ~2.2x
• ~$200 million cash balance
• ~$890 million liquidity
Debt Maturities• $700 million credit facility
due May 2020
• $200 million 1.125% convertible notes due September 2021
• $500 million 7.75% senior notes due October 2022
• $400 million 6.125% senior notes due September 2024
As of 9/30/16, Pro Forma Delaware Basin Acquisitions
Undrawn Revolver
7.75% Senior Notes
(1) EBITDAX is adjusted EBITDA plus exploration expense, includes gain/loss on sale of assets & pre-tax provision for uncollectible notes receivable of $44.0 million. 2/8/2017 8
6.125% Senior Notes
1.125% Convertible Notes
Current Borrowing Base$700 million
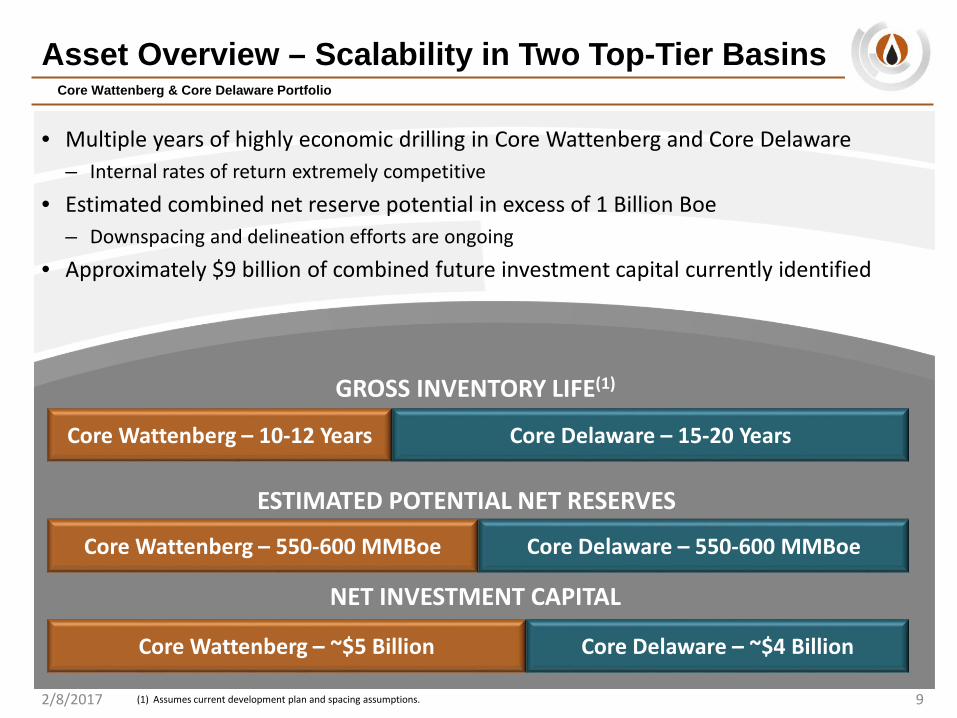
Asset Overview – Scalability in Two Top-Tier Basins
• Multiple years of highly economic drilling in Core Wattenberg and Core Delaware– Internal rates of return extremely competitive
• Estimated combined net reserve potential in excess of 1 Billion Boe– Downspacing and delineation efforts are ongoing
• Approximately $9 billion of combined future investment capital currently identified
9
Core Wattenberg & Core Delaware Portfolio
2/8/2017
GROSS INVENTORY LIFE(1)
ESTIMATED POTENTIAL NET RESERVES
NET INVESTMENT CAPITAL
Core Wattenberg – 10-12 Years
Core Delaware – 550-600 MMBoeCore Wattenberg – 550-600 MMBoe
Core Wattenberg – ~$5 Billion Core Delaware – ~$4 Billion
Core Delaware – 15-20 Years
(1) Assumes current development plan and spacing assumptions.
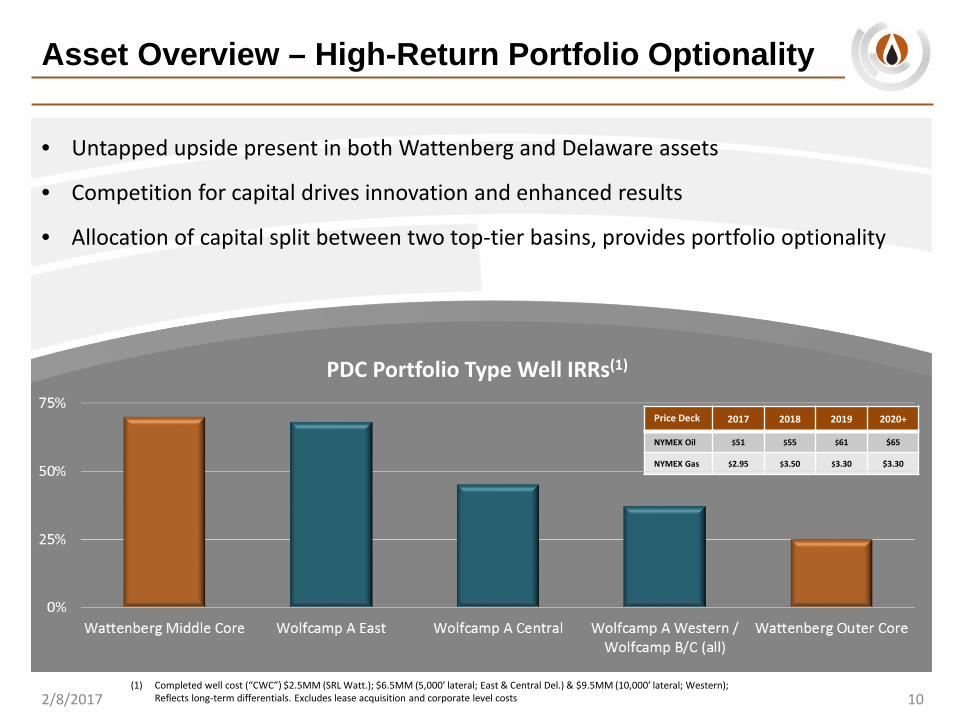
Asset Overview – High-Return Portfolio Optionality
102/8/2017
PDC Portfolio Type Well IRRs(1)
• Untapped upside present in both Wattenberg and Delaware assets
• Competition for capital drives innovation and enhanced results
• Allocation of capital split between two top-tier basins, provides portfolio optionality
(1) Completed well cost (“CWC”) $2.5MM (SRL Watt.); $6.5MM (5,000’ lateral; East & Central Del.) & $9.5MM (10,000’ lateral; Western); Reflects long-term differentials. Excludes lease acquisition and corporate level costs
Price Deck 2017 2018 2019 2020+
NYMEX Oil $51 $55 $61 $65
NYMEX Gas $2.95 $3.50 $3.30 $3.30
11
WATTENBERG OVERVIEW
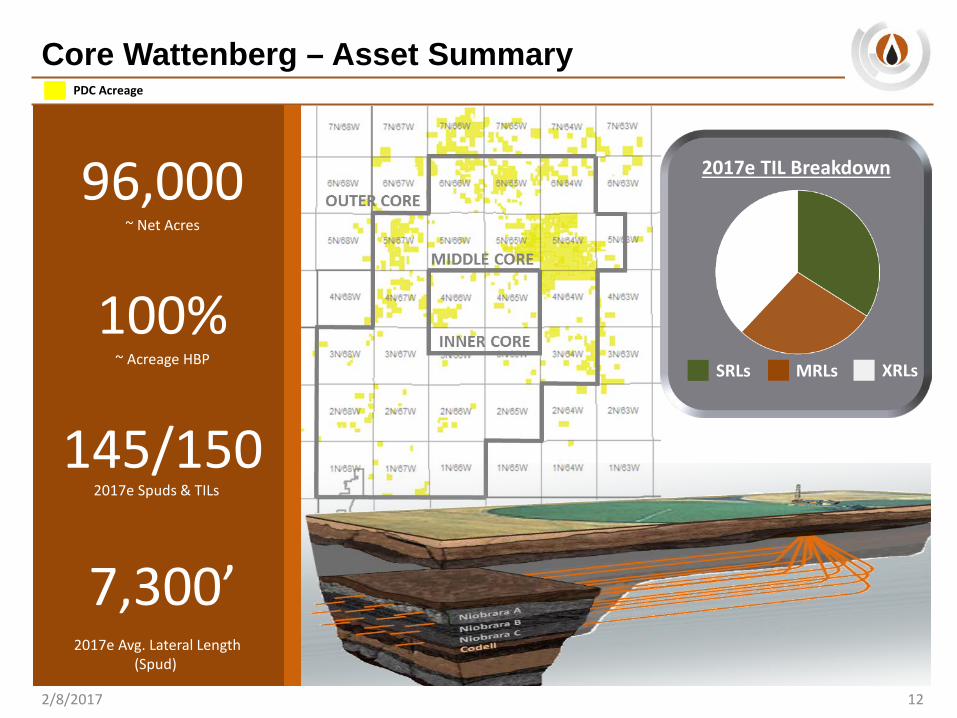
Core Wattenberg – Asset Summary
96,000 ~ Net Acres
100%~ Acreage HBP
145/150
7,300’
SRLs MRLs XRLs
2017e TIL Breakdown
2/8/2017 12
2017e Spuds & TILs
PDC Acreage
2017e Avg. Lateral Length (Spud)
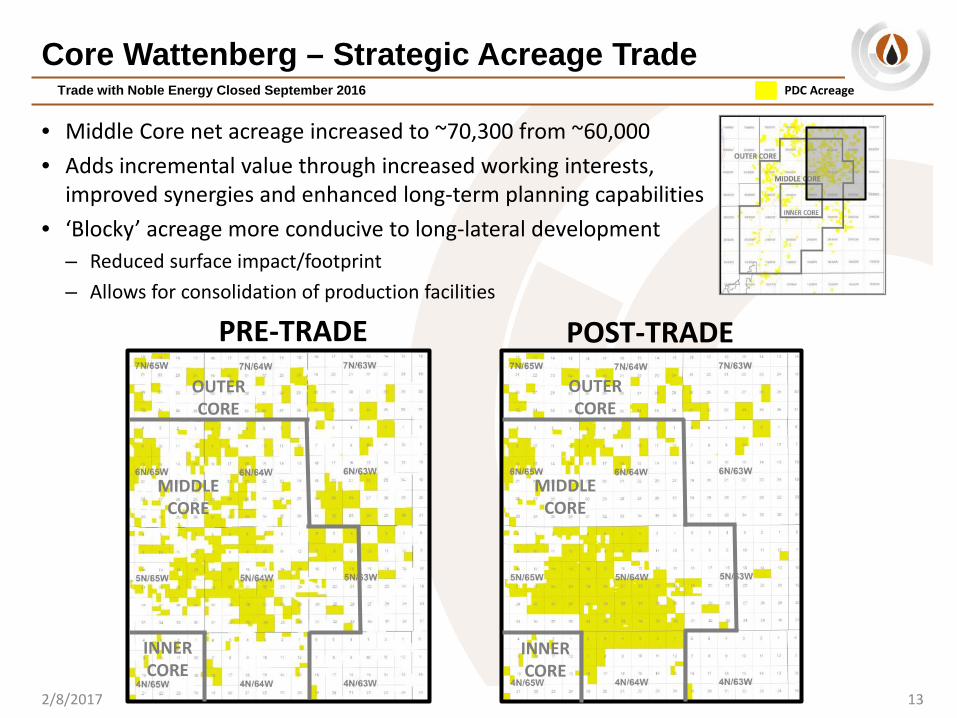
Core Wattenberg – Strategic Acreage TradeTrade with Noble Energy Closed September 2016
PRE-TRADE POST-TRADE
• Middle Core net acreage increased to ~70,300 from ~60,000• Adds incremental value through increased working interests,
improved synergies and enhanced long-term planning capabilities• ‘Blocky’ acreage more conducive to long-lateral development
– Reduced surface impact/footprint– Allows for consolidation of production facilities
OUTERCORE
MIDDLECORE
INNERCORE
OUTERCORE
MIDDLECORE
INNERCORE
2/8/2017 13
PDC Acreage
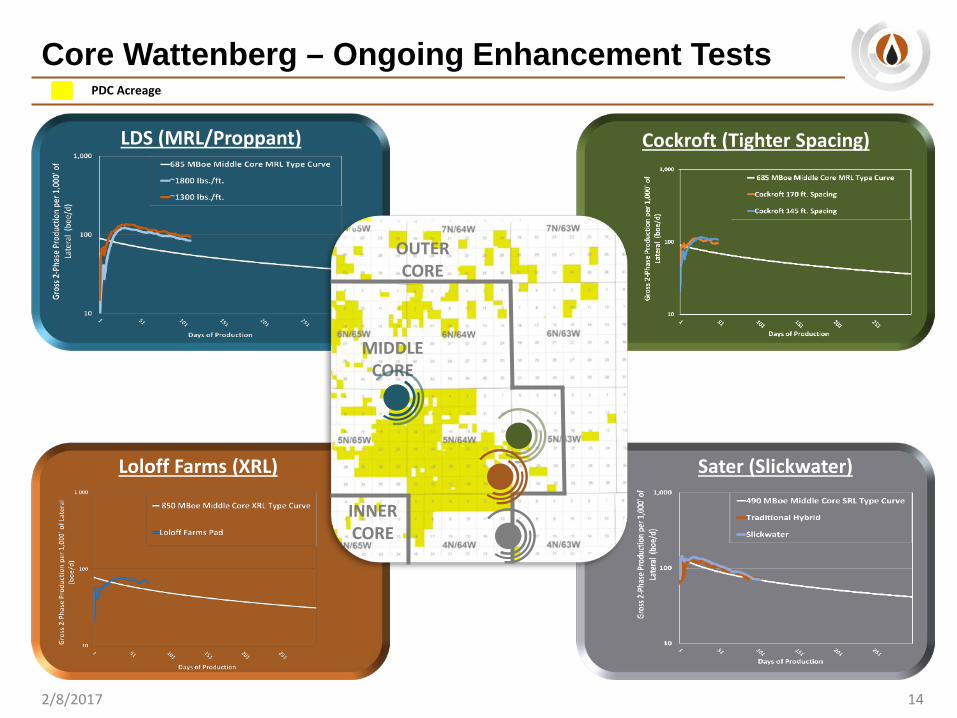
Core Wattenberg – Ongoing Enhancement Tests
142/8/2017
PDC Acreage
Loloff Farms (XRL)
Cockroft (Tighter Spacing)LDS (MRL/Proppant)
Sater (Slickwater)
OUTERCORE
MIDDLECORE
INNERCORE
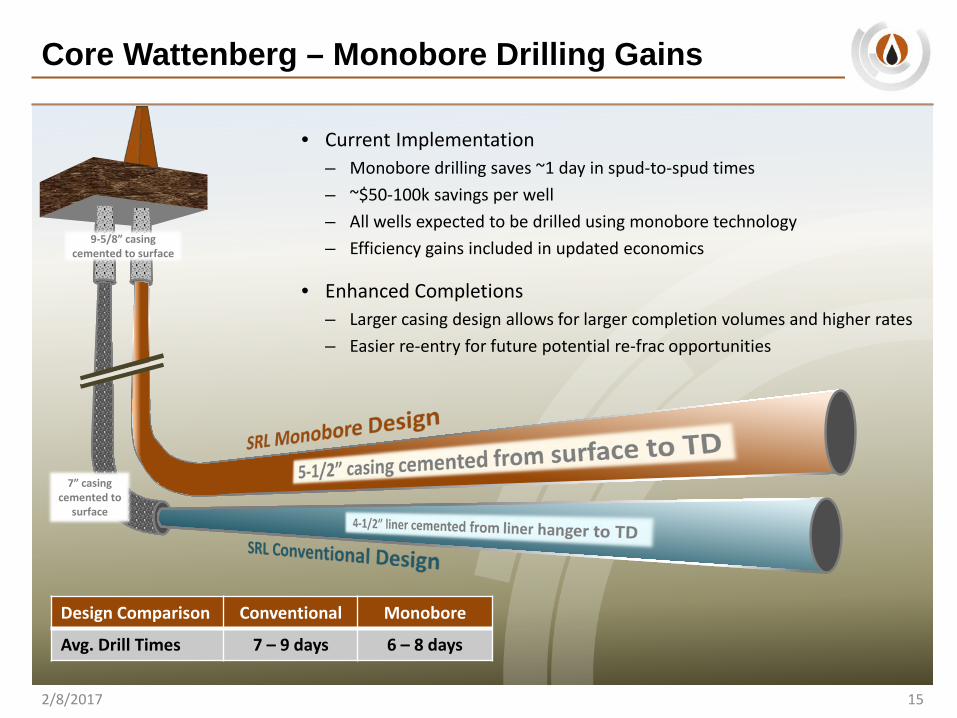
Core Wattenberg – Monobore Drilling Gains
• Current Implementation– Monobore drilling saves ~1 day in spud-to-spud times– ~$50-100k savings per well– All wells expected to be drilled using monobore technology– Efficiency gains included in updated economics
• Enhanced Completions– Larger casing design allows for larger completion volumes and higher rates– Easier re-entry for future potential re-frac opportunities
9-5/8” casing cemented to surface
7” casing cemented to
surface
Design Comparison Conventional Monobore
Avg. Drill Times 7 – 9 days 6 – 8 days
2/8/2017 15
2/8/2017
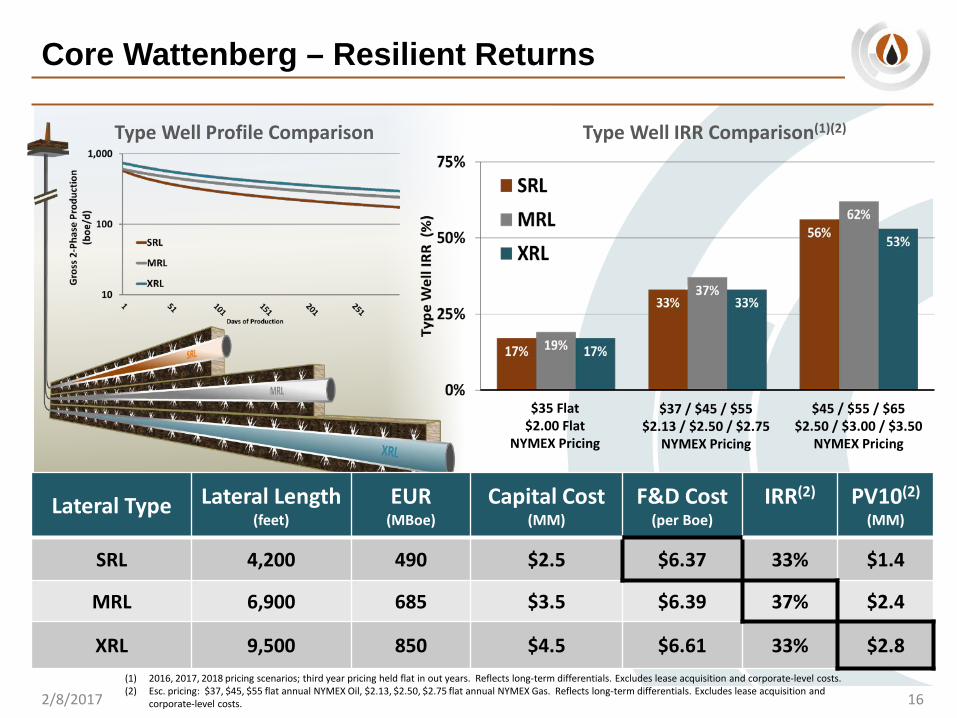
Core Wattenberg – Resilient Returns
(1) 2016, 2017, 2018 pricing scenarios; third year pricing held flat in out years. Reflects long-term differentials. Excludes lease acquisition and corporate-level costs. (2) Esc. pricing: $37, $45, $55 flat annual NYMEX Oil, $2.13, $2.50, $2.75 flat annual NYMEX Gas. Reflects long-term differentials. Excludes lease acquisition and
corporate-level costs.
$35 Flat$2.00 Flat
NYMEX Pricing
$37 / $45 / $55$2.13 / $2.50 / $2.75
NYMEX Pricing
$45 / $55 / $65$2.50 / $3.00 / $3.50
NYMEX Pricing
Type Well Profile Comparison
16
Type Well IRR Comparison(1)(2)
Lateral Type Lateral Length(feet)
EUR(MBoe)
Capital Cost(MM)
F&D Cost(per Boe)
IRR(2) PV10(2)
(MM)
SRL 4,200 490 $2.5 $6.37 33% $1.4
MRL 6,900 685 $3.5 $6.39 37% $2.4
XRL 9,500 850 $4.5 $6.61 33% $2.8
17
DELAWARE OVERVIEW
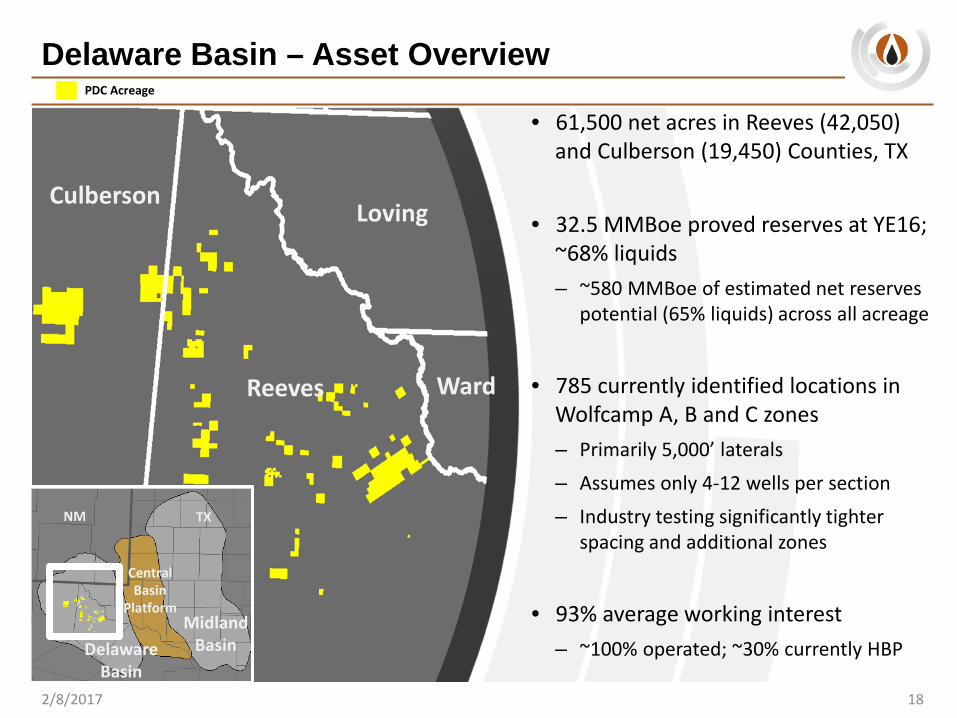
Delaware Basin – Asset Overview
182/8/2017
Reeves
CulbersonLoving
Ward
MidlandBasinDelaware
Basin
CentralBasin
Platform
NM TX
PDC Acreage
• 61,500 net acres in Reeves (42,050) and Culberson (19,450) Counties, TX
• 32.5 MMBoe proved reserves at YE16; ~68% liquids– ~580 MMBoe of estimated net reserves
potential (65% liquids) across all acreage
• 785 currently identified locations in Wolfcamp A, B and C zones – Primarily 5,000’ laterals– Assumes only 4-12 wells per section– Industry testing significantly tighter
spacing and additional zones
• 93% average working interest – ~100% operated; ~30% currently HBP
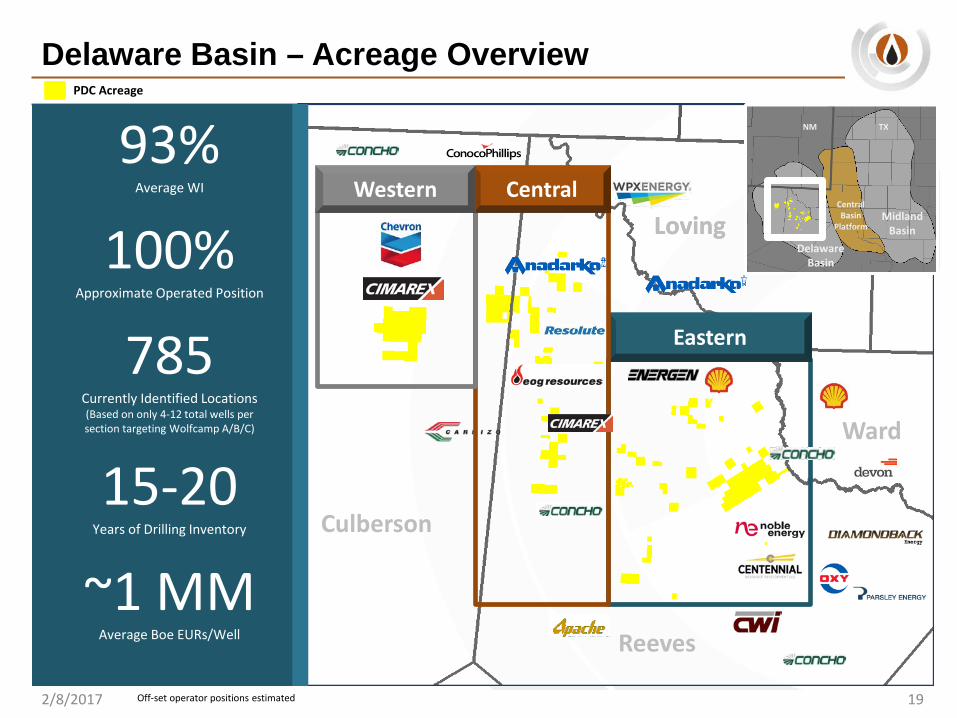
Delaware Basin – Acreage Overview
2/8/2017 19
93%Average WI
100%Approximate Operated Position
785Currently Identified Locations (Based on only 4-12 total wells per section targeting Wolfcamp A/B/C)
15-20Years of Drilling Inventory
~1 MMAverage Boe EURs/Well
Loving
Culberson
Reeves
Ward
Loving
PDC Acreage
Off-set operator positions estimated
Eastern
CentralWesternMidland
BasinDelaware
Basin
CentralBasin
Platform
NM TX
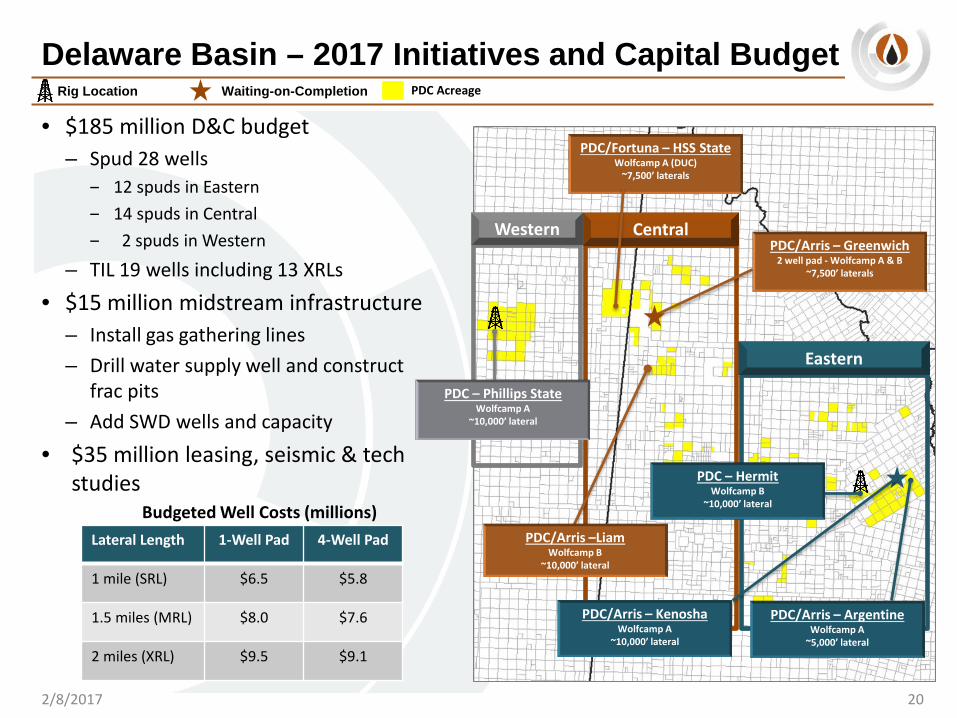
Delaware Basin – 2017 Initiatives and Capital Budget
• $185 million D&C budget– Spud 28 wells
‒ 12 spuds in Eastern‒ 14 spuds in Central‒ 2 spuds in Western
– TIL 19 wells including 13 XRLs
• $15 million midstream infrastructure– Install gas gathering lines – Drill water supply well and construct
frac pits– Add SWD wells and capacity
• $35 million leasing, seismic & tech studies
20
Rig Location Waiting-on-Completion
2/8/2017
Western
Eastern
Central
PDC/Arris –LiamWolfcamp B
~10,000’ lateral
PDC/Arris – Greenwich2 well pad - Wolfcamp A & B
~7,500’ laterals
PDC/Arris – ArgentineWolfcamp A
~5,000’ lateral
Lateral Length 1-Well Pad 4-Well Pad
1 mile (SRL) $6.5 $5.8
1.5 miles (MRL) $8.0 $7.6
2 miles (XRL) $9.5 $9.1
Budgeted Well Costs (millions)
PDC Acreage
PDC/Arris – KenoshaWolfcamp A
~10,000’ lateral
PDC – HermitWolfcamp B
~10,000’ lateral
PDC/Fortuna – HSS StateWolfcamp A (DUC)
~7,500’ laterals
PDC – Phillips StateWolfcamp A
~10,000’ lateral
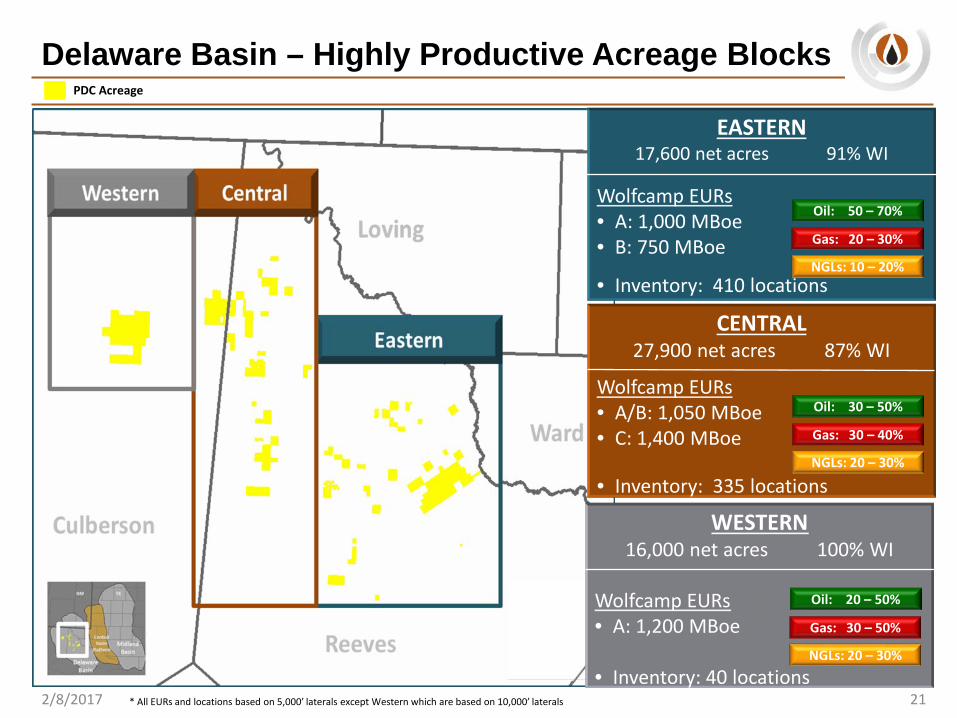
Delaware Basin – Highly Productive Acreage Blocks
2/8/2017 21
PDC Acreage
WESTERN16,000 net acres 100% WI
Wolfcamp EURs• A: 1,200 MBoe
• Inventory: 40 locations
EASTERN17,600 net acres 91% WI
Wolfcamp EURs• A: 1,000 MBoe• B: 750 MBoe
• Inventory: 410 locations
CENTRAL27,900 net acres 87% WI
Wolfcamp EURs • A/B: 1,050 MBoe• C: 1,400 MBoe
• Inventory: 335 locations
Oil: 20 – 50%
Gas: 30 – 50%
NGLs: 20 – 30%
Oil: 30 – 50%
Gas: 30 – 40%
NGLs: 20 – 30%
Oil: 50 – 70%
Gas: 20 – 30%
NGLs: 10 – 20%
* All EURs and locations based on 5,000’ laterals except Western which are based on 10,000’ laterals
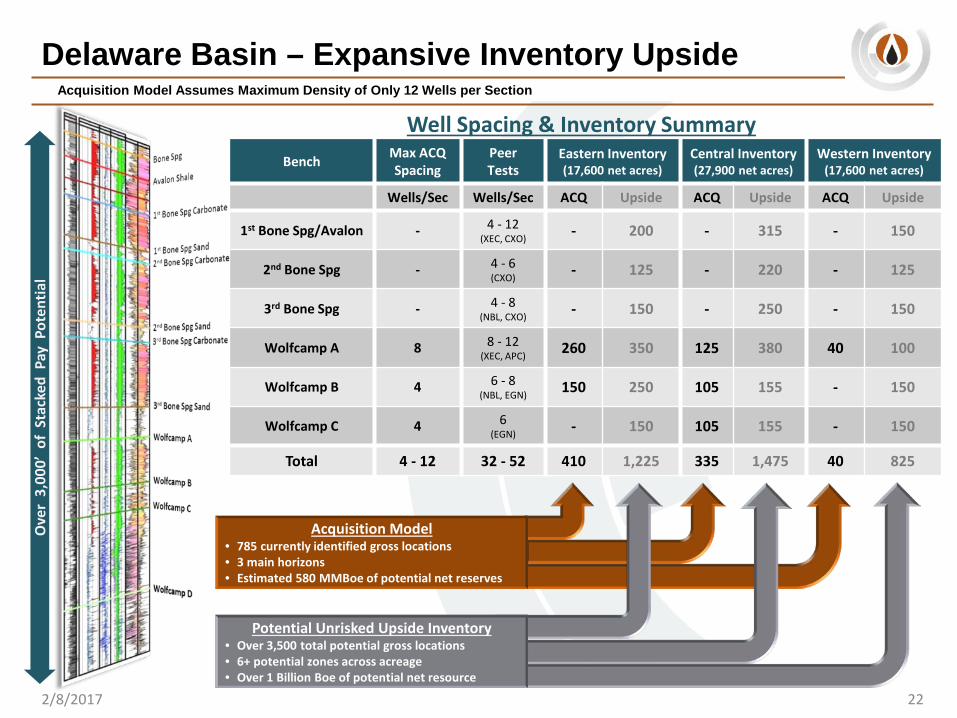
Delaware Basin – Expansive Inventory Upside
22
Acquisition Model Assumes Maximum Density of Only 12 Wells per Section
2/8/2017
Bench Max ACQSpacing
PeerTests
Eastern Inventory(17,600 net acres)
Central Inventory(27,900 net acres)
Western Inventory(17,600 net acres)
Wells/Sec Wells/Sec ACQ Upside ACQ Upside ACQ Upside
1st Bone Spg/Avalon - 4 - 12(XEC, CXO) - 200 - 315 - 150
2nd Bone Spg - 4 - 6(CXO) - 125 - 220 - 125
3rd Bone Spg - 4 - 8(NBL, CXO) - 150 - 250 - 150
Wolfcamp A 8 8 - 12 (XEC, APC) 260 350 125 380 40 100
Wolfcamp B 4 6 - 8(NBL, EGN) 150 250 105 155 - 150
Wolfcamp C 4 6(EGN) - 150 105 155 - 150
Total 4 - 12 32 - 52 410 1,225 335 1,475 40 825
Well Spacing & Inventory Summary
Ove
r 3,
000’
of
Stac
ked
Pay
Pot
entia
l
Acquisition Model• 785 currently identified gross locations• 3 main horizons• Estimated 580 MMBoe of potential net reserves
Potential Unrisked Upside Inventory• Over 3,500 total potential gross locations• 6+ potential zones across acreage• Over 1 Billion Boe of potential net resource
PDC Energy – Strategic Overview
232/8/2017
Top-Tier Growth Profile
Capital Efficient Drilling Projects in Two Premier Basins
Financial Discipline
Technical Initiatives & Operational Enhancements
Long-Term Focuson Value Creation

Investor RelationsMike Edwards, Senior Director Investor [email protected]
Kyle Sourk, Manager Investor [email protected]
Corporate HeadquartersPDC Energy, Inc.1775 Sherman StreetSuite 3000Denver, Colorado 80203303-860-5800
Websitewww.pdce.com
2/8/2017 24
25
APPENDIX

PDC Energy – Hedge Position SummaryHedges in place as of December 31, 2016 plus hedges entered prior to January 31, 2017
2017~8.5 MMBbls crude oil volumes at weighted average floor price of $49.25/Bbl
38,217 BBtu natural gas volumes at weighted average floor price of $3.30/MMBtu
2018~5.2 MMBbls crude oil volumes at weighted average floor price of $50.38/Bbl
46,510 BBtu natural gas volumes at weighted average floor price of $2.83/MMBtu
(1) Natural gas hedged price is at NYMEX and includes any CIG basis swaps.
$49.14
$53.71
$62.32$49.54 $54.31
$41.85
$4.06$3.43
$3.67$3.00
$3.25$2.82
8,466
5,384
46,510
38,217
262/8/2017
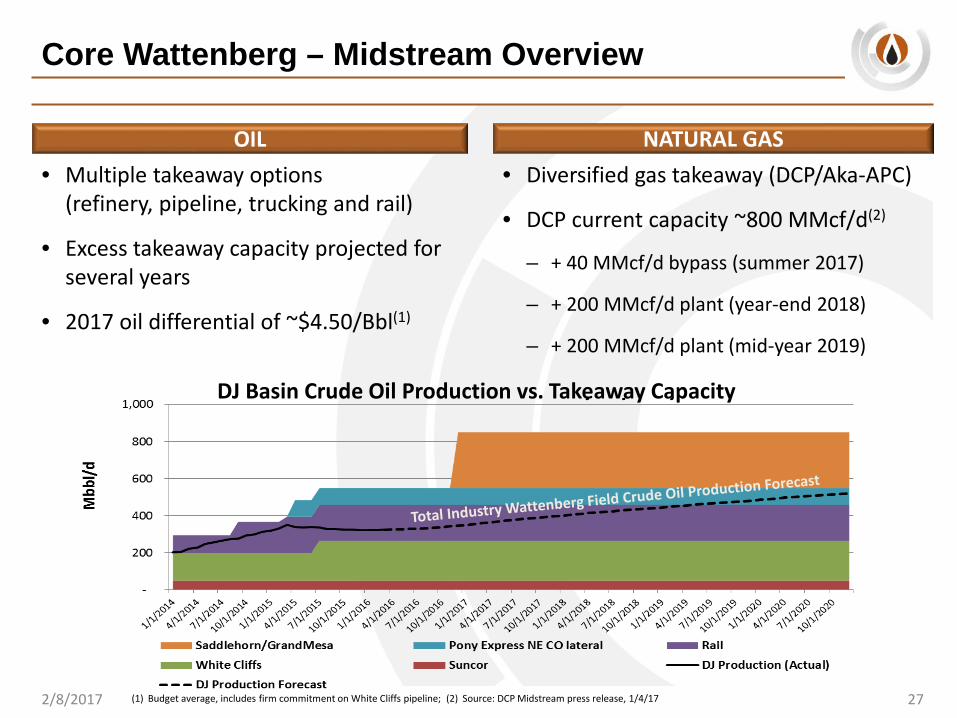
Core Wattenberg – Midstream Overview
2/8/2017 27
• Multiple takeaway options (refinery, pipeline, trucking and rail)
• Excess takeaway capacity projected for several years
• 2017 oil differential of ~$4.50/Bbl(1)
Source: Company reports; BTU Analytics productionOIL NATURAL GAS• Diversified gas takeaway (DCP/Aka-APC)
• DCP current capacity ~800 MMcf/d(2)
– + 40 MMcf/d bypass (summer 2017)
– + 200 MMcf/d plant (year-end 2018)
– + 200 MMcf/d plant (mid-year 2019)
(1) Budget average, includes firm commitment on White Cliffs pipeline; (2) Source: DCP Midstream press release, 1/4/17
DJ Basin Crude Oil Production vs. Takeaway Capacity
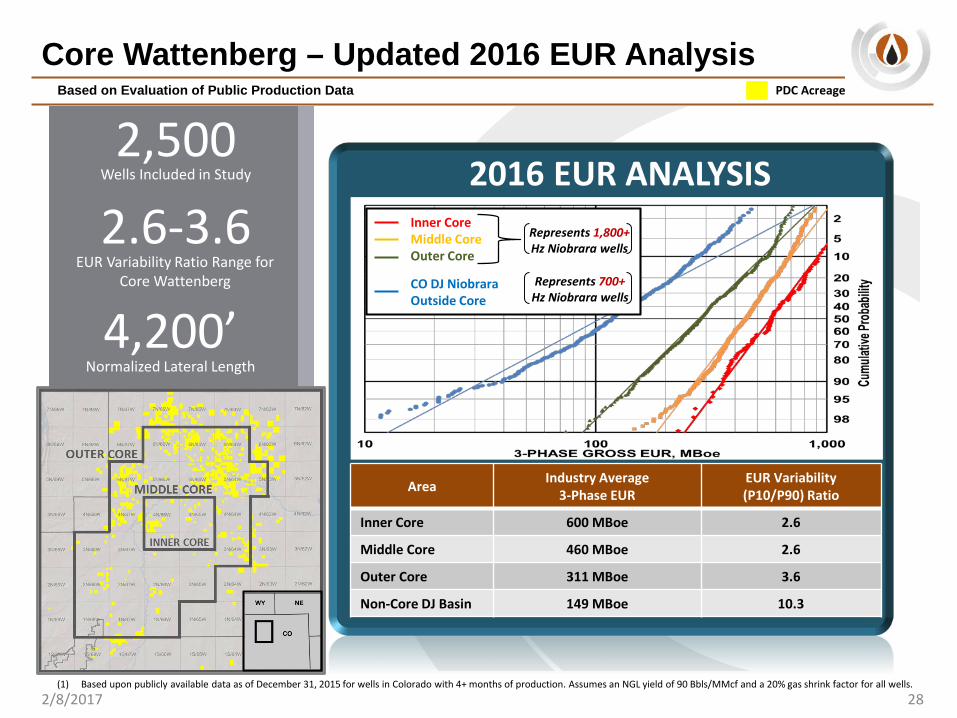
Core Wattenberg – Updated 2016 EUR AnalysisBased on Evaluation of Public Production Data
2.6-3.6EUR Variability Ratio Range for
Core Wattenberg
2,500Wells Included in Study
4,200’Normalized Lateral Length
2/8/2017 28
Inner CoreMiddle CoreOuter Core
CO DJ NiobraraOutside Core
Represents 1,800+Hz Niobrara wells
Represents 700+Hz Niobrara wells
2016 EUR ANALYSIS
Area Industry Average3-Phase EUR
EUR Variability(P10/P90) Ratio
Inner Core 600 MBoe 2.6
Middle Core 460 MBoe 2.6
Outer Core 311 MBoe 3.6
Non-Core DJ Basin 149 MBoe 10.3
(1) Based upon publicly available data as of December 31, 2015 for wells in Colorado with 4+ months of production. Assumes an NGL yield of 90 Bbls/MMcf and a 20% gas shrink factor for all wells.
PDC Acreage
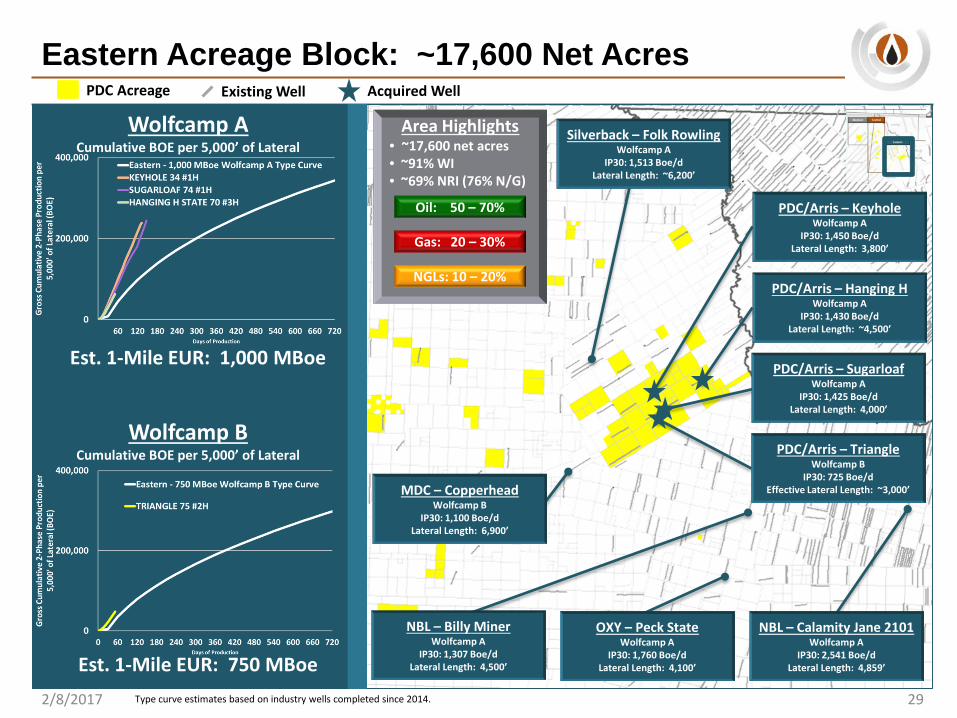
Eastern Acreage Block: ~17,600 Net Acres
2/8/2017 29
NBL – Calamity Jane 2101Wolfcamp A
IP30: 2,541 Boe/dLateral Length: 4,859’
Wolfcamp ACumulative BOE per 5,000’ of Lateral
Wolfcamp BCumulative BOE per 5,000’ of Lateral
Est. 1-Mile EUR: 1,000 MBoe
Est. 1-Mile EUR: 750 MBoe
NBL – Billy MinerWolfcamp A
IP30: 1,307 Boe/dLateral Length: 4,500’
OXY – Peck StateWolfcamp A
IP30: 1,760 Boe/dLateral Length: 4,100’
Area Highlights• ~17,600 net acres• ~91% WI• ~69% NRI (76% N/G)
Oil: 50 – 70%
Gas: 20 – 30%
NGLs: 10 – 20%
PDC Acreage Existing Well
PDC/Arris – KeyholeWolfcamp A
IP30: 1,450 Boe/dLateral Length: 3,800’
PDC/Arris – Hanging HWolfcamp A
IP30: 1,430 Boe/dLateral Length: ~4,500’
PDC/Arris – TriangleWolfcamp B
IP30: 725 Boe/dEffective Lateral Length: ~3,000’
PDC/Arris – SugarloafWolfcamp A
IP30: 1,425 Boe/dLateral Length: 4,000’
Type curve estimates based on industry wells completed since 2014.
Acquired Well
Silverback – Folk RowlingWolfcamp A
IP30: 1,513 Boe/dLateral Length: ~6,200’
MDC – CopperheadWolfcamp B
IP30: 1,100 Boe/dLateral Length: 6,900’
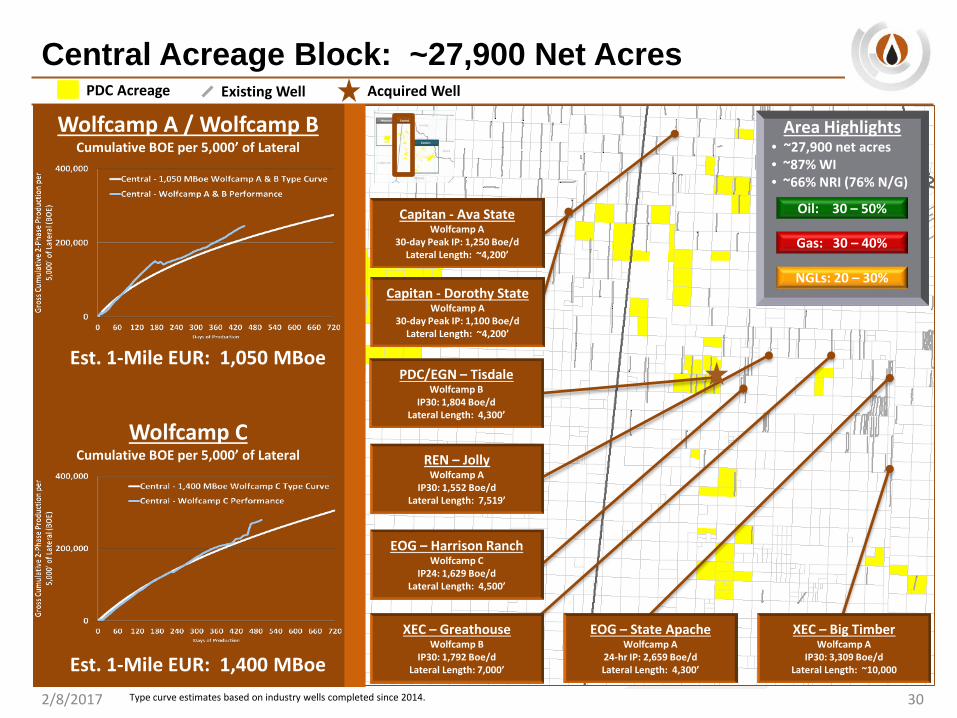
Central Acreage Block: ~27,900 Net Acres
2/8/2017 30
PDC/EGN – Tisdale Wolfcamp B
IP30: 1,804 Boe/dLateral Length: 4,300’
EOG – Harrison RanchWolfcamp C
IP24: 1,629 Boe/dLateral Length: 4,500’
XEC – GreathouseWolfcamp B
IP30: 1,792 Boe/dLateral Length: 7,000’
EOG – State ApacheWolfcamp A
24-hr IP: 2,659 Boe/dLateral Length: 4,300’
Capitan - Ava StateWolfcamp A
30-day Peak IP: 1,250 Boe/dLateral Length: ~4,200’
Capitan - Dorothy StateWolfcamp A
30-day Peak IP: 1,100 Boe/dLateral Length: ~4,200’
REN – Jolly Wolfcamp A
IP30: 1,552 Boe/dLateral Length: 7,519’
Area Highlights• ~27,900 net acres• ~87% WI• ~66% NRI (76% N/G)
Oil: 30 – 50%
Gas: 30 – 40%
NGLs: 20 – 30%
PDC Acreage Existing Well
Wolfcamp A / Wolfcamp BCumulative BOE per 5,000’ of Lateral
Wolfcamp CCumulative BOE per 5,000’ of Lateral
Est. 1-Mile EUR: 1,050 MBoe
Est. 1-Mile EUR: 1,400 MBoe
XEC – Big TimberWolfcamp A
IP30: 3,309 Boe/dLateral Length: ~10,000
Type curve estimates based on industry wells completed since 2014.
Acquired Well
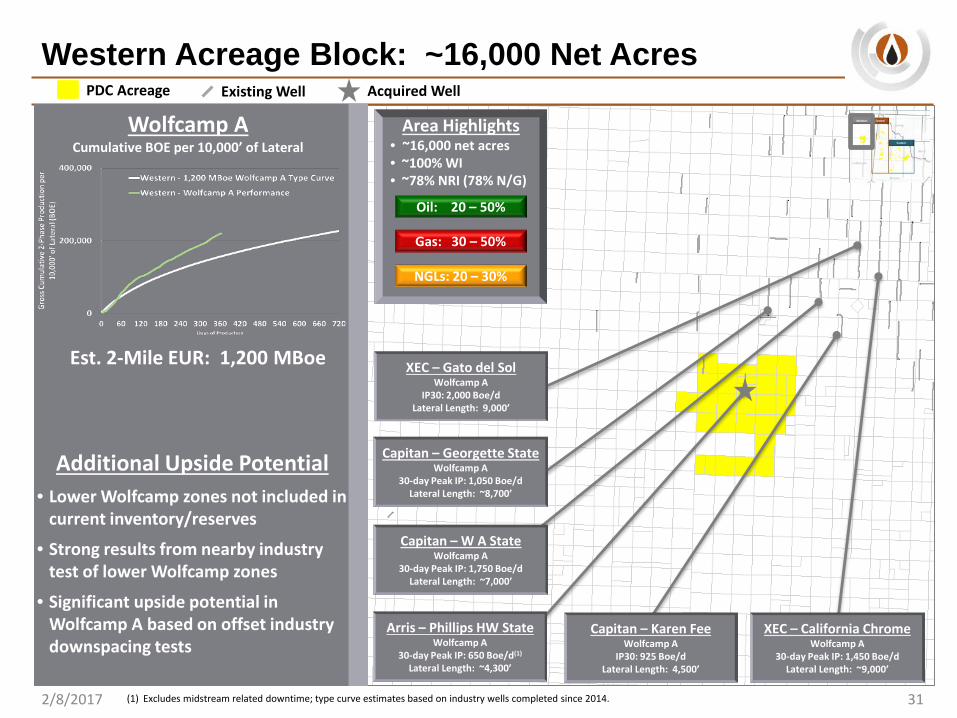
Western Acreage Block: ~16,000 Net Acres
2/8/2017 31
Capitan – Karen FeeWolfcamp A
IP30: 925 Boe/dLateral Length: 4,500’
XEC – Gato del SolWolfcamp A
IP30: 2,000 Boe/dLateral Length: 9,000’
Capitan – Georgette StateWolfcamp A
30-day Peak IP: 1,050 Boe/dLateral Length: ~8,700’
XEC – California ChromeWolfcamp A
30-day Peak IP: 1,450 Boe/dLateral Length: ~9,000’
Capitan – W A StateWolfcamp A
30-day Peak IP: 1,750 Boe/dLateral Length: ~7,000’
Arris – Phillips HW StateWolfcamp A
30-day Peak IP: 650 Boe/d(1)
Lateral Length: ~4,300’
Area Highlights• ~16,000 net acres• ~100% WI• ~78% NRI (78% N/G)
Oil: 20 – 50%
Gas: 30 – 50%
NGLs: 20 – 30%
PDC Acreage Existing Well
(1) Excludes midstream related downtime; type curve estimates based on industry wells completed since 2014.
Wolfcamp ACumulative BOE per 10,000’ of Lateral
Est. 2-Mile EUR: 1,200 MBoe
Additional Upside Potential• Lower Wolfcamp zones not included in
current inventory/reserves
• Strong results from nearby industry test of lower Wolfcamp zones
• Significant upside potential in Wolfcamp A based on offset industry downspacing tests
Acquired Well
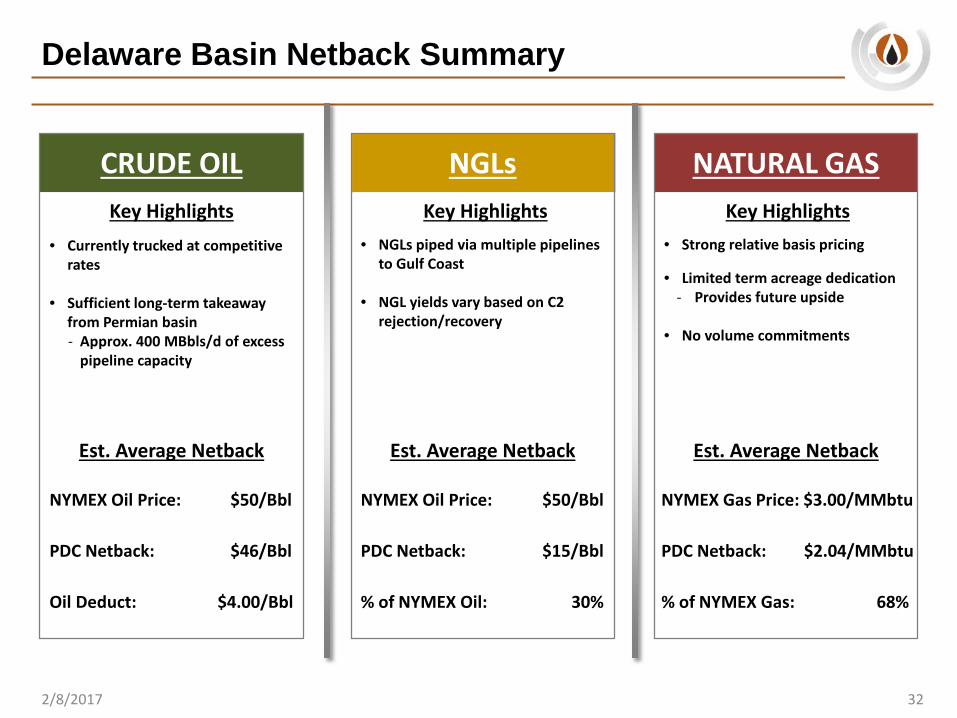
Delaware Basin Netback Summary
322/8/2017
CRUDE OIL NGLs NATURAL GASKey Highlights
Est. Average Netback Est. Average Netback
• Currently trucked at competitive rates
• Sufficient long-term takeaway from Permian basin- Approx. 400 MBbls/d of excess
pipeline capacity
NYMEX Oil Price: $50/Bbl
PDC Netback: $46/Bbl
Oil Deduct: $4.00/Bbl
• NGLs piped via multiple pipelines to Gulf Coast
• NGL yields vary based on C2 rejection/recovery
• Strong relative basis pricing
• Limited term acreage dedication- Provides future upside
• No volume commitments
Key Highlights
Est. Average Netback
Key Highlights
NYMEX Oil Price: $50/Bbl
PDC Netback: $15/Bbl
% of NYMEX Oil: 30%
NYMEX Gas Price: $3.00/MMbtu
PDC Netback: $2.04/MMbtu
% of NYMEX Gas: 68%
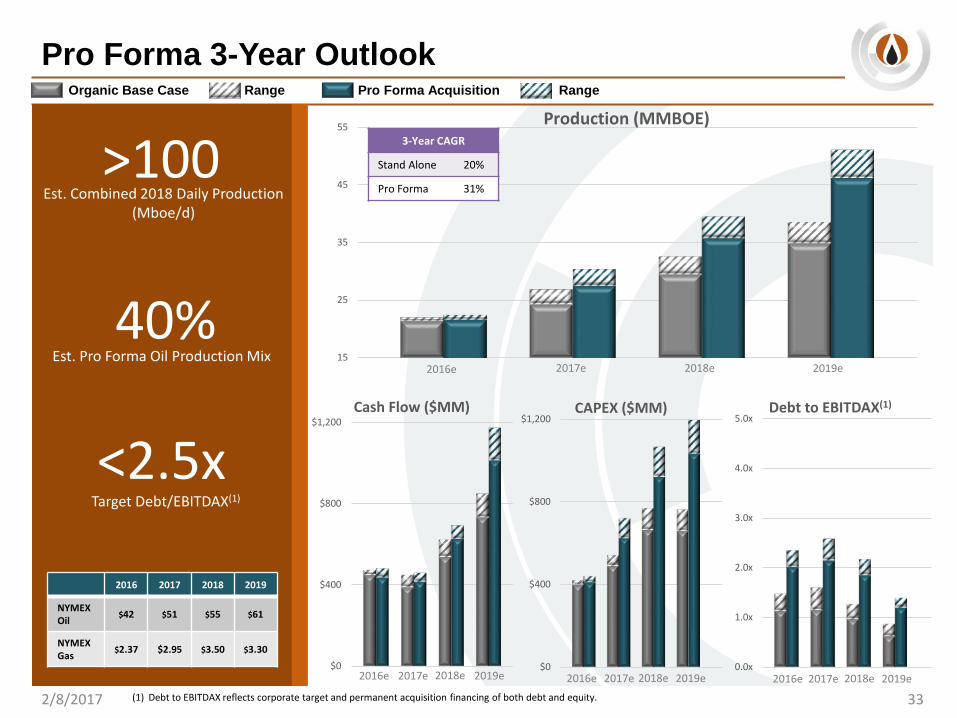
Pro Forma 3-Year Outlook
>100Est. Combined 2018 Daily Production
(Mboe/d)
40%Est. Pro Forma Oil Production Mix
<2.5xTarget Debt/EBITDAX(1)
Organic Base Case Range Pro Forma Acquisition Range
2/8/2017 33
15
25
35
45
55 Production (MMBOE)
2016e 2017e 2018e 2019e
3-Year CAGR
Stand Alone 20%
Pro Forma 31%
2016 2017 2018 2019
NYMEX Oil $42 $51 $55 $61
NYMEX Gas $2.37 $2.95 $3.50 $3.30
$0
$400
$800
$1,200Cash Flow ($MM)
$0
$400
$800
$1,200CAPEX ($MM)
0.0x
1.0x
2.0x
3.0x
4.0x
5.0xDebt to EBITDAX(1)
2016e 2017e 2018e 2019e 2016e 2017e 2018e 2019e 2016e 2017e 2018e 2019e(1) Debt to EBITDAX reflects corporate target and permanent acquisition financing of both debt and equity.
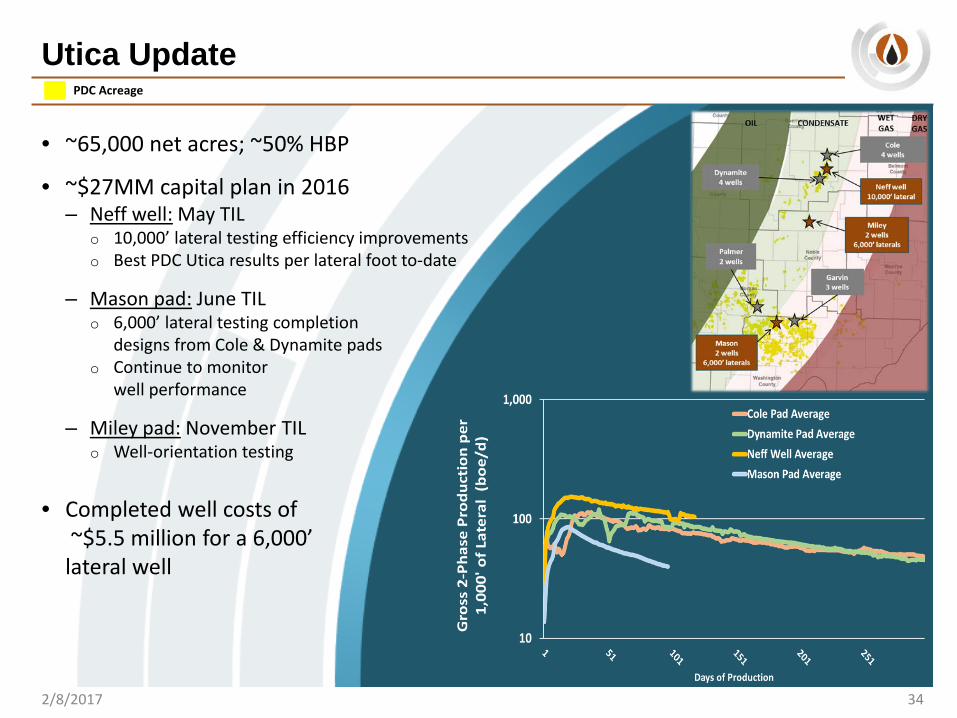
Utica Update
342/8/2017
• ~65,000 net acres; ~50% HBP
• ~$27MM capital plan in 2016– Neff well: May TIL
o 10,000’ lateral testing efficiency improvementso Best PDC Utica results per lateral foot to-date
– Mason pad: June TILo 6,000’ lateral testing completion
designs from Cole & Dynamite padso Continue to monitor
well performance
– Miley pad: November TILo Well-orientation testing
• Completed well costs of~$5.5 million for a 6,000’
lateral well
PDC Acreage
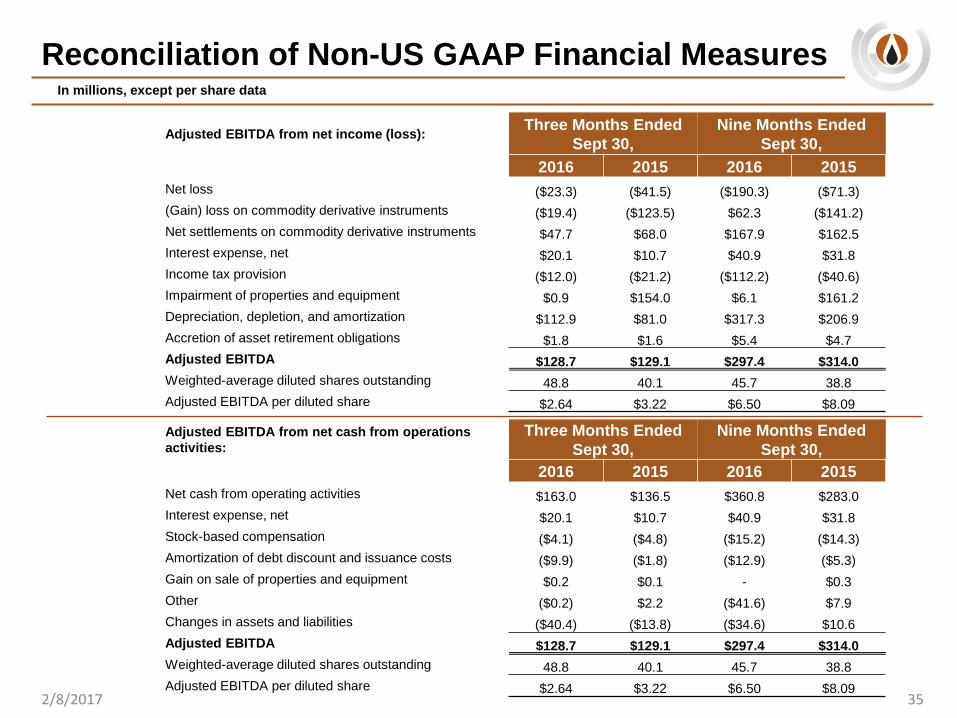
Reconciliation of Non-US GAAP Financial Measures
35
In millions, except per share data
2/8/2017
Adjusted EBITDA from net income (loss): Three Months EndedSept 30,
Nine Months EndedSept 30,
2016 2015 2016 2015Net loss ($23.3) ($41.5) ($190.3) ($71.3)(Gain) loss on commodity derivative instruments ($19.4) ($123.5) $62.3 ($141.2)Net settlements on commodity derivative instruments $47.7 $68.0 $167.9 $162.5 Interest expense, net $20.1 $10.7 $40.9 $31.8 Income tax provision ($12.0) ($21.2) ($112.2) ($40.6)Impairment of properties and equipment $0.9 $154.0 $6.1 $161.2 Depreciation, depletion, and amortization $112.9 $81.0 $317.3 $206.9 Accretion of asset retirement obligations $1.8 $1.6 $5.4 $4.7 Adjusted EBITDA $128.7 $129.1 $297.4 $314.0 Weighted-average diluted shares outstanding 48.8 40.1 45.7 38.8 Adjusted EBITDA per diluted share $2.64 $3.22 $6.50 $8.09
Adjusted EBITDA from net cash from operations activities:
Three Months EndedSept 30,
Nine Months EndedSept 30,
2016 2015 2016 2015Net cash from operating activities $163.0 $136.5 $360.8 $283.0 Interest expense, net $20.1 $10.7 $40.9 $31.8 Stock-based compensation ($4.1) ($4.8) ($15.2) ($14.3)Amortization of debt discount and issuance costs ($9.9) ($1.8) ($12.9) ($5.3)Gain on sale of properties and equipment $0.2 $0.1 - $0.3 Other ($0.2) $2.2 ($41.6) $7.9 Changes in assets and liabilities ($40.4) ($13.8) ($34.6) $10.6 Adjusted EBITDA $128.7 $129.1 $297.4 $314.0 Weighted-average diluted shares outstanding 48.8 40.1 45.7 38.8 Adjusted EBITDA per diluted share $2.64 $3.22 $6.50 $8.09
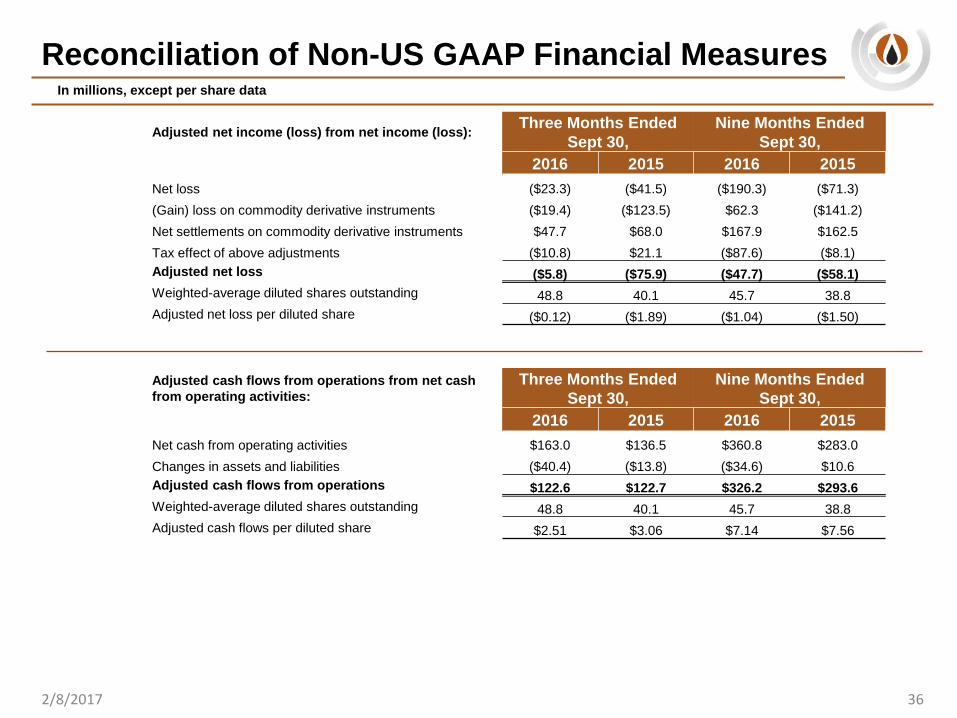
Reconciliation of Non-US GAAP Financial Measures
36
In millions, except per share data
2/8/2017
Adjusted net income (loss) from net income (loss): Three Months EndedSept 30,
Nine Months EndedSept 30,
2016 2015 2016 2015Net loss ($23.3) ($41.5) ($190.3) ($71.3)(Gain) loss on commodity derivative instruments ($19.4) ($123.5) $62.3 ($141.2)Net settlements on commodity derivative instruments $47.7 $68.0 $167.9 $162.5 Tax effect of above adjustments ($10.8) $21.1 ($87.6) ($8.1)Adjusted net loss ($5.8) ($75.9) ($47.7) ($58.1)Weighted-average diluted shares outstanding 48.8 40.1 45.7 38.8 Adjusted net loss per diluted share ($0.12) ($1.89) ($1.04) ($1.50)
Adjusted cash flows from operations from net cash from operating activities:
Three Months EndedSept 30,
Nine Months EndedSept 30,
2016 2015 2016 2015Net cash from operating activities $163.0 $136.5 $360.8 $283.0 Changes in assets and liabilities ($40.4) ($13.8) ($34.6) $10.6 Adjusted cash flows from operations $122.6 $122.7 $326.2 $293.6 Weighted-average diluted shares outstanding 48.8 40.1 45.7 38.8 Adjusted cash flows per diluted share $2.51 $3.06 $7.14 $7.56