Embed Size (px)
Citation preview
IPAA Private Capital ConferenceThe Exit Strategy – Monetization Through An Asset Sale
Strictly Private and Confidential
February 24, 2011Craig Lande
www.richardsonbarr.com
2
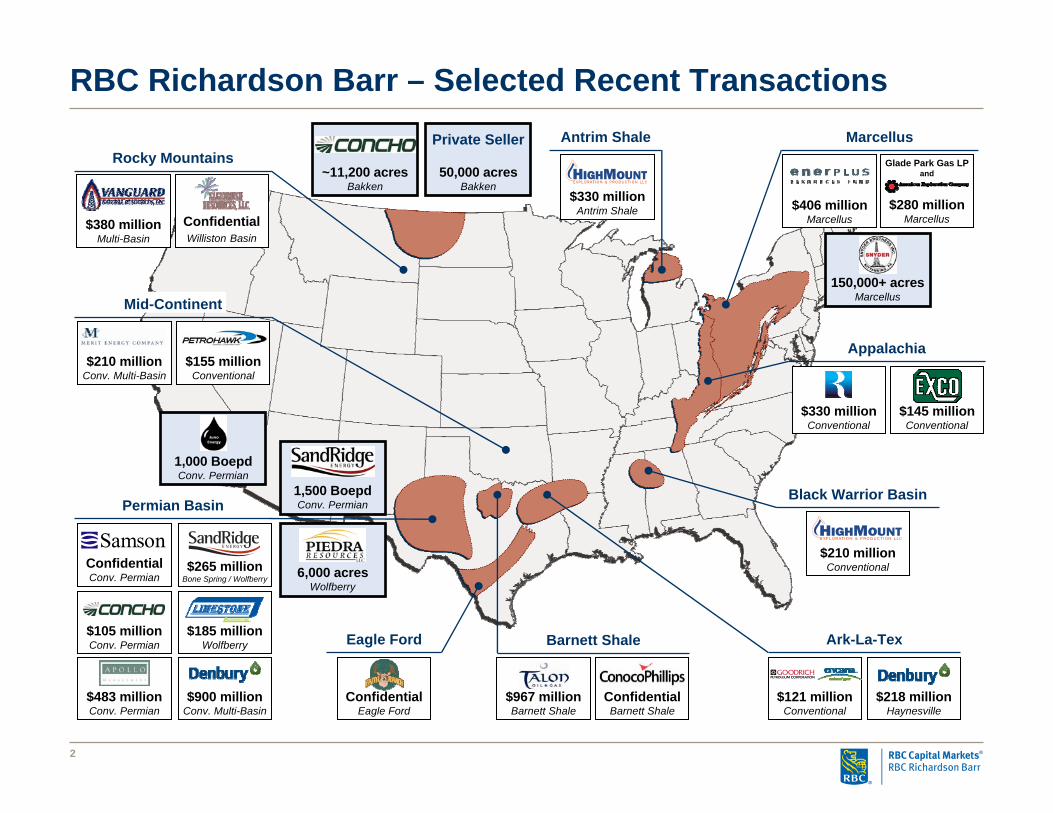
RBC Richardson Barr – Selected Recent Transactions
$218 millionHaynesville
$121 millionConventional
Ark-La-Tex
ConfidentialBarnett Shale
$967 millionBarnett Shale
Barnett Shale
$210 millionConventional
Black Warrior Basin
ConfidentialEagle Ford
Eagle Ford
$155 millionConventional
$210 millionConv. Multi-Basin
Mid-Continent
$265 millionBone Spring / Wolfberry
ConfidentialConv. Permian
$185 millionWolfberry
$105 millionConv. Permian
$483 millionConv. Permian
$900 millionConv. Multi-Basin
Permian Basin
$330 millionConventional
$145 millionConventional
Appalachia
$280 millionMarcellus
Glade Park Gas LPand
$406 millionMarcellus
Marcellus
$330 millionAntrim Shale
Antrim Shale
ConfidentialWilliston Basin
$380 millionMulti-Basin
Rocky Mountains
150,000+ acresMarcellus
Private Seller
50,000 acresBakken
~11,200 acresBakken
1,500 BoepdConv. Permian
6,000 acresWolfberry
1,000 BoepdConv. Permian
3
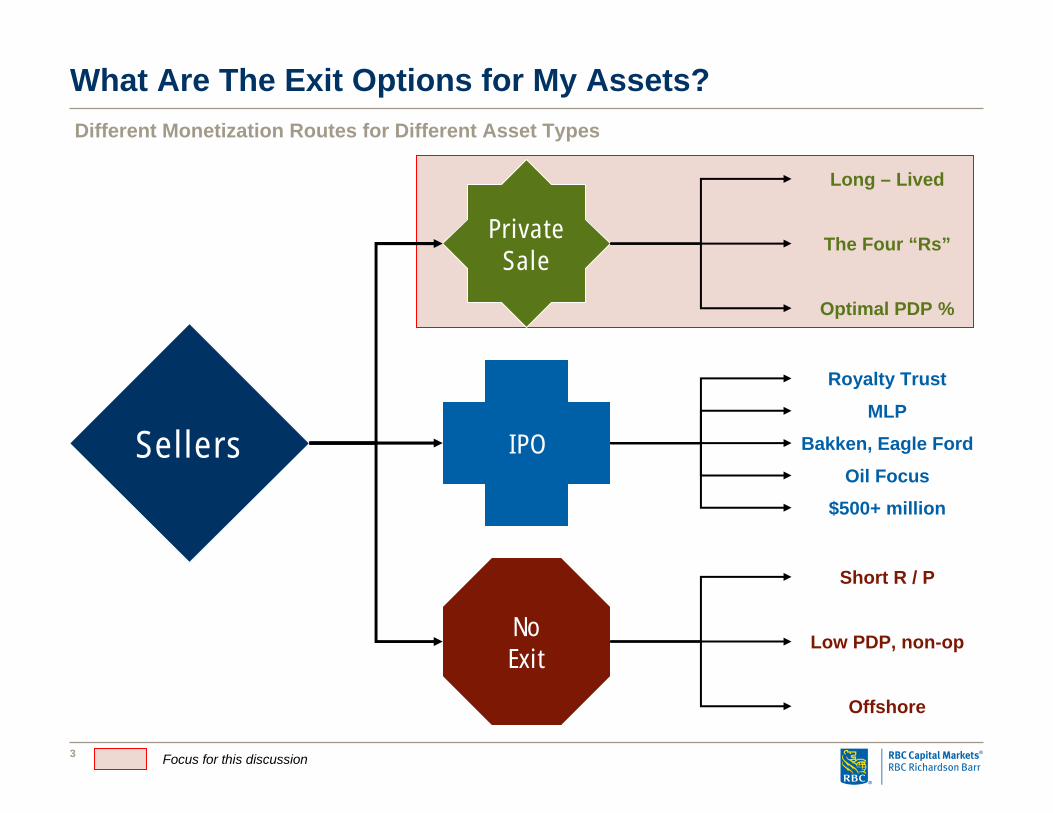
What Are The Exit Options for My Assets?Different Monetization Routes for Different Asset Types
Sellers IPO
PrivateSale
NoExit
Royalty Trust
MLP
Bakken, Eagle Ford
Oil Focus
$500+ million
Long – Lived
The Four “Rs”
Optimal PDP %
Short R / P
Low PDP, non-op
Offshore
Focus for this discussion
4
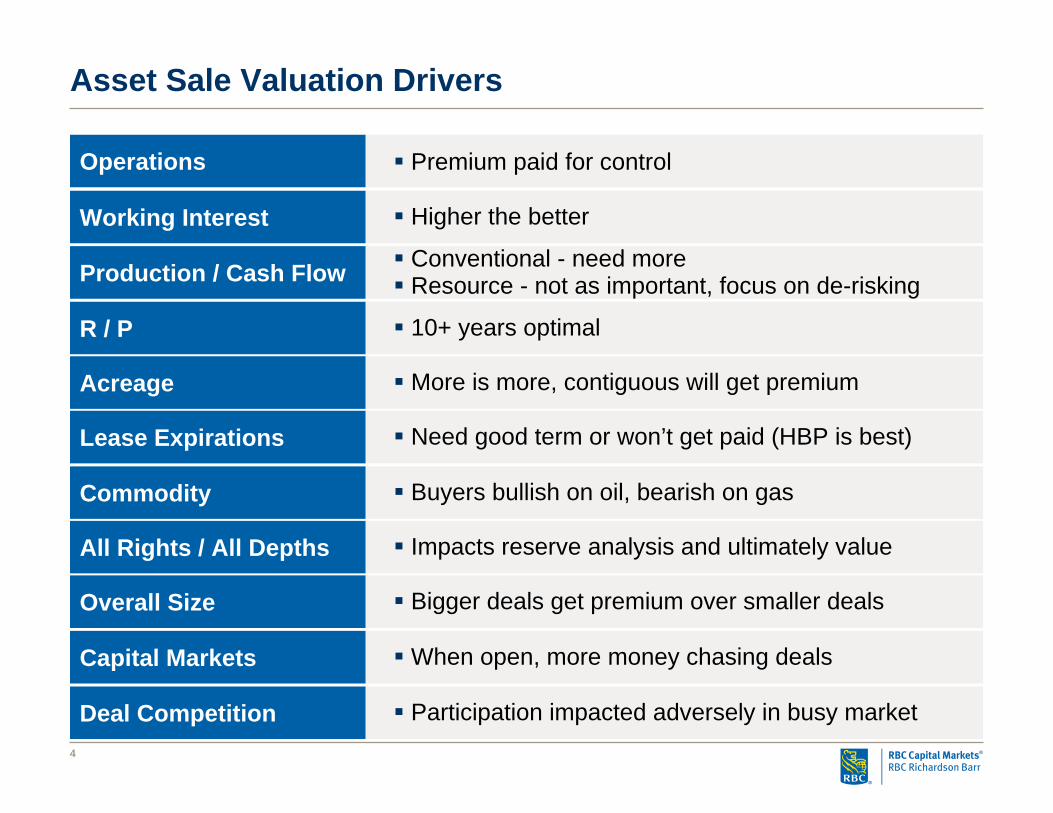
Asset Sale Valuation Drivers
Operations Premium paid for control
Production / Cash Flow Conventional - need moreResource - not as important, focus on de-risking
Working Interest Higher the better
Acreage More is more, contiguous will get premium
R / P 10+ years optimal
Lease Expirations Need good term or won’t get paid (HBP is best)
Commodity Buyers bullish on oil, bearish on gas
All Rights / All Depths Impacts reserve analysis and ultimately value
Capital Markets When open, more money chasing deals
Overall Size Bigger deals get premium over smaller deals
Deal Competition Participation impacted adversely in busy market
5
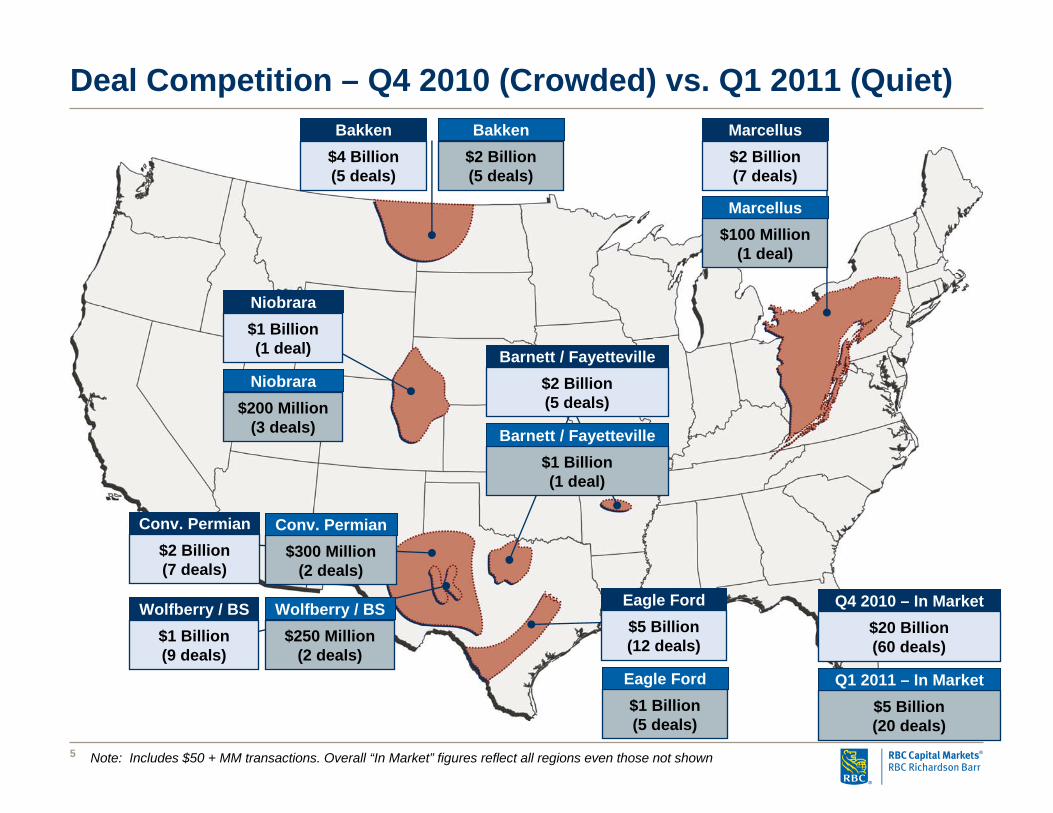
Deal Competition – Q4 2010 (Crowded) vs. Q1 2011 (Quiet)
$2 Billion(7 deals)
Marcellus$4 Billion(5 deals)
Bakken
$5 Billion(12 deals)
Eagle Ford
$1 Billion(9 deals)
Wolfberry / BS
$2 Billion(7 deals)
Conv. Permian
$20 Billion(60 deals)
Q4 2010 – In Market
$1 Billion(1 deal)
Niobrara
$300 Million(2 deals)
Conv. Permian
$250 Million(2 deals)
Wolfberry / BS
$200 Million(3 deals)
Niobrara
$1 Billion(1 deal)
Barnett / Fayetteville
$2 Billion(5 deals)
Bakken
$100 Million(1 deal)
Marcellus
$5 Billion(20 deals)
Q1 2011 – In Market$1 Billion(5 deals)
Eagle Ford
Note: Includes $50 + MM transactions. Overall “In Market” figures reflect all regions even those not shown
$2 Billion(5 deals)
Barnett / Fayetteville
6
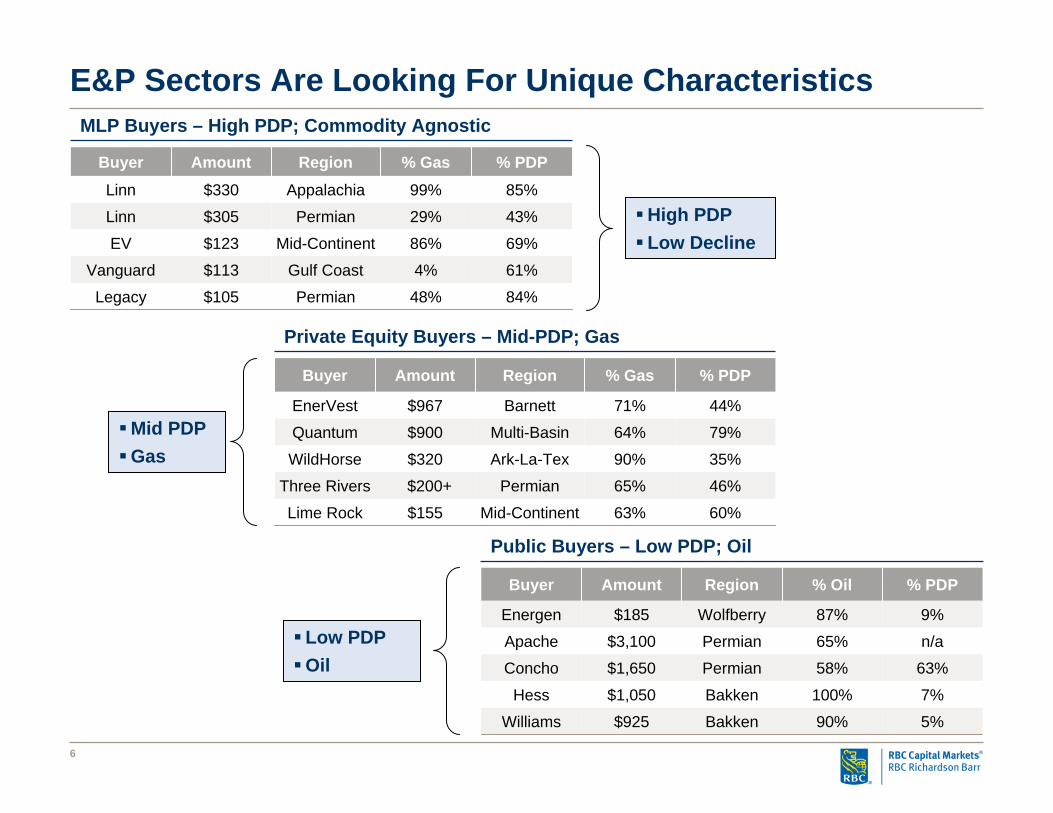
E&P Sectors Are Looking For Unique Characteristics
9%87%Wolfberry$185Energen
90%
100%
58%
65%
% Oil
63%Permian$1,650Concho
n/aPermian$3,100Apache
Bakken
Bakken
Region
5%
7%
% PDP
$925Williams
$1,050Hess
AmountBuyer
Public Buyers – Low PDP; Oil
63%
65%
90%
64%
71%
% Gas
Mid-Continent
Permian
Ark-La-Tex
Multi-Basin
Barnett
Region
60%
46%
35%
79%
44%
% PDP
$320WildHorse
$200+Three Rivers
$155Lime Rock
$900Quantum
$967EnerVest
AmountBuyer
Private Equity Buyers – Mid-PDP; Gas
48%
4%
86%
29%
99%
% Gas
69%Mid-Continent$123EV
84%Permian$105Legacy
61%Gulf Coast$113Vanguard
Permian
Appalachia
Region
43%
85%
% PDP
$305Linn
$330Linn
AmountBuyer
MLP Buyers – High PDP; Commodity Agnostic
Mid PDPGas
High PDPLow Decline
Low PDPOil
7
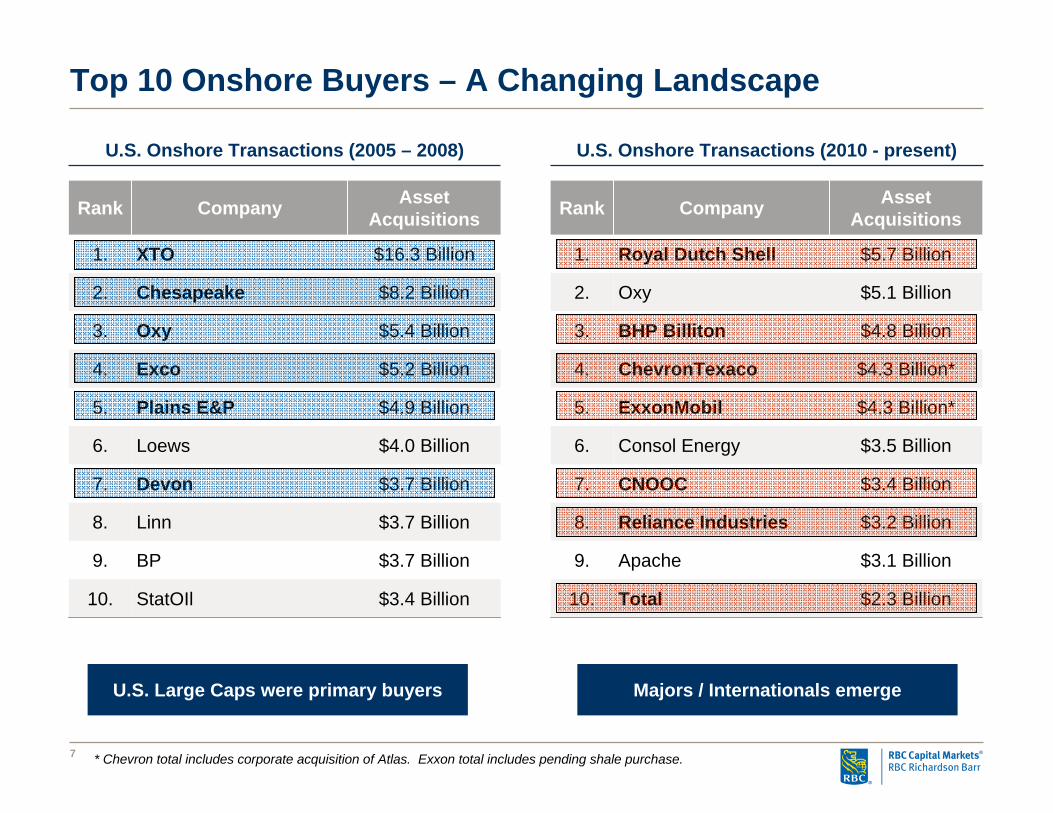
Top 10 Onshore Buyers – A Changing Landscape
U.S. Onshore Transactions (2005 – 2008) U.S. Onshore Transactions (2010 - present)
$3.4 BillionStatOIl10.
$16.3 BillionXTO1.
$8.2 BillionChesapeake2.
$5.4 BillionOxy3.
$5.2 BillionExco4.
$4.9 BillionPlains E&P5.
$3.7 Billion
$3.7 Billion
$3.7 Billion
$4.0 Billion
Asset Acquisitions
Linn8.
BP9.
Devon7.
Loews6.
CompanyRank
$2.3 BillionTotal10.
$5.7 BillionRoyal Dutch Shell1.
$5.1 BillionOxy2.
$4.8 BillionBHP Billiton3.
$4.3 Billion*ChevronTexaco4.
$4.3 Billion*ExxonMobil5.
$3.1 Billion
$3.2 Billion
$3.4 Billion
$3.5 Billion
Asset Acquisitions
Reliance Industries8.
Apache9.
CNOOC7.
Consol Energy6.
CompanyRank
U.S. Large Caps were primary buyers Majors / Internationals emerge
* Chevron total includes corporate acquisition of Atlas. Exxon total includes pending shale purchase.
DisclaimerThis presentation was prepared exclusively for the benefit of and internal use by the recipient for the purpose of considering the transaction or transactions contemplated herein. This presentation is confidential and proprietary to RBC Capital Markets Corporation (“RBCCM”) and may not be disclosed, reproduced, distributed or used for any other purpose by the recipient without RBCCM’s express written consent.
By acceptance of these materials, and notwithstanding any other express or implied agreement, arrangement, or understanding to the contrary, RBCCM, its affiliates and the recipient agree that the recipient (and its employees, representatives, and otheragents) may disclose to any and all persons, without limitation of any kind from the commencement of discussions, the tax treatment, structure or strategy of the transaction and any fact that may be relevant to understanding such treatment, structureor strategy, and all materials of any kind (including opinions or other tax analyses) that are provided to the recipient relating to such tax treatment, structure, or strategy.
The information and any analyses contained in this presentation are taken from, or based upon, information obtained from the recipient or from publicly available sources, the completeness and accuracy of which has not been independently verified, and cannot be assured by RBCCM. The information and any analyses in these materials reflect prevailing conditions and RBCCM’s views as of this date, all of which are subject to change.
To the extent projections and financial analyses are set forth herein, they may be based on estimated financial performance prepared by or in consultation with the recipient and are intended only to suggest reasonable ranges of results. The printed presentation is incomplete without reference to the oral presentation or other written materials that supplement it.
Employees of RBCCM are expressly prohibited from directly or indirectly: (a) offering any company favorable research coverage as an inducement for the receipt of investment banking business; or (b) threatening to retaliate with adverse coverage or comments if such business is not awarded. All recommendations, ratings, price targets and opinions regarding a company are determined independently by RBCCM’s Research Department.
IRS Circular 230 Disclosure: RBCCM and its affiliates do not provide tax advice and nothing contained herein should be construed as tax advice. Any discussion of U.S. tax matters contained herein (including any attachments) (i) was not intended or written to be used, and cannot be used, by you for the purpose of avoiding tax penalties; and (ii) was written in connection with the promotion or marketing of the matters addressed herein. Accordingly, you should seek advice based upon your particular circumstances from an independent tax advisor.