Embed Size (px)
Citation preview

IP Valuation Methods – Income Approach (2/2)

Recap of yesterday’s session – Introduction to DCF Methodologies

3© 2017
Review of the income approach and DCF methodologies

4© 2017
Review of the income approach and DCF methodologies

5© 2017
Review of the income approach and DCF methodologies
6© 2017
Review of the income approach and DCF methodologies

7© 2017
Review of the income approach and DCF methodologies
8© 2017
Review of the income approach and DCF methodologies

9© 2017
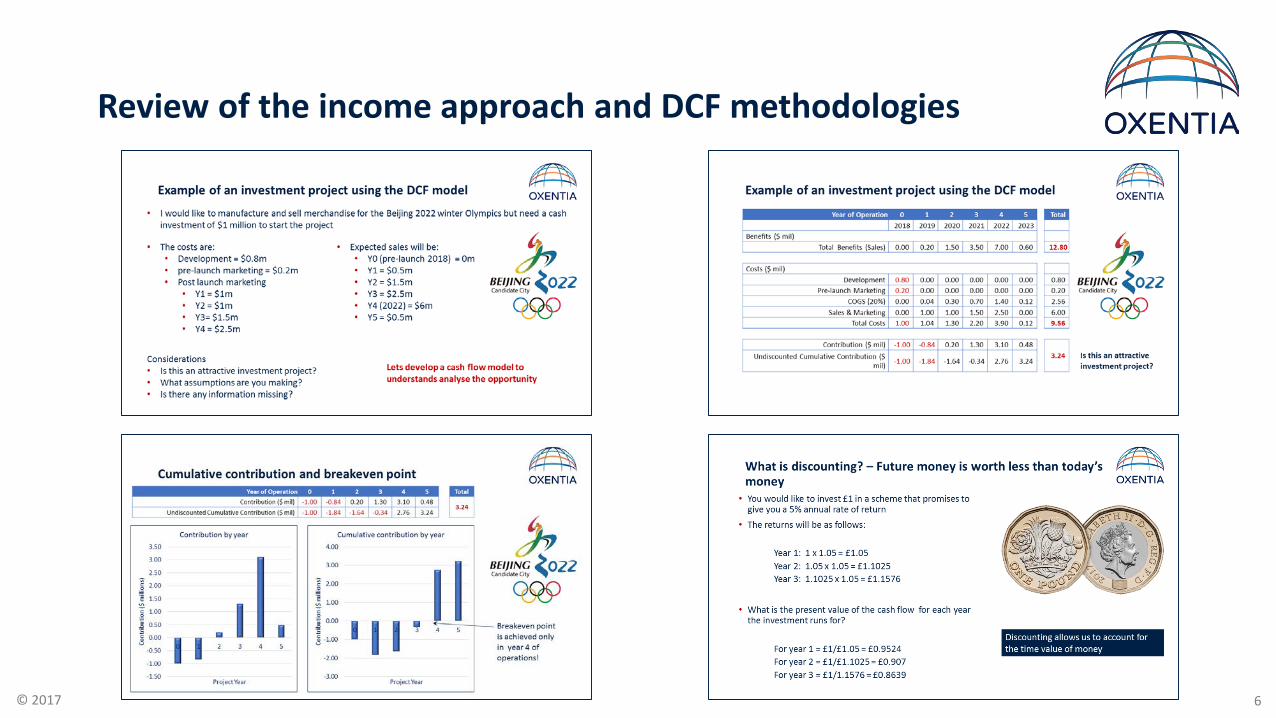
Formulating proposed deal termsIntegration with benchmarking
Discounted cash flow model (NPV)
Benchmarking data (internal, external)
Proposed deal terms
Preferences for deal type & structure(utility)
Marketanalysis
Technicalanalysis
Competitiveanalysis

10© 2017
• Can we improve our DCF model by making
better assumptions for:
• Sales projections
• Cost Of Goods sold (COGS)
• Sales & Marketing (S&M)
• General and Administrative costs
(G&A)
• How do we account for development risk?
• Success/Attrition rates
Image source: uscibooks.com

11© 2017
Learning Outcomes
• Refining the DCF model to refine assumptions:
• Adjusting for development risk
• Defining the development process for your technology
• Understanding the probability of success (attrition rate)
• Developing a risk adjusted DCF model
• Calculating an Expected Net present Value
• Understand the Internal rate of return (IRR) and how it is used in valuation of assets
12© 2017
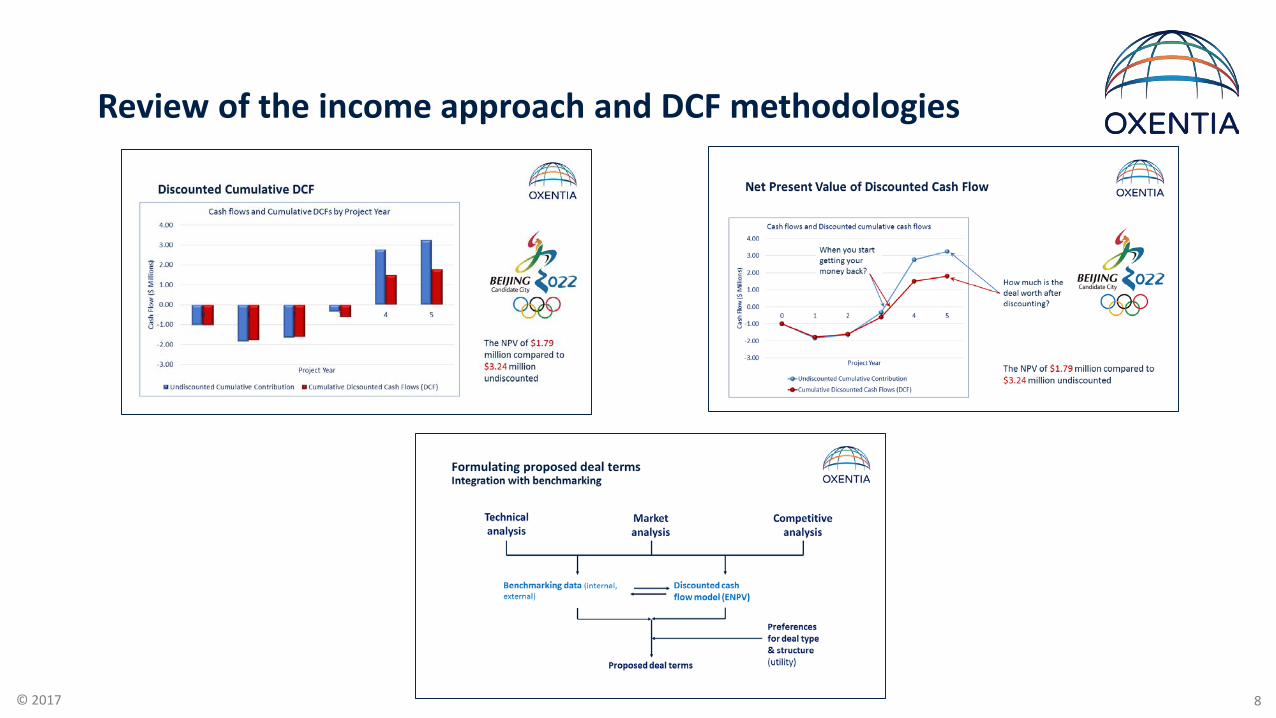
Quick reminder of DCF Model you created for QT
LICENSEE: Quintessential Technologies (QT)All sums in $ million
Year 2017 2018 2019 2020 2021 2022 2023 2024 2025 2026 2027 2028 2029 2030 2031 2032 2033 2034 2035 2036 2037 2038 2039 2040Project stage Stage 1 Stage 2 Stage 2 Stage 2 Stage 3 Stage 3 Stage 4 Stage 5 Stage 5 Stage 5 Sales Sales Sales Sales Sales Sales Sales Sales Sales Sales Sales Sales Sales SalesProject year 1 2 3 4 5 6 7 8 9 10 11 12 13 14 15 16 17 18 19 20 21 22 23 24
BenefitsSales ($m)Total benefits ($m) 0.00 0.00 0.00 0.00 0.00 0.00 0.00 0.00 0.00 0.00 150.00 250.00 500.00 800.00 1000.00 1000.00 1000.00 1000.00 1000.00 1000.00 1000.00 1000.00 1000.00 1000.00
less CostsR & D ($m) 0.00 2.00 1.67 1.67 1.67 4.00 4.00 60.00 6.67 6.67 6.67 0.00 0.00 0.00 0.00 0.00 0.00 0.00 0.00 0.00 0.00 0.00 0.00 0.00COGS ($m) 15.0% 0 0 0 0 0 0 0 0 0 0 22.5 37.5 75 120 150 150 150 150 150 150 150 150 150 150Launch marketing ($m) 0.00 0.00 0.00 0.00 0.00 0.00 0.00 0.00 0.00 15.00 60.00 40.00 0.00 0.00 0.00 0.00 0.00 0 0 0 0 0 0 0Ongoing S & M ($m) 25.0% 0.00 0.00 0.00 0.00 0.00 0.00 0.00 0.00 0.00 0.00 37.50 62.50 125.00 200.00 250.00 250.00 250.00 250.00 250.00 250.00 250.00 250.00 250.00 250.00Incremental G & A ($m) 3.0% 0.00 0.00 0.00 0.00 0.00 0.00 0.00 0.00 0.00 0.00 4.50 7.50 15.00 24.00 30.00 30.00 30.00 30.00 30.00 30.00 30.00 30.00 30.00 30.00Up-front payment to Kaizen ($m) 0.05 0.00 0.00 0.00 0.00 0.00 0.00 0.00 0.00 0.00 0.00 0.00 0.00 0.00 0.00 0.00 0.00 0.00 0.00 0.00 0.00 0.00 0.00 0.00Dev./reg. milestones to Kaizen ($m) 0.10 0.00 0.00 0.10 0.00 0.10 0.10 0.00 0.00 0.10 0.00 0.00 0.00 0.00 0.00 0.00 0.00 0.00 0.00 0.00 0.00 0.00 0.00 0.00
Royalty to Kaizen ($m) 5.0% 0.00 0.00 0.00 0.00 0.00 0.00 0.00 0.00 0.00 0.00 7.50 12.50 25.00 40.00 50.00 50.00 50.00 50.00 50.00 50.00 50.00 50.00 50.00 50.00Total costs ($m) 0.15 2.00 1.67 1.77 1.67 4.10 4.10 60.00 6.67 21.77 138.67 160.00 240.00 384.00 480.00 480.00 480.00 480.00 480.00 480.00 480.00 480.00 480.00 480.00
Contribution ($m) -0.15 -2.00 -1.67 -1.77 -1.67 -4.10 -4.10 -60.00 -6.67 -21.77 11.33 90.00 260.00 416.00 520.00 520.00 520.00 520.00 520.00 520.00 520.00 520.00 520.00 520.00
Discount factors 9.5% 1.00 0.91 0.83 0.76 0.70 0.64 0.58 0.53 0.48 0.44 0.40 0.37 0.34 0.31 0.28 0.26 0.23 0.21 0.20 0.18 0.16 0.15 0.14 0.12
DCFs -0.15 -1.83 -1.39 -1.35 -1.16 -2.60 -2.38 -31.79 -3.23 -9.62 4.57 33.17 87.50 127.85 145.95 133.29 121.72 111.16 101.52 92.71 84.67 77.32 70.61 64.49
Net Present Value ($m) 1201.06

13© 2017
Quick reminder of DCF Model you created for QB
-100.00
0.00
100.00
200.00
300.00
400.00
500.00
600.00
2017 2020 2023 2026 2029 2032 2035 2038
Cont
ribut
ion
($ M
illio
ns)
Year
Contributions and DCFs for IP-1 technology – Licensee’s Perspective
Contribution (£m) DCFs (£m)
Do we have reasonable assumptions for these DCF values?
14© 2017
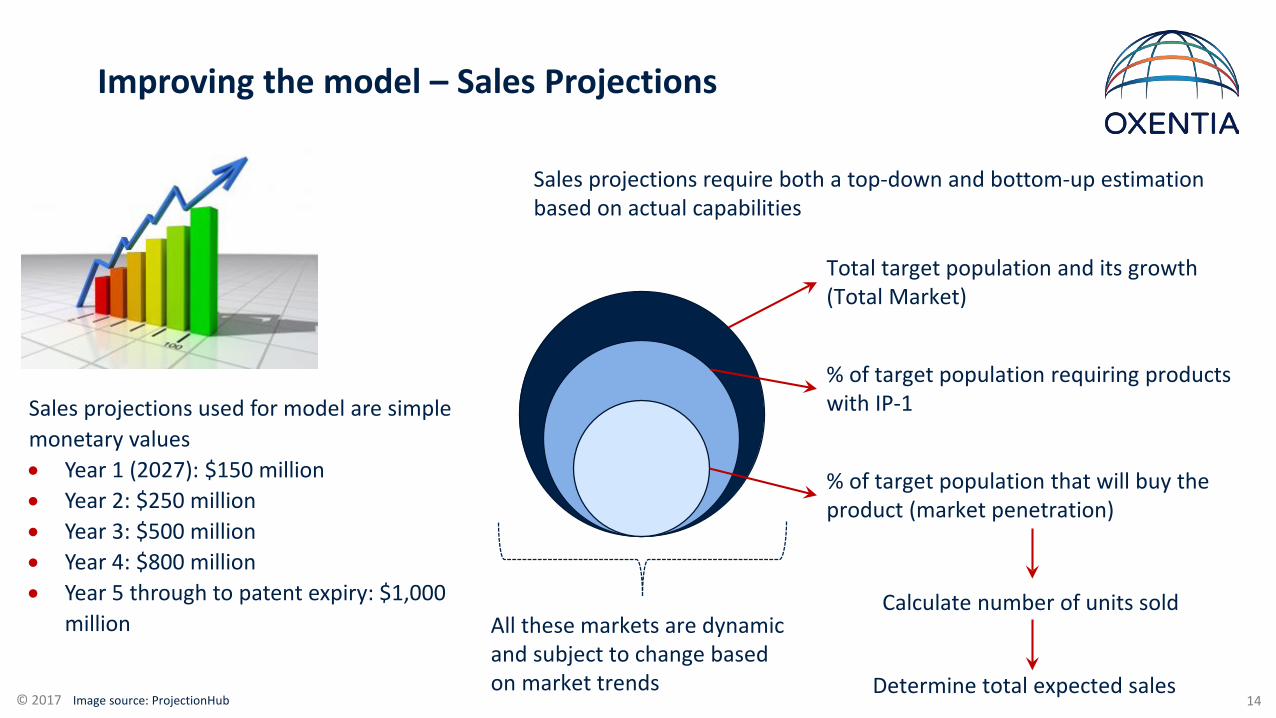
Improving the model – Sales Projections
Image source: ProjectionHub
Sales projections used for model are simple monetary values• Year 1 (2027): $150 million• Year 2: $250 million• Year 3: $500 million• Year 4: $800 million• Year 5 through to patent expiry: $1,000
million
Sales projections require both a top-down and bottom-up estimation based on actual capabilities
% of target population that will buy the product (market penetration)
Total target population and its growth (Total Market)
% of target population requiring products with IP-1
Calculate number of units sold
Determine total expected sales
All these markets are dynamic and subject to change based on market trends
15© 2017
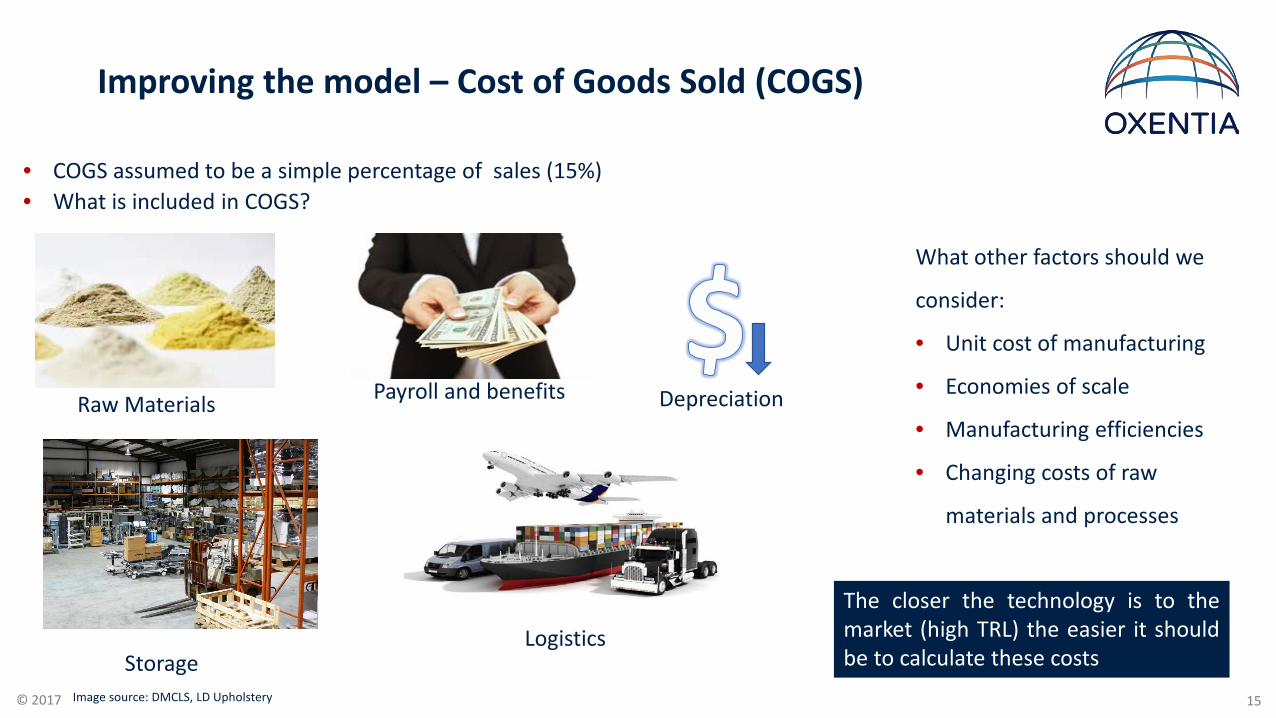
Improving the model – Cost of Goods Sold (COGS)
Image source: DMCLS, LD Upholstery
• COGS assumed to be a simple percentage of sales (15%)• What is included in COGS?
Payroll and benefitsRaw Materials
LogisticsStorage
Depreciation
What other factors should we
consider:
• Unit cost of manufacturing
• Economies of scale
• Manufacturing efficiencies
• Changing costs of raw
materials and processes
The closer the technology is to themarket (high TRL) the easier it shouldbe to calculate these costs

16© 2017
Improving the model – S&M and G&A Costs
Image source: Alternatives.ie, Andrea Umbach
• The model estimates S&M costs to equal 25% of sales
• Would S&M be higher pre-launch or in the first years
of sales?
• What if S&M costs were for B2C instead of B2B?
Sales and Marketing (S&M) General and Administrative
• The model estimates G&A costs to equal 3% of sales
• What is included?
• patent costs, admin support, operating costs
(office space and equipment), other assets?
• What can the licensee truly justify as a G&A cost?

17© 2017
Adjusting for Risk

18© 2017
Developmental product valuationDCF models and ENPV calculation
Risk-adjustedDiscounted Cash Flow (DCF) model
Project Expected Net Present (ENPV)
Marketanalysis
Technicalanalysis
Competitiveanalysis
19© 2017
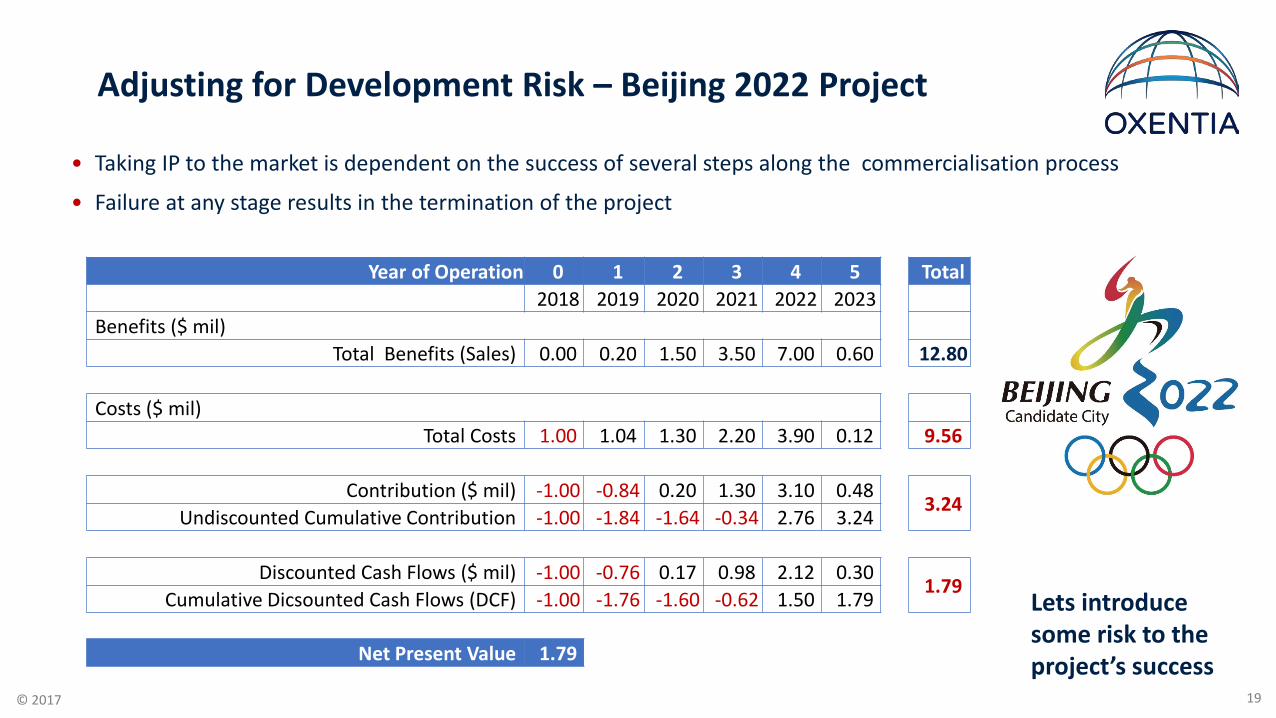
Adjusting for Development Risk – Beijing 2022 Project
• Taking IP to the market is dependent on the success of several steps along the commercialisation process
• Failure at any stage results in the termination of the project
Year of Operation 0 1 2 3 4 5 Total2018 2019 2020 2021 2022 2023
Benefits ($ mil)Total Benefits (Sales) 0.00 0.20 1.50 3.50 7.00 0.60 12.80
Costs ($ mil)Total Costs 1.00 1.04 1.30 2.20 3.90 0.12 9.56
Contribution ($ mil) -1.00 -0.84 0.20 1.30 3.10 0.483.24
Undiscounted Cumulative Contribution -1.00 -1.84 -1.64 -0.34 2.76 3.24
Discounted Cash Flows ($ mil) -1.00 -0.76 0.17 0.98 2.12 0.301.79
Cumulative Dicsounted Cash Flows (DCF) -1.00 -1.76 -1.60 -0.62 1.50 1.79
Net Present Value 1.79
Lets introduce some risk to the project’s success

20© 2017
Adjusting for Development Risk – Beijing 2022 Project
• The project requires $1 million cash investment
• What if the project had a 70% probability of success in the year before sales begin and also falls to 50% chance of success the year after the tournament
• This risk can be built into a risk-adjusted DCF (raDCF) model
• In a similar way to NPV calculations, the sum of all raDCFs for the project horizon yields the Expected Net Present Value (ENPV)
Year 02018
12019
22020
32021
42022
52023
-$1 million
Sales
Project Failure
70%
30%
Sales
Project Terminated
50%
50%

21© 2017
Year of Operation 0 1 2 3 4 5 Total2018 2019 2020 2021 2022 2023
Benefits ($ mil)Total Benefits (Sales) 0.00 0.20 1.50 3.50 7.00 0.60 12.80
Costs ($ mil)Total Costs 1.00 1.04 1.30 2.20 3.90 0.12 9.56
Contribution ($ mil) -1.00 -0.84 0.20 1.30 3.10 0.48 3.24Undiscounted Cumulative Contribution -1.00 -1.84 -1.64 -0.34 2.76 3.24
Probability of success 100% 70% 70% 70% 70% 50%risk adjusted contribution -1.00 -1.29 -1.15 -0.24 1.93 1.62
Discounted Cash Flows ($ mil) -1.00 -0.76 0.17 0.98 2.12 0.30 1.79
risk adjusted DCF (raDCF) -1.00 -1.17 -0.95 -0.18 1.32 1.01 -0.97cumulative raDCF -1.00 -2.17 -3.12 -3.30 -1.98 -0.97
Expected Net Present Value (ENPV) -0.97
Adjusting for Development Risk – Beijing 2022 Project
Undiscounted = $3.24 milNPV = $1.79 mil
ENPV = $-0.97 mil

22© 2017
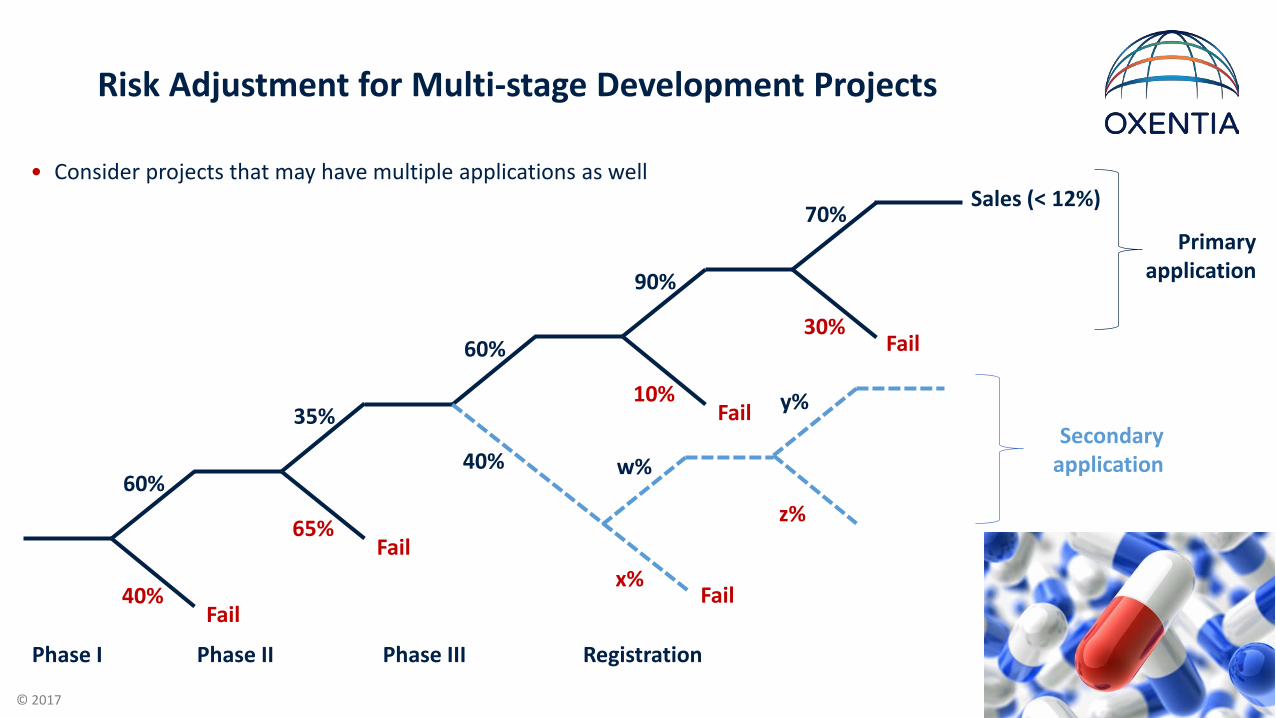
Risk Adjustment for Multi-stage Development Projects
• Commercialisation of technologies typically involves multiple sequential stages
• Each stage has its own timescale, cost and risk
Phase I Phase II Phase III Registration
Fail
60%
40%
Fail
35%
65%
Fail
62%
38%
Fail
90%
10%
Fail
70%
30%
Sales (< 12%)
Data from Tufts Center for the Study of Drug Development (2014)
Development steps in a human therapeutic drug candidate project.
23© 2017
Risk Adjustment for Multi-stage Development Projects
• Consider projects that may have multiple applications as well
Phase I Phase II Phase III Registration
Fail
60%
40%
Fail
35%
65%
Fail
60%
40%
Fail
90%
10%
Fail
70%
30%
Sales (< 12%)
w%
x%
y%
z%
Primary application
Secondary application
24© 2017
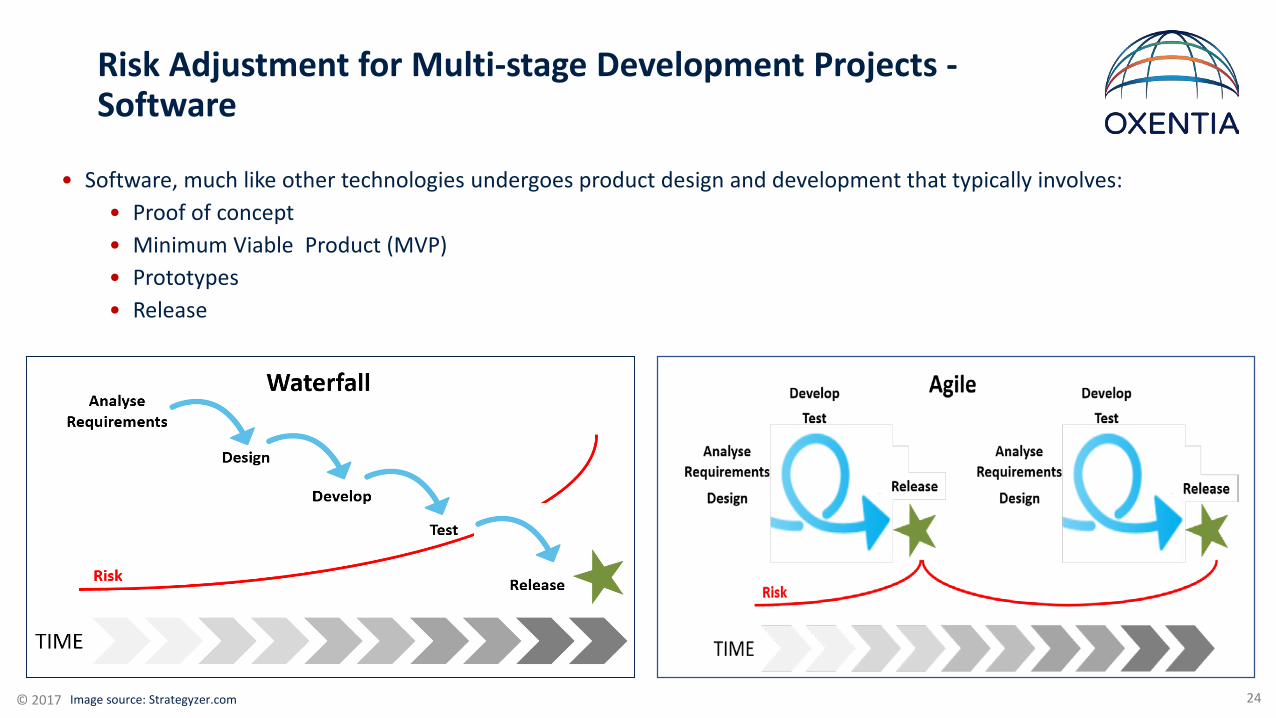
Risk Adjustment for Multi-stage Development Projects -Software
• Software, much like other technologies undergoes product design and development that typically involves:• Proof of concept • Minimum Viable Product (MVP) • Prototypes• Release
Image source: Strategyzer.com

25© 2017
Risk Adjustment for Multi-stage Development Projects –Physical Sciences
Image source: Serkan Botan, NASA project
26© 2017
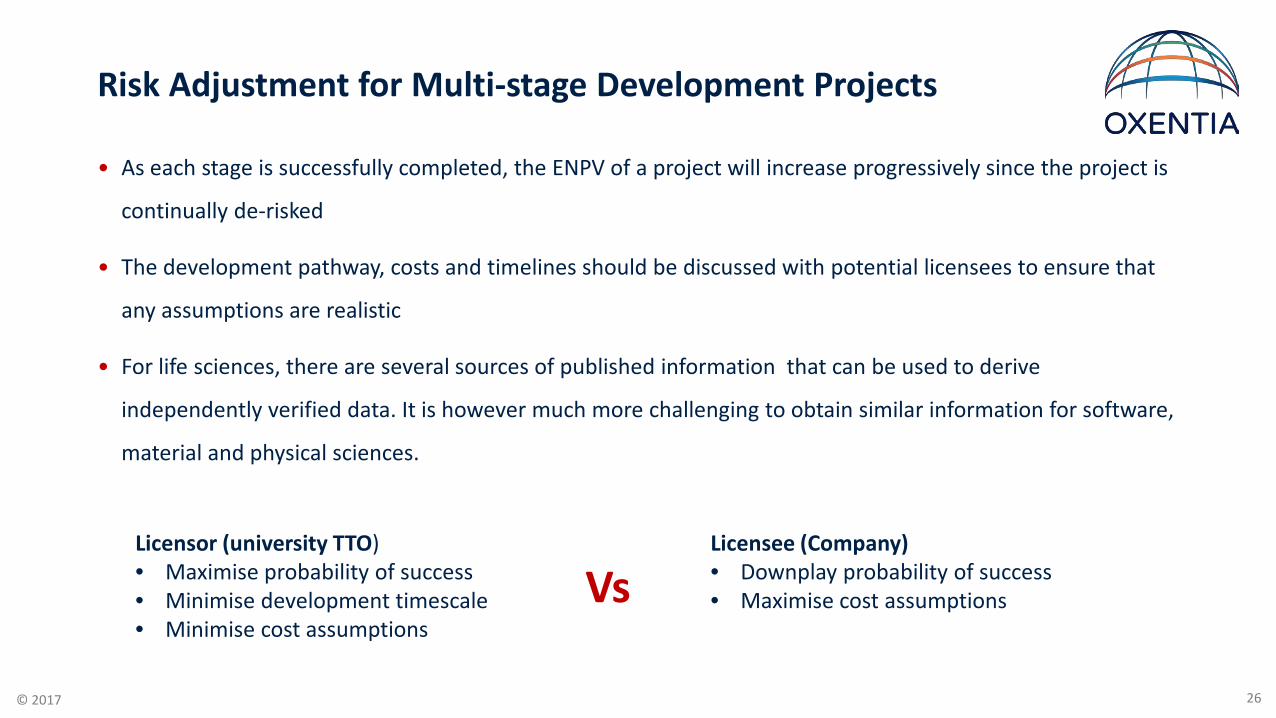
Risk Adjustment for Multi-stage Development Projects
• As each stage is successfully completed, the ENPV of a project will increase progressively since the project is
continually de-risked
• The development pathway, costs and timelines should be discussed with potential licensees to ensure that
any assumptions are realistic
• For life sciences, there are several sources of published information that can be used to derive
independently verified data. It is however much more challenging to obtain similar information for software,
material and physical sciences.
Licensor (university TTO)• Maximise probability of success• Minimise development timescale• Minimise cost assumptions
Licensee (Company)• Downplay probability of success• Maximise cost assumptionsVs

27© 2017
Internal Rate of Return (IRR)
• It is used to determine the profitability of a project and is
commonly used by companies to determine which projects to
invest in.
• The higher the IRR, the more attractive a project is
• Limitations:
• Shifts focus from monetary value (NPV) to relative value (%)
• High IRR projects which generate lower sums of money are
favoured over lower IRR projects that return more money
IRR (%)
NPV ($)
Discount Rate (%)
• The internal rate of return (IRR) is the discount rate when the net present value (NPV) from a project equal zero.
The IRR is an indicator of a project’s profitability and efficiency of a project while the NPV indicates the net value added by undertaking a project.
28© 2017
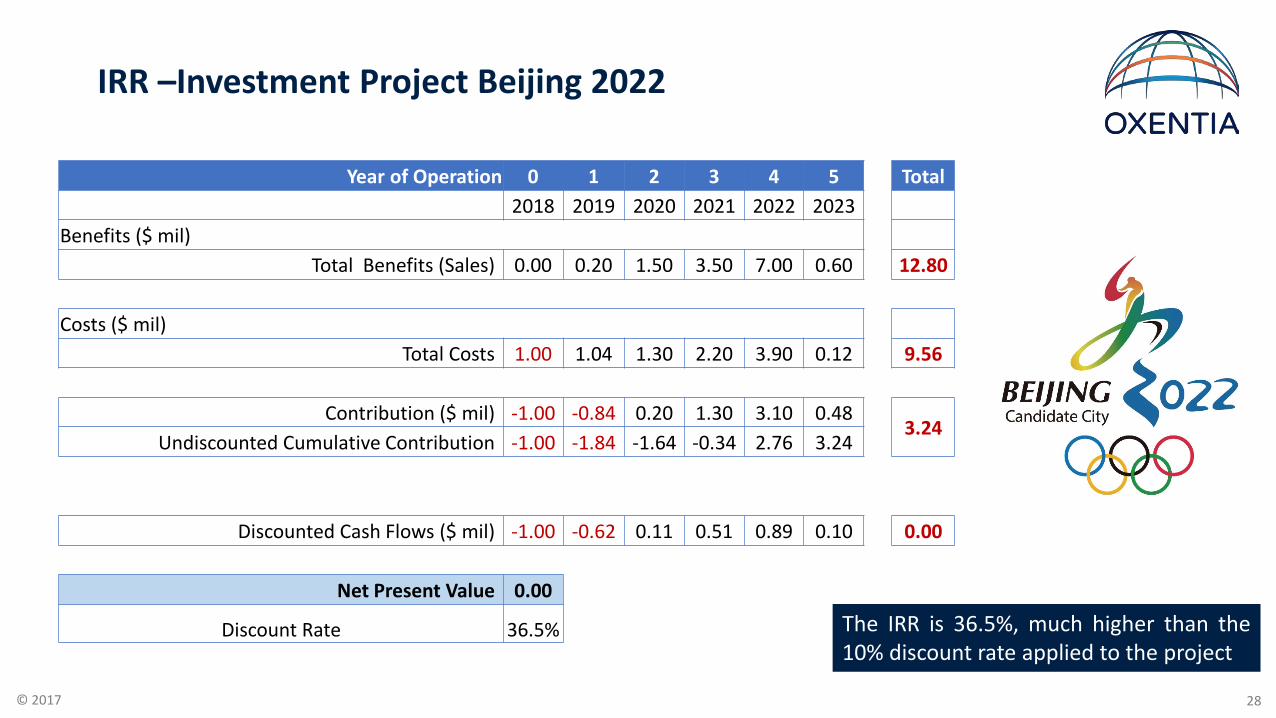
IRR –Investment Project Beijing 2022
Year of Operation 0 1 2 3 4 5 Total2018 2019 2020 2021 2022 2023
Benefits ($ mil)Total Benefits (Sales) 0.00 0.20 1.50 3.50 7.00 0.60 12.80
Costs ($ mil)Total Costs 1.00 1.04 1.30 2.20 3.90 0.12 9.56
Contribution ($ mil) -1.00 -0.84 0.20 1.30 3.10 0.483.24
Undiscounted Cumulative Contribution -1.00 -1.84 -1.64 -0.34 2.76 3.24
Discounted Cash Flows ($ mil) -1.00 -0.62 0.11 0.51 0.89 0.10 0.00
Net Present Value 0.00
Discount Rate 36.5% The IRR is 36.5%, much higher than the10% discount rate applied to the project

29© 2017
Formulating financial terms of a license deal using ENPV

30© 2017
A Look at recent deals in Pharma
Financial Terms Amount ($ Millions)
Upfront payments $640
Development costs $750
Sales milestone $375
Research Funding $ 160
Immuno-oncology deal termsLicensee Licensor
Financial Terms Amount ($ Millions)
Upfront paymentsResearch funding
Pre-clinical milestones payments
$36
Other milestones (clinical trial success, sales) $754
Royalties Not disclosed
Antibody platform deal terms
31© 2017
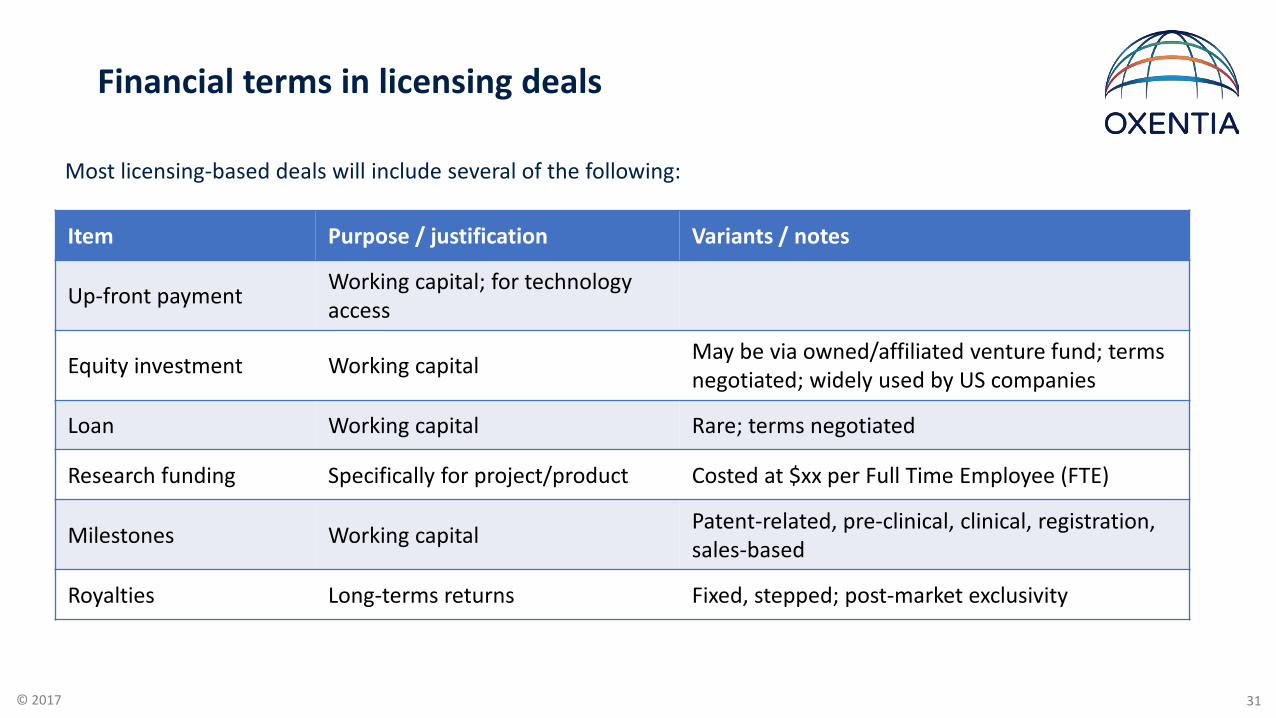
Financial terms in licensing deals
Most licensing-based deals will include several of the following:
Item Purpose / justification Variants / notes
Up-front payment Working capital; for technologyaccess
Equity investment Working capital May be via owned/affiliated venture fund; terms negotiated; widely used by US companies
Loan Working capital Rare; terms negotiated
Research funding Specifically for project/product Costed at $xx per Full Time Employee (FTE)
Milestones Working capital Patent-related, pre-clinical, clinical, registration, sales-based
Royalties Long-terms returns Fixed, stepped; post-market exclusivity

32© 2017
Standard in-licensing process
Find the Asset Evaluate the Asset Acquire the AssetDevelop, and sell asset successfully
• Identify opportunities
• Initial technical evaluation
• Detailed technical and commercial evaluation
• More assessments• Contract negotiations
• Project implementation
• Research strategy• Licensing• External TTO
Step
Activity
Team involved
• Corporate BD• Market research• Manufacturing/Process• Corporate finance• IP & licensing
• Corporate BD• Legal/Contracts• Marketing• Corporate finance
• Research• Manufacturing/Process
Regular review and approvals conducted and guidance from senior management

33© 2017
“…the general who wins a battle makes many calculations…..before the battle is fought.…..Thus do many calculations lead to victory and few calculations to defeat.”
Sun Tzu, Art of War
34© 2017
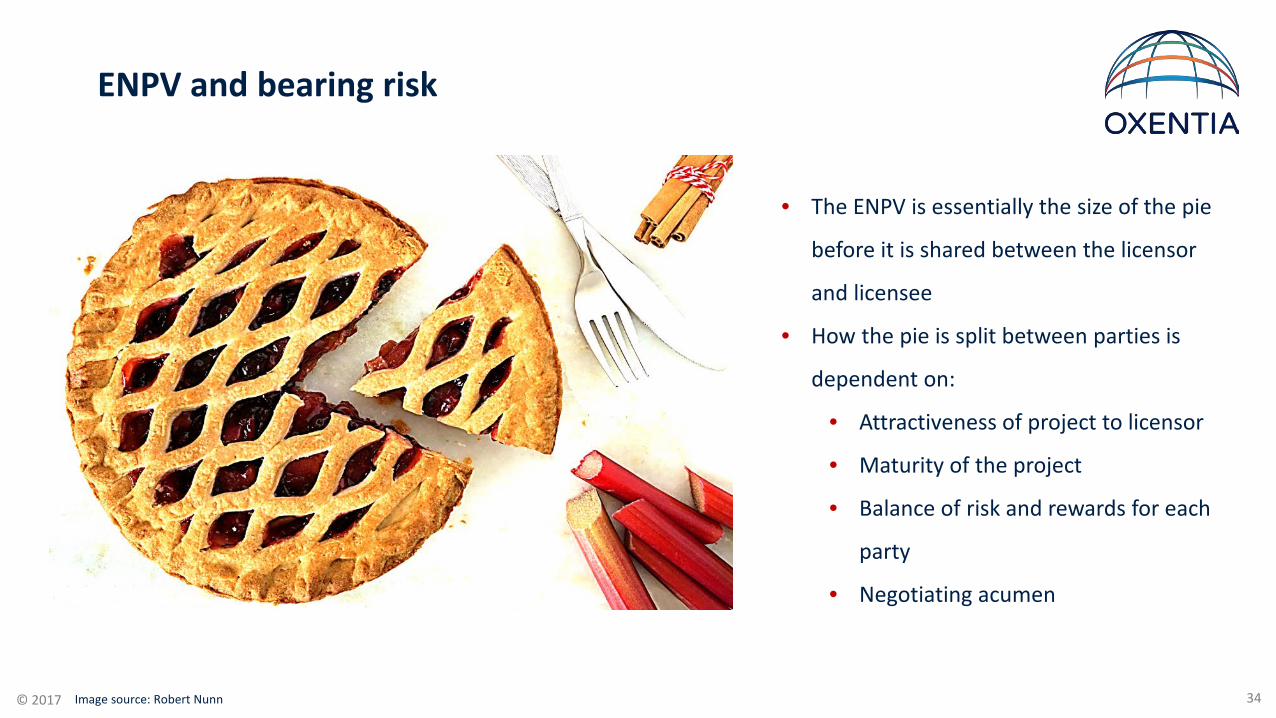
ENPV and bearing risk
• The ENPV is essentially the size of the pie
before it is shared between the licensor
and licensee
• How the pie is split between parties is
dependent on:
• Attractiveness of project to licensor
• Maturity of the project
• Balance of risk and rewards for each
party
• Negotiating acumen
Image source: Robert Nunn
35© 2017
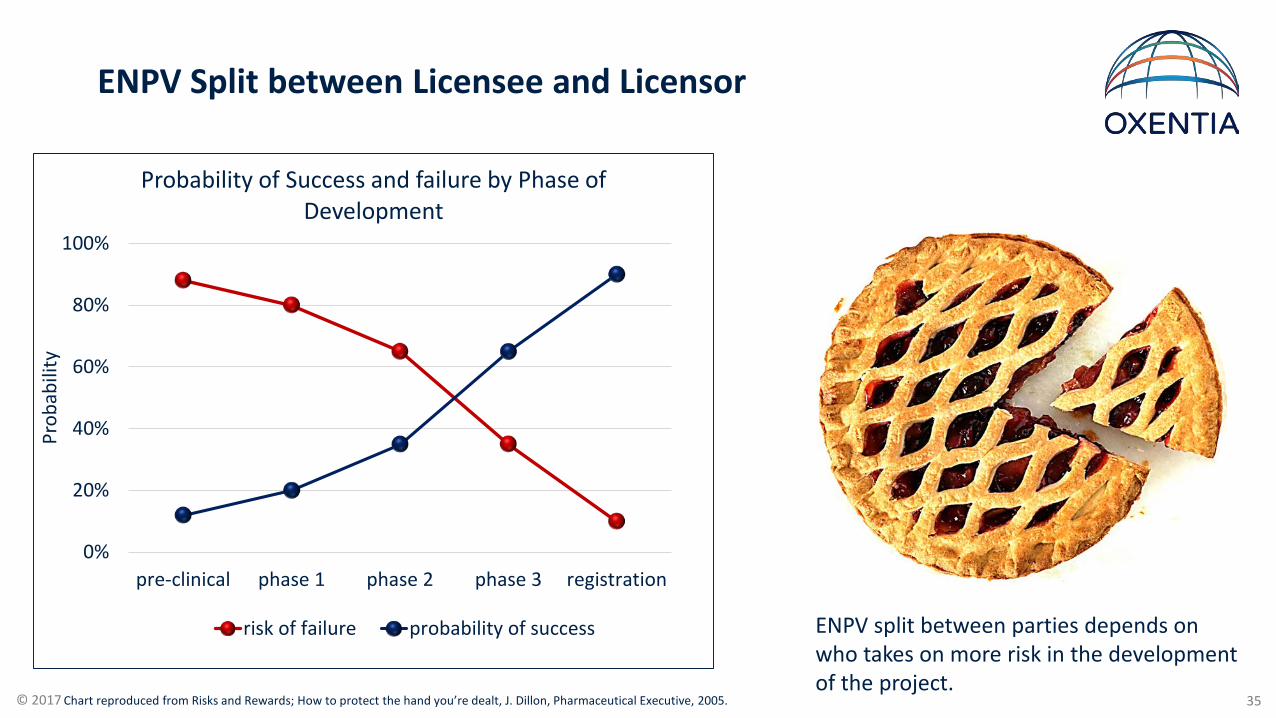
ENPV Split between Licensee and Licensor
0%
20%
40%
60%
80%
100%
pre-clinical phase 1 phase 2 phase 3 registration
Prob
abili
ty
Probability of Success and failure by Phase of Development
risk of failure probability of success
Chart reproduced from Risks and Rewards; How to protect the hand you’re dealt, J. Dillon, Pharmaceutical Executive, 2005.
ENPV split between parties depends on who takes on more risk in the development of the project.

36© 2017
ENPV Split Guidelines
Lice
nsor
’s %
of E
NPV
10%
20%
30%
40%
15% - 20%
20% - 25%
25% - 35%
PHASE I PHASE II PHASE IIIPRE-CLIN.ADV. RES.
8% - 12%
10% - 20%
TRL 5 TRL 6 TRL 7 - 8TRL 3 - 4TRL 2 - 3
Life sciences
Material and Physical sciences

37© 2017
ENPV Split example
Licensor
Licensee
Prior to 1st Human Dose
Licensor
Licensee
End of Phase 1
Licensor
Licensee
End of Phase 2
Licensor
Licensee
End of Phase 3
Data reproduced from Get better Deals by Understanding the Negotiation Practices of Multinational Pharmaceutical Companies, R. brown, Plexus Ventures, 2006

38© 2017
ENPV Split between Licensee and Licensor
ENPV
LicenseeLicensor
All financial terms are included in this share:
• Upfront payments
• Milestone fees
• Research funding
• Royalties (%) on sales
• Equity
Image source: Robert Nunn
39© 2017
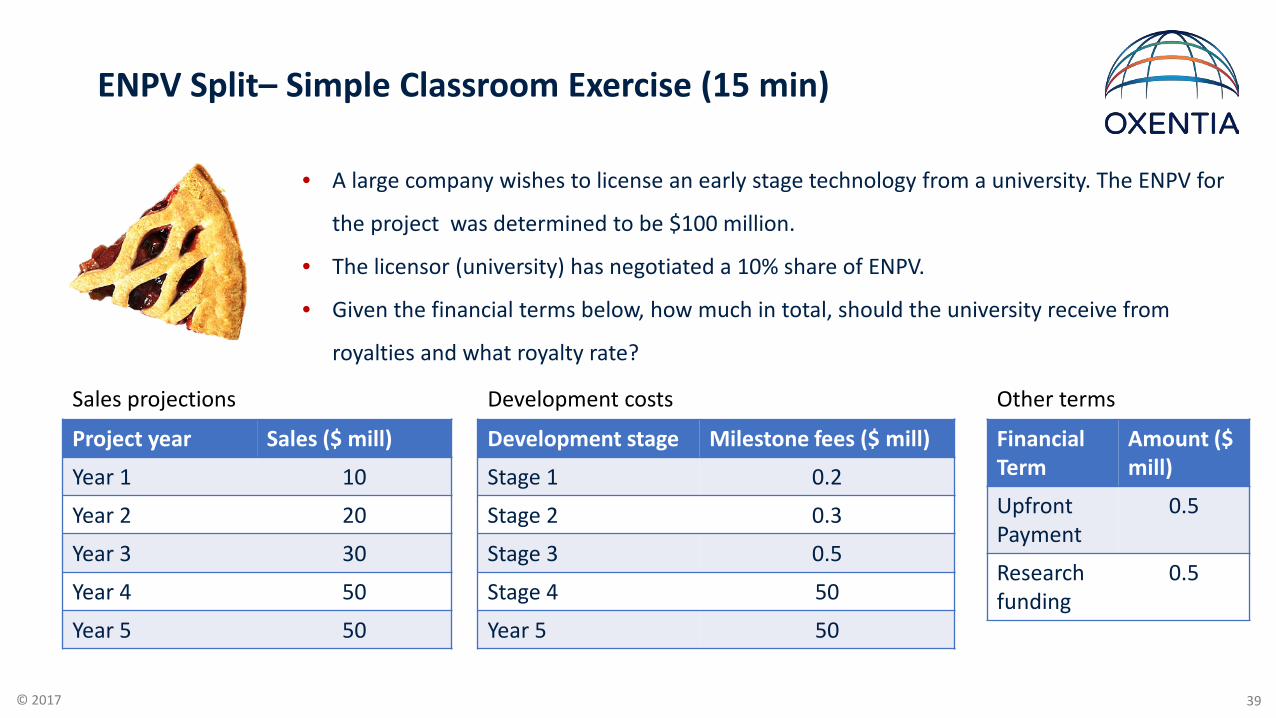
ENPV Split– Simple Classroom Exercise (15 min)
Project year Sales ($ mill)
Year 1 10
Year 2 20
Year 3 30
Year 4 50
Year 5 50
Development stage Milestone fees ($ mill)
Stage 1 0.2
Stage 2 0.3
Stage 3 0.5
Stage 4 50
Year 5 50
Sales projections Other terms
FinancialTerm
Amount ($ mill)
UpfrontPayment
0.5
Research funding
0.5
Development costs
• A large company wishes to license an early stage technology from a university. The ENPV for
the project was determined to be $100 million.
• The licensor (university) has negotiated a 10% share of ENPV.
• Given the financial terms below, how much in total, should the university receive from
royalties and what royalty rate?

40© 2017
Summary
• ENPV approach is based on capturing all relevant cash flows, discounting them to express the
contribution in today’s money and then applying an appropriate adjustment for technical risk.
• ENPV calculated from raDCFs is the industry standard approach to valuing investment projects
• It is important to bear in mind the assumptions and approximations used to arrive at the ENPV
and how these may change
• The IRR is a measure of a project’s profitability
• ENPV represents the size of the opportunity and is split between parties depending on project
maturity, risk sharing and negotiation