Embed Size (px)
Citation preview
COMMONWEALTH OF AUSTRALIA
DEPARTMENT OF NATIONAL DEVELOPMENT
ts
10 1
3 BUREAU OF MINERAL RESOURCES, GEOLOGY AND GEOPHYSICS
RECORD N°• 1962/105
FITZROY AND CANNING BASINS,RECONNAISSANCE GRAVITY
SURVEYS,WESTERN AUSTRALIA 1952-60
by
A. J. FLAVELLE and M. J. GOODSPEED
The Information contained in this report has been obtained bythe Department of National Development, as part of the policyOf the Commonwealth Government, to assist in the explorationand development of mineral resources. It may not be publishedin any form or used in a company prospectus or statement withoutthe permission in writing of the Director, Bureau of MineralResources, Geology and Geophysics,
COMMONWEALTH OF AUSTRALIA
DEPARTMENT OF NATIONAL DEVELOPMENT
BUREAU OF MINERAL RESOURCES, GEOLOGY AND GEOPHYSICS
RECORD N°• 1962/105
FITZROY AND CANNING BASINS,RECONNAISSANCE GRAVITY
SURVEYS,WESTERN AUSTRALIA 1952-60
•
1^- .--- -Divskti _ ,,i • A , • ...i A.A,I nto^.,,,,--"^I ,, , A .■, .C, . j ,
1.4 ,... & . U^IL i . . I ■:. ' C
I
Sairt7O0,COOCoo,4 •,00•■•.0^o
by
A. J. FLAVELLE and M. J. GOODSPEED
The information contained in this report has been obtained bythe Department of National Development, as part of the policyof the Commonwealth Government, to assist in the explorationand development of mineral resources. It may not be publishedin any form or used in a company prospectus or statement withoutthe permission in writing of the Director, Bureau of MineralResources, Geology and Geophysics.
CONTENTS
Page
SUMMARY
1,^INTRODUCTION^ 1
2. GEOLOGY^ 1
3. GRAVITY ANOMALY FEATURES^ 7
4. DISCUSSION OF GRAVITY RESULTS^ 11
5. INTERPRETATION OF GRAVITY RESULTS^ 12
6. CONCLUSIONS^ 23
7. RECOMMENDATIONS^ 24
8. REFERENCES^ 24
APPENDIX A - Computational methods^ 27
APPENDIX B - History of surveys^ 28
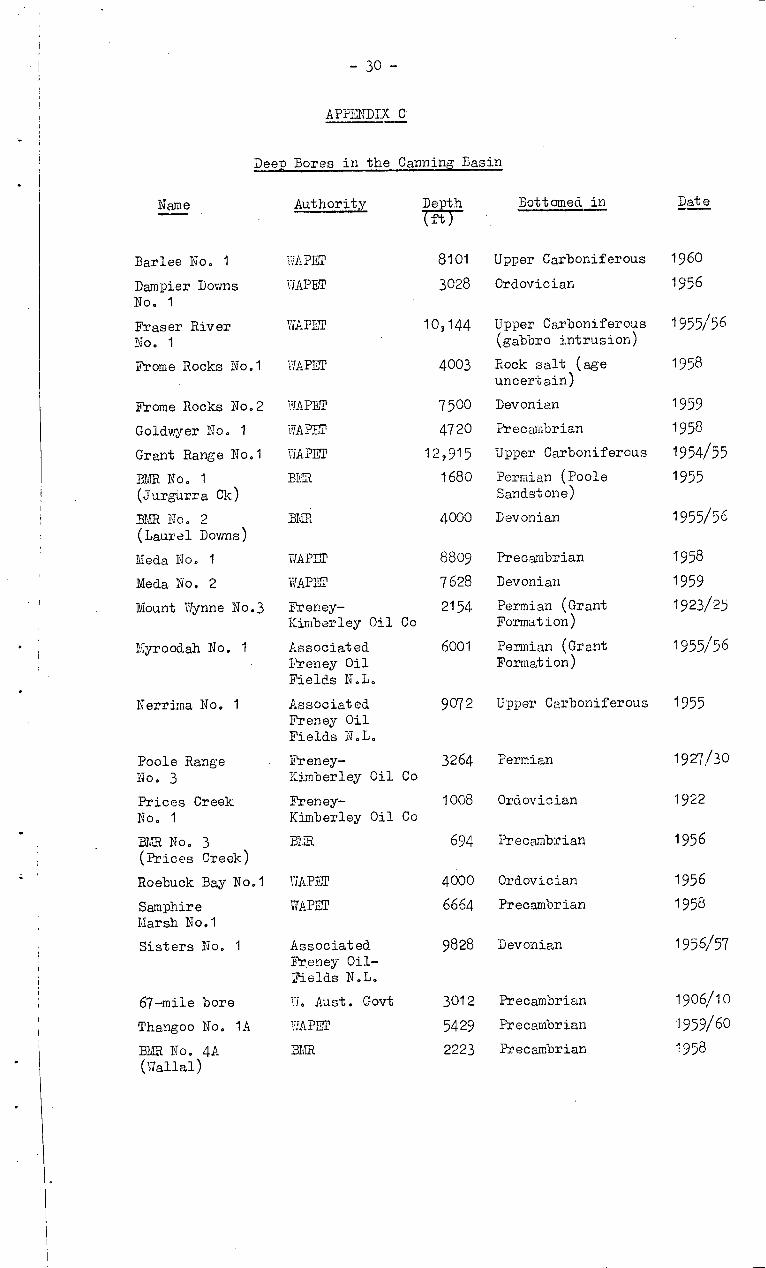
APPENDIX C - Deep bores in the Canning Basin^30
APPENDIX D - Explanation of terms^ 31
ILLUSTRATIONS
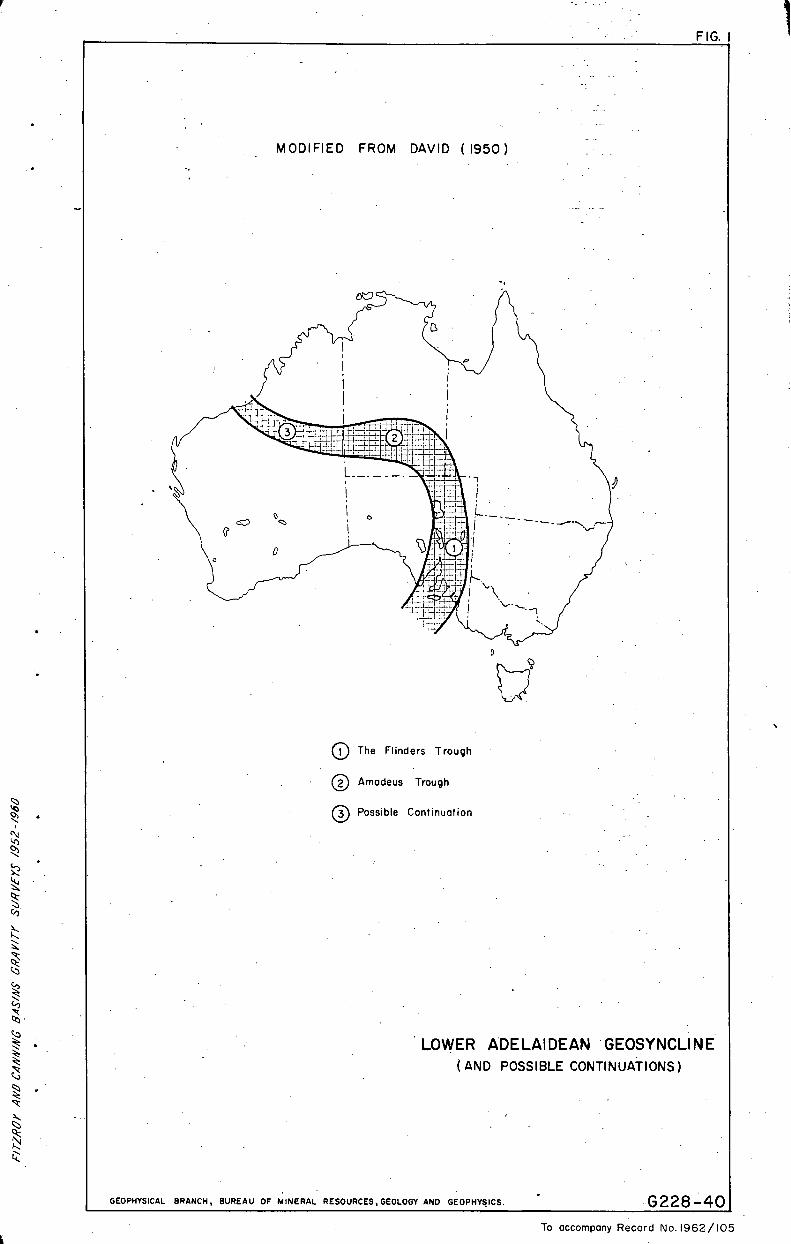
Figure 1. Lower Adelaidean Geosyncline (andpossible continuations) (Drawing No.
G228-40)
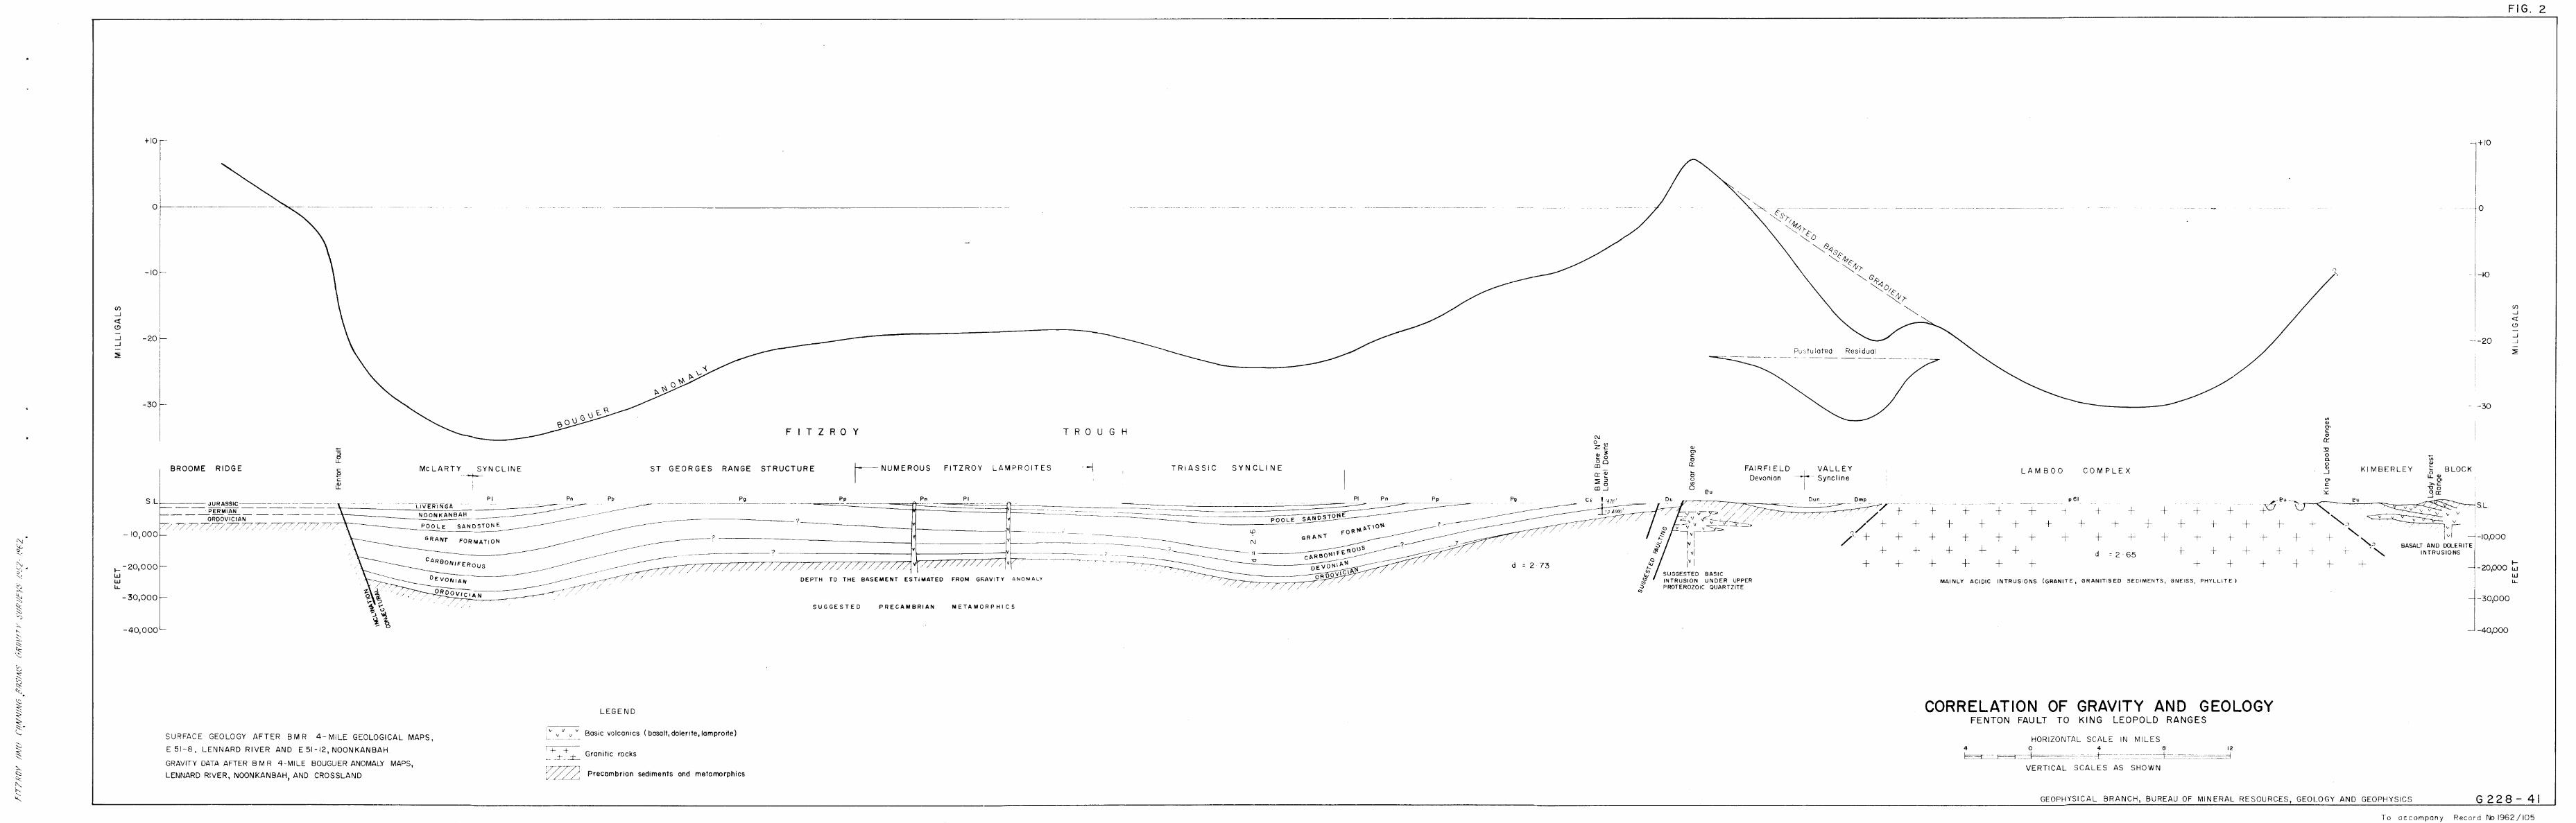
Figure 2. Correlation of gravity and geology,Fenton Fault to King Leopold Range
(G228-41)
Figure 3. Hypothetical cross-sections^(G228-42)
Figure 4. Density v. depth profiles, DampierDowns No. 1, Frome Rocks No. 2,Grant Range No. 1, Thangoo No. 1.
(G228-43)
Figure 5. Density v. depth profile Meda No. 1(G228-44)
^
fr•
Record No. 1962/105
'■1
ILLUSTRATIONS - (cont.)
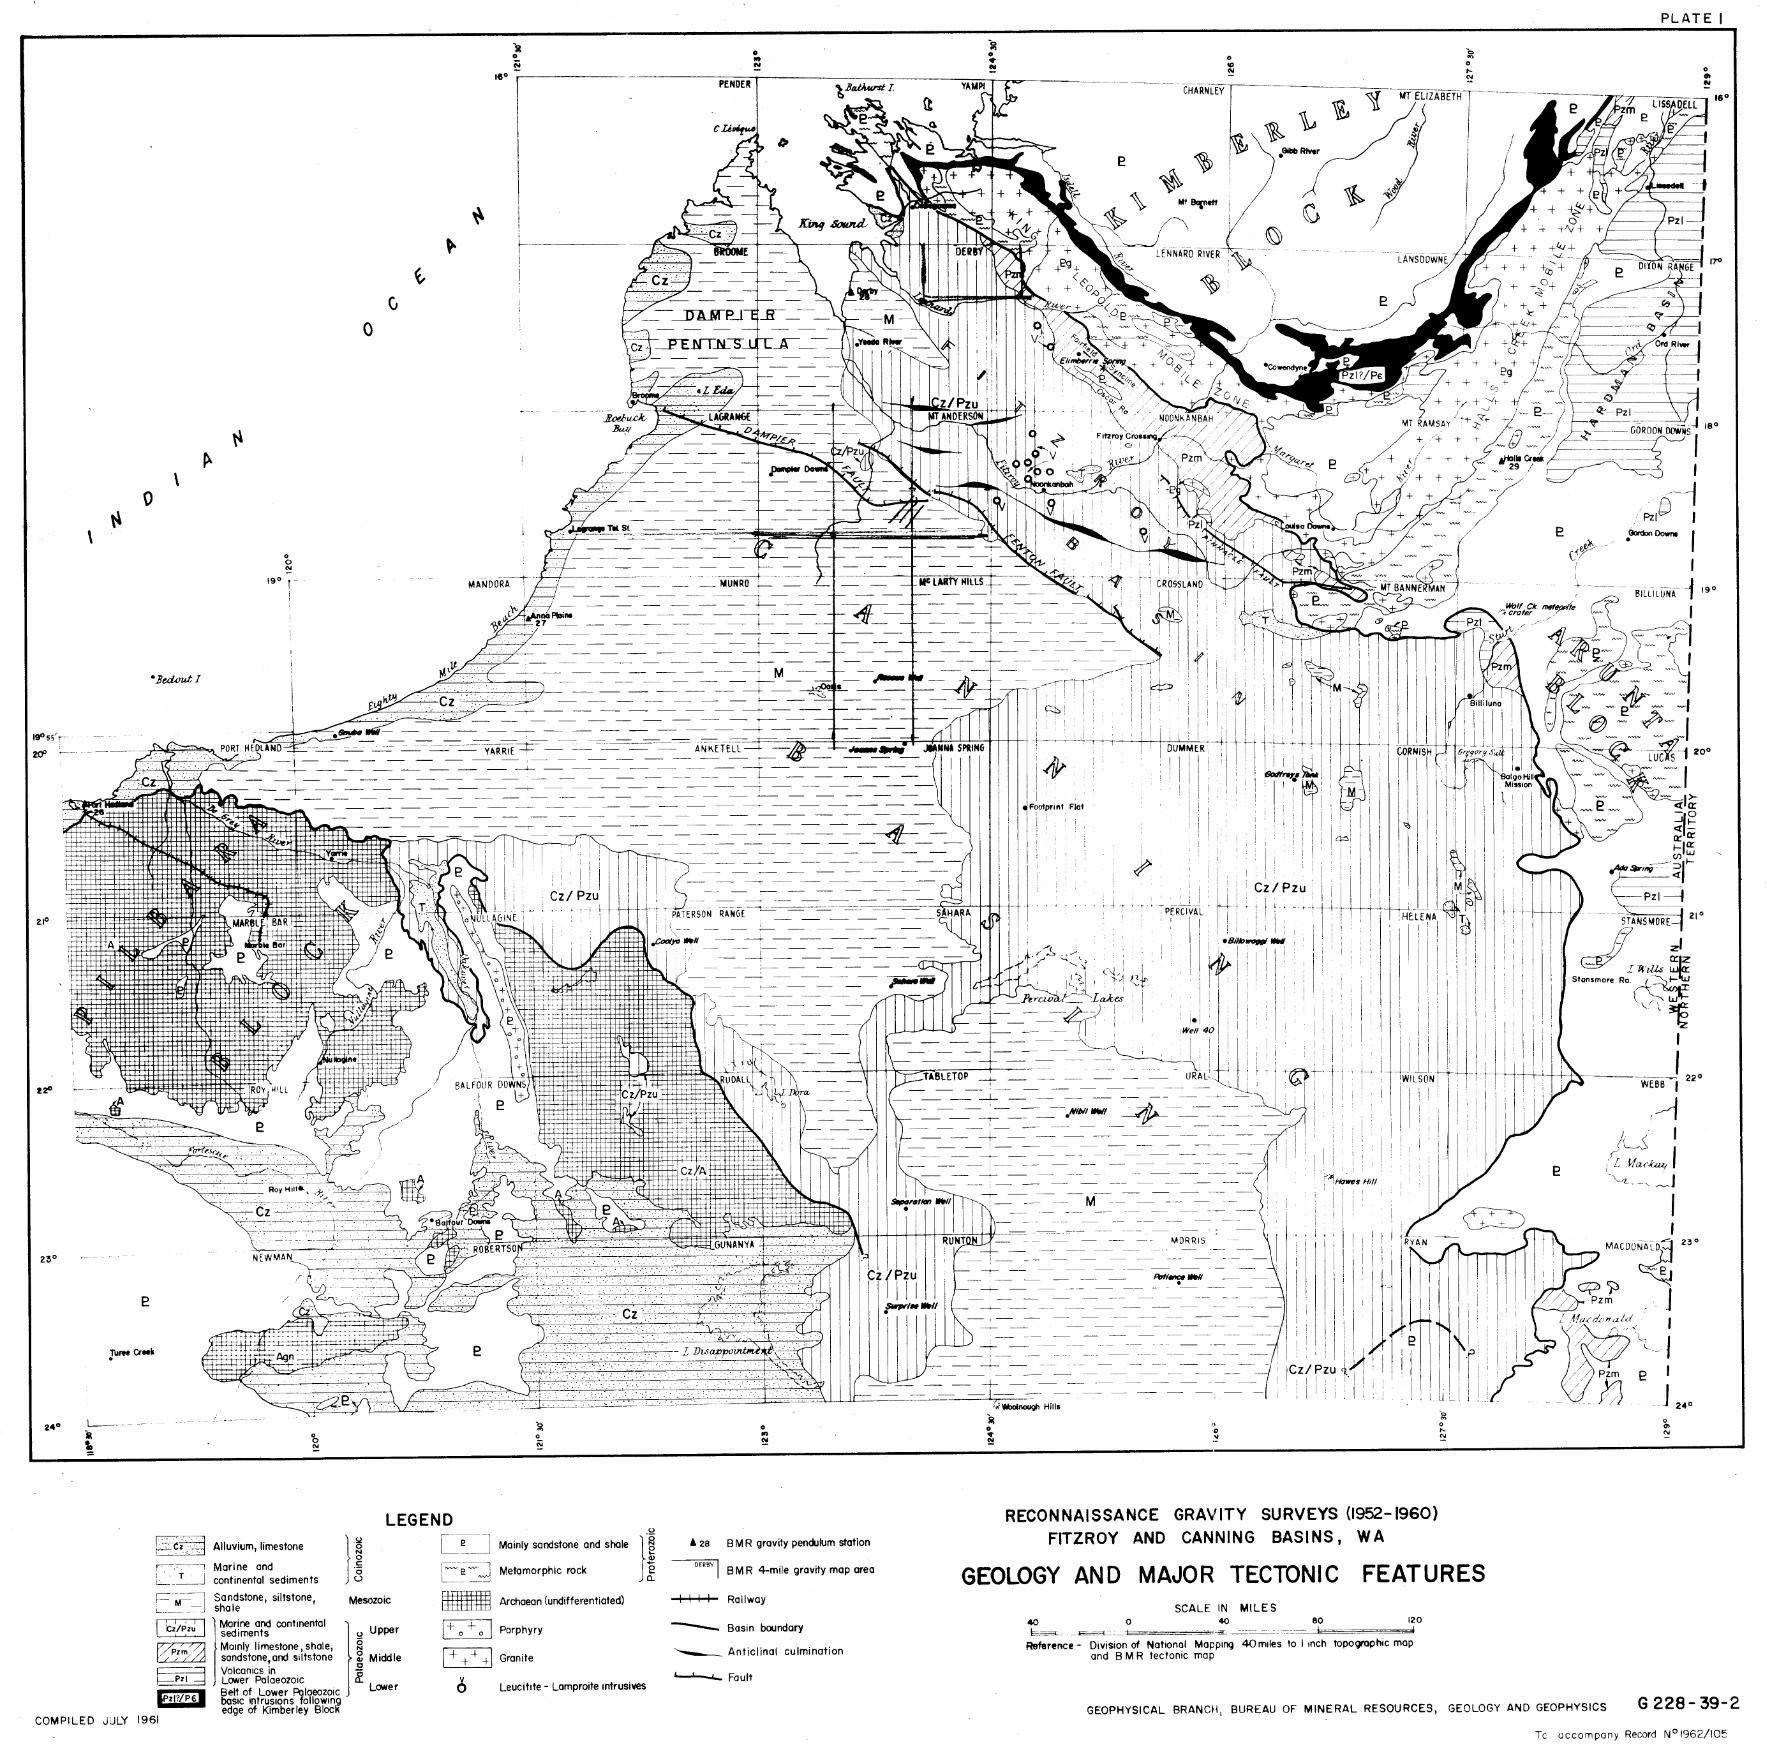
Plate 1.^Geology,and major tectonic features^(G228-39-2)
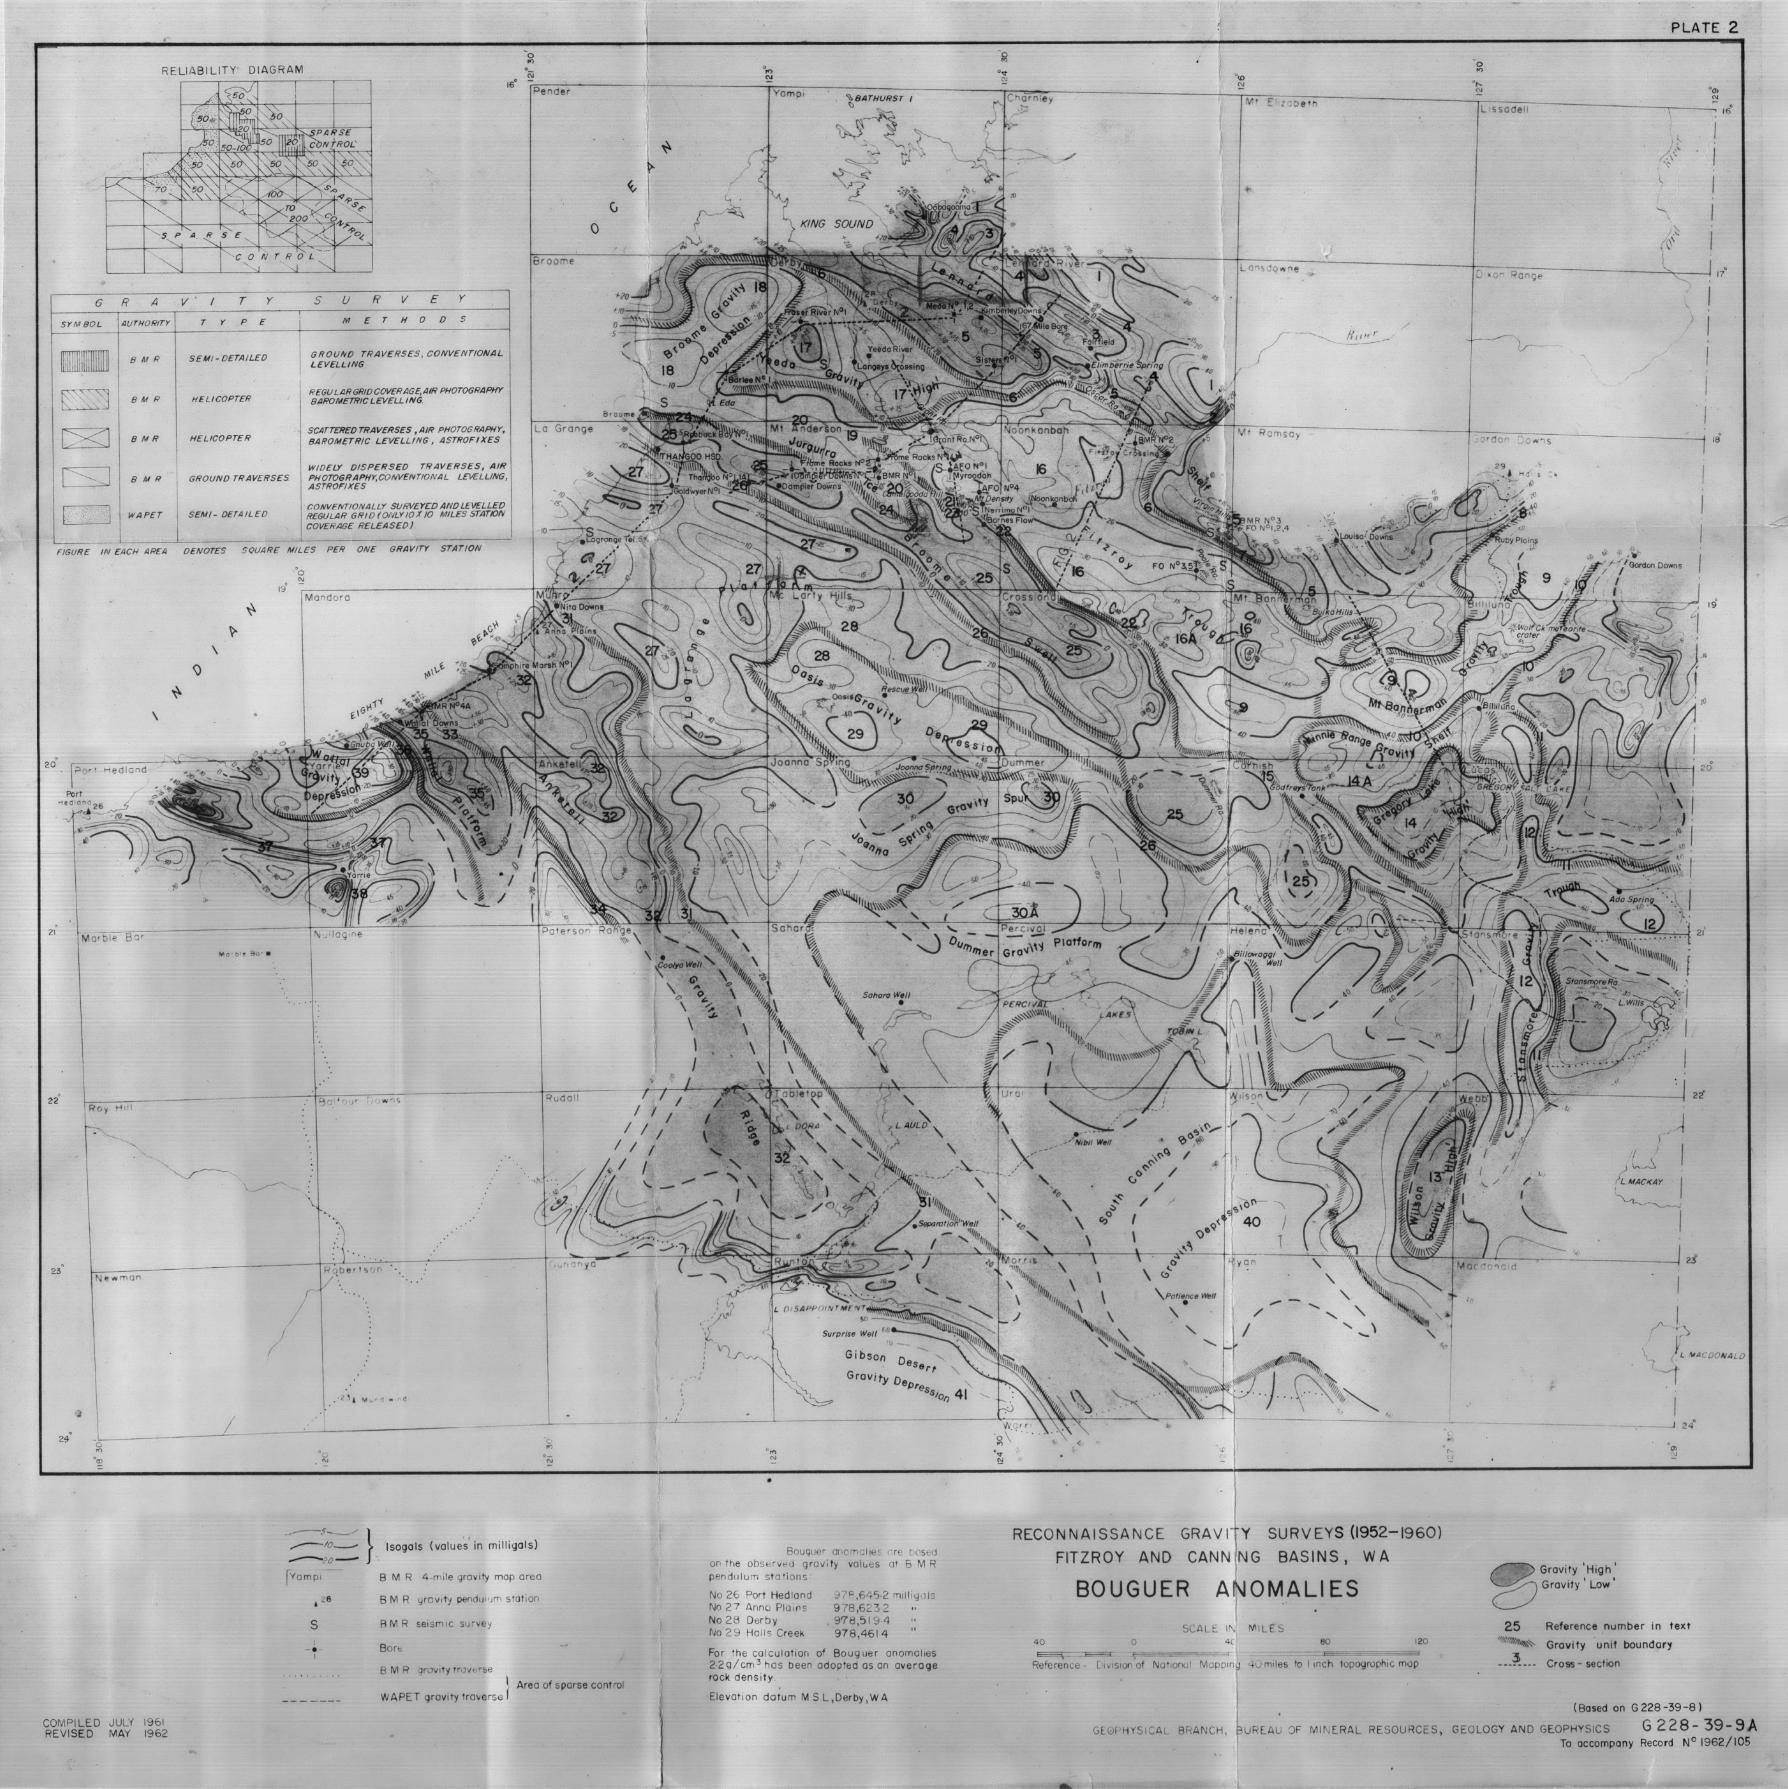
Plate 2.^Bouguer anomaly contour map (G228-39-8A)
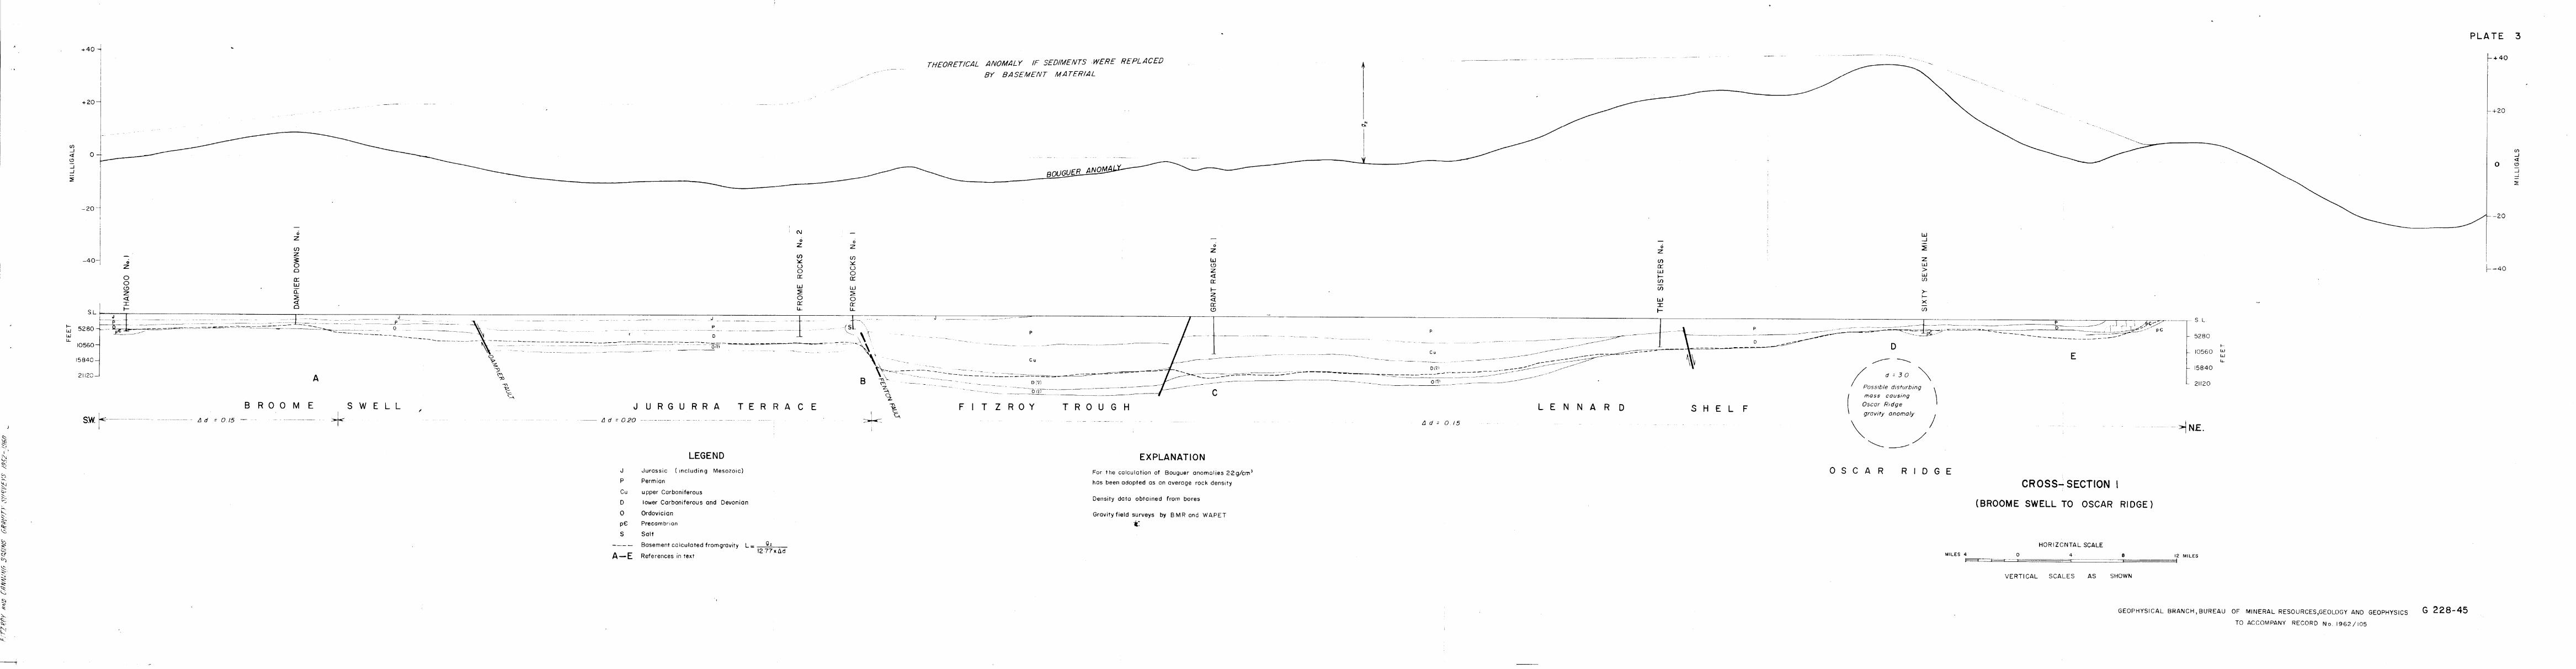
Plate 3.^Cross-section 1, Broome Swell to Oscar Ridge (G228-45)
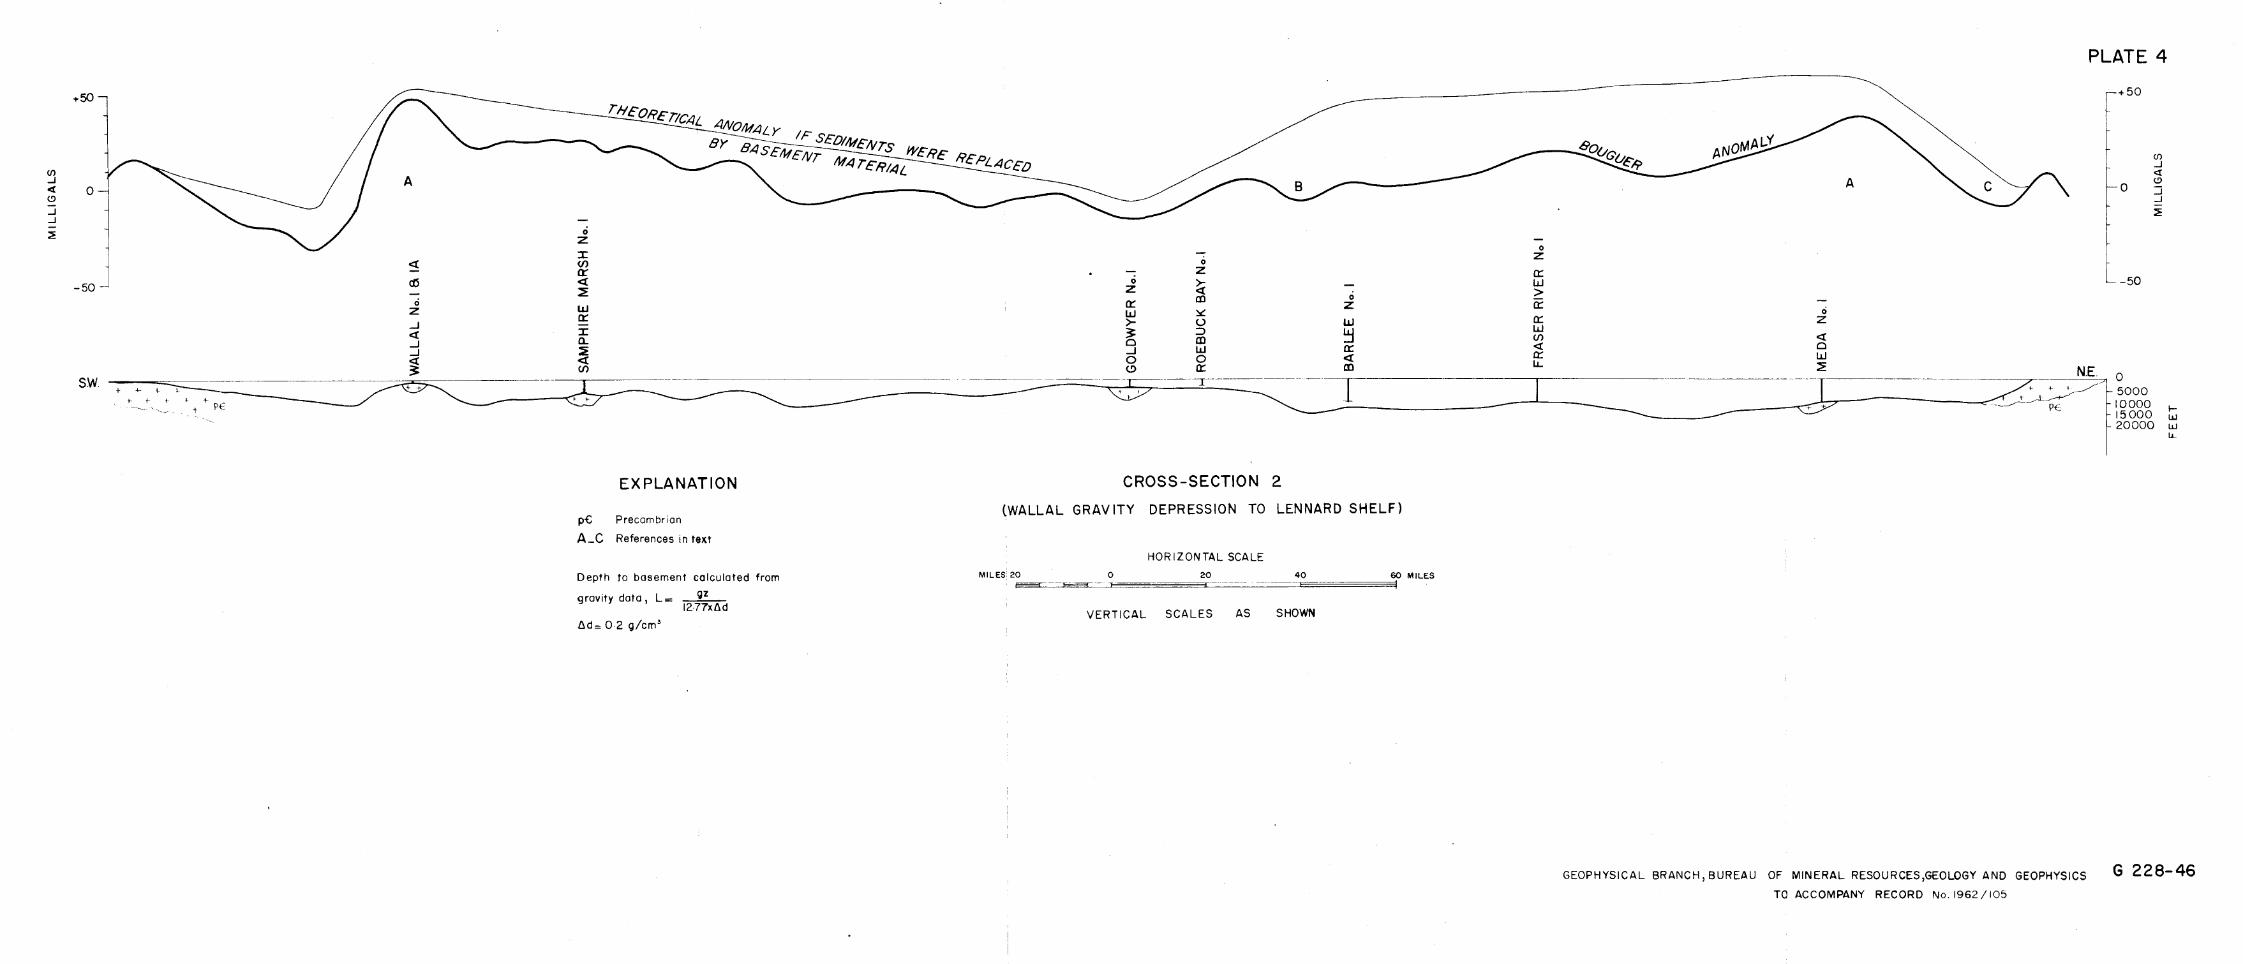
Plate 4.^Cross-section 2, Wallal Gravity Depression to LennardShelf^(G228-46)
Plate 5.^Cross-section 3, Yeeda Gravity High to Broome Swell(G228-47)
Plate 6.^Cross-section 4, Kimberley Block to Gregory Lake (G228-48)
SUMMARY
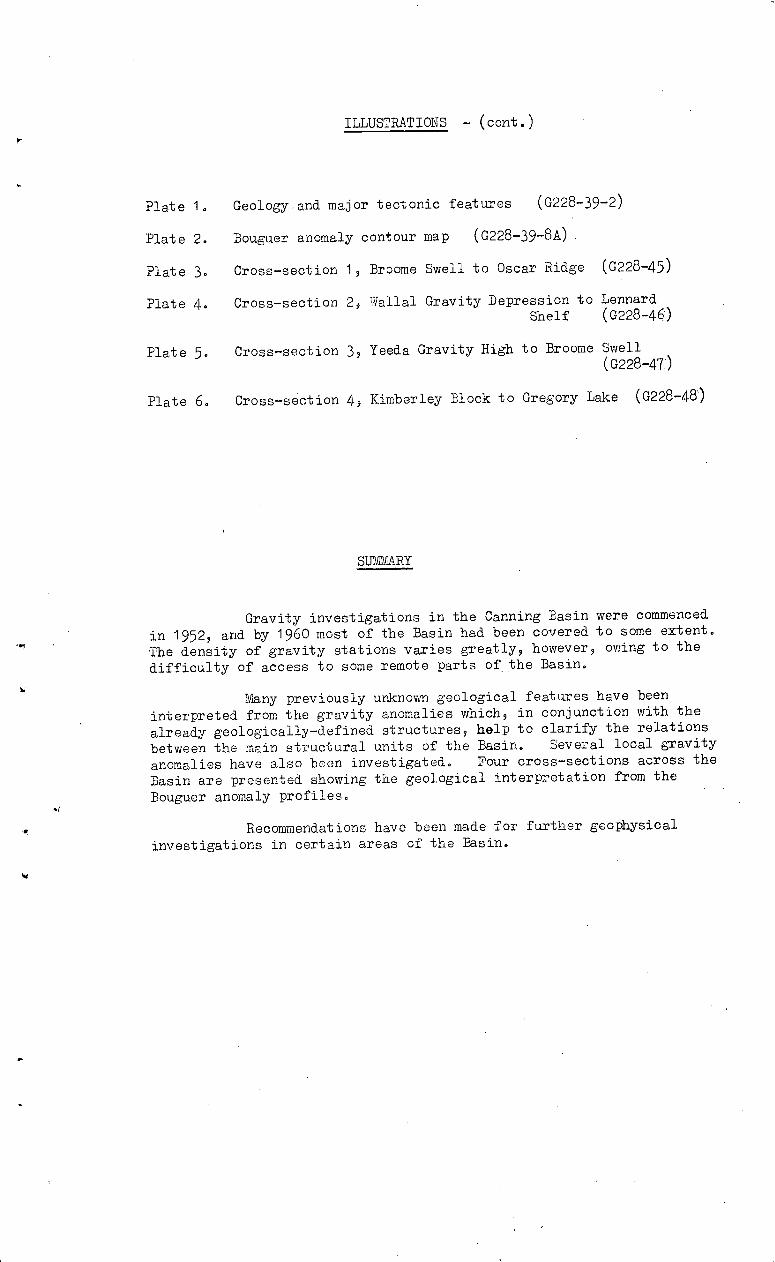
Gravity investigations in the Canning Basin were commencedin 1952, and by 1960 most of the Basin had been covered to some extent.The density of gravity stations varies greatly, however, owing to thedifficulty of access to some remote parts of the Basin.
Many previously unknown geological features have beeninterpreted from the gravity anomalies which, in conjunction with thealready geologically-defined structures, help to clarify the relationsbetween the main structural units of the Basin.^Several local gravityanomalies have also boon investigated.^Four cross-sections across theBasin are presented showing the geological interpretation from theBouguer anomaly profiles.
Recommendations have been made for further geophysicalinvestigations in certain areas of the Basin.
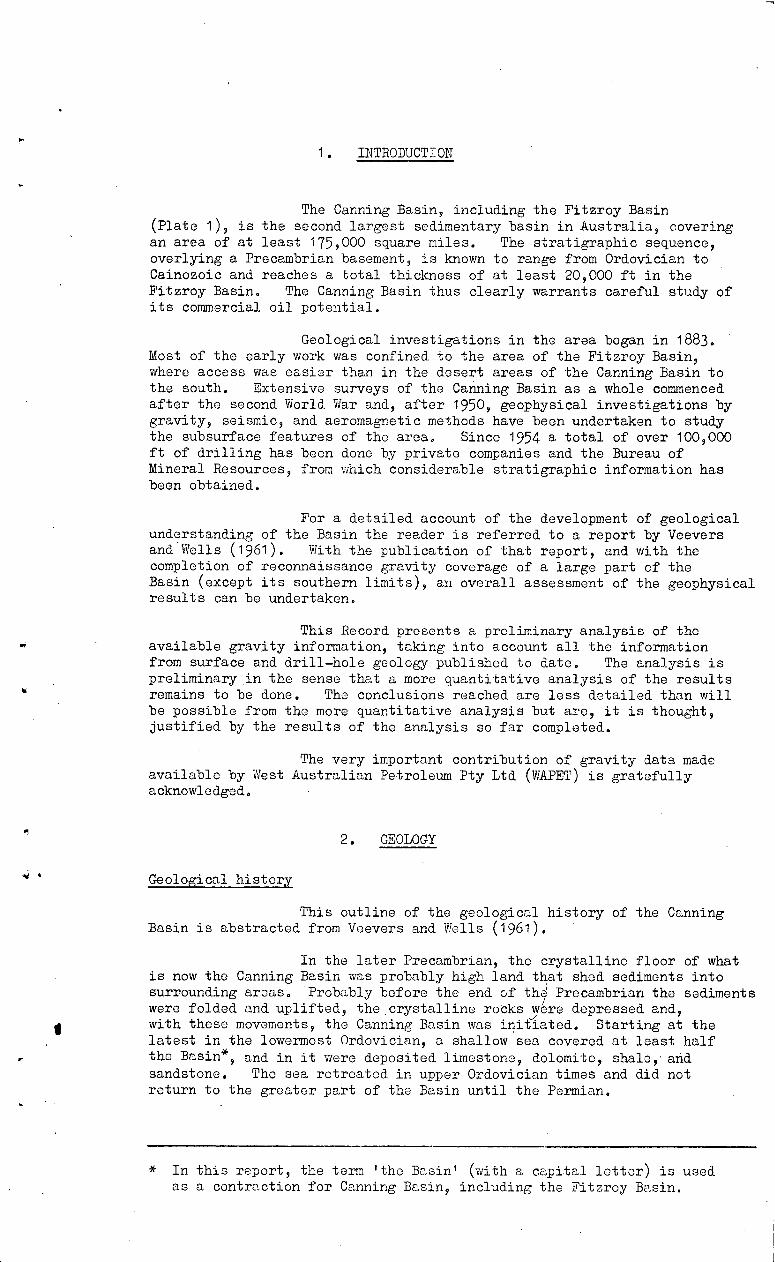
1.^INTRODUCTION
The Canning Basin, including the Fitzroy Basin(Plate 1), is the second largest sedimentary basin in Australia, coveringan area of at least 175,000 square miles.^The stratigraphic sequence,overlying a Precambrian basement, is known to range from Ordovician toCainozoic and reaches a total thickness of at least 20,000 ft in theFitzroy Basin, The Canning Basin thus clearly warrants careful study ofits commercial oil potential.
Geological investigations in the area began in 1883.Most of the early work was confined to the area of the Fitzroy Basin,where access was easier than in the desert areas of the Canning Basin tothe south. Extensive surveys of the Canning Basin as a whole commencedafter the second World War and, after 1950, geophysical investigations bygravity, seismic, and aeromagnetic methods have been undertaken to studythe subsurface features of the area.^Since 1954 a total of over 100,000ft of drilling has been done by private companies and the Bureau ofMineral Resources, from which considerable stratigraphic information hasbeen obtained.
For a detailed account of the development of geologicalunderstanding of the Basin the reader is referred to a report by Veeversand Wells (1961).^With the publication of that report, and with thecompletion of reconnaissance gravity coverage of a large part of theBasin (except its southern limits), an overall assessment of the geophysicalresults can be undertaken.
This Record presents a preliminary analysis of theavailable gravity information, taking into account all the informationfrom surface and drill—hole geology published to date. The analysis ispreliminary in the sense that a more quantitative analysis of the resultsremains to be done. The conclusions reached are less detailed than willbe possible from the more quantitative analysis but are, it is thought,justified by the results of the analysis so far completed.
The very important contribution of gravity data madeavailable by West Australian Petroleum Pty Ltd (WAPET) is gratefullyacknowledged.
2. GEOLOGY
Geological history
This outline of the geological history of the CanningBasin is abstracted from Veevers and Wells (1961).
In the later Precambrian, the crystalline floor of whatis now the Canning Basin was probably high land that shed sediments intosurrounding areas. 'Probably before the end of tlq Precambrian the sedimentswere folded and uplifted, the.crystalline rooks yore depressed and,with these movements, the Canning Basin was initiated. Starting at thelatest in the lowermost Ordovician, a shallow sea covered at least halfthe Basin* , and in it were deposited limestone, dolomite, shale, andsandstone. The sea retreated in upper Ordovician times and did notreturn to the greater part of the Basin until the Permian.
* In this report, the term 'the Basin' (with a capital letter) is usedas a contraction for Canning Basin, including the Fitzroy Basin.
41r
2
In the upper part of the middle Devonian, sandstoneand limestone were deposited in a sea that covered the Fitzroy Basin(Plate 1).^The sea floor was broken into blocks of varying height inthe early upper Devonian; reefs grew along the edges of high-standingblocks, and conglomerate was deposited at the margin of the Fitzroy Basin;sandstone was deposited in lakes in the north-eastern part of the basin.
Most of these Devonian rocks were probably gentlyfolded and eroded before lower Carboniferous sedimentswere deposited inthe northern part of the Fitzroy Basin. In the upper Carboniferous,thick siltstone and sandstone were deposited in a shallow bay in thewestern part of the Fitzroy Basin.
In the early Permian thick beds of marine glacial rocks .were deposited over the entire Canning Basin. A cycle of alternatedeposition, firstly of marine and secondly of estuarine or fresh-watersediments, was repeated two and a half times during the rest of the Permianand during the lower Triassic. The sea then retreated, and these rockswere folded and eroded. The sea slowly advanced over the land from -middle Jurassic to lowermost Cretaceous times and slowly retreated in theupper part of the lower Cretaceous.
From the upper Cretaceous to the Recent, the Basin hasbeen land except for local intermittent submergence of the present coast.
Boundaries and structure
The known boundaries of the Canning Basin, as definedby the surface contact between Precambrian and Palaeozoic rocks, are shownon Plate 1.
The north-eastern boundary runs, in general terms, fromOobagooma in the YAMPI area * to the Wolf Creek meteorite crater in theBILLILUNA area. The Proterozoic formations of the Kimberley Block, apronounced topographically high area, lie immediately north-east of thisboundary, which has been mapped in detail.
The eastern boundary runs. generally south from theWolf Creek meteorite crater as far as the mid-point of the northern edgeof the WEBB area, where it turns south-west, terminating in the north-eastern corner of the RYAN area. PrecambHan outcrop is not continuousalong this boundary, which is thus less well.defined.
The southern boundary has not yet been determinedbecause of almost complete blanketing by Recent alluvium.
The south-western boundary runs from the south-westerncorner of the TABLETOP area in a north-westerly direction as far as thevicinity of Coolya Well in the PATERSON RANGE area, where it turns west-north-westerly and continues to the coast in the vicinity of Port Hedland.A major embayment along the valley of the Oakover River occurs in theeastern half of the NULLAGINE area. Archaean rocks of the Pil14oara Block,a topographically high area, lie immediately to the south-west of thisboundary, which is well defined.
* Locality references in capital letters (e.g. YAMPI) refer, in thisRecord, to the names of the Australia 4-mile series areas. Theboundaries of these areas are superimposed as a grid on the relevantmaps.
3
A. major structural unit within the Canning Basin is theFitzroy Basin, an elongated featvre, sub-parallel to the north-easternboundary of the Basin, within which the greatest total thickness ofsediments has been deposited. The north-eastern margin of this featureis well defined only at the Pinnacle Fault, which is mapped on the surface,with down-throw to the south-west, near Prices Creek (south-easterncorner of the NOONKANBAH area). The extensions of this feature in bothdirections require geophysical elucidation.
To the north-west there is evidence of sub-parallellines of major faulting or flexure between which have been named units ofintermediate sedimentary thickness.^Of these, reference will be made tothe Lennard Shelf, a unit named by Playford and Johnstone (1959), whichis described as extending in contact with the north-eastern boundary ofthe Basin, between the boundary and the Fitzroy Basin. This unit hasbeen further sub-divided by Veevers and Wells (1961).
The Fitzroy Basin is bounded to the south-west by thee
(a) Fenton Fault which is well exposed only in the Barnes Flowarea (eastern edge of the MOUNT ANDERSON area), with down-throwto the north-east. Related to it is the
(b) Dampi.er Fault sub-parallel to the Fenton Fault along thenorth-western part of its postulated extension. Thisfeature is entirely without surface expression, as far as .is known.
The Jurgurra Terrace is the relatively flat area ofintermediate thickness of sedimentation between the Dampier and FentonFaults.
South Canning Basin is the name given to the area ofthe Basin not included in any of the above units. It has been subdividedby Veevers and Wells (1961).
Detailed examination of the gravity results will showthat some of these units can be subdivided. Where there appears to besufficient evidence, new unit and sub-unit names will be introduced.
Stratigraphy and rock density
An outline of the known stratigraphic sequence willfirst be presented; then an outline and discussion will be given of theresults of density determinations on rock samples from different parts ofthe sequence, and their importance in the interpretation of the gravitysurvey results.
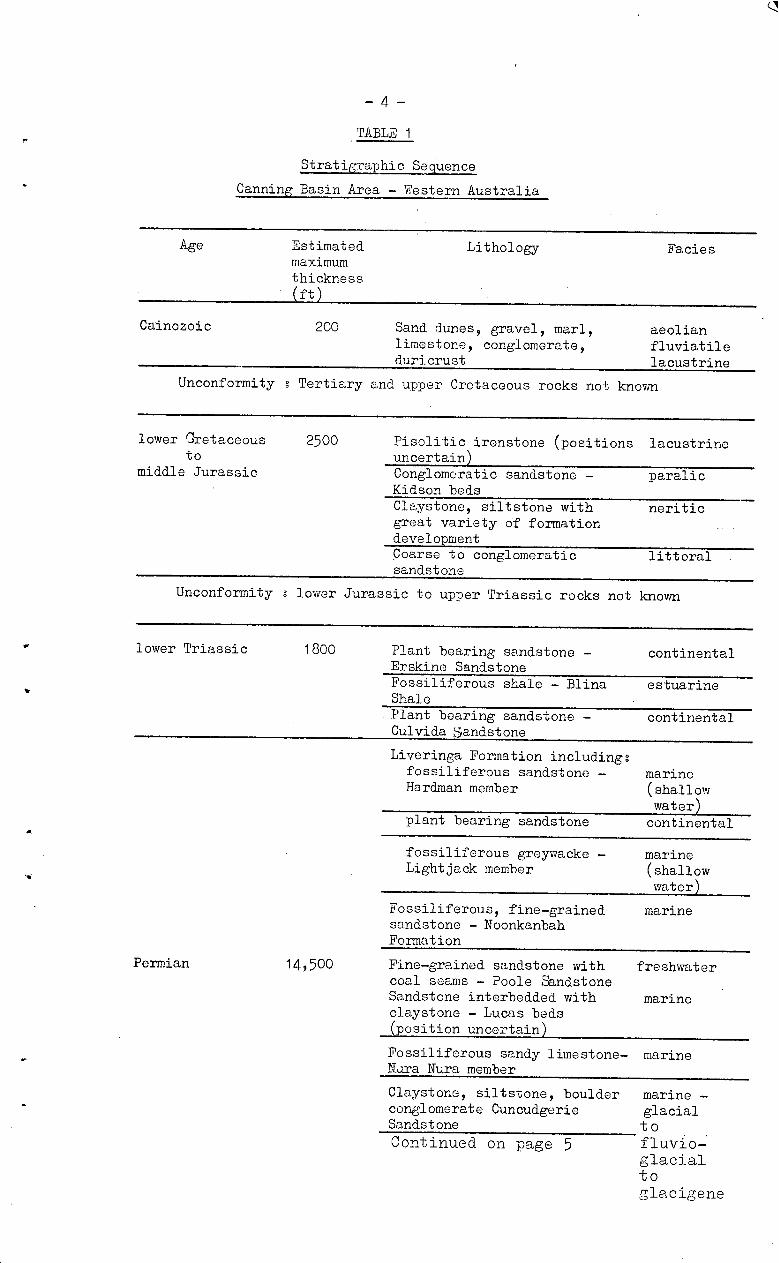
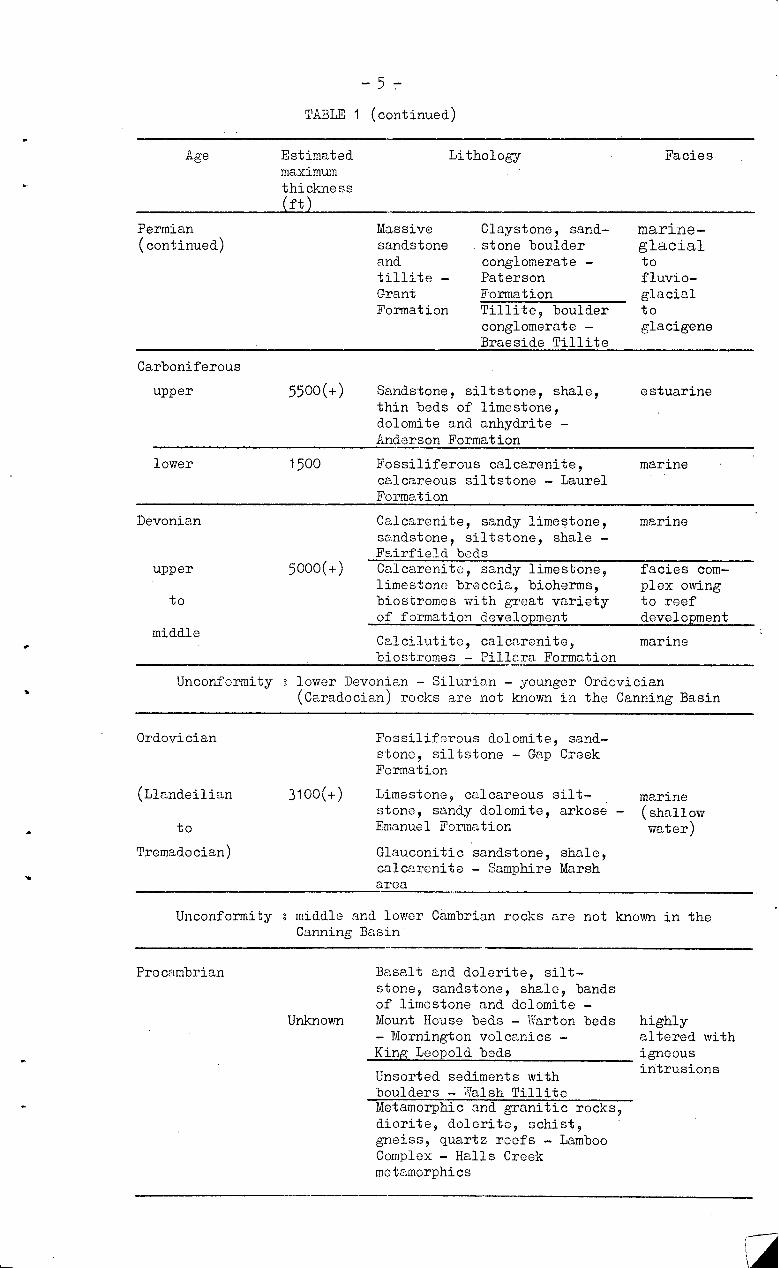
Table 1 presents the known stratigraphic sequence.The main reference is Veevers and Wells (1961).
Density measurements have been made on core samplesfrom many drill holes, and data are available from four sources
(a) BMR stratigraphic holes,
(b) holes drilled by WAPET under Commonwealth Government subsidy,
(c) WAPET exploratory wells,
(d) -surface samples from the Geology Department, Universityof '6estern Australia.
- 4 -
TABLE 1
Stratigraphic Sequence
Cannin Basin Area - Western Australia
Age^Estimated^
Lithology^Faciesmaximumthickness(ft)
Cainozoic^200^Sand dunes, gravel, marl,^aeolianlimestone, conglomerate,^fluviatiledun crust^
lacustrine
Unconformity Tertiary and upper Cretaceous rocks not known
lower Cretaceousto
middle Jurassic
2500^Pisolitic ironstone (positionsuncertain) Conglomeratic sandstone -Kidson beds Claystone, siltstone withgreat variety of formationdevelopment Coarse to conglomeraticsandstone
lacustrine
paralic
neri tic
littoral
Unconformity lower Jurassic to upper Triassic rocks not known
lower Triassic 1800 Plant bearing sandstone -Erskine Sandstone Fossiliferous shale - BlinaShale Plant bearing sandstone -Culvida Sandstone
continental
estuarine
continental
Liveringa Formation including:fossiliferous sandstone -Hardman member
marine(shallowwater)
plant bearing sandstone
continental
fossiliferous greywacke -Lightjack member
marine(shallowwater)
marine
Fossiliferous, fine-grainedsandstone - NoonkanbahFormation
Permian 1 4 ,500 Fine-grained sandstone withcoal seams - Poole SandstoneSandstone interbedded withclaystone - Lucas beds(position uncertain)
freshwater
marine
Fossiliferous sandy limestone- marineNara Nura member
Claystone, siltstone, boulderconglomerate CuncudgerieSandstone
marineglacialtofluvio-glacialtoglacigene
Continued on page 5
- 5 -TABTF, 1 (continued)
Age^
Estimated^
Lithology^
Faciesmaximumthickness(ft)
Permian(continued)
Massivesandstoneandtillite -GrantFormation
Claystone, sand-stone boulderconglomerate -PatersonFormation Tillite, boulderconglomerate -Braeside Tillite
marine-glacialtofluvio-glacialtoglacigene
Carboniferous
upper^
5500(+)^Sandstone, siltstone, shale,^estuarinethin beds of limestone,dolomite and anhydrite -Anderson Formation
lower^
1500^Fossiliferous calcarenite,^marinecalcareous siltstone - LaurelFormation
Devonian Calcarenite, sandy limestone,^marinesandstone, siltstone, shale -Fairfield beds
5000(+)^Calcarenite, sandy limestone,^facies corn-limestone breccia, bioherms,^plex owingbiostromes with great variety^to reefof formation development^development
upper
to
middle
Calcilutite, calcarenite,^marinebiostromes - Pillara Formation
Unconformity lower Devonian - Silurian - younger Ordovician(Caradocian) rocks are not known in the Canning Basin
Ordovician
(Llandeilian
to
Tremadocian)
Fossiliferous dolomite, sand-stone, siltstone - Gap CreekFormation
3100(+)^Limestone, calcareous silt-^marinestone, sandy dolomite, arkose - (shallowEmanuel Formation^water)
Glauconitic sandstone, shale,calcarenite - Samphire Marsharea
Unconformity 3 middle and lower Cambrian rocks are not known in theCanning Basin'
Precambrian Basalt and dolerite, silt-stone, sandstone, shale, bandsof limestone and dolomite -
Unknown^Mount House beds - Warton bedsMornington volcanics -
King Leopold beds
highlyaltered withigneousintrusions
Unsorted sediments withboulders - Walsh Tillite Metamorphic and granitic rocks,diorite, dolerite, schist,gneiss, quartz reefs - LambooComplex - Halls Creekmetamorphics
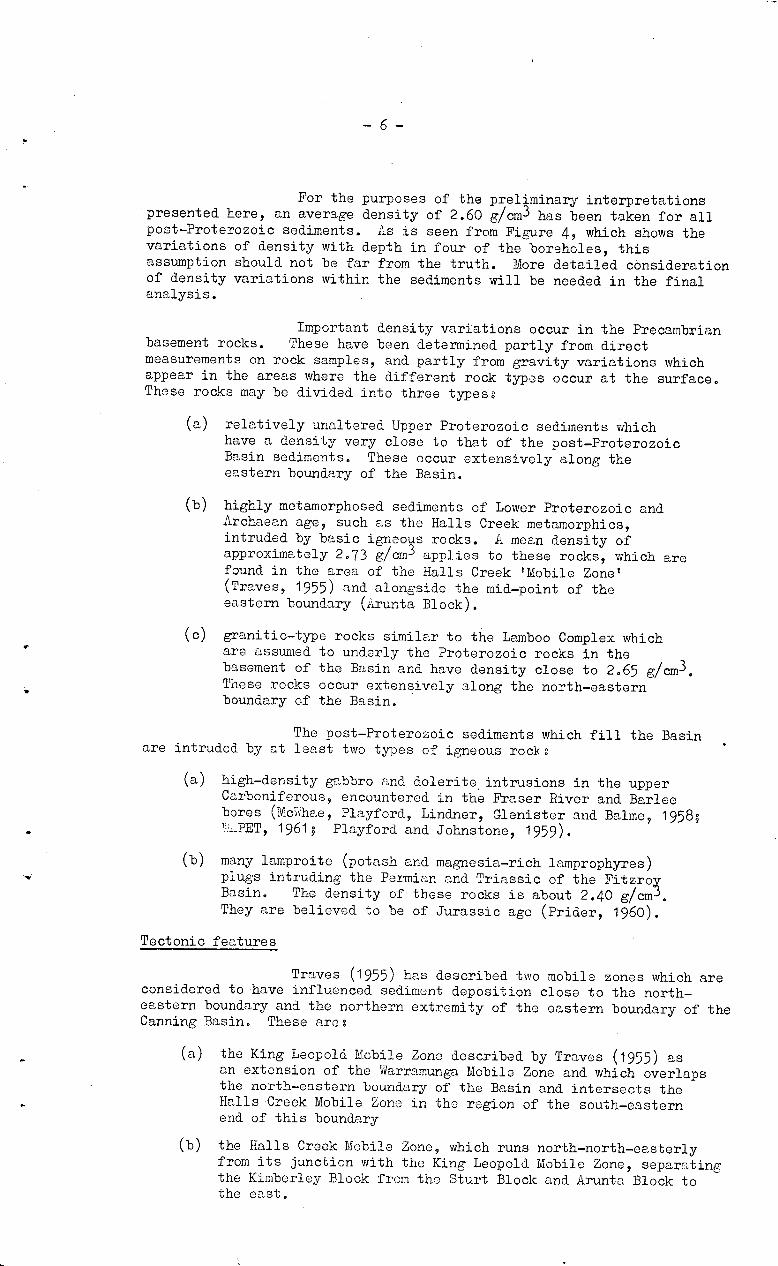
For the purposes of the preliminary interpretations'presented here, an average density of 2.60 g/cm 3 has been taken for allpost-Proterozoic sediments. As is seen from Figure 4, which shows thevariations of density with depth in four of the boreholes, thisassumption should not be far from the truth. More detailed considerationof density variations within the sediments will be needed in the finalanalysis.
Important density variations occur in the Precambrianbasement rocks. These have been determined partly from directmeasurements on rock samples, and partly from gravity variations whichappear in the areas where the different rock typos occur at the surface.These rocks may be divided into three types;
(a) relatively unaltered Upper Proterozoic sediments whichhave a density very close to that of the post-ProterozoicBasin sediments. These occur extensively along theeastern boundary of the Basin.
(b) highly metamorphosed sediments of Lower Proterozoic andArchaean age, such as the Halls Creek metamorphics,intruded by basic igneous rocks. A mean density ofapproximately 2.73 g/cm 3 applies to these rocks, which arefound in the area of the Halls Creek 'Mobile Zone'(Traves, 1955) and alongside the mid-point of theeastern boundary (Arunta Block).
( c) granitic-type rocks similar to the Lamboo Complex whichare assumed to underly the Proterozoic rocks in thebasement of the Basin and have density close to 2.65 g/cm3 .These rocks occur extensively along the north-easternboundary of the Basin.
The post-Proterozoic sediments which fill the Basinare intruded by at least two types of igneous rock;
(a) high-density gabbro and dolerite,intrusions in the upperCarboniferous, encountered in the Fraser River and Barleebores (McWhae, Playford, Lindner, Glenister and Balm°, 1958;'IAPET, 1961; Playford and Johnstone, 1959).
(b) many lamproite (potash and magnesia-rich lamprophyres)plugs intruding the Permian and Triassic of the FitzroxBasin. The density of these rocks is about 2.40 dem'.They are believed to be of Jurassic age (Prider, 1960).
Tectonic features
Traves (1955) has described two mobile zones which areconsidered to have influenced sediment deposition close to the north-eastern boundary and the northern extremity of the eastern boundary of theCanning Basin. These area
the King Leopold Mobile Zone described by Traves (1955) asan extension of the Warramunga Mobile Zone and which overlapsthe north-eastern boundary of the Basin and intersects theHalls .Creek Mobile Zone in the region of the south-easternend of this boundary
(b) the Halls Creek Mobile Zone, which runs north-north-easterlyfrom its junction with the King Leopold Mobile Zone, separatingthe Kimberley Block from the Sturt Block and Arunta Block tothe east.
(a)
Extensive areas of outcrop of granitic intrusives ofArchaean or Lower Proterozoic age occur along the .edge of the KimberleyBlock within both mobile zones (Tectonic map of Australia, 1960, publishedby the Bureau of Mineral Resources).
Adjacent to the eastern boundary of the Basin,extensive outcrops of Lower Proterozoic metamorphics with basic intrusionsof high density have been mapped.
The Pilbara Block, adjacent to the south—westerlyboundary of the Basin, is characterised by outcrops of graniticProterozoic rocks, with Upper Proterozoic sediments and porphyry in thearea of the major embayment which extends into the NULLAGINE area.
The Fenton and Pinnacle Faults are recognised ascontrolling sedimentation within the Fitzroy Basin. Movement along thesefaults has been proved during the lower Permian (Guppy, Lindner, Rattiganand Casey, 1958). There is evidence of reversal of throw of the FentonFault during Mesozoic times. The delineation of these features, and, ifpossible, their detailed elucidation (Veevers and Wells, 1961 have advanceda description of the Fenton Fault as a monoclinal flexure) were two of theprincipal objectives of the 1960 reconnaissance gravity survey. Neitherof these very important structures has been adequately clarified fromsurface geological study and it appears that geophysical methods must beused to elucidate and describe them.
Other possible areas of mobility either have not yetbeen closely studied, or the older rocks are concealed by Recent alluvium.It will be shown that the gravity data provide much information on probablesubsurface configuration in these areas.
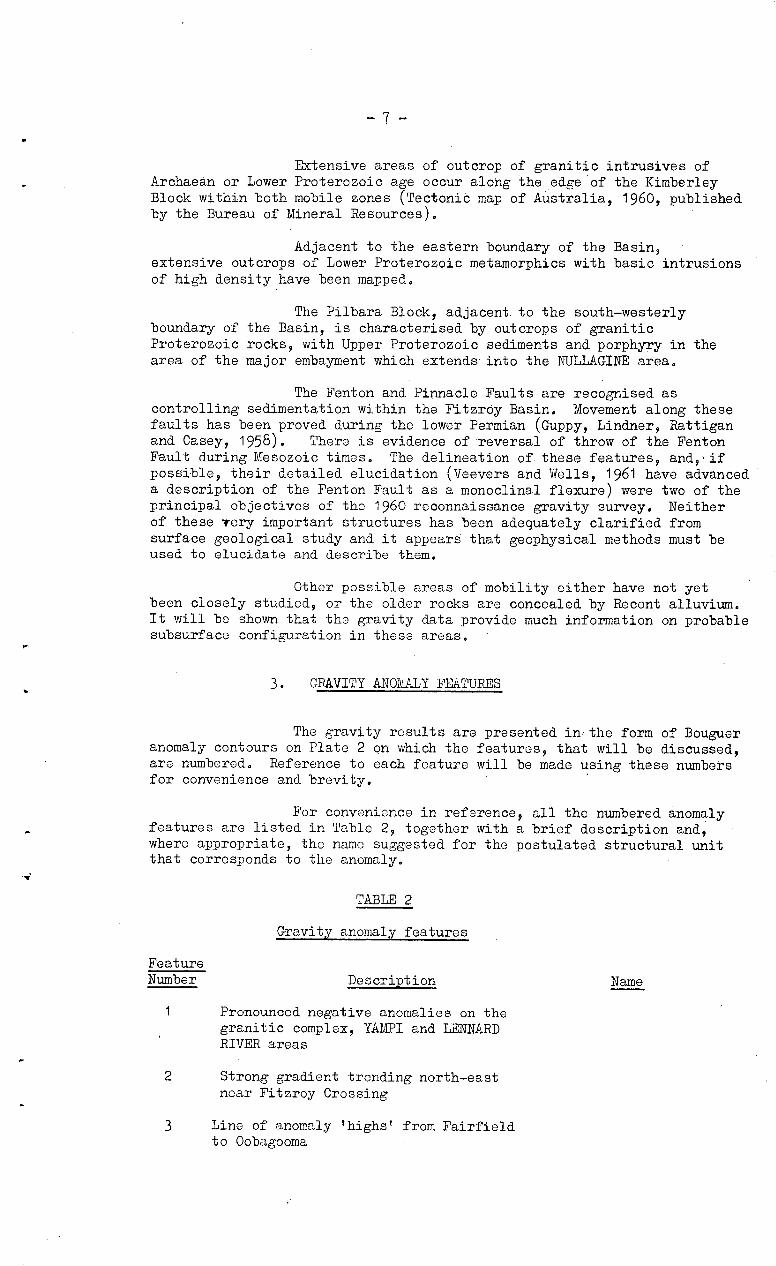
3. GRAVITY ANOMALY FEATURES
The gravity results are presented in' the form of Bougueranomaly contours on Plate 2 on which the features, that will be discussed,are numbered. Reference to each feature will be made using these numbersfor convenience and brevity.
For convenience in reference, all the numbered anomalyfeatures are listed in Table 2, together with a brief description and,where appropriate, the name suggested for the postulated structural unitthat corresponds to the anomaly.
TABLE 2
Gravity anomaly features
Feature Number^ Description^Name
1^Pronounced negative anomalies on thegranitic complex, YAMPI and LENNARDRIVER areas
2^Strong gradient trending north—eastnear Fitzroy Crossing
3^Line of anomaly 'highs' from Fairfieldto Oobagooma
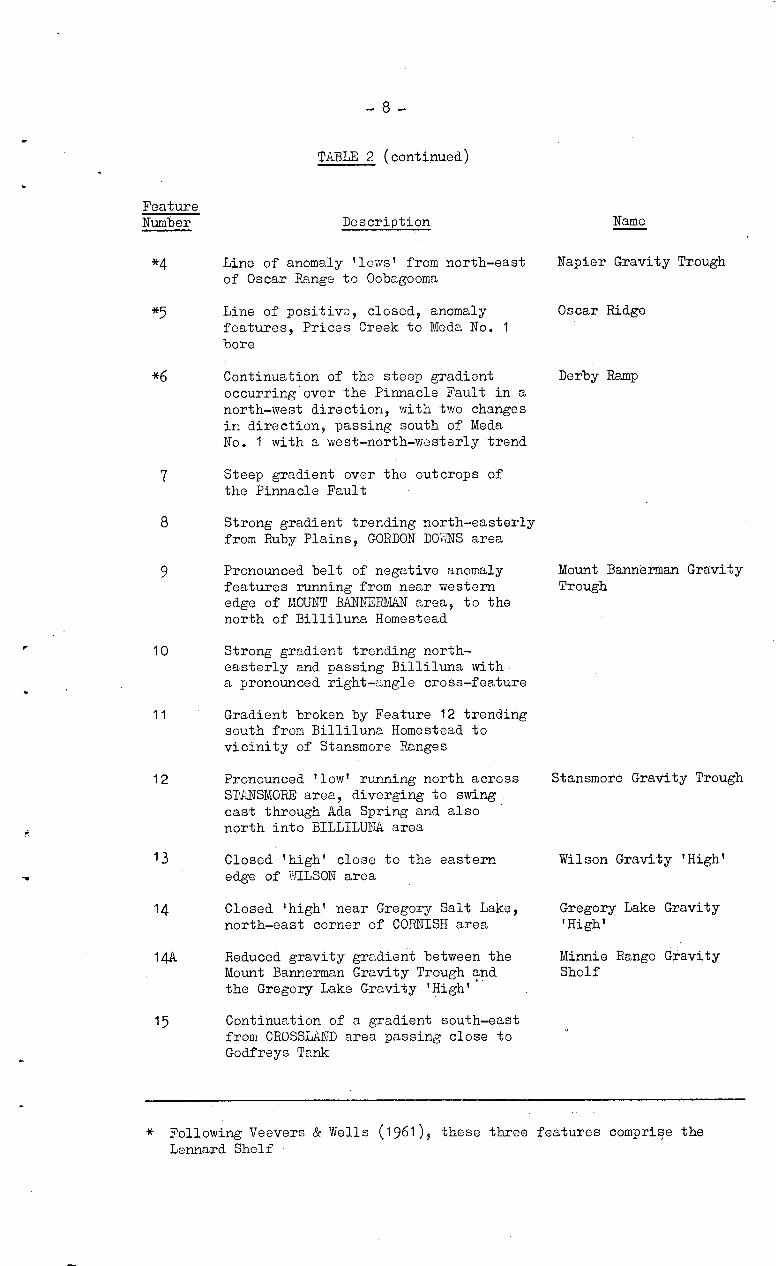
- 8 -
Feature Number
*4
*5
TABLE 2 (continued)
Description
Line of anomaly 'lows' from north-eastof Oscar Range to Oobagooma
Line of positive, closed, anomalyfeatures, Prices Creek to Meda No. 1bore
*6^Continuation of the steep gradientoccurring over the Pinnacle Fault in anorth-west direction, with two changesin direction, passing south of MedaNo. 1 with a west-north-westerly trend
Name
Napier Gravity Trough
Oscar Ridge
Derby Ramp
7
8
9^
Pronounced belt of negative anomalyfeatures running from near westernedge of MOUNT BANNERMAN area, to thenorth of Billiluna Homestead
10^Strong gradient trending north-easterly and passing Billiluna witha pronounced right-angle cross-feature
11^
Gradient broken by Feature 12 trendingsouth from Billiluna Homestead tovicinity of Stansmore Ranges
12^Pronounced 'low' running north acrossSTANSMORE area, diverging to swingeast through Ada Spring and alsonorth into BILLILUNA area
13^
Closed 'high' close to the easternedge of WILSON area
14^
Closed 'high' near Gregory Salt Lake,north-east corner of CORNISH area
14A^Reduced gravity gradient between theMount Bannerman Gravity Trough andthe Gregory Lake Gravity 'High'
15^Continuation of a gradient south-eastfrom CROSSLAND area passing close toGodfreys Tank
Mount Bannerman GravityTrough
Stansmore Gravity Trough
Wilson Gravity 'High'
Steep gradient over the outcrops ofthe Pinnacle Fault
Strong gradient trending north-easterlyfrom Ruby Plains, GORDON DOWNS area
Gregory Lake Gravity'High'
Minnie Range GravityShelf
* Following Veevers & Wells (1961), these three features comprise theLennard Shelf
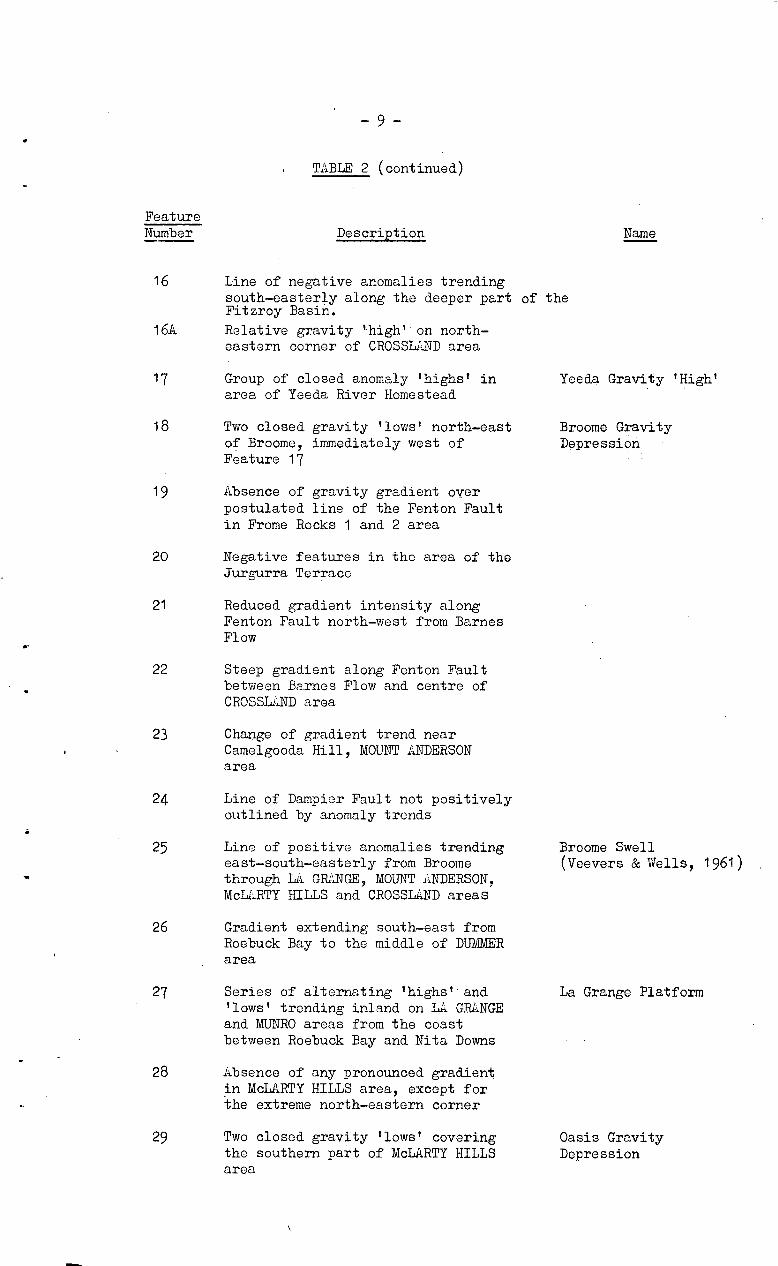
- 9 -
TABLE 2 (continued)
FeatureDescription NameNumber
16
16A
Line of negative anomalies trendingsouth-easterly along the deeper part of theFitzroy Basin.Relative gravity 'high' on north-eastern corner of CROSSLAND area
17 Group of closed anomaly 'highs' inarea of Yeeda River Homestead
Yeeda Gravity 'High'
18 Two closed gravity 'lows' north-east Broome Gravityof Broome, immediately west of DepressionFeature 17
19 Absence of gravity gradient overpostulated line of the Fenton Faultin Frome Rocks 1 and 2 area
20 Negative features in the area of theJurgurra Terrace
21 Reduced gradient intensity alongFenton Fault north-west from BarnesFlow
22 Steep gradient along Fenton Faultbetween Barnes Flow and centre ofCROSSLAND area
23 Change of gradient trend nearCamelgooda Hill, MOUNT ANDERSONarea
24 Line of Dampier Fault not positivelyoutlined by anomaly trends
25 Line of positive anomalies trending Broome Swelleast-south-easterly from Broomethrough LA GRANGE, MOUNT ANDERSON,McLARTY HILLS and CROSSLAND areas
(Veevers & Wells, 1961)
26 Gradient extending south-east fromRoebuck Bay to the middle of DUMMERarea
27 Series of alternating 'highs' and La Grange Platform'lows' trending inland on LA GRIMEand MUNRO areas from the coastbetween Roebuck Bay and Nita Downs
28 Absence of any pronounced gradientin McLARTY HILLS area, except forthe extreme north-eastern corner
29 Two closed gravity 'lows' covering Oasis Gravitythe southern part of McLARTY HILLSarea
Depression
- 10 -
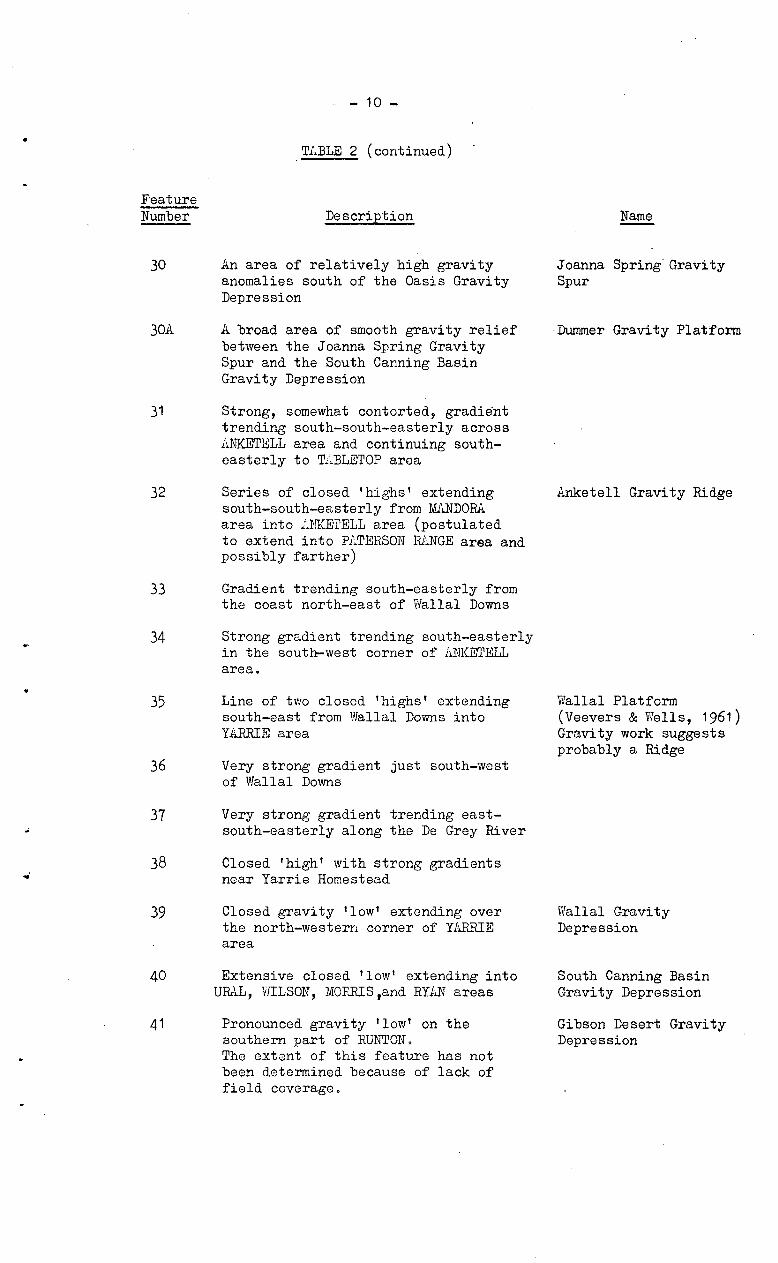
TABLE 2 (continued)
Feature Number Description Name
30^An area of relatively high gravityanomalies south of the Oasis GravityDepression
30A^A broad area of smooth gravity reliefbetween the Joanna Spring GravitySpur and the South Canning BasinGravity Depression
31^Strong, somewhat contorted, gradienttrending south-south-easterly acrossANKETELL area and continuing south-easterly to TABLETOP area
32^Series of closed 'highs' extendingsouth-south-easterly from MANDORAarea into ANKETELL area (postulatedto extend into PATERSON RANGE area andpossibly farther)
Joanna Spring GravitySpur
Dummer Gravity Platform
Anketell Gravity Ridge
33^
Gradient trending south-easterly fromthe coast north-east of Wallal Downs
34^
Strong gradient trending south-easterlyin the south-west corner of ANKETELLarea.
Wallal Platform(Veevers & Wells, 1961)Gravity work suggestsprobably a Ridge
35^Line of two closed 'highs' extendingsouth-east from Wallal Downs intoYARRIE area
36^Very strong gradient just south-westof Wallal Downs
37^Very strong gradient trending east-south-easterly along the De Grey River
38^Closed 'high' with strong gradientsnear Yarrie Homestead
39^Closed gravity 'low' extending overthe north-western corner of YARRIEarea
40^Extensive closed 'low' extending intoURAL, WILSON, MORRIS land RYAN areas
4 1^Pronounced gravity 'low' on thesouthern part of RUNTON.The extent of this feature has notbeen determined because of lack offield coverage.
Wallal GravityDepression
South Canning BasinGravity Depression
Gibson Desert GravityDepression
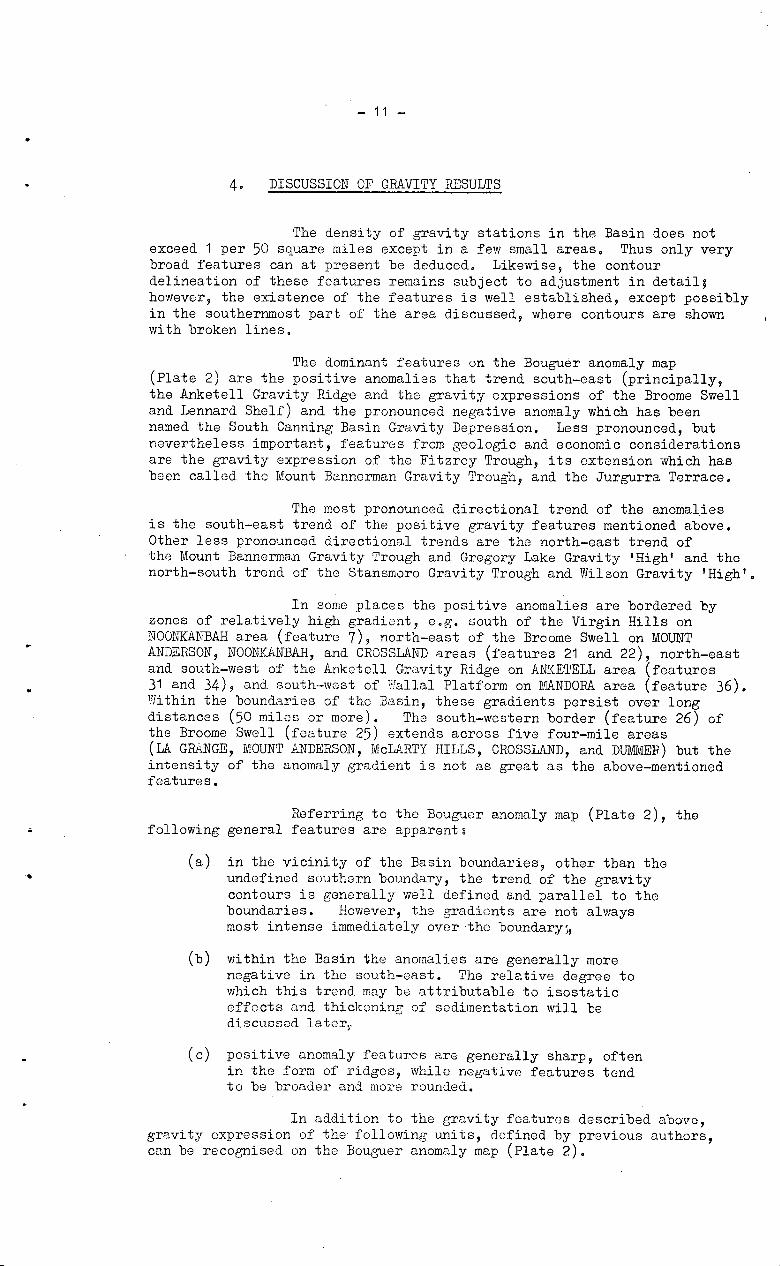
4. DISCUSSION OF GRAVITY RESULTS
The density of gravity stations in the Basin does notexceed 1 per 50 square miles except in a few small areas. Thus only verybroad features can at present be deduced. Likewise, the contourdelineation of these features remains subject to adjustment in detail;however, the existence of the features is well established, except possiblyin the southernmost part of the area discussed, where contours are shownwith broken lines.
The dominant features on the Bouguer anomaly map(Plate 2) are the positive anomalies that trend south-east (principally,the Anketell Gravity Ridge and the gravity expressions of the Broome Swelland Lennard Shelf) and the pronounced negative anomaly which has beennamed the South Canning Basin Gravity Depression. Less pronounced, butnevertheless important, features from geologic and economic considerationsare the gravity expression of the Fitzroy Trough, its extension which hasbeen called the Mount Bannerman Gravity Trough, and the Jurgurra Terrace.
The most pronounced directional trend of the anomaliesis the south-east trend of the positive gravity features mentioned above.Other less pronounced directional trends are the north-east trend ofthe Mount Bannerman Gravity Trough and Gregory Lake Gravity 'High' and thenorth-south trend of the Stansmore Gravity Trough and Wilson Gravity 'High'.
In some places the positive anomalies are bordered byzones of relatively high gradient, e.g. south of the Virgin Hills onNOONKANBAH area (feature 7), north-east of the Broome Swell on MOUNTANDERSON, NOONKANBAH, and CROSSLAND areas (features 21 and 22), north-eastand south-west of the Anketell Gravity Ridge on ANKETELL area (features31 and 34), and south•west of Wallal Platform on MANDORA area (feature 36).Within the boundaries of the Basin, these gradients persist over longdistances (50 miles or more).^The south-western border (feature 26) ofthe Broome Swell (feature 25) extends across five four-mile areas(LA GRANGE, MOUNT ANDERSON, McLARTY HILLS, CROSSLAND, and DUMMER) but theintensity of the anomaly gradient is not as great as the above-mentionedfeatures.
Referring to the Bouguer anomaly map (Plate 2), thefollowing general features are apparents
(a) in the vicinity of the Basin boundaries, other than theundefined southern boundary, the trend of the gravitycontours is generally well defined and parallel to theboundaries. However, the gradients are not alwaysmost intense immediately over the boundary ,
(b) within the Basin the anomalies are generally morenegative in the south-east. The relative degree towhich this trend may be attributable to isostaticeffects and thickening of sedimentation will bediscussed later,
(c) positive anomaly features are generally sharp, oftenin the form of ridges, while negative features tendto be broader and more rounded.
In addition to the gravity features described above,gravity expression of the following units, defined by previous authors,can be recognised on the Bouguer anomaly map (Plate 2).
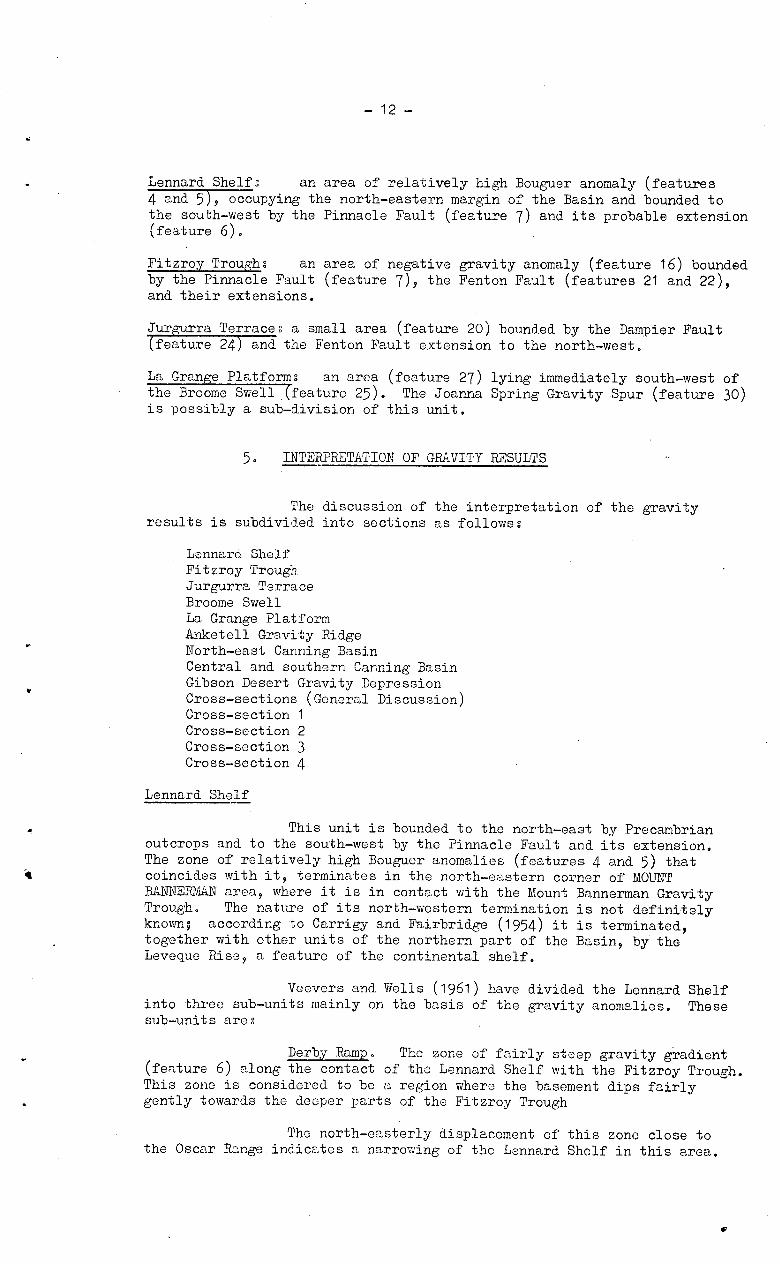
- 12 -
Lennard Shelf's^an area of relatively high Bouguer anomaly (features4 and 5), occupying the north-eastern margin of the Basin and bounded tothe south-west by the Pinnacle Fault (feature 7) and its probable extension(feature 6).
Fitzroy Troughs^an area of negative gravity anomaly (feature 16) boundedby the Pinnacle Fault (feature 7), the Fenton Fault (features 21 and 22),and their extensions.
Jurgurra Terraces a small area (feature 20) bounded by the Dampier Fault(feature 24) and the Fenton Fault extension to the north-west.
La Grange Platforms an area (feature 27) lying immediately south-west ofthe Broome Swell . (feature 25). The Joanna Spring Gravity Spur (feature 30)is possibly a sub-division of this unit.
5. INTERPRETATION OF GRAVITY RESULTS
The discussion of the interpretation of the gravityresults is subdivided into sections as followss
Lennard ShelfFitzroy TroughJurgurra TerraceBroome SwellLa Grange PlatformAnketell Gravity RidgeNorth-east Canning BasinCentral and southern Canning BasinGibson Desert Gravity DepressionCross-sections (General Discussion)Cross-section 1Cross-section 2Cross-section 3Cross-section 4
Lennard Shelf
This unit is bounded to the north-east by Precambrianoutcrops and to the south-west by the Pinnacle Fault and its extension.The zone of relatively high Bouguer anomalies (features 4 and 5) thatcoincides with it, terminates in the north-eastern corner of MOUNTBANNERMAN area, where it is in contact with the Mount Bannerman GravityTrough. The nature of its north-western termination is not definitelyknown; according to Carrigy and Fairbridge (1954) it is terminated,together with other units of the northern part of the Basin, by theLeveque Rise, a feature of the continental shelf.
Veevers and Wells (1961) have divided the Lennard Shelfinto three sub-units mainly on the basis of the gravity anomalies. Thesesub-units arcs
Derby Ramp. The zone of fairly steep gravity gradient(feature 6) along the contact of the Lennard Shelf with the Fitzroy Trough.This zone is considered to be a region where the basement dips fairlygently towards the deeper parts of the Fitzroy Trough
The north-easterly displacement of this zone close tothe Oscar Range indicates a narrowing of the Lennard Shelf in this area.
- 1 3 -
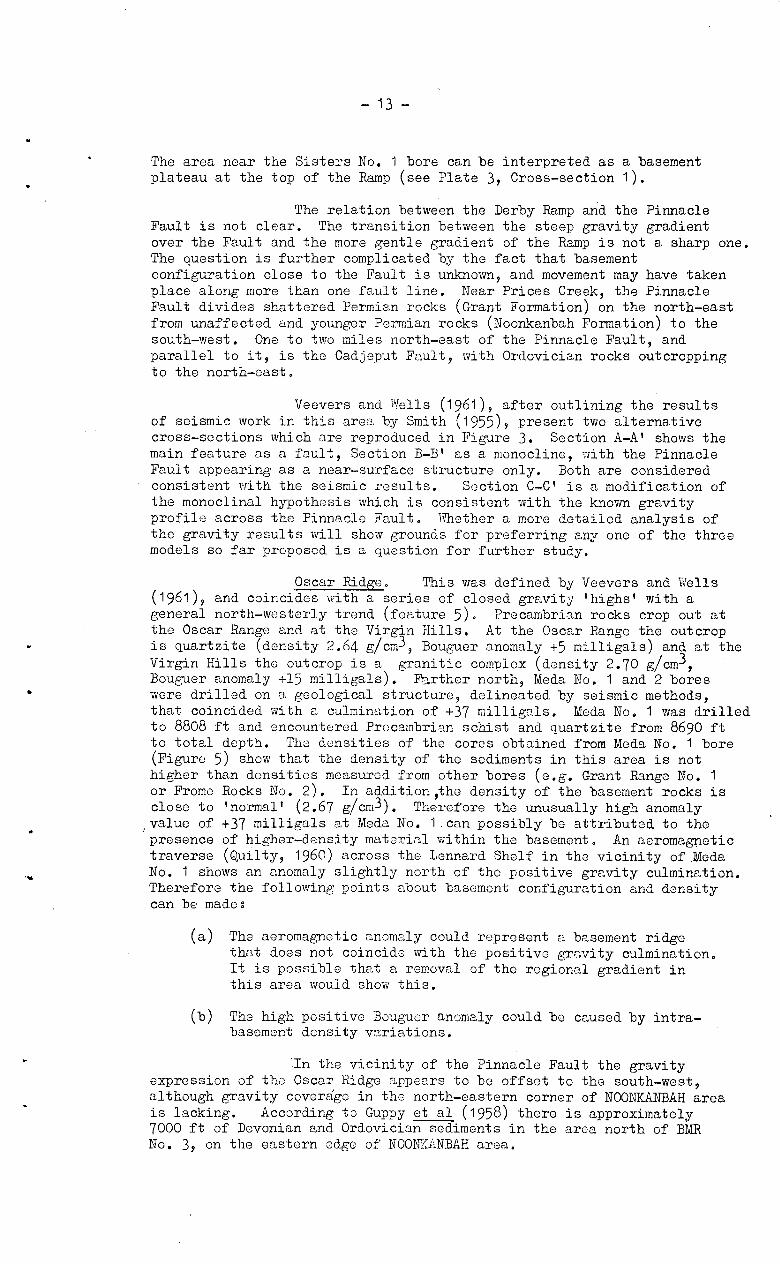
The area near the Sisters No. 1 bore can be interpreted as a basementplateau at the top of the Ramp (see Plate 3, Cross-section 1).
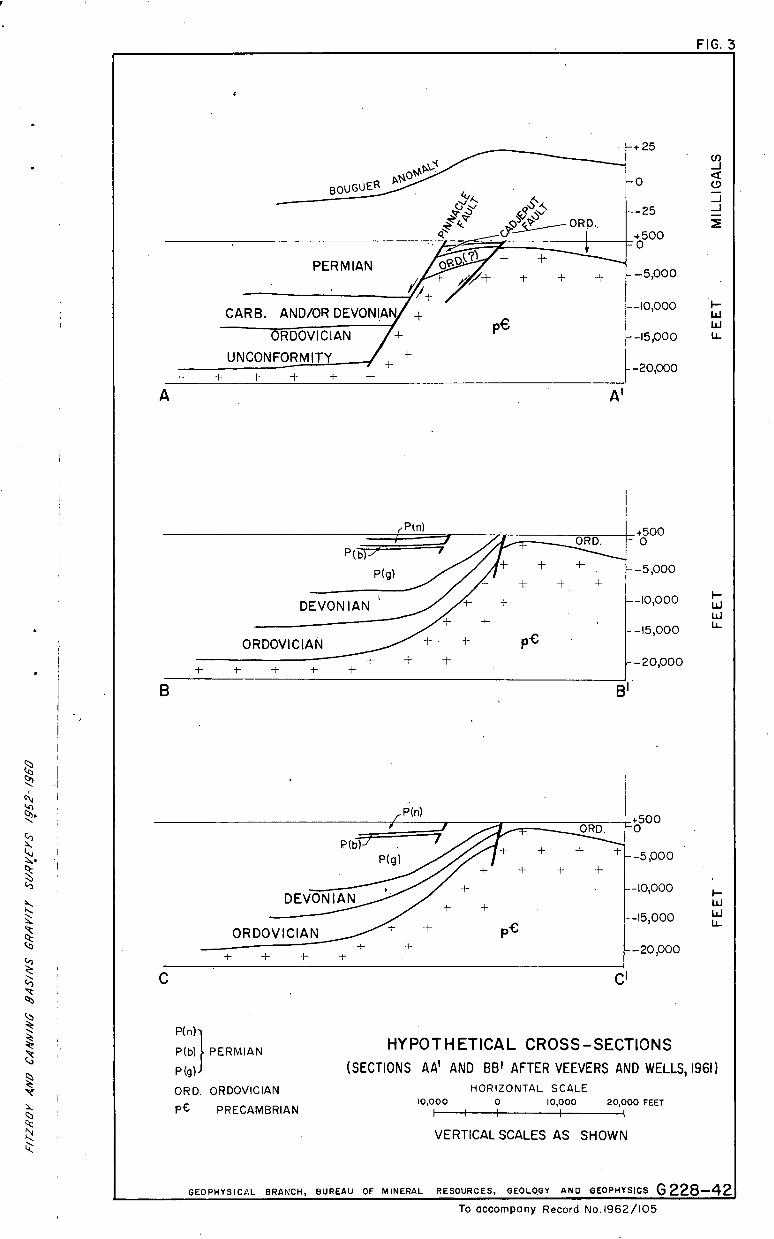
The relation between the Derby Ramp and the PinnacleFault is not clear. The transition between the steep gravity gradientover the Fault and the more gentle gradient of the Ramp is not a sharp one.The question is further complicated by the fact that basementconfiguration close to the Fault is unknown, and movement may have takenplace along more than one fault line. Near Prices Creek, the PinnacleFault divides shattered Permian rocks (Grant Formation) on the north-eastfrom unaffected and younger Permian rocks (Noonkanbah Formation) to thesouth-west. One to two miles north-east of the Pinnacle Fault, andparallel to it, is the Cadjeput Fault, with Ordovician rocks outcroppingto the north-east.
Veevers and Wells (1961), after outlining the resultsof seismic work in this area by Smith (1955), present two alternativecross-sections which are reproduced in Figure 3. Section A-A' shows themain feature as a fault, Section B-B' as a monocline, with the PinnacleFault appearing as a near-surface structure only. Both are considered
• consistent with the seismic results.^Section C-C' is a modification ofthe monoclinal hypothesis which is consistent with the known gravityprofile across the Pinnacle Fault. Whether a more detailed analysis ofthe gravity results will show grounds for preferring any one of the threemodels so far proposed is a question for further study.
Oscar Ridge.^This was defined by Veevers and Wells(1961), and coincides with a series of closed gravity 'highs' with ageneral north-westerly trend (feature 5). Precambrian rocks crop out atthe Oscar Range and at the Virgin Hills. At the Oscar Range the outcropis quartzite (density 2.64 g/cm 3 , Bouguer anomaly +5 milligals) and at theVirgin Hills the outcrop is a granitic complex (density 2.70 g/cm 3 ,Bouguer anomaly +15 milligals). Farther north, Meda Yo. 1 and 2 boreswere drilled on a geological structure, delineated by seismic methods,that coincided with a culmination of +37 milligals. Meda No. 1 was drilledto 8808 ft and encountered Precambrian schist and quartzite from 8690 ftto total depth. The densities of the cores obtained from Meda No. 1 bore(Figure 5) show that the density of the sediments in this area is nothigher than densities measured from other bores (e.g. Grant Range No. 1or Frome Rocks No. 2). In - addition,the density of the basement rocks isclose to 'normal' (2.67 g/cm 3 ). Therefore the unusually high anomaly
,value of +37 milligals at Meda No. 1.can possibly be attributed to thepresence of higher-density material within the basement. An aeromagnetictraverse (Quilty, 1960) across the Lonnard Shelf in the vicinity of.MedaNo. 1 shows an anomaly slightly north of the positive gravity culmination.Therefore the following points about basement configuration and densitycan be made:
(a) The aeromagnetic anomaly could represent a basement ridgethat does not coincide with the positive gravity culmination.It is possible that a removal of the regional gradient inthis area would show this.
(b) The high positive Bouguer anomaly could be caused by intra-basement density variations.
In the vicinity of the Pinnacle Fault the gravityexpression of the Oscar Ridge appears to be offset to the south-west,although gravity coverage in the north-eastern corner of NOONKANBAH areais lacking. .According to Guppy et al (1958) there is approximately7000 ft of Devonian and Ordovician sediments in the area north of BMRNo. 3, on the eastern edge of NOONKANBAH area.
- 1 4 -
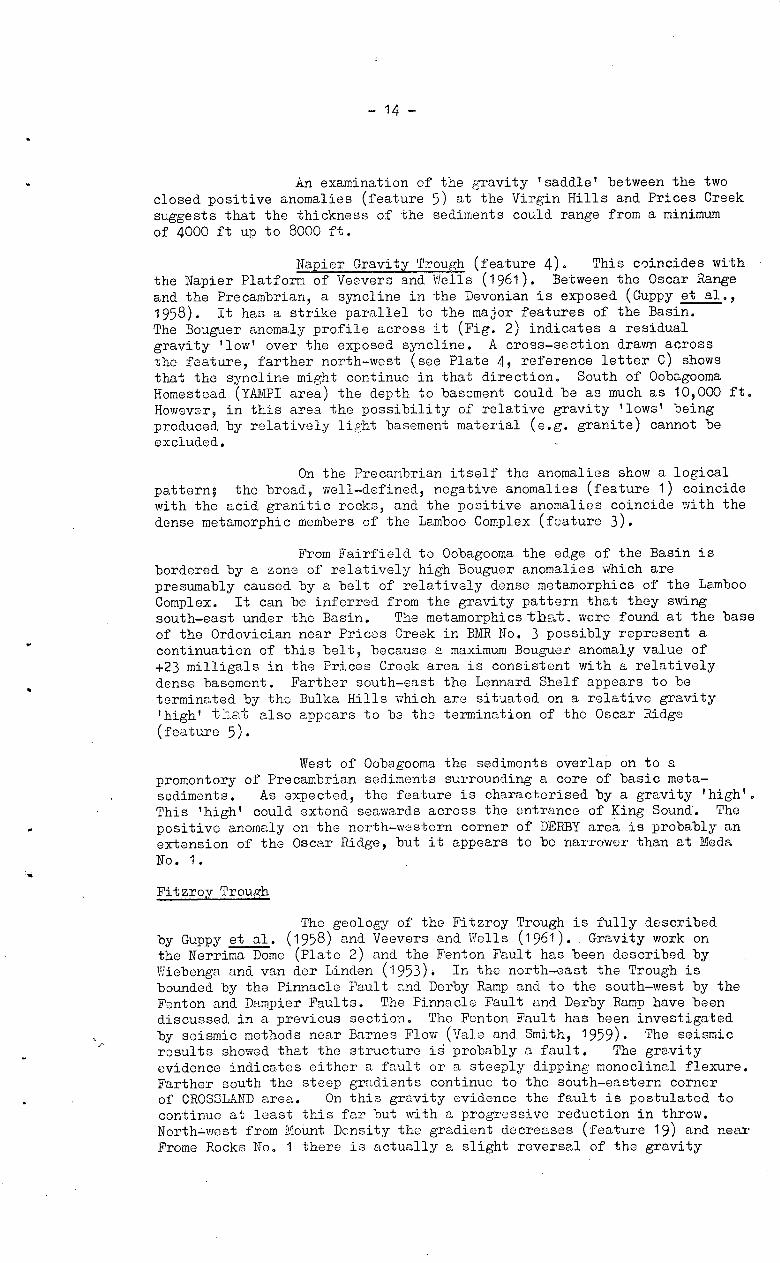
An examination of the gravity 'saddle' between the twoclosed positive anomalies (feature 5) at the Virgin Hills and Prices Creeksuggests that the thickness of the sediments could range from a minimumof 4000 ft up to 8000 ft.
Napier Gravity Trough (feature 4).^This coincides withthe Napier Platform of Veevers and Wells (1961). Between the Oscar Rangeand the Precambrian, a syncline in the Devonian is exposed (Guppy et al.,1958). It has a strike parallel to the major features of the Basin.The Bouguer anomaly profile across it (Fig. 2) indicates a residualgravity 'low' over the exposed syncline. A cross-section drawn acrossthe feature, farther north-west (see Plate 4, reference letter C) showsthat the syncline might continue in that direction. South of OobagoomaHomestead (YAMPI area) the depth to basement could be as much as 10,000 ft.However, in this area the possibility of relative gravity 'lows' beingproduced by relatively light basement material (e.g. granite) cannot beexcluded.
On the Precambrian itself the anomalies show a logicalpattern; the broad, well-defined, negative anomalies (feature 1) coincidewith the acid granitic rocks, and the positive anomalies coincide with thedense metamorphic members of the Lamboo Complex (feature 3).
From Fairfield to Oobagooma the edge of the Basin isbordered by a zone of relatively high Bouguer anomalies which arepresumably caused by a belt of relatively dense metamorphics of the LambooComplex. It can be inferred from the gravity pattern that they swingsouth-east under the Basin. The metamorphics that_ were found at the baseof the Ordovician near Prices Creek in BMR No. 3 possibly represent acontinuation of this belt, because a maximum Bouguer anomaly value of+23 milligals in the Prices Creek area is consistent with a relativelydense basement. Farther south-cast the Lennard Shelf appears to beterminated by the Bulka Hills which are situated on a relative gravity'high' that also appears to be the termination of the Oscar Ridge(feature 5).
West of Oobagooma the sediments overlap on to apromontory of Precambrian sediments surrounding a core of basic meta-sediments. As expected, the feature is characterised by a gravity 'high'.This 'high' could extend seawards across the entrance of King Sound. Thepositive anomaly on the north-western corner of DERBY area is probably anextension of the Oscar Ridge, but it appears to be narrower than at MedaNo. 1.
Fitzroy Trough
The geology of the Fitzroy Trough is fully describedby Guppy et al. (1958) and Veevers and Wells (1961). • Gravity work onthe Nerrima Dome (Plate 2) and the Fenton Fault has been described byWiebenga and van der Linden (1953): In the north-east the Trough isbounded by the Pinnacle Fault and Derby Ramp and to the south-west by theFenton and Dampier Faults. The Pinnacle Fault and Derby Ramp have beendiscussed in a previous section. The Fenton Fault has been investigatedby seismic methods near Barnes Flow (Vale and Smith, 1959). The seismicresults showed that the structure iS probably a fault. The gravityevidence indicates either a fault or a steeply dipping monoclinal flexure.Farther south the steep gradients continue to the south-eastern cornerof CROSSLAND area:^On this gravity evidence the fault is postulated tocontinue at least this far but with a progressive reduction in throw.Northwest from MoUnt Density the gradient decreases (feature 19) and nearFrome Rocks No. 1 there is actually a slight reversal of the gravity
- 1 5 -
gradient.^However, drilling results show that at Frome Rocks No. 1the Fenton Fault still exists with direction of throw unchanged.
This problem is discussed further in the section on theJurgurra Terrace. The fault cannot be observed at the surface at FromeRocks No. 1 and farther north because the surface is covered by Recentdeposits and the fault's probable extension farther north is not apparentfrom the gravity results. According to Trumpy, Guillemot, and Tissot(1960) the fault does not continue much beyond the Frame Rocks No. 1 area.
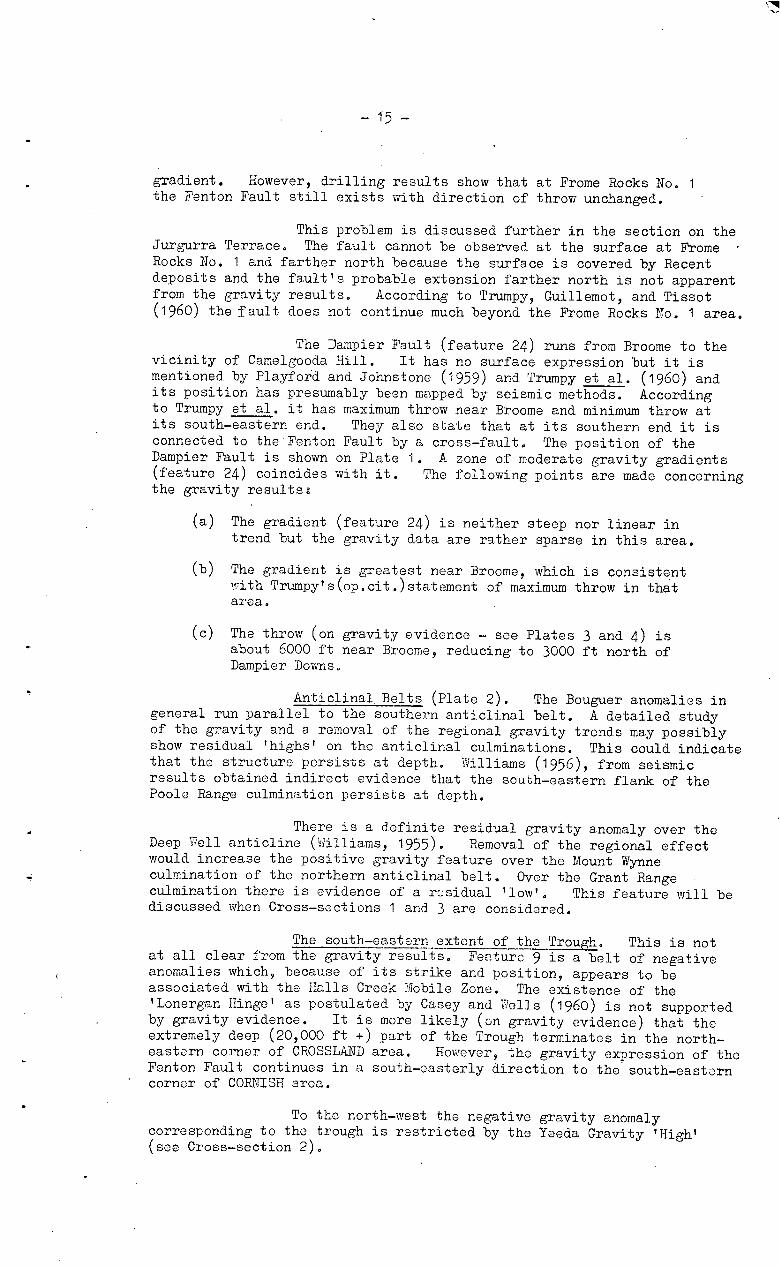
The Dampier Fault (feature 24) runs from Broome to thevicinity of Camelgooda Hill.^It has no surface expression but it ismentioned by Playford and Johnstone (1959) and Trumpy et al. (1960) andits position has presumably been mapped by seismic methods. Accordingto Trumpy et al. it has maximum throw near Broome and minimum throw atits south-eastern end.^They also state that at its southern end it isconnected to the . Fenton Fault by a cross-fault. The position of theDampier Fault is shown on Plate 1. A zone of moderate gravity gradients(feature 24) coincides with it.^The following points are made concerningthe gravity results8
(a) The gradient (feature 24) is neither steep nor linear intrend but the gravity data are rather sparse in this area.
(b) The gradient is greatest near Broome, which is consistentwith Trumpy's(op.cit.)statement of maximum throw in thatarea.
(c) The throw (on gravity evidence - see Plates 3 and 4) isabout 6000 ft near Broome, reducing. to 3000 ft north ofDampier Downs,
Anticlinal Belts (Plate 2).^The Bouguer anomalies ingeneral run parallel to the southern anticlinal belt. A detailed studyof the gravity and a removal of the regional gravity trends may possibly.show residual 'highs' on the anticlinal culminations. This could indicatethat the structure persists at depth. Williams (1956), from seismicresults obtained indirect evidence that the south-eastern flank of thePoole Range culmination persists at depth.
There is a definite residual gravity anomaly over theDeep Well anticline (Williams, 1955).^Removal of the regional effectwould increase the positive gravity feature over the Mount Wynneculmination of the northern anticlinal belt. Over the Grant Range •culmination there is evidence of a rosidual 'low'.^This feature will bediscussed when Cross-sections 1 and 3 are considered.
The south-eastern extent of the Trough.^This is notat all clear from the gravity results. Feature 9 is a belt of negativeanomalies which, because of its strike and position, appears to beassociated with the Halls Creek Mobile Zone. The existence of the'Lonergan Hinge' as postulated by Casey and Wells (1960) is not supportedby gravity evidence.^It is more likely (on gravity evidence) that theextremely deep (20,000 ft +) part of the Trough terminates in the north-eastern corner of CROSSLAND area. However, the gravity expression of theFenton Fault continues in a south-easterly direction to the south-easterncorner of CORNISH area.
To the north-west the negative gravity anomalycorresponding to the trough is restricted by the Yeeda Gravity 'High'(see Cross-section 2).
- 16 -
Jurgurra Terrace
(feature(Playfordof upperthicknessWith refe
(a)
(b)
(c)
(d)
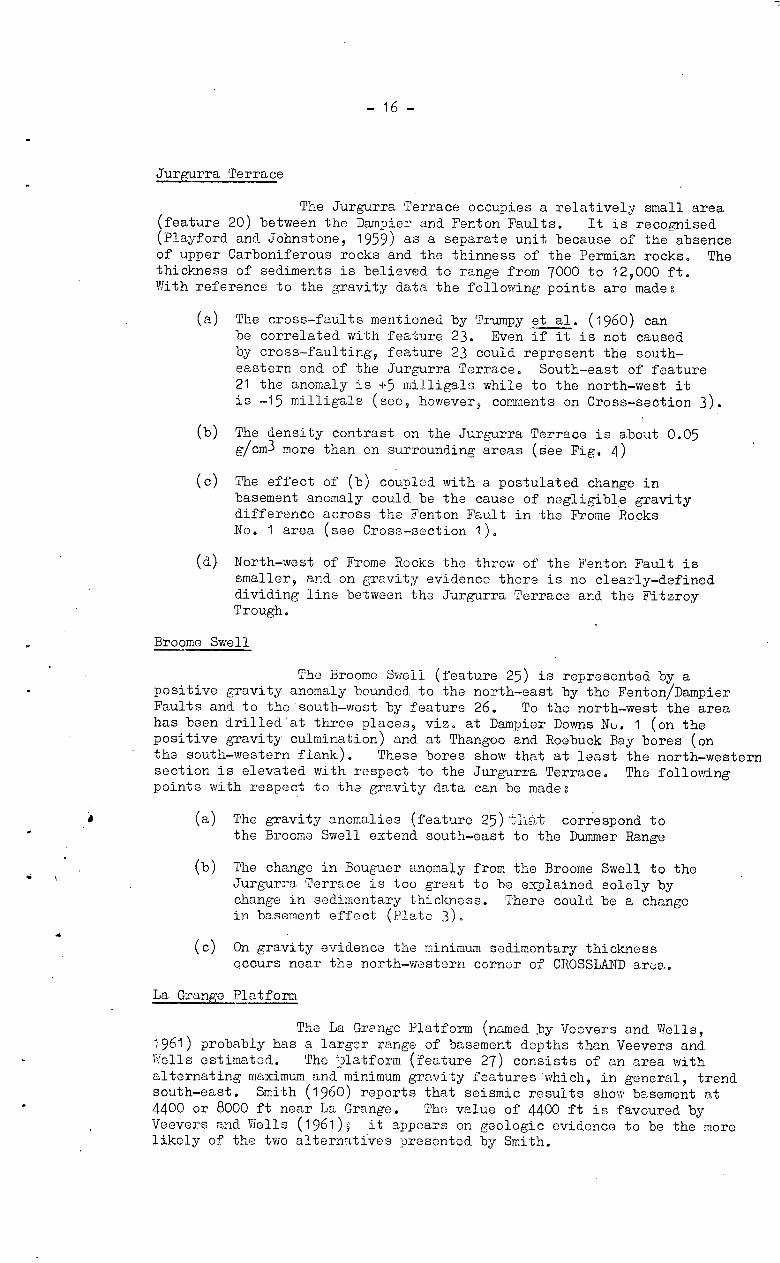
The Jurgurra Terrace occupies a relatively small area20) between the Dampier and Fenton Faults.^It is recognisedand Johnstone, 1959) as a separate unit because of the absenceCarboniferous rocks and the thinness of the Permian rocks. Theof sediments is believed to range from 7000 to 12,000 ft.
rence to the gravity data the following points are mades
The cross-faults mentioned by Trumpy et al. (1960) canbe correlated with feature 23. Even if it is not causedby cross-faulting, feature 23 could represent the south-eastern end of the Jurgurra Terrace. South-east of feature21 the anomaly is +5 milligals while to the north-west itis -15 milligals (see, however, comments on Cross-section 3).
The density contrast on the Jurgurra Terrace is about 0.05g/cm3 more than on surrounding areas (bee Fig. 4)
The effect of (b) coupled with a postulated change inbasement anomaly could be the cause of negligible gravitydifference across the Fenton Fault in the Frame RocksNo. 1 area (see Cross-section 1).
North-west of Frome Rocks the throw of the Fenton Fault issmaller, and on gravity evidence there is no clearly-defineddividing line between the Jurgurra Terrace and the FitzroyTrough,
Broome Swell
The Broome Swell (feature 25) is represented by apositive gravity anomaly bounded to the north-east by the Fenton/DampierFaults and to the south-west by feature 26. To the north-west the areahas been drilled•at three places, viz. at Dampier Downs No. 1 (on thepositive gravity culmination) and at Thangoo and Roebuck Bay bores (on
• the south-western flank).^These bores show that at least the north-westernsection is elevated with respect to the Jurgurra Terrace. The followingpoints with respect to the gravity data can be mades
The gravity anomalies (feature 25) thE),t, correspond tothe Broome Swell extend south-east to the Dummer Range
The change in Bouguer anomaly from the Broome Swell to theJurgurra Terrace is too great to be explained solely bychange in sedimentary thickness. There could be a changein basement effect (Plate 3).
(c) On gravity evidence the minimum sedimentary thicknessoccurs near the north-western corner of CROSSLAND area.
La Grange Platform
The La Grange Platform (named by Veevers and Wells,1961) probably has a larger range of basement depths than Veevers andWells estimated.^The ;platform (feature 27) consists of an area withalternating maximum and minimum gravity features which, in general, trendsouth-east. Smith (1960) reports that seismic results show basement at4400 or 8000 ft near La Grange. The value of 4400 ft is favoured byVeevers and Wells (1961) ^it appears on geologic evidence to be the morelikely of the two alternatives presented by Smith.
- 1 7 -
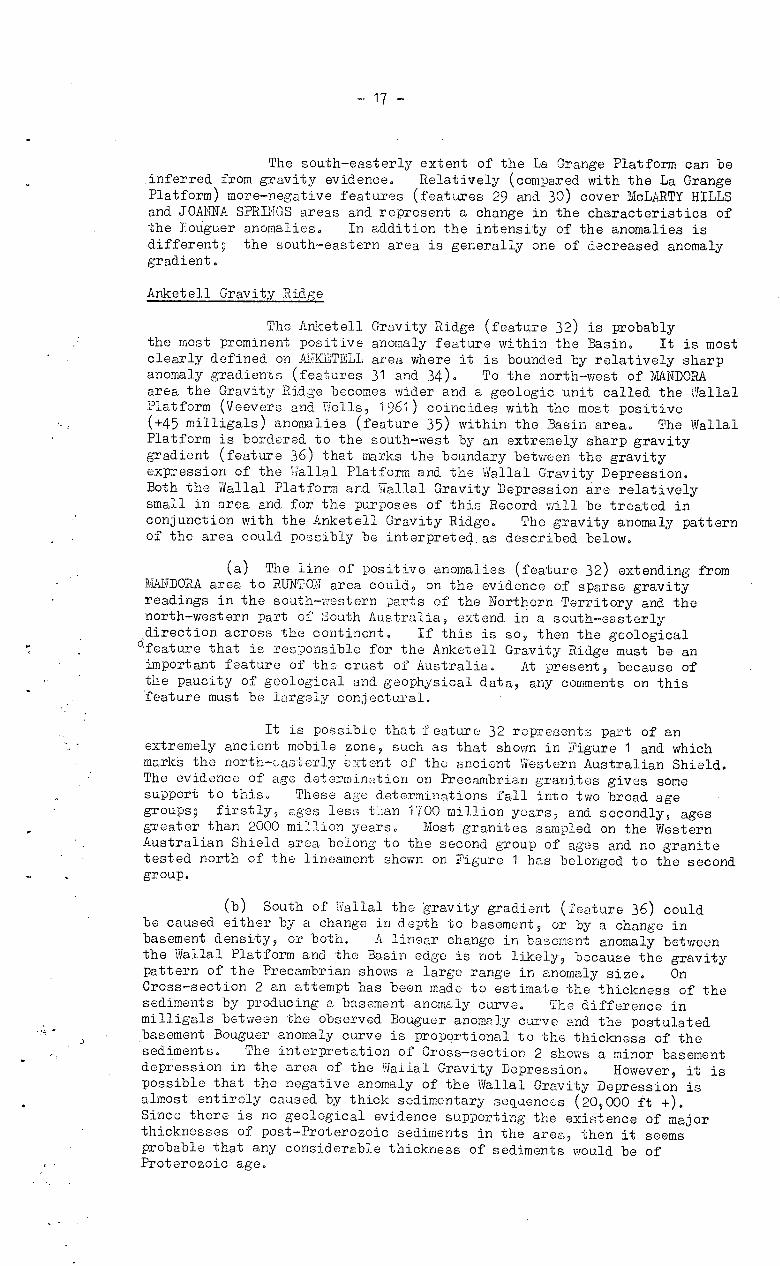
The south-easterly extent of the La Grange Platform can be.inferred from gravity evidence,^Relatively (compared with the La GrangePlatform) more-negative features (features 29 and 30) cover McLARTY HILLSand JOANNA SPRINGS areas and represent a change in the characteristics ofthe ToUguer anomalies.^In addition the intensity of the anomalies isdifferent the south-eastern area is generally one of decreased anomalygradient.
Anketell Gravity Ridpe
The Anketell Gravity Ridge (feature 32) is probablythe most prominent positive anomaly feature within the Basin.^It is mostclearly defined on ANKLTELB area where it is bounded by relatively sharpanomaly gradients (features 31 and 34).^To the north-west of MANDORAarea the Gravity Ridge becomes wider and a geologic unit called the WallalPlatform (Veevers and Wells, 1961) coincides with the most positive(+45 milligals) anomalies (feature 35) within the Basin area.^The Walla'Platform is bordered to the south-west by an extremely sharp gravitygradient (feature 36) that marks the boundary between the gravityexpression of the Wallal Platform and the Wallal Gravity Depression.Both the Wallal Platform and Wallal Gravity Depression are relativelysmall in area and for the purposes of this Record will be treated inconjunction with the Anketell Gravity Ridge.^The gravity anomaly patternof the area could possibly be interpreted, as described below.
(a) The line of positive anomalies (feature 32) extending fromMANDORA area to RUNTON area could, on the evidence of sparse gravityreadings in the south-western parts of the Northern Territory and thenorth-western part of South Australia, extend in a. south-easterlydirection across the continent.^If this is so, than the geological
c feature that is responsible for the Anketell Gravity Ridge must be animportant feature of the crust of Australia.^At present, because ofthe paucity of geological and geophysical data, any comments on this'feature must be largely conjectural.
It is possible that feature 32 represents part of anextremely ancient mobile zone, such as that shown in Figure 1 and whichmarks the north-easterly extent of the ancient Western Australian Shield.The evidence of age determination on Precambrian granites gives somesupport to this.^These age determinations fall into two broad agegroups^firstly, ages less tan 1700 million years, and secondly, agesgreater than 2000 million years.^Most 'granites sampled on the WesternAustralian Shield area belong to the second group of ages and no granitetested north of the lineament shown on Figure 1 has belonged to the secondgroup.
(b) South of Wallal the gravity gradient (feature 36) couldbe caused either by a change in depth to basement, or by a change inbasement density, or both.^A linear change in basement anomaly betweenthe Wallal Platform and the Basin edge is not likely, because the gravitypattern of the Precambrian shows a large range in anomaly size.^OnCross-section 2 an attempt has been made to estimate the thickness of thesediments by producing a basement anomaly curve.^The difference inmilligals between the observed Bouguer anomaly curve and the postulated
. basement Bouguer anomaly curve is proportional to the thickness of thesediments.^The interpretation of Cross-section 2 shows a minor basementdepression in the area of the Wallal Gravity Depression.^However, it ispossible that the negative anomaly of the Wallal Gravity Depression isalmost entirely caused by thick sedimentary sequences (20,000 ft +).Since there is no geological evidence supporting the existence of majorthicknesses of post-Proterozoic sediments in the area, then it seemsprobable that any considerable thickness of sediments would be ofProterozoic age.
- 18 -
(c)Between the bores Wallal No. 1 and Samphire Marsh No. 1there is a slight gravity 'low', which could possibly represent asedimentary thickness of up to 12,000 ft.
(d)On the Precambrian of the Pilbara Block the anomalypattern is similar to the pattern north of the Lennard Shelf, i.e., thepositive anomalies occur over metamorphic and basic rocks of the Archaeanand Lower Proterozoic and the more negative anomalies are over outcropsof granite or granitic gneiss.^Some of the gradients over thePrecambrian outcrop (features 37 and 38) are extremely intense.
North-east Canning Basin
The North-east Canning Basin includes the followingfeatures:
Mount Bannerman Gravity Trough (feature 9)Gregory Lake Gravity 'High' (feature 14)'Stansmore Gravity Trough (feature 12)Minnie Range Gravity Shelf (feature 14A)Wilson Gravity 'High' (feature 13)
The following observations can be made:
(a) From geological observation the MOUNT RAMSAY area appearsto be where the King Leopold and Halls Creek Mobile Zonesmeet. The trends of the anomalies of MOUNT RAMSAY andMOUNT BANNERMAN areas support the geological evidence forthis idea (of features 7 and 8).
(b) The belt of Halls Creek metamorphics which trends north-eastis coincident with an anomaly trend of high gradient (feature 8).However, gravity coverage of GORDON DOWNS area is not sufficientto provide accurate anomaly contours north of BILLILUNA area.
(c) The Hardman Basin (Plate 1) (containing Lower Palaeozoicsediments on GORDON DOWNS and DIXON RANGE areas) is probablycontinuous with the Mount Bannerman Gravity Trough (feature 9).The Trough continues across the Basin boundary without anyappreciable change in anomaly magnitude. The gravity minima(feature 9) therefore probably represent the effect of aconsiderable thickness of Proterozoic sediments on both sidesof the Basin boundary. Because Lower Palaeozoic sediments arepresent in the Hardman Basin, it is possible that similarsediments are present at depth on MOUNT BANNERMAN area.
(d) The structure that causes the anomaly 'lows' of the MountBannerman Gravity Trough lbranches near Billiluna homestead;a series of 'lows' trends south from there, parallel to theBasin edge.^This feature (number 12) has been named theStansmore Gravity Trough and like the Mount Bannerman GravityTrough it probably represents a considerable thickness ofProterozoic sediments. In addition, the north-south Troughbranches on LUCAS area where there is a pronounced west-north-west anomaly 'low'.^It is possible therefore that the influenceof the Warramunga Mobile Zone extends this far (Traves, 1955).
(e) The Stansmore Fault is characterised by a steep gradient atits southern end, near the Stansmore Ranges (Plate 2). Towardsthe north,.where its throw is decreased, it crosses thegravity trends obliauely. The main variations in basement
- 19 -
depth probably run north from the Stansmore Ranges, followingthe trend of the Stansmore Gravity Trough.
(f) Owing to the paucity of outcrop and total lack of subsurface(such as seismic) • data it must be assumed that the Gregory LakeGravity 'High' (feature 14) and Wilson Gravity 'High' (feature13) probably represent shallow basement.
Central and southern Canning Basin
The Central and southern Canning Basin (features 29, 30,and 40) is an area in which the Bouguer anomalies are generally much morenegative than anywhere else in the Basin. Feature 40 is the predominatingnegative feature of the whole Basin. Three gravity features in this areahave been named and described. They are:
Oasis Gravity DepressionJoanna Spring Gravity SpurSouth Canning Basin Gravity Depression
Some general features of the anomaly pattern of the areaare:
(a) Generally the anomalies are smooth with no steep gradientsor sudden changes in trends. This could be caused by:
.a considerable thickness of undisturbed sediments,athin 'veneer' of sediments on a non-complex crystallinebasement,
insufficient station density and therefore a loss in definition.
(b) The anomalies become more negative to the south-east. Somepossible causes of this are:
athickening of the sediments from north-west to south-east,athickening of the (light) crust towards the centre of thecontinent with a resultant decrease in Bouguer anomaly.
The decrease in anomaly magnitude could be partially caused by thickeningbut it is impossible to estimate the relative magnitude of this effect,without more detailed analysis.
Because the gravity coverage in this area is poor it is notpossible to accurately define the south-eastern extent of feature 40.
Gibson Desert Gravity Depression (feature 41).
It is interesting to note that the 'possible salt dome' atWoolnough Hills (Veevers and Wells, 1959) is near the south-western cornerof MORRIS arQaand is therefore separated from the South Canning BasinGravity Depression by the Anketell Gravity Ridge. According to Leslie(1961) the 'dome' has a gypsum core surrounded by Proterozoic sediments.Therefore it must be postulated that a thick Proterozoic sequence existssouth-west of the Anketell Gravity Ridge.
Cross-sections (General discussion)
Four cross-sections with Bouguer anomaly profiles andpossible geologic cross-sections are presented. Where it has beenapplicable, the sections have been used to illustrate points made in theforegoing discussion Of the results. Therefore remarks made about thecross-section will concern mainly features (gravity or geological) th..6-•have not been discussed previously.
- 20 -
Cross-section 1 (Plate 3)
The geological cross-section used in this Plate was drawnfrom Trumpy et al. (1960). Two types of Bouguer anomaly profile arepresented
(a) Observed Bouguer anomaly - as obtained from Plate 2.
(b) Bouguer anomaly with the gravity effect of the sediments(or basement anomaly) removed. This is the Bouguer anomalythat would result at the surface if the sediments werereplaced by material having the same density as the basement.This anomaly can only be calculated at points where thethickness of the sediments is known, and density data onthe sediments are available. Thus the control points usedin drawing the curve occurred at boreholes that penetratedto basement (or at least at holes that penetrated deep enoughto enable a reasonable depth estimate to be made). Betweenthe control points a linear change in anomaly is assumedexcept where the geological evidence strongly indicatesotherwise.
Of course the two anomaly curves, (a) and (b), areidentical over areas of basement outcrop. The difference g z (in milligals)between the two profiles is directly proportioned to the thickness (L)of sediments, the formula used for depth calculations being L = gz/12.77%Yd
The broken line on the geological cross-section shows thesedimentary depth calculated from the above equation. It should be notedthat two different density contrasts (sediments to basement) are used.The density data from the boreholes (Fig. 4) were used as a basis for this.The following points on the cross-section can be made, and are discussedunder A 9 B 9 C 9 etc, which are marked on Plate 3,
A. The gravity 'high' of the Broome Swell appears quite plainlybut the Dampier Fault does not show on the profile calculatedfrom gravity data. This could be partially due to an incorrectselection of basement anomaly. Also the type of formula usedis not suitable for calculating or plotting faults.
B. In contrast to Cross-section 3(Plate 5), the gravityexpression of the Fenton Fault in this area is totally lacking.However, the evidence obtained from Frome Rocks No. 1 and 2and Grant Range No. I/ shows that there is considerabledisplacement across the Fenton Fault. The lack of gravitycontrast across the fault can be explained bys
(a) Change in density contrast from the Fitzroy Troughto the Jurgurra Terrace, combined with
(b) a change in basement anomaly across the Fenton Fault.
The lack of gravity expression of the Fenton Fault could alsobe due to a known considerable thickness of upper Carboniferoussediments in the Fitzroy Trough and none on the JurgurraTerrace. If the density of upper Carboniferous sediments isclose to basement density, then the absence of those sedimentsfrom the sequence on the Jurgurra Terrace would cause nochange in anomaly across the Fenton Fault. In the area ofhigh anomaly-gradient (features 21 and 22), it is not knownwhether upper Carboniferous sediments are present in the
* where L is in kilofeet, , , c1=- density differencebetwee ediments and basement (g/cm3 )
- 21 -
Fitzroy Trough.^However, if they are present 9 . then the largegravity gradients across the Fenton Fault (features 21 and 22)and the smaller gradient further to the north-west (feature 19) -
cannot be explained solely by changes in thickness of theupper Carboniferous.
It must also be noted that the Fitzroy Trough/Broome Swellboundary (features 21 9 22,and 15) is characterised by a steepgravity gradient while the Fitzroy Trough/Jurgurra Terraceboundary is marked by a zero, or small, gravity gradient.The increased density contrast (basement to sediments, withrespect to the Fitzroy Trough and Broome Swell) of the JurgurraTerrace has already been noted. It is possible therefore thatthe loss of intensity of the gravity gradient along the FentonFault is mainly caused by an increase in density contrastwithin the Jurgurra Terrace.
C. The Grant Range No. 1 bore was drilled on the Grant RangeAnticline which is represented 9 gravitationally, by a distinct'low'.^This feature will be discussed under Cross-section 3.
D. Oscar Ridge (represented by a gravity 'high', feature number 5)could be caused by an intrusive mass of the dimensions anddensity shown on the cross-section.
E.^The interpretation of the cross-section shows a thickening ofsediments north of the 67-mile bore. This possible thickeningcould be an extension of the Fairfield Syncline (Plate 1 9
LENNARD RIVER area).
Cross-section 2 (Plate 4)
Cross-section 2 was drawn across the Basin from south-westto north-east. It was included in order to show the following points:
(a) near the coast a gravity profile drawn at right angles tothe (major) north-westerly trend shows a considerable degreeof symmetry; e.g. the gravity 'highs' representing the WallalPlatform and Oscar Ridge are symmetrically placed with respectto a gravity 'low' on the La Grange Platform,
(b) south of Barlee No. 1 a gravity 'low' suggests that thesedimentary thickness between Barlee No. 1 and the DampierFault might be considerable. This narrow area of deepersediments could represent a north-westerly extension of theextremely thick sediments of the Fitzroy Trough,
(c) north of Meda No. 1 there is a suggestion of a thickeningof sediments.
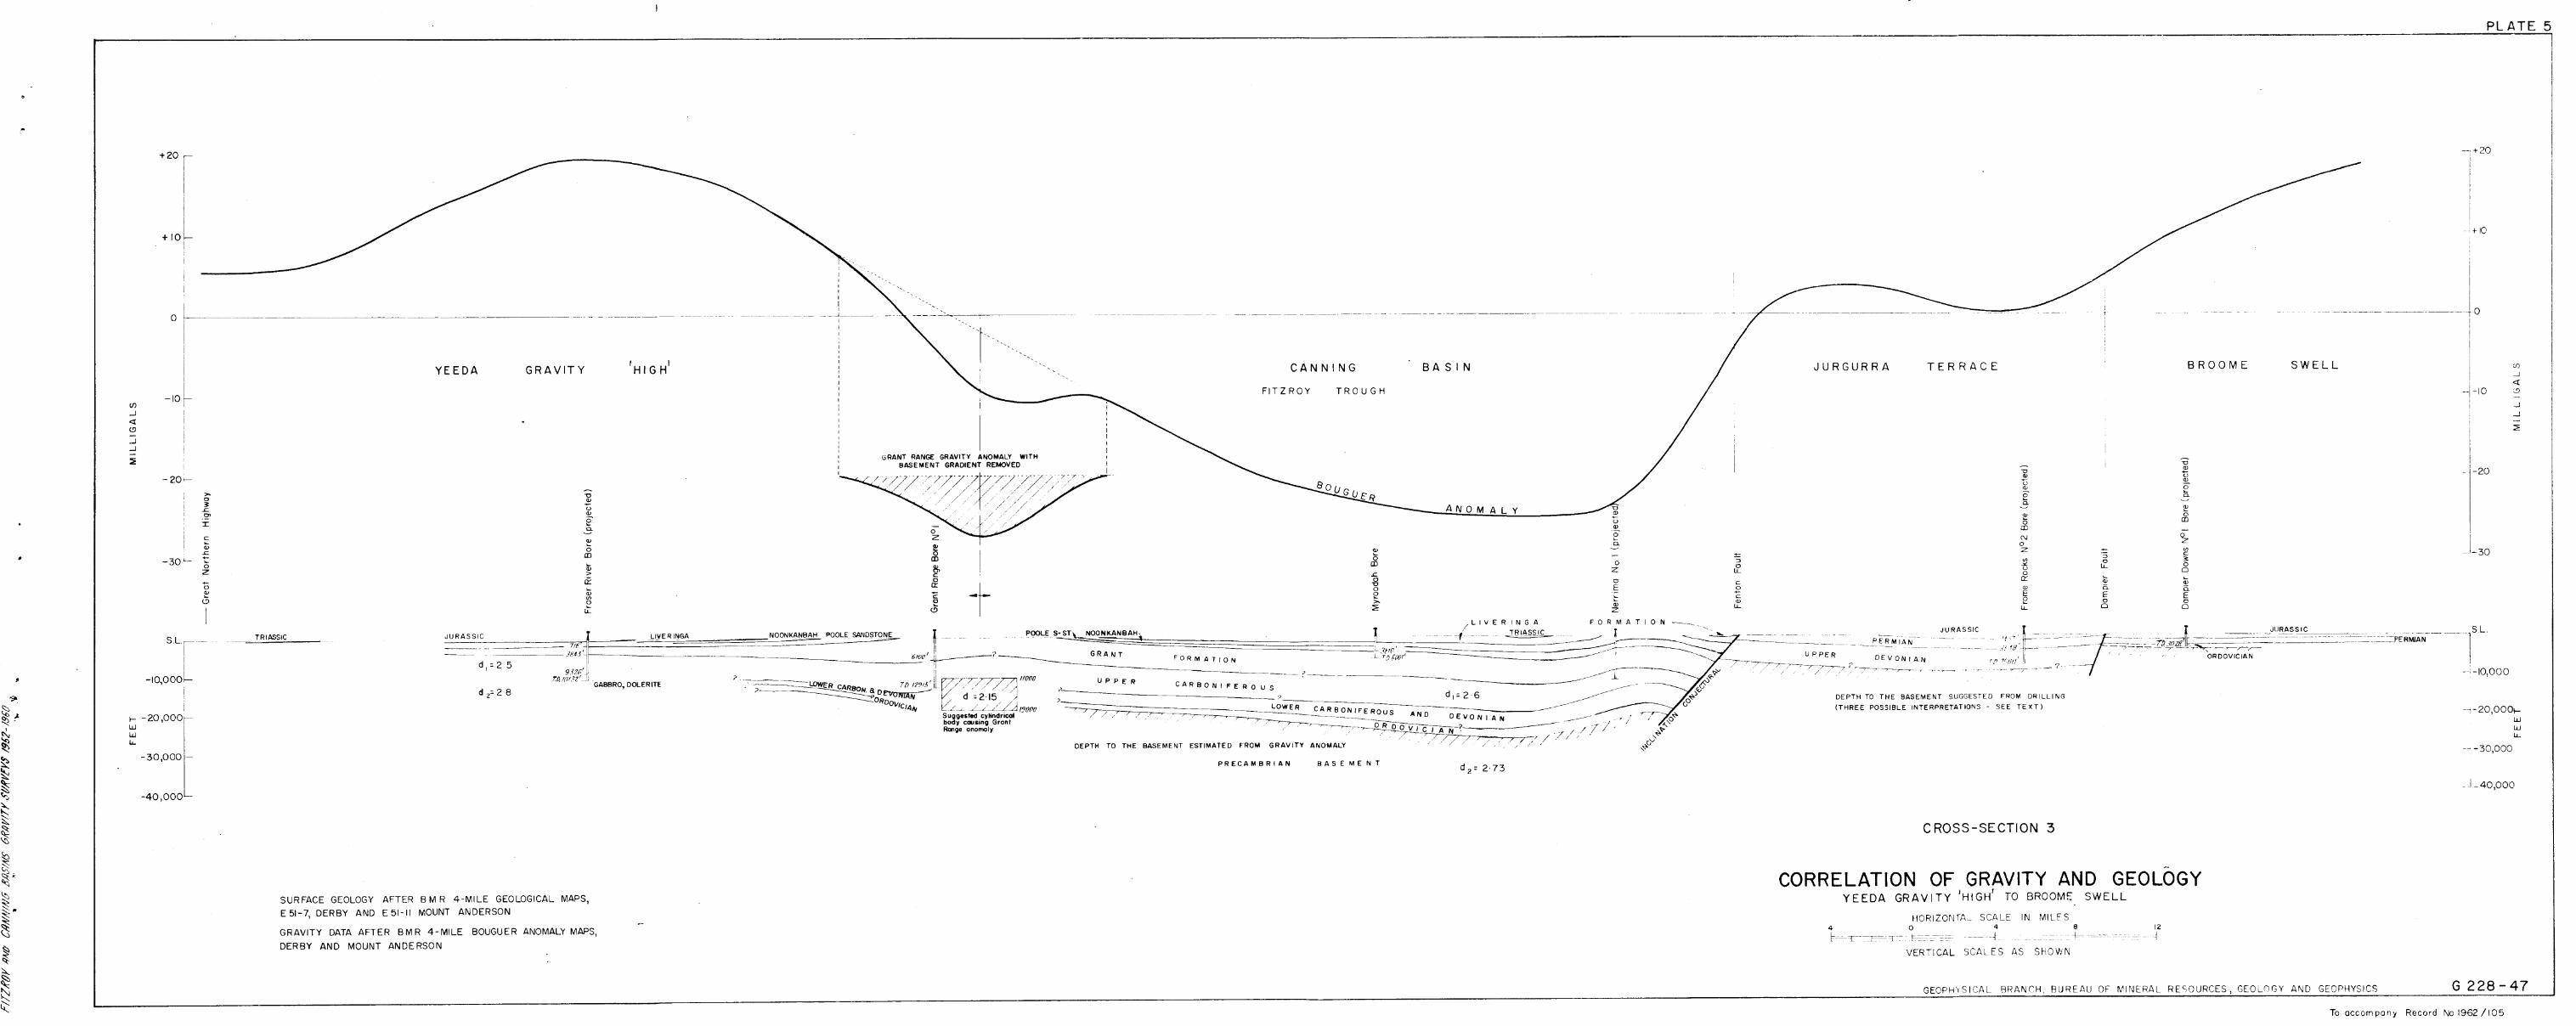
Cross-section 3 (Plate 5) .
Cross-section 3 is the first of two smaller-scale cross-sections which illustrate a few of the more detailed gravity features.The following features will be mentioned briefly:
(a) the Yeeda Gravity 'High' could represent a thinner sequenceof sediments than that in the Fitzroy Trough. However, becauseof the presence of gabbro and dolerite (Fraser River No. 1 bore),the relative gravity 'high' could partially be caused by thesedense intrusives. Unfortunately the thickness and horizontalextent of the gabbro is not known.,
- 22 -
(b) When the basement gradient is removed from the observedBouguer anomaly curve over the Grant Range Anticline, asymmetrical residual gravity 'low' is obtained (Plate 5).This residual 'low' could theoretically be produced by acylindrical body of the size and density shown on Plate 5.Therefore, on gravity evidence there is a strong suggestionthat the Grant Range Anticline is underlain by a body ofrock salt or at least of a material of the same density asrock salt.
(c) At the point where the profile crosses the Fenton Fault thereis a steep gravity gradient. Quantitative analyses of theanomaly gradient have not been done (in this Record) but thelarge gradient obviously represents the large throw of theFenton Fault. The seismic work in the area shows that thethrow of the fault at Barnes Flow is about 10,000 ft (Valeand Smith, 1959).
(d) The relatively high anomaly values south of the Fenton Faultrepresent the Broome Swell. On the drilling evidence obtainedon the Broome Ridge farther north-west (e.g. Dampier DownsNo. 1), the sedimentary sequence is Mesozoic, Permian,Ordovician, as shown on Cross-section 1 (Plate 3). Thepostulated 'low' could be caused by
a south-easterly extension of the Jurgurra Terrace,or
a relatively thicker sequence of sediments within theBroome Swell (i.e. thicker Ordovician), or
the presence of a body of less-dense material such asrock salt. It should be noted that Vale and Smith(1959) recorded a high-velocity refractor (20,000 ft/sec)at 5500 ft depth in this area and interpreted it asbeing basement. However, in an appendix to the samereport Morton raised the possibility of the presence ofsalt.
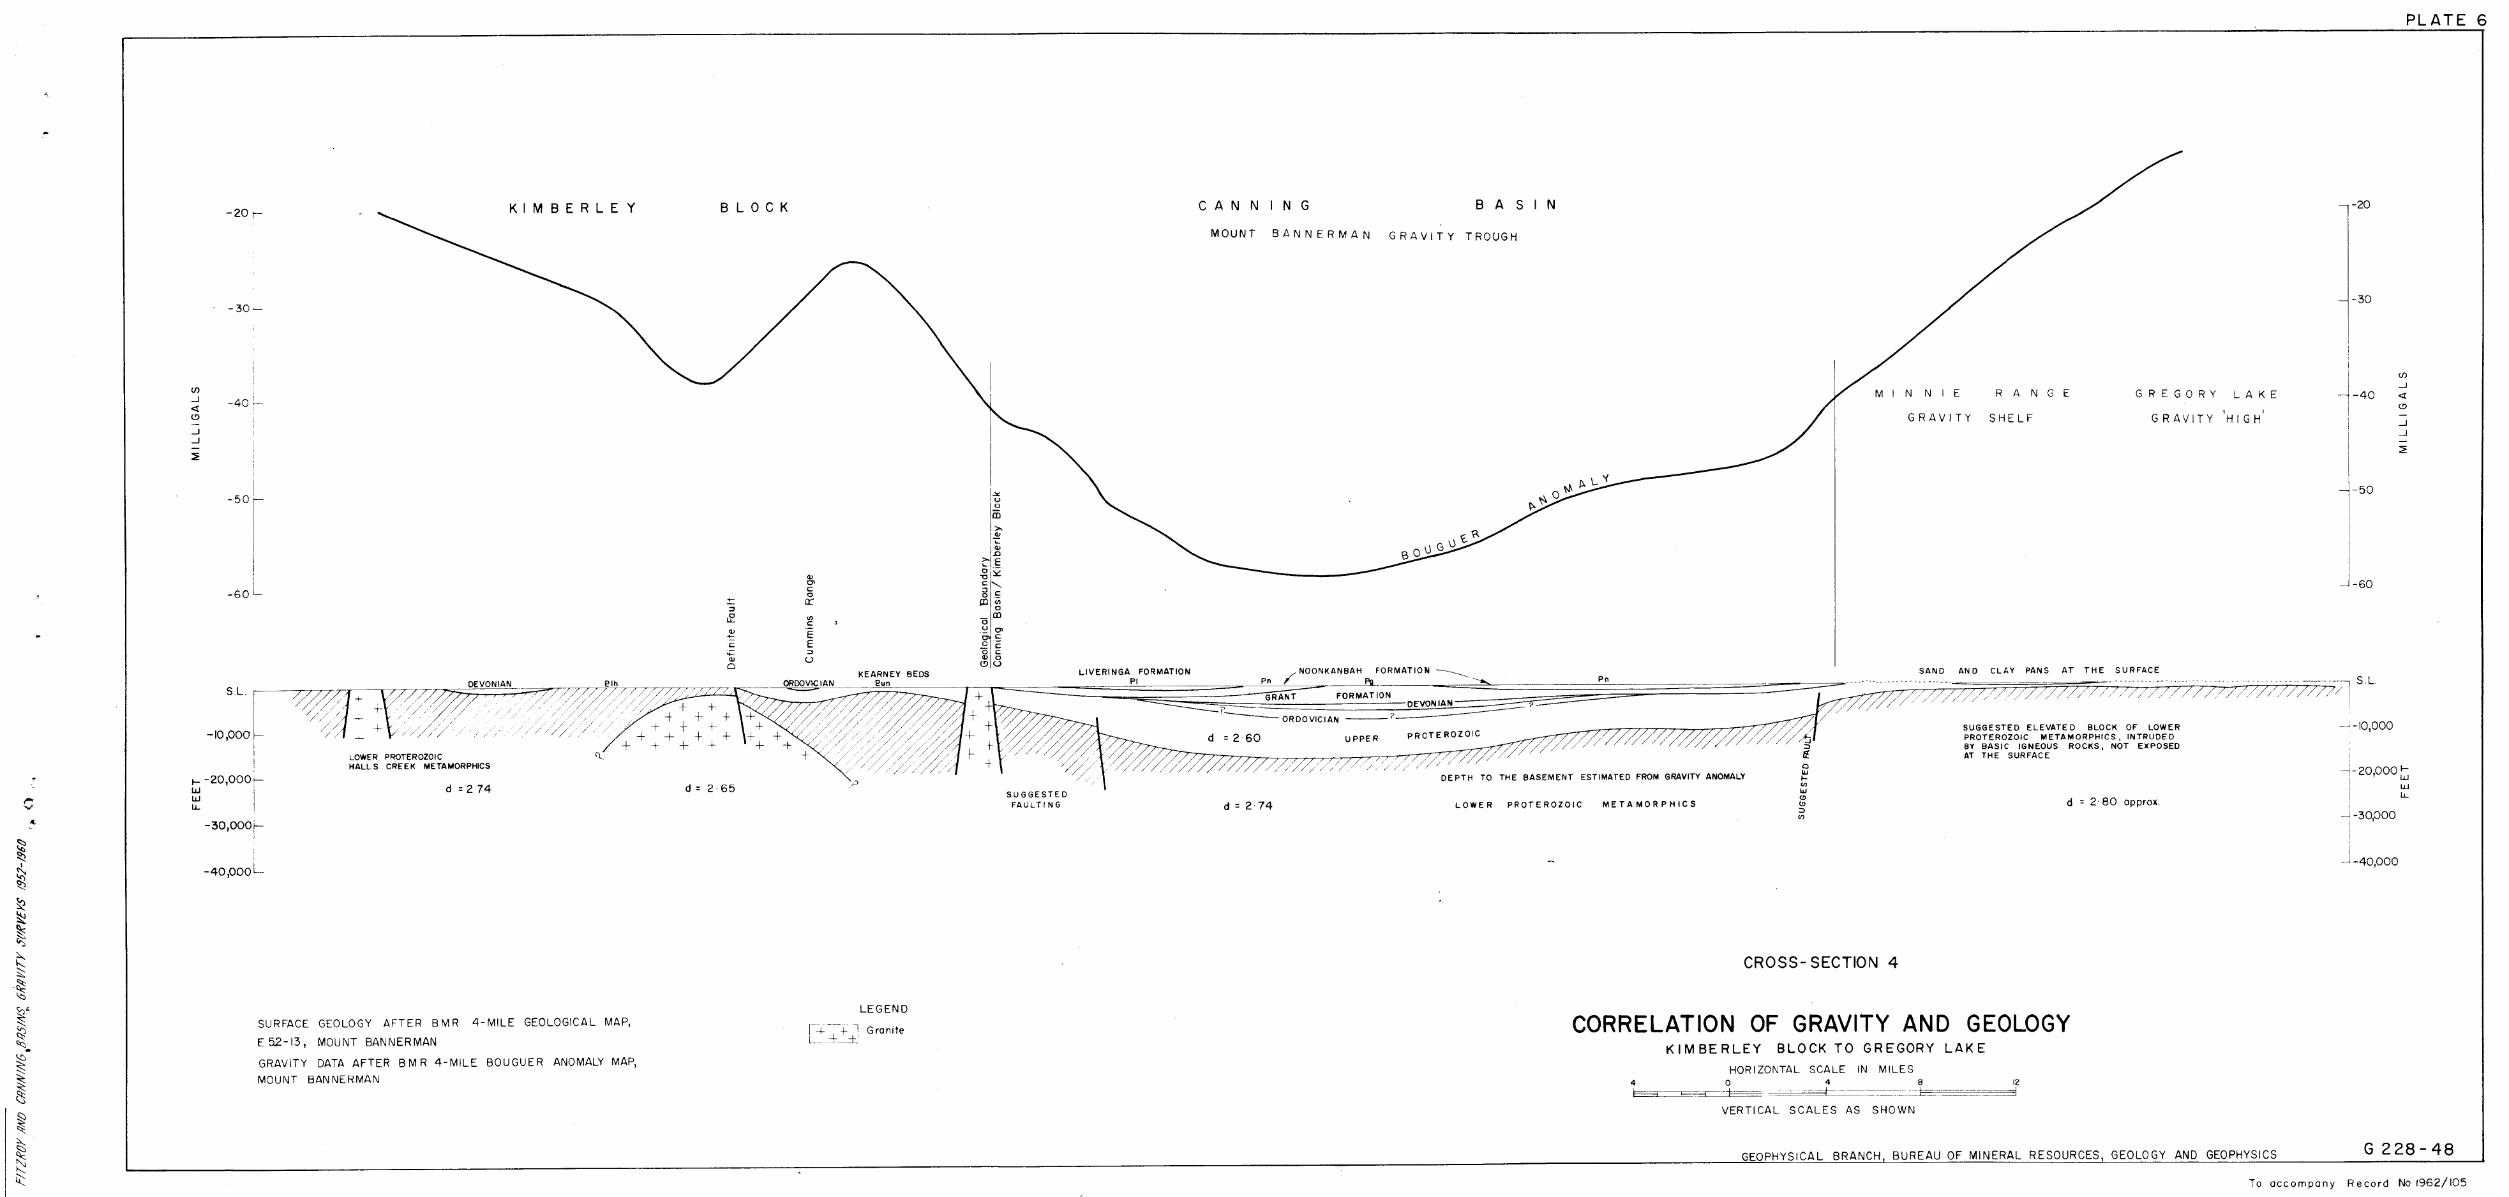
Cross-section 4 (Plate 6)
Cross-section 4 was drawn from north to south across theMount Bannerman Gravity Trough, the Minnie Range Gravity Shelf, and partof the Gregory Lake Gravity 'High'.
The Mount Bannerman Gravity Trough is postulated asrepresenting a considerable thickness of sediments. The gravity trough(feature 9) crosses the Basin boundary and appears to represent aconsiderable thickness of Upper Proterozoic sediments (see Plate 6).Both Ordovician and Devonian sediments crop out on MOUNT BANNERMAN andtherefore it is reasonable to suggest that sediments of these ages arealso present within the area representing the Mount Bannerman GravityTrough.
Since it is postulated that the major part of the gravity 'low'is caused by considerable thickness of the Upper Proterozoic sediments, then
- 23 -
it can be assumed that the Gregory Lake Gravity 'High' is due to lackof Proterozoic sediments.^It is not possible to speculate (on gravityevidence) on the sedimentary sequence within the area represented by theGregory Lake Gravity 'High'.^It is quite possible that basement isclose to the surface (i.e. 2000 to 3000 ft depth).^The relatively highanomalies could also in part be caused by basement denser than thebasement below the area represented by the Mount Bannerman Gravity Trough.
6.^CONCLUSIONS
The following general conclusions, not apparent from knowngeology, have been formedg
(a) the north-eastern(Oobagooma to Bulka Hills) and south-western(Wallal Downs to Paterson Range) edges of the Basin arecharacterised by mobile zones wherein there is a relativelythick sequence of sediments,
(b) the north-eastern part of the Canning Basin probably containsthick Proterozoic sediments. (This conclusion was firstpostulated by Veevers and Wells on geophysical evidence),
(c) the Broome Swell and the coastal part of the La GrangePlatform are the shallowest non-marginal units of the Basin,
(d) the South Canning Basin Gravity Depression probably containsthick sediments,
( 0 ) the Anketell Gravity Ridge extends over a long distance andrepresents a major subsurface feature which adjoins thesouth-western margin of the South Canning Basin GravityDepression.
Some conclusion's have also been reached on more localisedproblems.^It is considered likely that
(a) the Napier Gravity Depression contains over 10,000 ft ofsediments,
(b) the position of the Derby Ramp and theRidge coincide with gravity features 6
(c) the deepest part of the Fitzroy TroughNerrima bore 9
(d) the Fitzroy Trough is bounded along its long axis by faultand monoclinal systems (Fenton, Dampier, and Pinnacle Faultsand the Derby Ramp).^To the south-east it merges with theMount Bannerman Gravity Trough and to the north-west itsgravity expression is terminated by the Yeeda Gravity 'High',
the pattern of the Yeeda Gravity 'High' is not alignednorth-west, but is controlled by upper Carboniferouslaccolithic-type intrusions of gabbro. The maximum thicknessof sediments is 20,000 ft,
the Broome Swell is relatively shallow (3000 to 5000 ft) andextends into CORNISH area,
axis of the Oscarand 5 respectivelyo
is north-west of
( 0 )
(f )
- 24 -
between the Broome- Swell and Anna Plains the basement deepensregionally from north-east to south-west (maximum depth12,000 ft near Nita Downs Homestead),
-he Wallal Gravity Depression may contain thick sediments(12,000 ft),.
the Proterozoic sedimentation of the North-east Canning Basincould extend without interruption to the Ord Basin l
the shallowest parts of the well-explored non-marginal partsof the Basin are
on the Broome Swell, in the north-western corner ofCROSSLAND area, and
ten miles south-west of Goldwyer No. 1 (LA GRANGE area).
70 RECOMMENDATIONS
The following recommendations are made, not in directreference to economic considerations, but solely for the extension of thegeologic knowledge of the Basin%
(a) tile Napier Gravity Depression should be investigated by adetailed gravity survey (i.e. one station per square milewith sufficient control to enable the regional anomaly tobe accurately estimated).^If the presence of a thicksedimentary sequence is still indicated, seismic methodsshould be used to detect localised structures,
(b) a seismic survey in the Mount Bannerman/Cornish area shouldelucidate the problem of the distribution of the Proterozoicsediments in the North-east Canning Basin,
(c)
completion of the gravity coverage of the south-eastern endof the Lonnard Shelf.
8. REFERENCES
BRUNNSCHWEILER 9 R .0.^1954 Mesozoic stratigraphy and history ofthe Canning Desert and Fitzroy Valley,Western Australia. J. geol. Soc. Aust.1, 35-54.
a seismic survey south of Wallal No. 1 bore would resolve theproblem of the sedimentary thickness of the Wallal Depression,
some seismic investigations of the Dampier Peninsula. (e.g.continuous profiling between Fraser River No. 1 and BarleeNo. 1) would help to solve the problem of the distribution ofthe gabbro s
k14.elicopter gravity coverage of the southern part of theBasin (one station per 50 square miles),
25 -
BRUNNSCHWEILER, R.O. 1957^The geology of Dampier Peninsula,Western Australia. Bur, Min, Resour,Aust. Rep. 13.
^1.954^Recent sedimentation, physiographyand structure of the continentalshelves of Western Australia.J. Roy. Soc. W. Aust. 38 2 65-95.
^CASEY, J.N. and WELLS, A.T. 1960^The geology of the north-east CanningBasin. Bur, Min, Resour, Aust, Rec,1960/110.
CARRIGY, LA. andFAIRBRIDGE, R.F.
DAVID, T.1 .E.
EVERINGHAM, I.B.
LESLIE, R.B.
PRIDER, R.T.
GUILTY, J.W.
REEVES, F.
SMITH, E.R.
SMITH, E.R.
TEICHERT, C.
1 950^ r...F 'THE CO .L.11.01g. ,,XE,;y„Id.11. OF.iiUSTI'LALLA^Arnold, London.
1962^Poole Range gravity survey, W.A. 1953.Bur. Min, Resour, Aust, Rec, 1962/91
The geology of the Fitzroy Basin,Western Australia, Bur. Min, Resour.Aust. Bull, 36.
1961^Geology of the Gibson Desert W.A.1961, Frome-Broken Hill Pty LtdReport No, 3000-0-38,
1958^The stratigraphy of Western Australia.J. geol. Soc. Aust. 4 (2).
1959^Oil exploration in Australia.Bull. Amer. Ass, Petrol. Geol,71777-771433.
1960^The leucite lamproites of the FitzroyBasin, Western Australia. J. geol.Soc. Aust. 6 (2). 71-118.
1960^Canning Basin aeromagneticreconnaissance survey, W.A. 1954,Bur. Min. Resour, Aust, Rec. 1960/11,
1951^Australian oil possibilities.Bull. Amer. Ass. Petrol.Geol;5 (12),2479-2525.
1955^Progress report on a seismic surveyof the Poole Range - Prices Creek area,Kimberley Division, W.A. Bur. Min.Resour, Aust, Rec, 1955/35.
1960^La Grange seismic reflection survey,W.A. 1955.^Bur. Min. Resour, Aust,Rec, 1960/49.
1950^Some recent additions to stratigraphyof Western Australia, Bull, Amer.Ass. Petrol. Geol. 34 (9) 1787-1794
McWHAE, J.R.H., PLAYFORD,P.E., LINDNER, A.W.,GLENISTER, B.F. andBALME, B.E.
PL1YFORD, P.E. andJOHNSTONE, M.H.
.GUPPY, D.J., LINDNER, A.W., 1958RATTIGAN, J.H. and CASEY,J.N.
- 26 -
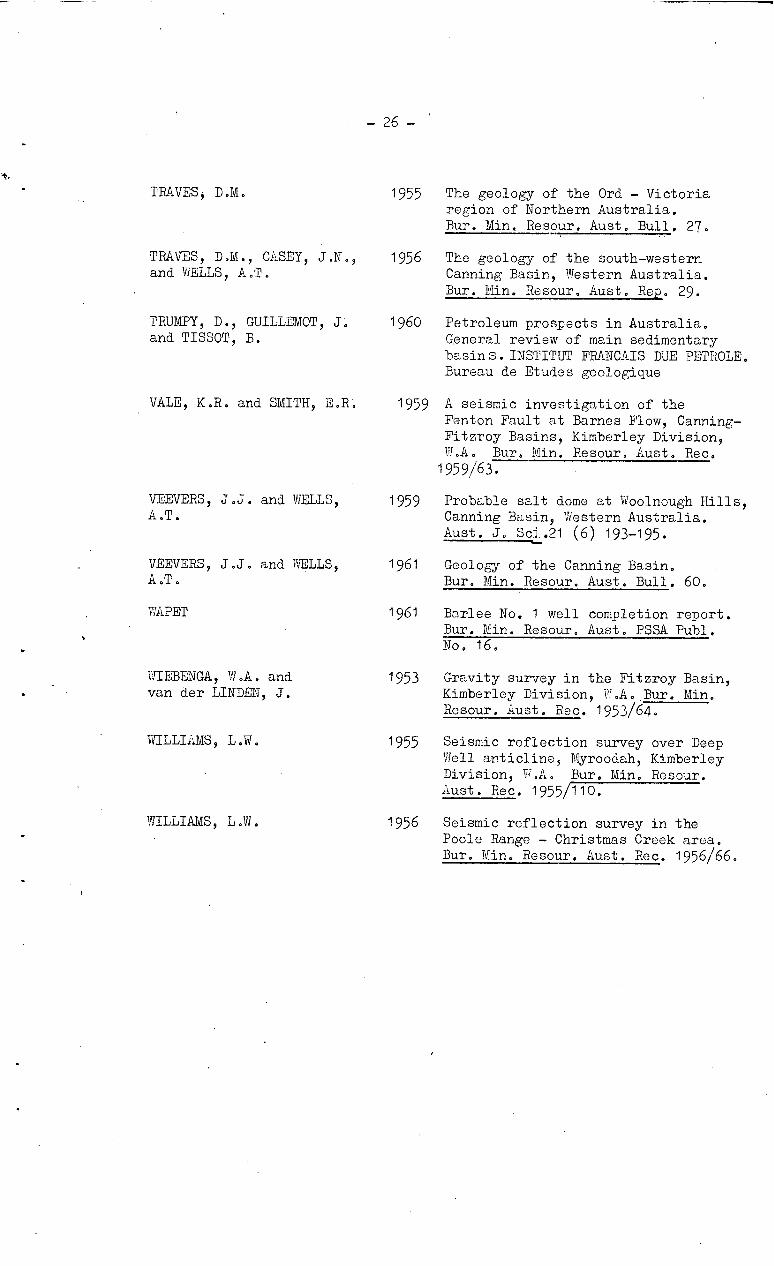
TRAVES. D.M.^ 1955 The geology of the Ord - Victoriaregion of Northern Australia.Bur, Min, Resour. Aust, Bull. 27.
TRAVES, D.M., CASEY, J.N. 9^1956 The geology of the south-westernand WELLS, A.T.^ Canning Basin, Western Australia.
Bur. Min, Resour, Aust, Rep. 29.
TRUMPY, D., GUILLEMOT, J,^1960 Petroleum prospects in Australia.and TISSOT, B.^ General review of main sedimentary
basins. INSTITUT FRANCAIS DUE PETROLE.Bureau de Etudes geologique
VALE, K.R. and SMITH, E.R'.
VEEVERS, J.J. and WELLS,A.T.
1959 A seismic investigation of theFenton Fault at Barnes Flow, Canning-Fitzroy Basins, Kimberley Division,W.A. Bur, Min, Resour, Aust, Rec,1959/63.
1959 Probable salt dome at Woolnough Hills,Canning Basin, Western Australia.Aust, J. Sci.21 (6) 193-195.
VEEVERS, J.J. and WELLS,^1961^Geology of the Canning Basin.A.T.^ Bur, Min, Resour. Aust, Bull. 60,
WAPET
WIEBENGA, W.A. andvan der LINDEN, J.
WILLIAMS, L.1111,
WILLIAMS, L.W.
1961^Barlee No. 1 well completion report.Bur. Min, Resour, Aust, PSSA Publ,No, 16.
1953 Gravity survey in the Fitzroy Basin,Kimberley Division, .A0 Bur, Min,Resour. Aust. Rec. 1953/64,
1955 Seismic reflection survey over DeepWell anticline, Myroodah, KimberleyDivision, W.A. Bur, Min, Resour.Aust. Rec, 1955/110.
1956 Seismic reflection survey in thePoole Range - Christmas Creek area.Bur. Min, Resour. Aust, Rec. 1956/66.
■
- 27 -
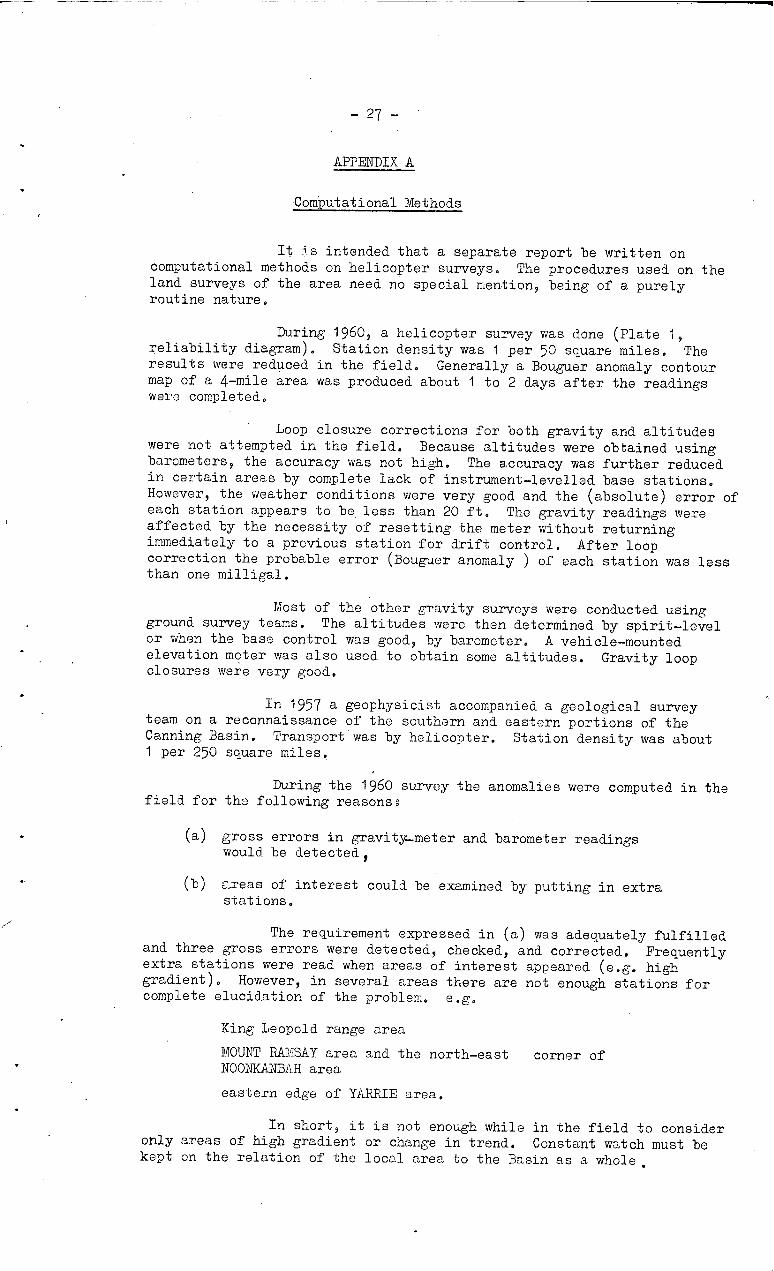
APPENDIX A
Computational Methods
It 's intended that a separate report be written oncomputational methods on helicopter surveys. The procedures used on theland surveys of the area need no special mention, being of a purelyroutine nature.
During 1960, a helicopter survey was done (Plate 1,reliability diagram). Station density was 1 per 50 square miles. Theresults were reduced in the field. Generally a Bouguer anomaly contourmap of a 4-mile area was produced about 1 to 2 days after the readingswere completed.
Loop closure corrections for both gravity and altitudeswere not attempted in the field. Because altitudes were obtained usingbarometers, the accuracy was not high. The accuracy was further reducedin certain areas by complete lack of instrument-levelled base stations.However, the weather conditions were very good and the (absolute) error ofeach station appears to be less than 20 ft. The gravity readings wereaffected by the necessity of resetting the meter without returningimmediately to a previous station for drift control. After loopcorrection the probable error (Bouguer anomaly ) of each station was lessthan one milligal.
Most of the other gravity surveys were conducted usingground survey teams. The altitudes were then determined by spirit-levelor when the base control was good, by barometer. A vehicle-mountedelevation meter was also used to obtain some altitudes. Gravity loopclosures were very good.
In 1957 a geophysicist accompanied a geological surveyteam on a reconnaissance of the southern and eastern portions of theCanning Basin. Transport was by helicopter. Station density was about1 per 250 square miles.
During the 1960 survey the anomalies were computed in thefield for the following reasonss
(a) gross errors in gravity-meter and barometer readingswould be detected,
(b) areas of interest could be examined by putting in extrastations.
The requirement expressed in (a) was adequately fulfilledand three gross errors were detected, checked, and corrected. Frequentlyextra stations were read when areas of interest appeared (e.g. highgradient). However, in several areas there are not enough stations forcomplete elucidation of the problem. e.g.
King Leopold range area
MOUNT RAMSAY area and the north-east corner ofNOONKANBAH area
eastern edge of YARRIE area.
In short, it is not enough while in the field to consideronly areas of high gradient or change in trend. Constant watch must bekept on the relation of the local area to the Basin as a whole.
- 28 -
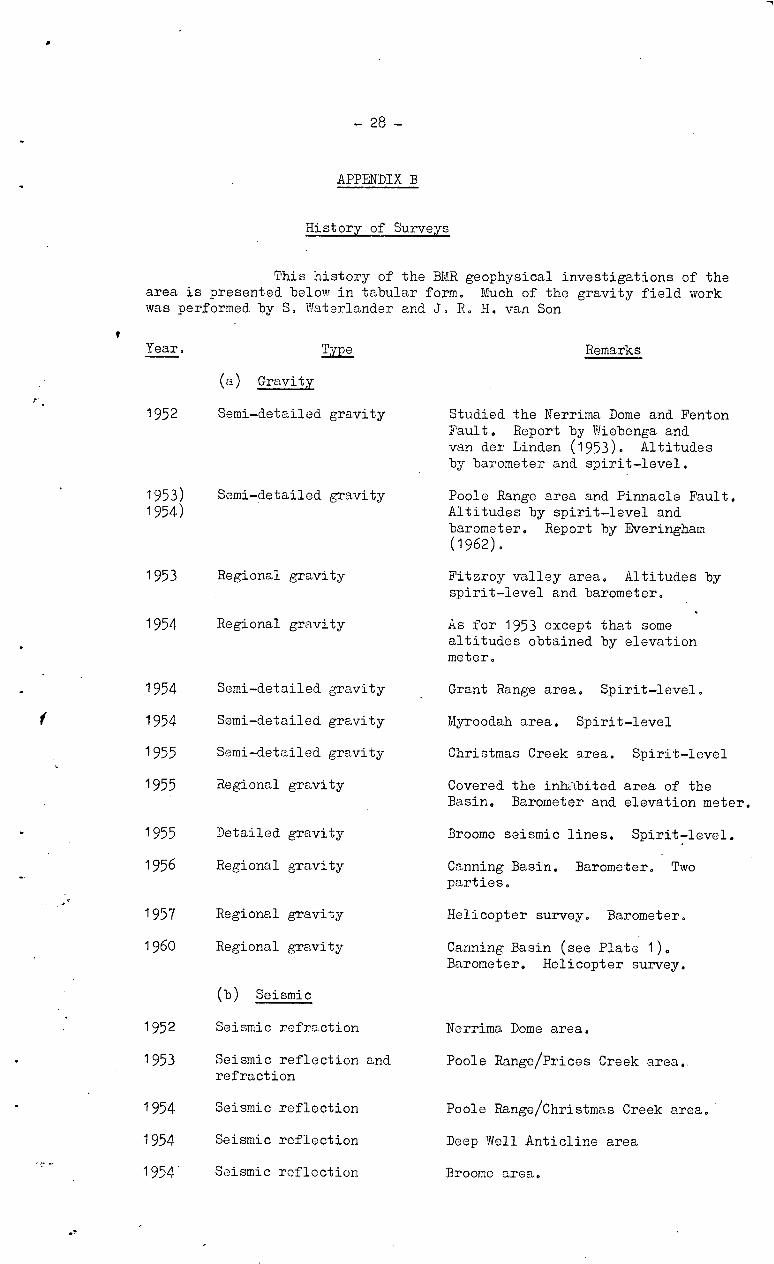
APPENDIX B
History of Surveys
This history of the BMR geophysical investigations of thearea is presented below in tabular form. Much of the gravity field workwas performed by S. Waterlander and J. R. H. van Son
Year. Type Remarks
(a) Gravity
1952 Semi-detailed gravity Studied the Nerrima Dome and FentonFault.^Report by Wiebenga andvan der Linden (1953).^Altitudesby barometer and spirit-level.
1953) Semi-detailed gravity Poole Range area and Pinnacle Fault.1954) Altitudes by spirit-level and
barometer.^Report by Everingham(1962).
1953 Regional gravity Fitzroy valley area.^Altitudes byspirit-level and barometer.
1 954 Regional gravity As for 1953 except that somealtitudes obtained by elevationmeter.
1954 Semi-detailed gravity Grant Range area.^Spirit-level.
1954 Semi-detailed gravity Myroodah area.^Spirit-level
1955 Semi-detailed gravity Christmas Creek area.^Spirit-level
1 955 Regional gravity Covered the inhabited area of theBasin.^Barometer and elevation meter.
1955 Detailed gravity Broome seismic lines.^Spirit-level.
1956 Regional gravity Canning Basin.^Barometer.^Twoparties.
1957 Regional gravity Helicopter survey.^Barometer.
1960 Regional gravity Canning Basin (see Plate 1),Barometer.^Helicopter survey.
(b) Seismic
1952 Seismic refraction Nerrima Dome area.
1953 Seismic reflection andrefraction
Poole Range/Prices Creek area..
1 954 Seismic reflection Poole Range/Christmas Creek area.
1954 Seismic reflection Deep Well Anticline area
1954 Seismic reflection Broome area.
— 2 9 —
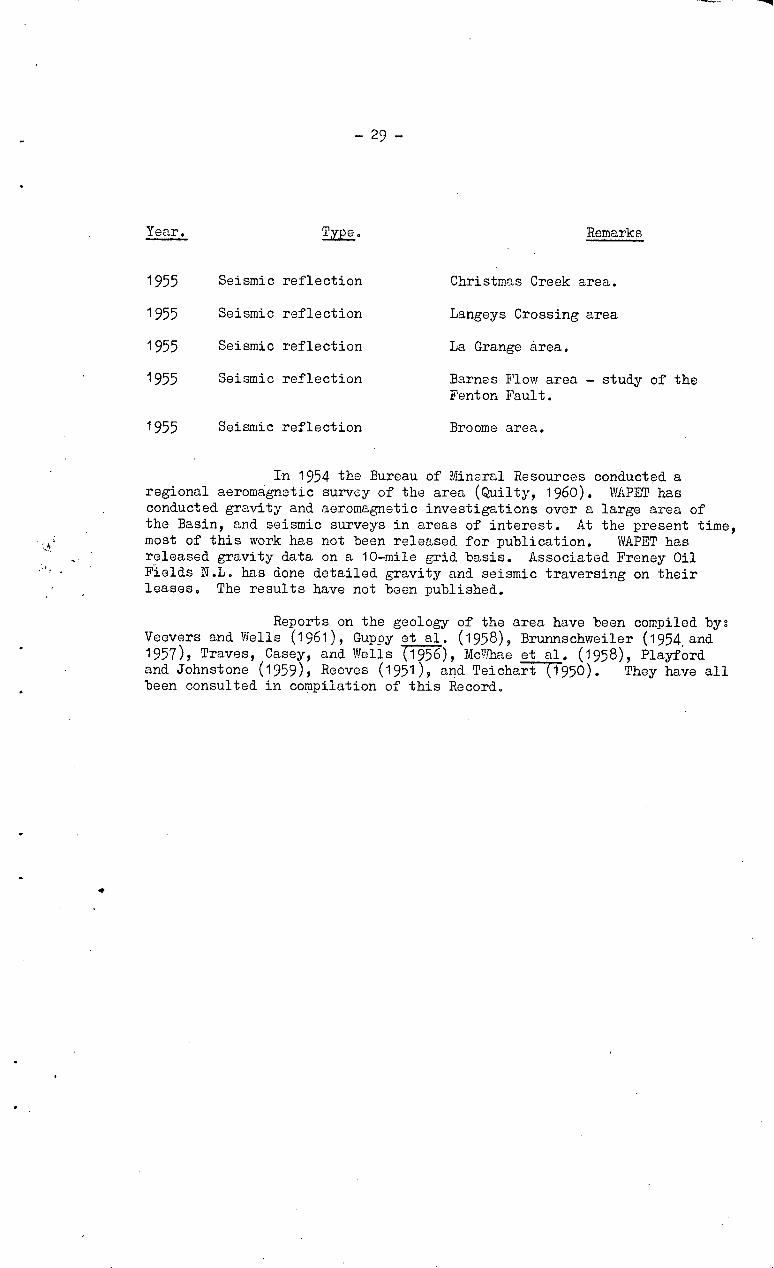
Year. Type. Remarks
1955 Seismic reflection Christmas Creek area.
1955 Seismic reflection Langeys Crossing area
1955 Seismic reflection La Grange area.
1955 Seismic reflection Barnes Flow area — study of theFenton Fault.
1955 Seismic reflection Broome area.
In 1954 the Bureau of Mineral Resources conducted aregional aeromagnetic survey of the area (Quilty, 1960). WAPET hasconducted gravity and aeromagnetic investigations over a large area ofthe Basin, and seismic surveys in areas of interest. At the present time,most of this work has not been released for publication. WAPET hasreleased gravity data on a 10—mile grid basis. Associated Freney OilFields N.L. has done detailed gravity and seismic traversing on theirleases. The results have not been published.
Reports on the geology of the area have been compiled byVeevers and Wells (1961), Guppy et al. (1958), Brunnschweiler (1954 . and1957), Traves, Casey, and Wells (157), Mehae et al. (1958), Playfordand Johnstone (1959), Reeves (1951), and TeichaTT— (1950).^They have allbeen consulted in compilation of this Record.
- 30 -
Deep
APPENDIX C•
Basin
Date
Bores in the Canning
Name Authority Depth Bottomed in(ft)
Barlee No. 1 WAPET 8101 Upper Carboniferous 1960
Dampier Downs WAPET 3028 Ordovician 1956No.^1
Fraser River WAPET 10,144 Upper Carboniferous 1955/56No.^1 (gabbro intrusion)
Frome Rocks No.1 WAPET 4003 Rock salt (ageuncertain)
1958
Frome Rocks No.2 WAPET 7500 Devonian 1959
Goldwyer No. 1 WAPET 4720 Precambrian 1958
Grant Range No.1 WAPET 12,915 Upper Carboniferous 1954/55
BMR No. 1 BMR 1680 Permian (Poole 1955(JurgUrra Ck) Sandstone)
BMR No. 2 BMR 4000 Devonian 1955/56(Laurel Downs)
Meda No, 1 WAPET 8809 Precambrian 1958
Meda No. 2 WAPET 7628 Devonian 1959
Mount Wynne No.3 Freney- 2154 Permian (Grant 1923/25Kimberley Oil Co Formation)
Myroodah No. 1 Associated 6001 Permian (Grant 1955/56Freney Oil Formation)Fields N.L.
Nerrima No, 1 Associated 9072 Upper Carboniferous 1955Freney OilFields N.L.
Poole Range Freney- 3264 Permian 1927/30No. 3 Kimberley Oil Co
Prices Creek Freney- 1008 Ordovician 1922No.^1 Kimberley Oil Co
BMR No. 3 BLR 694 Precambrian 1956(Prices Creek)
Roebuck Bay No.1 WAPE2 4000 Ordovician 1956
Samphire WAPET 6664 Precambrian 1 958Marsh No.1
Sisters No,^1 Associated 9828 Devonian 1956/57Freney Oil-Pields N.L.
67-mile bore W. Aust. Govt 3012 Precambrian 1906/10
Thangoo No, 1A VIA PET 5429 Precambrian 1959/60
BMR No. 4A BUR 2223 Precambrian 1958(Wallal)
- 31 -
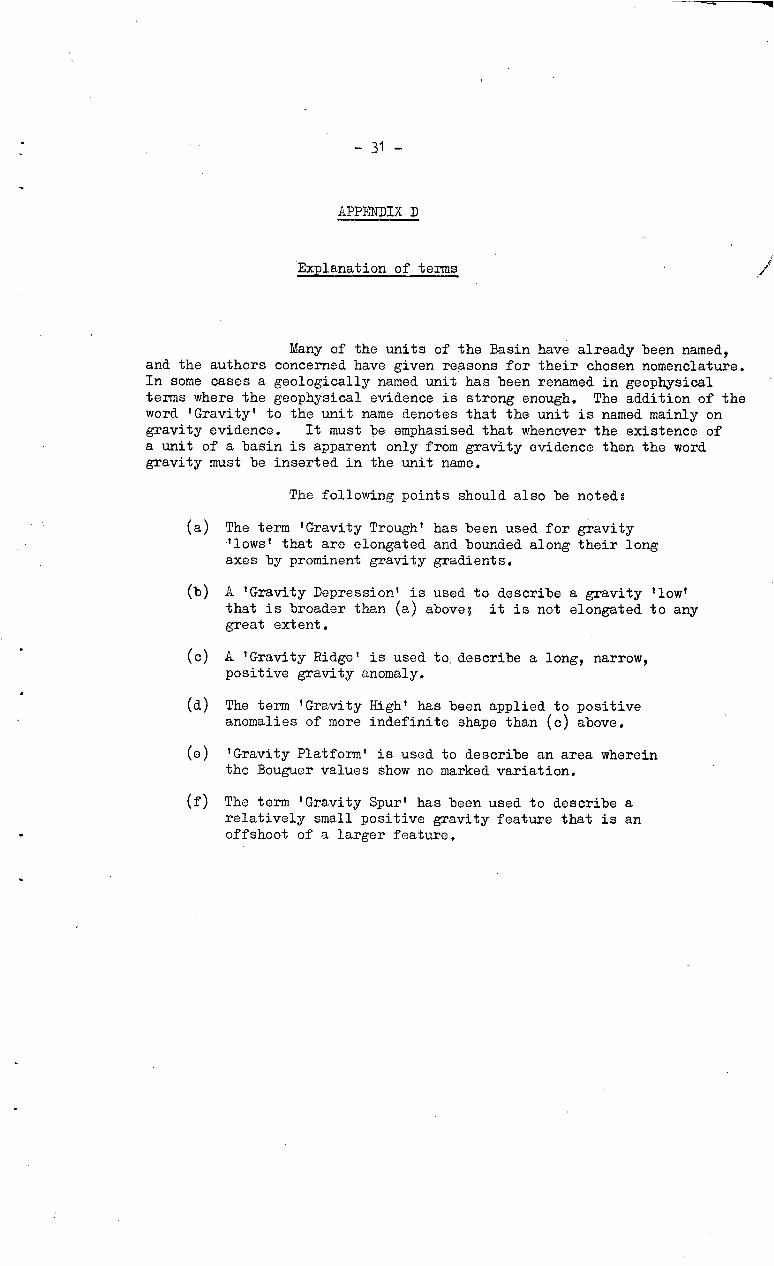
APPENDIX D
Explanation of terms
Many of the units of the Basin have already been named,and the authors concerned have given reasons for their chosen nomenclature.In some cases a geologically named unit has been renamed in geophysicalterms where the geophysical evidence is strong enough. The addition of theword 'Gravity' to the unit name denotes that the unit is named mainly ongravity evidence. It must be emphasised that whenever the existence ofa unit of a basin is apparent only from gravity evidence then the wordgravity must be inserted in the unit name.
The following points should also be noted:
(a) The term 'Gravity Trough' has been used for gravity'lows' that are elongated and bounded along their longaxes by prominent gravity gradients.
(b) A 'Gravity Depression' is used to describe a gravity 'low'that is broader than (a) above; it is not elongated to anygreat extent.
(c) A 'Gravity Ridge' is used to. describe a long, narrow,positive gravity anomaly.
(d) The term 'Gravity High' has been applied to positiveanomalies of more indefinite shape than (c) above.
(e) 'Gravity Platform' is used to describe an area whereinthe Bouguer values show no marked variation.
(f) The term 'Gravity Spur' has been used to describe arelatively small positive gravity feature that is anoffshoot of a larger feature,
0
FIG. I
MODIFIED FROM DAVID (1950)
0 The Flinders Trough
0 Amadeus Trough
0 Possible Continuation
LOWER ADELAIDEAN GEOSYNCLINE(AND POSSIBLE CONTINUATIONS)
GEOPHYSICAL BRANCH, BUREAU OF MINERAL RESOURCES,GEOLOGY AND GEOPHYSICS.^ G228-40To accompany Record No.I962/105
LL1
ORDOVICIAN
--5,000
--I0,000
--I5,000
—20,000
P(b)
P(g)
DEVON IAN
+^+^-I-+^+^+
+-r-
+^re
Nn)
P(b) PERMIAN
P(g)
ORD. ORDOVICIAN
PC^PRECAMBRIAN
HYPOT H ETICAL CROSS—SECTIONS(SECTIONS AA' AND BB' AFTER VEEVERS AND WELLS, 1961)
HORIZONTAL SCALE10,000^0^10,000^20,000 FEET
VERTICAL SCALES AS SHOWN
-+ 25
BouGuER
PERMIAN^//it
CARB. AND/OR DEVONIAN
ORDOVICIANUNCONFORMITY
+ +^+^+^+^-{-
./4/k^•SC."^J •Sv-
2 7^0 NN12 k^c',•- -- OR p.,
,:t^cl"
-0
--25
^+500-0
--5,000
--I0,000
— 15,000
-20,000
A^ Al
Ptn) +500- OOR D.
+500
Cl
GEOPHYSICAL BRANCH, BUREAU OF MINERAL RESOURCES, GEOLOGY AND GEOPHYSICS G 228-42
LL1Li
FIG. 3
To accompany Record No.I962/105
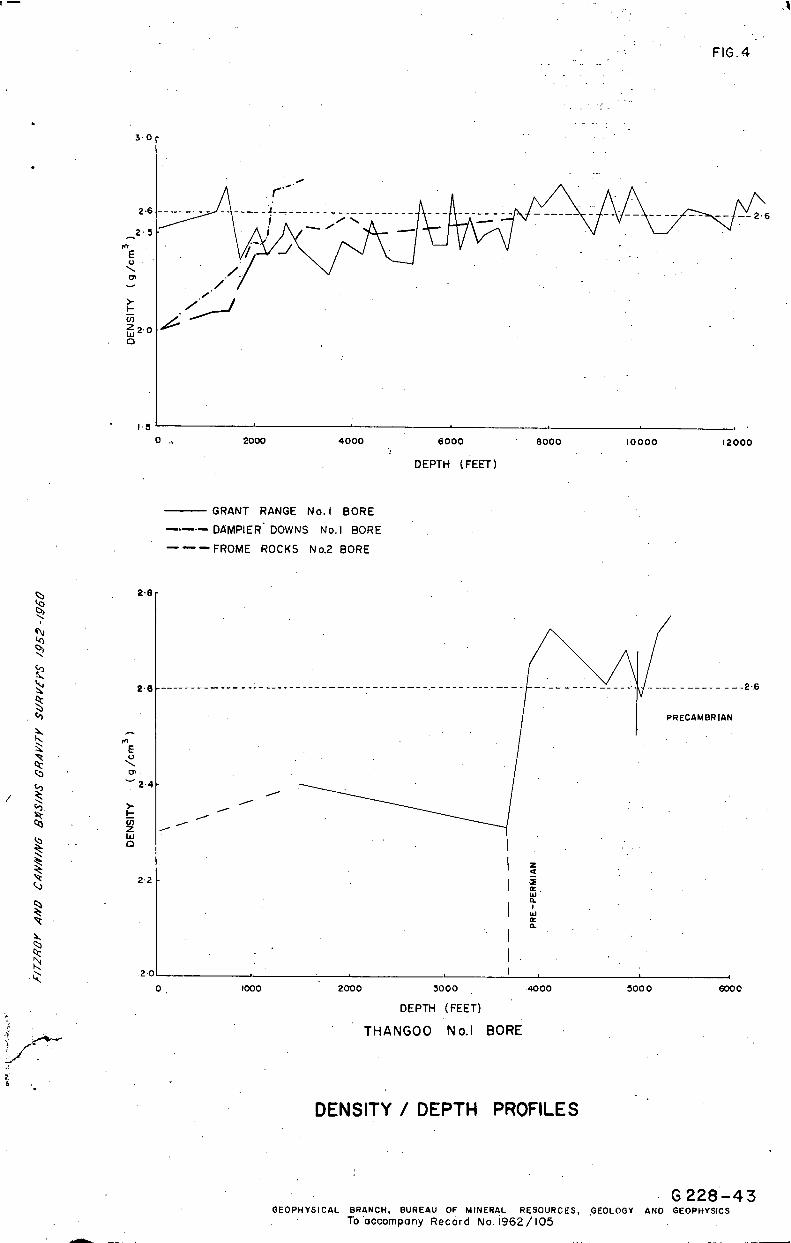
a
cc .Uia.
Ucca.
FIG.4
3. 0 -
Zui 2.0
0
1.50 .,^2000^4000^6000^8000^10000^12000
DEPTH (FEET)
^ GRANT RANGE No. I BORE
DAMPIER . DOWNS No.1 BORE
— — FROME ROCKS No.2 BORE
0^ 1000^ 2000^3000
DEPTH (FEET)
THANGOO No.I BORE
4000 5000^6000
DENSITY / DEPTH PROFILES
G 228 -43GEOPHYSICAL BRANCH, BUREAU OF MINERAL RESOURCES, GEOLOGY AND GEOPHYSICS
To 'accompany Record No.I962 /105
2.8
2.8
cn2.4
2.2
2.0
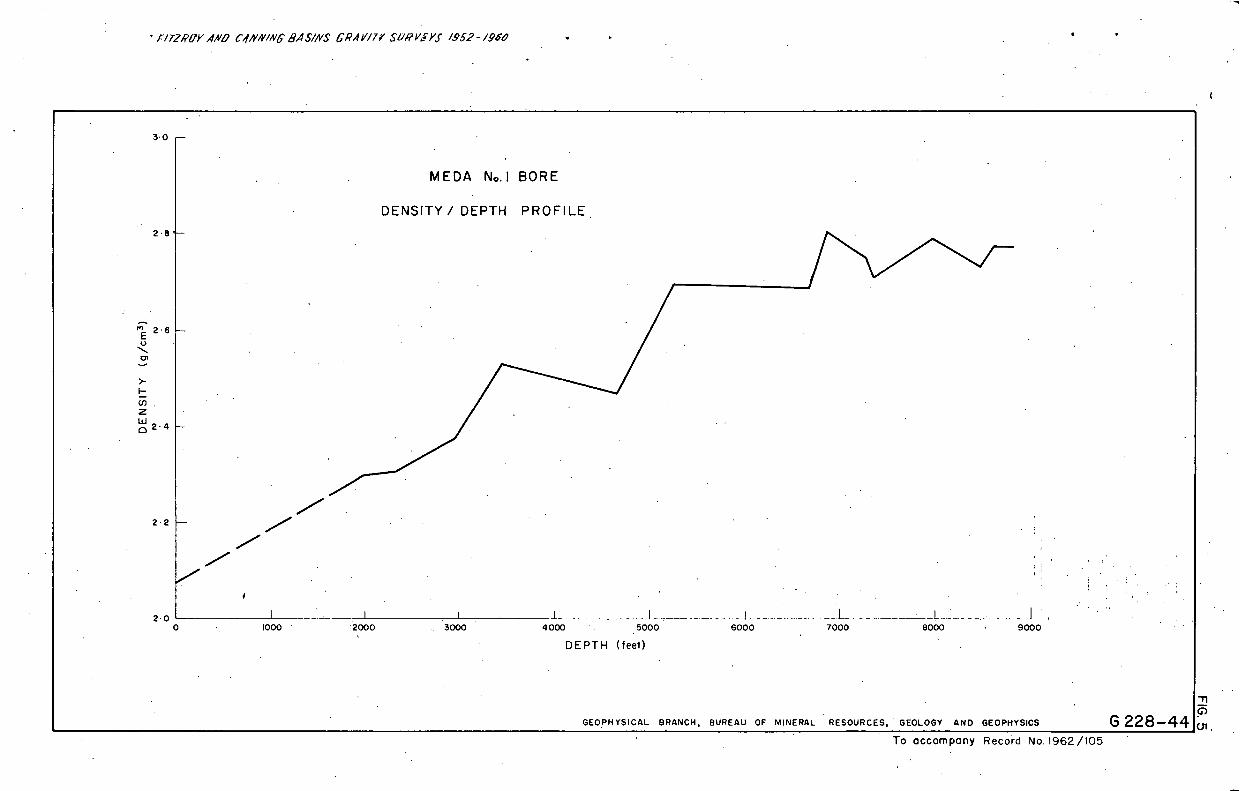
•F/TZROY AND C4N4'/N6' BAS//YS GRAY/TV SI/RI/SYS /952- 494"0
C11
To accompany Record No. 1962/105
I2.0 ^
G 228-44
0^ 000 2000^3000^4000^5000^6000^7000^8000^90001
DEPTH (feet)
GEOPHYSICAL BRANCH, BUREAU OF MINERAL RESOURCES, GEOLOGY AND GEOPHYSICS
3.0
MEDA No.I BORE
DENSITY! DEPTH PROFILE2.8
r7)-- 26
2.2