Embed Size (px)
Citation preview
Iowa’s Dairy Industry — 1
Value Added Agriculture Program
Iowa’s DairyIndustryAn Economic Review
February 2012
2 — Iowa’s Dairy Industry
Table of Contents
Executive Summary ......................................................................................................................3
Industry Situation and Outlook ..................................................................................................4
Industry Size and Location .............................................................................................4
Prices and Profi ts ..............................................................................................................5
Competitiveness of the Iowa Dairy Industry .............................................................................6
Water Advantages .............................................................................................................6
Feedstuff s Advantages ......................................................................................................7
Manuare Advantages .......................................................................................................8
Regional Processing Advantages ....................................................................................9
Infrastructure Advantages .............................................................................................10
Economic Impacts .......................................................................................................................13
Economic Importance of the Dairy Industry in Iowa ...............................................15
Impact on Dairy Processing Employment ..................................................................16
Iowa’s Dairy Industry — 3
Executive Summary
Th is report shows the Iowa dairy industry is already a strong economic driver in Iowa and the Midwest. What is the trend in demand for dairy products? Up. And dairy businesses are responding. Iowa among all Midwest states is the only one to grow for two decades and counting; and it is poised for continual growth.
Why Iowa? Iowa has tremendous water resources, people resources, feed resources, trans-portation infrastructure, dairy heritage and consistent top markets; describing a place with competitive advantage in all the main categories. Iowa is a place with always com-petitive costs and high prices for milk as shown in the graphs within this report. Iowa has all the comparative advantages which drive naturally to competitive business advantages for dairy industry stakeholders operating here.
Dairy cows and the economic activity that they generate in the local economy have always and continue to be one of the most robust economic stimuli that exist. Th e most recent IMPLAN model (2011) quantifi es that fact with the following statistics.
• $23,445 is the total economic impact per cow through direct/indirect and induced commerce.
• Each cow generates the equivalent of .1 full time job created throughout the entire dairy and processing sectors.
• Over 22,000 jobs are supported by the activities directly, indirectly and induced by a strong dairy presence.
4 — Iowa’s Dairy Industry
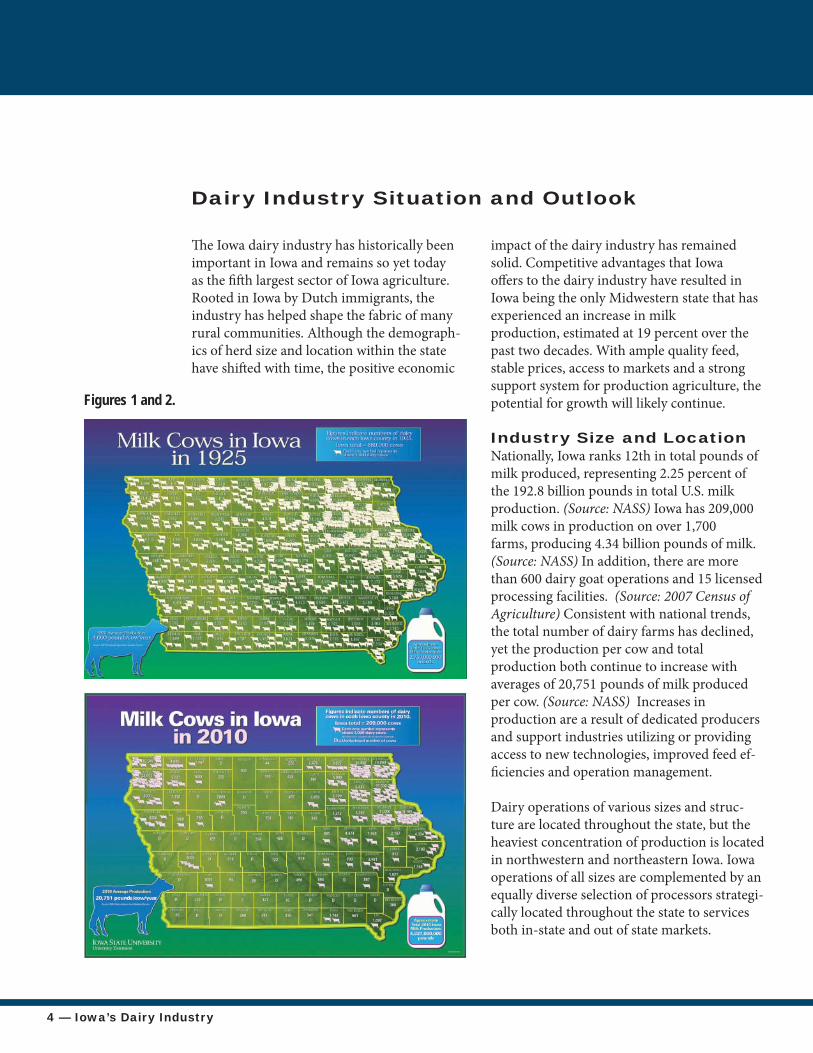
Th e Iowa dairy industry has historically been important in Iowa and remains so yet today as the fi ft h largest sector of Iowa agriculture. Rooted in Iowa by Dutch immigrants, the industry has helped shape the fabric of many rural communities. Although the demograph-ics of herd size and location within the state have shift ed with time, the positive economic
impact of the dairy industry has remained solid. Competitive advantages that Iowa off ers to the dairy industry have resulted in Iowa being the only Midwestern state that has experienced an increase in milk production, estimated at 19 percent over the past two decades. With ample quality feed, stable prices, access to markets and a strong support system for production agriculture, the potential for growth will likely continue.
Industry Size and LocationNationally, Iowa ranks 12th in total pounds of milk produced, representing 2.25 percent of the 192.8 billion pounds in total U.S. milk production. (Source: NASS) Iowa has 209,000 milk cows in production on over 1,700 farms, producing 4.34 billion pounds of milk. (Source: NASS) In addition, there are more than 600 dairy goat operations and 15 licensed processing facilities. (Source: 2007 Census of Agriculture) Consistent with national trends, the total number of dairy farms has declined, yet the production per cow and total production both continue to increase with averages of 20,751 pounds of milk produced per cow. (Source: NASS) Increases in production are a result of dedicated producers and support industries utilizing or providing access to new technologies, improved feed ef-fi ciencies and operation management.
Dairy operations of various sizes and struc-ture are located throughout the state, but the heaviest concentration of production is located in northwestern and northeastern Iowa. Iowa operations of all sizes are complemented by an equally diverse selection of processors strategi-cally located throughout the state to services both in-state and out of state markets.
Dairy Industry Situation and Outlook
Figures 1 and 2.
Iowa’s Dairy Industry — 5
Iowa’s processing capabilities rank it among the top 10 states in fl uid milk bottling (9th), total dairy products processed (8th), cheese production (7th), cottage cheese produc-tion (6th), American cheese production (6th) and ice cream production (4th). Iowa has 11 milk bottling plants processing fl uid milk, ten processing dry milk products, 11 processing cheese and seven processing ice cream. Iowa has more than 12 receiving and transfer sta-tions to facilitate sales and transportation of milk. (Source: Iowa State Dairy Association) Th is highly diverse production and processing model helps create stable and attractive re-gional price trends, provides opportunities for growth, and places Iowa in a strong position to meet changes in national and international consumption trends.
Nationally, fl uid milk consumption has de-clined since 1975, but cheese consumption has increased more than 100 percent, creating an overall increase in consumption of milk products from 539 pounds per person to 616 pounds per person in 2010. (Source: Mar-keting Service Bulletin, Federal Milk Market Administrator, USDA) American per capita cheese consumption was 33.3 pounds in 2010. (Source: Wisconsin Milk Marketing Board) Yogurt and cream products also posted signifi -cant per capita consumption gains during this time frame. Americans eat an average of 13.5 pounds of yogurt per person every year, more than double the 6.5 pounds per person Ameri-cans consumed just ten years ago. (Source: Wisconsin Milk Marketing Board)
Another important factor driving milk pro-duction is demand for whey, the fl uid co-product of cheese production. Exported whey products provide high quality protein to coun-tries where milk and meat are less available. Recently, domestic demand for whey proteins has risen with their use in weight management
diets, also known as functional beverages. Th e market for functional beverages grew by more than 30 percent over the past fi ve years, according to a Mintel report. (Source: Whey Protein Sees Demand from Functional Drinks, www.Nutraingredients-usa.com) Whey is also an appropriate protein source for gluten-free diets and lacto-vegetarian diets.
Prices and Profi tsIn 2010, the national fl uid grade milk price was $16.28/cwt. During the same period in Iowa, the average price was $16.55/cwt. (Source: NASS)
Iowa is part of the Central and Upper Midwest Federal Milk Marketing Orders, a program that helps stabilize market conditions. Th e Market Order benefi ts producers and con-sumers alike by establishing and maintaining consistent market conditions and assuring consumers of adequate supplies of pure and wholesome milk at all times.
Iowa’s milk has consistently ranked highly in the Central order in terms of somatic cell counts, a measure of milk quality and udder health. Low somatic cell counts mean better quality. Th e quality of milk from all states has improved; Iowa’s milk continues to be the best. Iowa’s dairy farms come in all shapes and sizes. Nearly all of them are family-owned and herd sizes range from 10 cows to 6,000 cows. Systems include pasture, intensive grazing, and conventional barns that incorporate tie stalls, free stalls and compost barns. Milking parlors may be low-cost conventional styles or state-of-the-art robotic systems. In Iowa, there is opportunity for dairy herdsmen to develop the style that works best for them.
6 — Iowa’s Dairy Industry
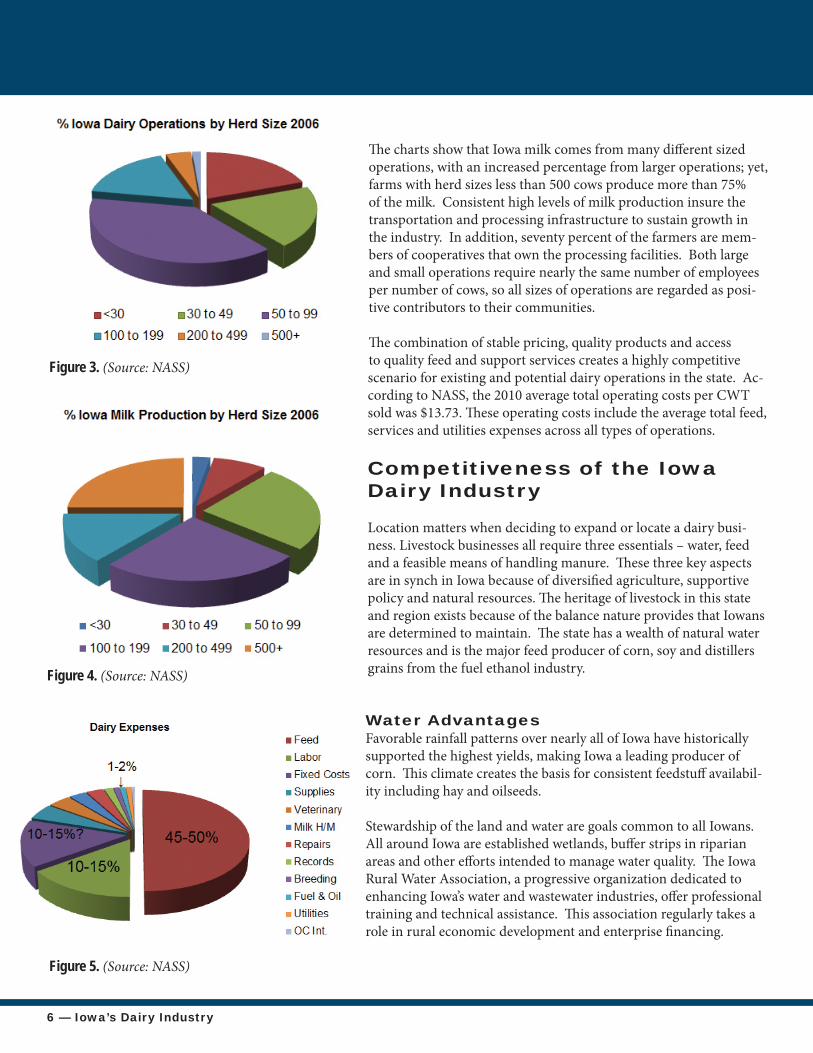
Th e charts show that Iowa milk comes from many diff erent sized operations, with an increased percentage from larger operations; yet, farms with herd sizes less than 500 cows produce more than 75% of the milk. Consistent high levels of milk production insure the transportation and processing infrastructure to sustain growth in the industry. In addition, seventy percent of the farmers are mem-bers of cooperatives that own the processing facilities. Both large and small operations require nearly the same number of employees per number of cows, so all sizes of operations are regarded as posi-tive contributors to their communities.
Th e combination of stable pricing, quality products and access to quality feed and support services creates a highly competitive scenario for existing and potential dairy operations in the state. Ac-cording to NASS, the 2010 average total operating costs per CWT sold was $13.73. Th ese operating costs include the average total feed, services and utilities expenses across all types of operations.
Competitiveness of the Iowa Dairy Industry
Location matters when deciding to expand or locate a dairy busi-ness. Livestock businesses all require three essentials – water, feed and a feasible means of handling manure. Th ese three key aspects are in synch in Iowa because of diversifi ed agriculture, supportive policy and natural resources. Th e heritage of livestock in this state and region exists because of the balance nature provides that Iowans are determined to maintain. Th e state has a wealth of natural water resources and is the major feed producer of corn, soy and distillers grains from the fuel ethanol industry.
Water AdvantagesFavorable rainfall patterns over nearly all of Iowa have historically supported the highest yields, making Iowa a leading producer of corn. Th is climate creates the basis for consistent feedstuff availabil-ity including hay and oilseeds.
Stewardship of the land and water are goals common to all Iowans. All around Iowa are established wetlands, buff er strips in riparian areas and other eff orts intended to manage water quality. Th e Iowa Rural Water Association, a progressive organization dedicated to enhancing Iowa’s water and wastewater industries, off er professional training and technical assistance. Th is association regularly takes a role in rural economic development and enterprise fi nancing.
Figure 5. (Source: NASS)
Figure 3. (Source: NASS)
Figure 4. (Source: NASS)
Iowa’s Dairy Industry — 7
Iowa is served by a very modern, compre-hensive rural water system of “processed” treated water. Water quality regulation has been consistently strengthened at a state level over the past 20 years as livestock production restructured and environmental goals became a public focus. Th e U.S. Geological Surveys (USGS), in cooperation with the Iowa Depart-ment of Natural Resources (DNR), collects and compiles water-level data from a statewide network of about 150 observation wells. Th is policy approach to resource conservation requires environmental stewardship from all livestock operations. Th e guidance applied by Iowa regulatory agencies has been developed and strengthened with strong, continuous involvement from state commodity organiza-tions and general farm organizations working hand in glove for the best outcomes.
Feedstuff AdvantagesTh e Iowa land resource was leveled by glaciers and built over eons of tall grass prairie, and now supports the strongest and most intense crop production in the world. Iowans are historically early adopters of technology. So, even as the state has seen huge growth in pork, poultry, dairy and biofuels, feedstuff produc-tion has been in excess of local demand. Vary-ing geography allows for abundant production
of hay and haylage, pasture, intensive grazing, corn and soybeans.
Iowa is the U.S. center of corn ethanol produc-tion with 35 dry-grind plants and six wet mills, producing approximately 3.6 billion gallons of ethanol and over 11 million tons of distill-ers grains and other feed co-products in 2011 (Source: Iowa Renewable Fuels Association). Research, experience and new technology in distillers grains production has allowed the industry to provide products that are uniform in nutrient content and quality, and can be adapted to specifi c markets.
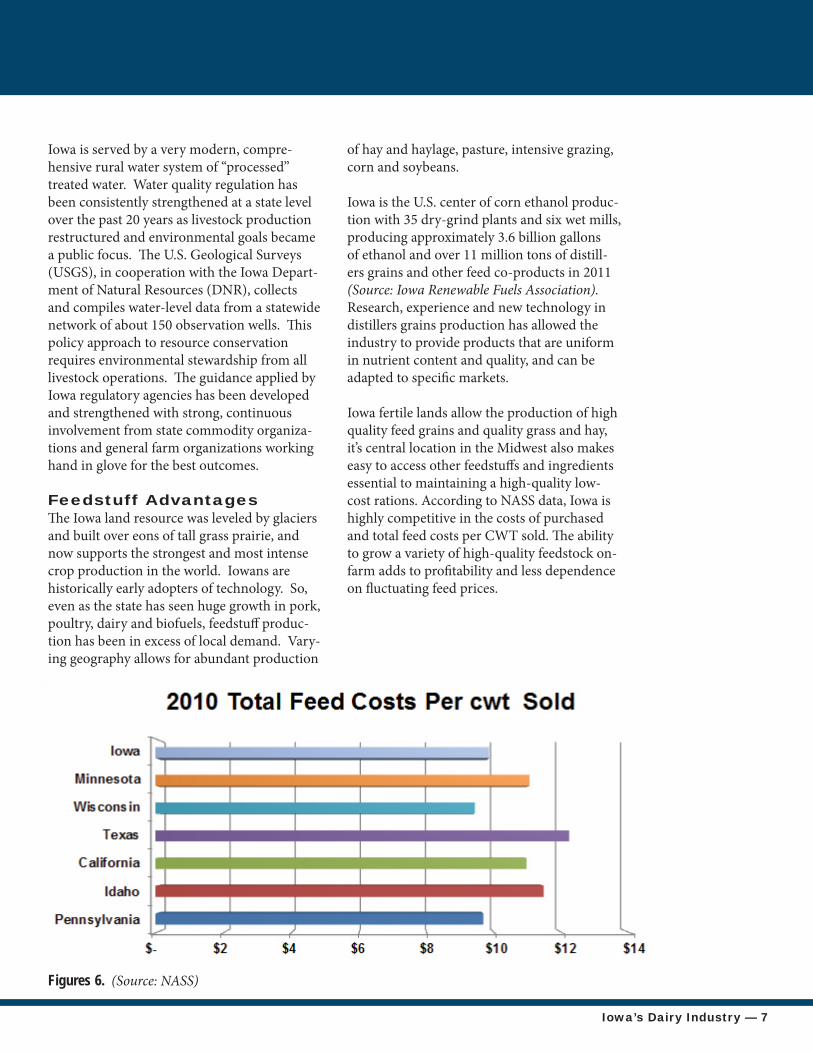
Iowa fertile lands allow the production of high quality feed grains and quality grass and hay, it’s central location in the Midwest also makes easy to access other feedstuff s and ingredients essential to maintaining a high-quality low-cost rations. According to NASS data, Iowa is highly competitive in the costs of purchased and total feed costs per CWT sold. Th e ability to grow a variety of high-quality feedstock on-farm adds to profi tability and less dependence on fl uctuating feed prices.
Figures 6. (Source: NASS)
8 — Iowa’s Dairy Industry
Manure AdvantagesIn Iowa, the annual grain production requires replenishment of fertility to the soil. Deep soils and high yields are a perfect solution for recovering value from manure. Technolo-gies for better spreading and more effi cient handling are applied everywhere in Iowa. Th e livestock industry is so immense in the state that technology providers and service pro-viders abound. Iowa State University off ers research-based information.
Studies show that Iowa has more than enough land and more than enough fertilization need to handle growth in the livestock sector. While many areas of the country cannot handle such growth due to the manure, Iowa has systems in place to utilize waste.
It has been established for decades that fed cattle fi nished in feed lots produce approxi-mately one dry ton of collectible manure per animal. (Source: An Economic Analysis of Waste Management for Texas Cattle Feedlots: An analysis of System Alternative and Policy Implications, Glover, 1994, http://esr.lib.ttu.edu/handle/2346/1832) Th is equals about two dry tons of collectible manure per year per
head of feedlot capacity. Given the amount of cropland in Midwest crop production, there is a constant high demand for manure. Land ap-plication of cattle and dairy manure has been determined to be an optimal approach to waste management. Manure application leads to lower supplemental nitrogen requirements for corn production. Th e demand for manure and commercial fertilizer increases in areas with high availability, these factors synergistically resulting in increased corn production, which, in turn, increases demand for both manure and commercial fertilizer.
Dairy manure values, according to Iowa State University specialists, are such that a corn producer can easily have more than enough fertility brought onto his farm to fully fertilize the following year’s corn crop and more. Th is means a dairy producer could contract with a farmer for his corn crop as silage. Th e farmer can save nearly $40 per acre in harvest and handling costs since the dairy operation would pay for harvest of silage. If the contract barters the manure value for the corn stalk removal, the farmer will actually see his fertility increase over time. Th is is a highly signifi cant “win-win” that is being done. Th is means the dairy operation can focus its capital on the milk en-terprise while fi nding feed plus land resources to utilize manure value.
To put manure value in perspective, look at these values. Assuming Nitrogen at $.60 per unit; Phosphorus at $.60 per unit and Potas-sium at $.50 per unit and assuming a 15 ton application rate the total value delivered to the fi eld is $108 N + $54 P + $90 K = $252 of com-mercial fertilizer value. Th is does not account for signifi cant sulfur, magnesium and organic matter which also bring value.
With higher yields and increased corn produc-tion in Iowa, the value and marketing opportu-nities are here.
Iowa’s Dairy Industry — 9
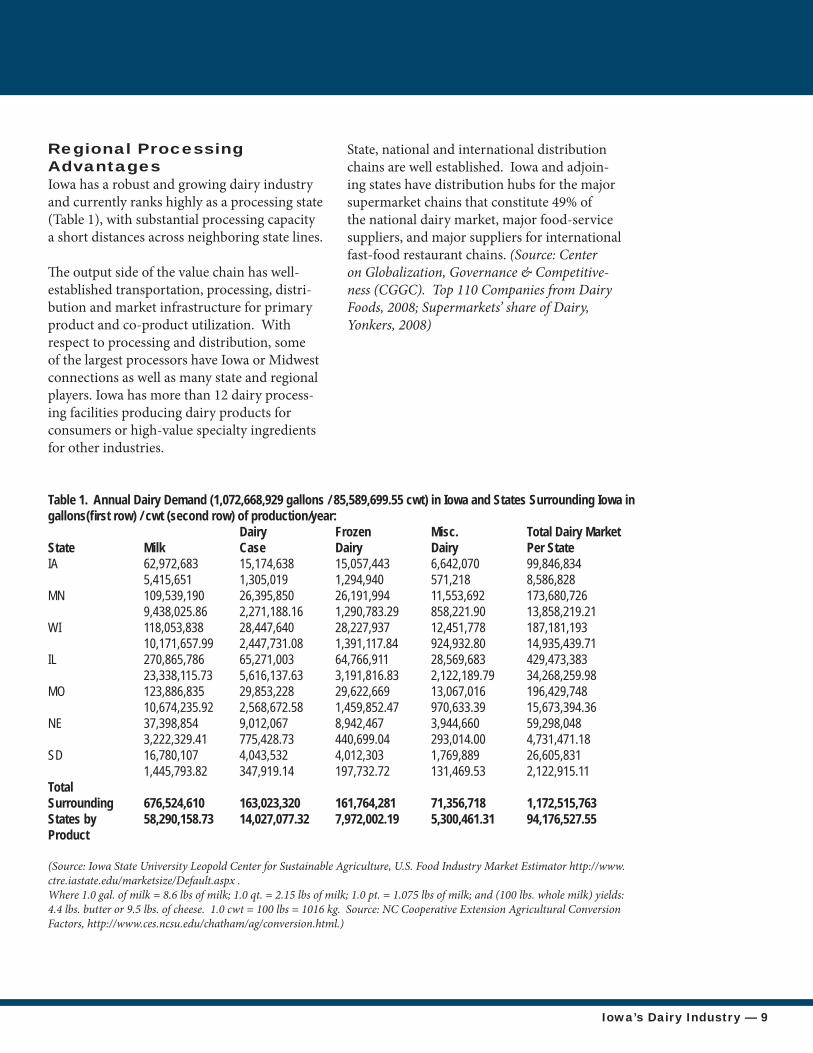
Regional Processing AdvantagesIowa has a robust and growing dairy industry and currently ranks highly as a processing state (Table 1), with substantial processing capacity a short distances across neighboring state lines.
Th e output side of the value chain has well-established transportation, processing, distri-bution and market infrastructure for primary product and co-product utilization. With respect to processing and distribution, some of the largest processors have Iowa or Midwest connections as well as many state and regional players. Iowa has more than 12 dairy process-ing facilities producing dairy products for consumers or high-value specialty ingredients for other industries.
State, national and international distribution chains are well established. Iowa and adjoin-ing states have distribution hubs for the major supermarket chains that constitute 49% of the national dairy market, major food-service suppliers, and major suppliers for international fast-food restaurant chains. (Source: Center on Globalization, Governance & Competitive-ness (CGGC). Top 110 Companies from Dairy Foods, 2008; Supermarkets’ share of Dairy, Yonkers, 2008)
Table 1. Annual Dairy Demand (1,072,668,929 gallons / 85,589,699.55 cwt) in Iowa and States Surrounding Iowa in gallons(fi rst row) / cwt (second row) of production/year: Dairy Frozen Misc. Total Dairy MarketState Milk Case Dairy Dairy Per State IA 62,972,683 15,174,638 15,057,443 6,642,070 99,846,834 5,415,651 1,305,019 1,294,940 571,218 8,586,828MN 109,539,190 26,395,850 26,191,994 11,553,692 173,680,726 9,438,025.86 2,271,188.16 1,290,783.29 858,221.90 13,858,219.21WI 118,053,838 28,447,640 28,227,937 12,451,778 187,181,193 10,171,657.99 2,447,731.08 1,391,117.84 924,932.80 14,935,439.71IL 270,865,786 65,271,003 64,766,911 28,569,683 429,473,383 23,338,115.73 5,616,137.63 3,191,816.83 2,122,189.79 34,268,259.98MO 123,886,835 29,853,228 29,622,669 13,067,016 196,429,748 10,674,235.92 2,568,672.58 1,459,852.47 970,633.39 15,673,394.36NE 37,398,854 9,012,067 8,942,467 3,944,660 59,298,048 3,222,329.41 775,428.73 440,699.04 293,014.00 4,731,471.18SD 16,780,107 4,043,532 4,012,303 1,769,889 26,605,831 1,445,793.82 347,919.14 197,732.72 131,469.53 2,122,915.11TotalSurrounding 676,524,610 163,023,320 161,764,281 71,356,718 1,172,515,763States by 58,290,158.73 14,027,077.32 7,972,002.19 5,300,461.31 94,176,527.55Product
(Source: Iowa State University Leopold Center for Sustainable Agriculture, U.S. Food Industry Market Estimator http://www.ctre.iastate.edu/marketsize/Default.aspx .Where 1.0 gal. of milk = 8.6 lbs of milk; 1.0 qt. = 2.15 lbs of milk; 1.0 pt. = 1.075 lbs of milk; and (100 lbs. whole milk) yields: 4.4 lbs. butter or 9.5 lbs. of cheese. 1.0 cwt = 100 lbs = 1016 kg. Source: NC Cooperative Extension Agricultural Conversion Factors, http://www.ces.ncsu.edu/chatham/ag/conversion.html.)
10 — Iowa’s Dairy Industry
Infrastructure Advantages With respect to dairy production, Iowa has an educational infrastructure to train operators and update informational resources. Out-standing regional education and information and outreach sources include various farm and industry organizations, but also public institu-tions in Iowa and neighboring states.
Th e state’s private and public veterinary servic-es infrastructure and state and regional breed-ing (genetics), veterinary-service and associ-ated ongoing veterinary continuing-education and information support resources is outstand-ing. Centrally located in Ames, are the Iowa State University Dairy Science Program, Iowa State University School of Veterinary Medi-cine and the USDA National Animal Disease
Laboratory, all considered national leaders in dairy science, large-animal veterinary training and support and dairy enterprise development risk-management planning.
Several marketing and producer cooperatives (Land O’Lakes, Dairy Farmers of America, Swiss Valley Farms, AMPI, Prairie Farms and others) are already established in Iowa. Ad-ditionally, strong policy-infl uencing state dairy and agricultural associations (Iowa State Dairy Association, Midwest Dairy Association and the Iowa Farm Bureau Federation) and their associations with major production-marketing cooperatives are ready and willing to work on the producer’s behalf.
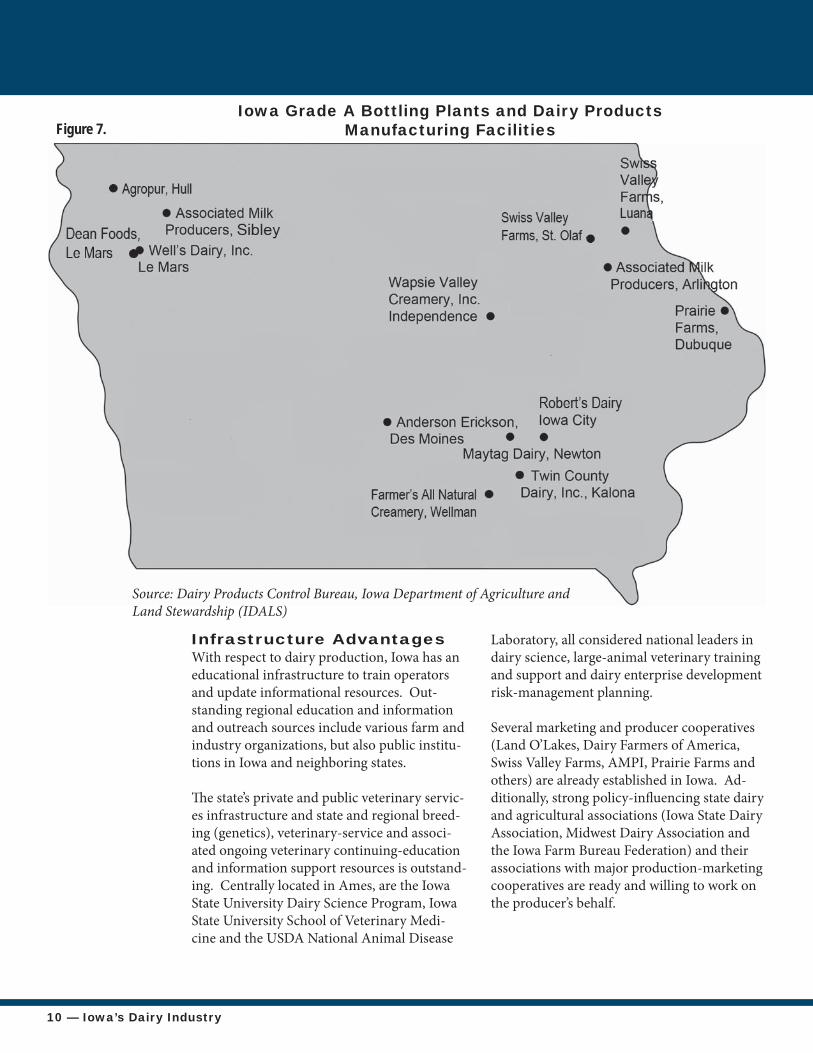
Figure 7.
Source: Dairy Products Control Bureau, Iowa Department of Agriculture and Land Stewardship (IDALS)
Iowa Grade A Bottling Plants and Dairy Products Manufacturing Facilities
Iowa’s Dairy Industry — 11
As fuel prices continue to increase, all operat-ing expenses related to ground transportation also will increase. For this reason, it is advan-tageous to co-locate production facilities close to major transportation routes to processors and major transportation routes from feed producers.
Iowa is crisscrossed and bordered by major transportation corridors constantly increasing in regional impact. Bisected north- south by I-35 and east-west by I-80, these two Inter-states intersect in Des Moines, the location of several large dairy processors and link Iowa to neighboring states.
Th e north-south I-29 corridor in the west and HWY-61/52 corridor in the east are ready transportation routes upon which major processors are located and are routes that lead to others in neighboring states. I-29 is an important highway of commerce linking Sioux City and Council Bluff s, IA; Omaha, NE; and Rapid City, SD. Th e north-south HWY-61/52 corridor in the east is an important highway of commerce linking Dubuque, Burlington and Davenport, IA, the Quad Cities, IA/IL areas. Additionally, I-380 is an important north-south highway of commerce linking Waterloo/Cedar Falls, Cedar Rapids and Iowa City with connections to east-west routes I-20, I-80 and HWY-30.
In Iowa, the Iowa State University (ISU) Department of Animal Science’s Dairy Pro-gram, ISU Dairy Farm; ISU College of Veteri-nary Medicine’s FSVM Veterinary Extension Program for Dairy Cattle; and ISU Extension dairy team; and associated manure-man-agement programs in association with ISU Department of Agricultural and Bio-systems Engineering faculty and extension techni-cians support Iowa’s dairy farms. Th e ISU dairy extension group provides information and assistance with business and fi nancial management, production records, employee
management and training including Hispanic resources, milk marketing and pricing, facility construction with robotic milking systems and related system support, and various livestock and environmental resources.
Th e ISU Veterinary Medicine Diagnostics Laboratory (VDL) Veterinary Pathology and Microbiology (VPAM) group provides testing for milk quality and pathogens, important to Iowa dairy producers. Milk-quality specialists at ISU VPAM are available to help trouble-shoot milking equipment and cleaning prob-lems. Th e ISU VDL Bacteriology processes over 5,000 samples per year with an emphasis on accurate analysis and fast, effi cient turn-around.
Iowa has long been noted for the competitive advantage of its outstanding, increasingly di-verse workforce. Th e high-quality workforce is reinforced by Iowa’s community college system with outstanding programs for continuing education and farm-management and operator training. Since the creation of the Northeast Iowa Community College Dairy Center, Calm-ar, IA, in 2000, and the associated Northeast Iowa Dairy Foundation, more than 300 dairy science students have received fundamental and advanced training. (Source: Northeast Iowa Dairy Education, 2010, http://www.reeis.usda.gov/web/crisprojectpages/218780.html)
12 — Iowa’s Dairy Industry
Much of this is due to the assistance of state service providers and extension outreach professionals who have pioneered low-cost parlors and parlor-effi ciency renovation sup-port systems.
Iowa is becoming the rapidly-expanding home of the robotic milking industry. (Source: ISU Extension develops tools for evaluating fi nances of robotic milking system, AgriNews, 2011, http://www.agrinews.com/isu/extension/de-velops/tools/fo/evaluating/fi nances/of/robotic/milking/system/story-4074.html) Robotic milking works for all segments of the indus-try from small to large and from grazing to confi nement operations. Major manufacturers including Westfalia, Lely and DeLaval off er systems in the Midwest and Boumatic will soon be introducing a new system. With about 14,000 robotic systems worldwide, installation of robotic milking systems in Iowa is expected to more than triple in 2012, and it is possible that by 2020, 10 to 30 percent of Iowa’s existing dairy producers will be using robotic systems according to Iowa State University (ISU) dairy specialists. To help producers and lenders make informed decisions on the economic variables associated with robotic systems, ISU Extension farm and agribusiness management specialists, have developed a partial budget spreadsheet. Th is tool will be available on the ISU Extension dairy team website in 2012.
Iowa’s dairy scene is a diverse picture where operators from 18 to 8,000 head have more effi ciently out-produced surrounding states for the past two decades. Th is is in spite of the fact that Iowa, like many other Plains states, has seen loss of population from many of its rural areas, causing fi nancial hardship to many rural communities. Considering the substantial impact dairy production has on rural commu-nities, this has created opportunities for dairy producers of almost any size to locate opera-tions in several Iowa counties are considered economic incentive zones. State and private development groups continually concentrate resources to bring agricultural industry and support services to these areas. Like the previously mentioned Rural Water As-sociation, other groups contribute to sustain-able rural development by providing valuable support services to Iowa’s agribusiness com-munity. Th e Coalition to Support Iowa’s Farm-ers (CSIF), established in 2004 by farmers for farmers, helps livestock producers successfully and responsibly navigate the ever-changing livestock-farming landscape. Working closely with the Midwest Dairy Association and other commodity groups, CSIF helps farmers understand and comply with state and federal regulations, provides building-site analysis, and consults on environment safeguards and enhanced neighbor relations.
Utility providers contribute to another group, Th e Iowa Area Development Group (IADG). Since its beginning in 1985, IADG has assisted with over 1,700 successful new-business and business-expansion development projects representing a capital investment of more than $6.0 billion and creation of over 40,000 retained and new jobs. (Source: the Iowa Area Development Group, 2011, http://www.iadg.com/default.aspx) IADG services are off ered at no charge to new and expanding businesses. Th e group provides information essential to any site location decision, using an extensive database of site, building and community-data.
Iowa’s Dairy Industry — 13
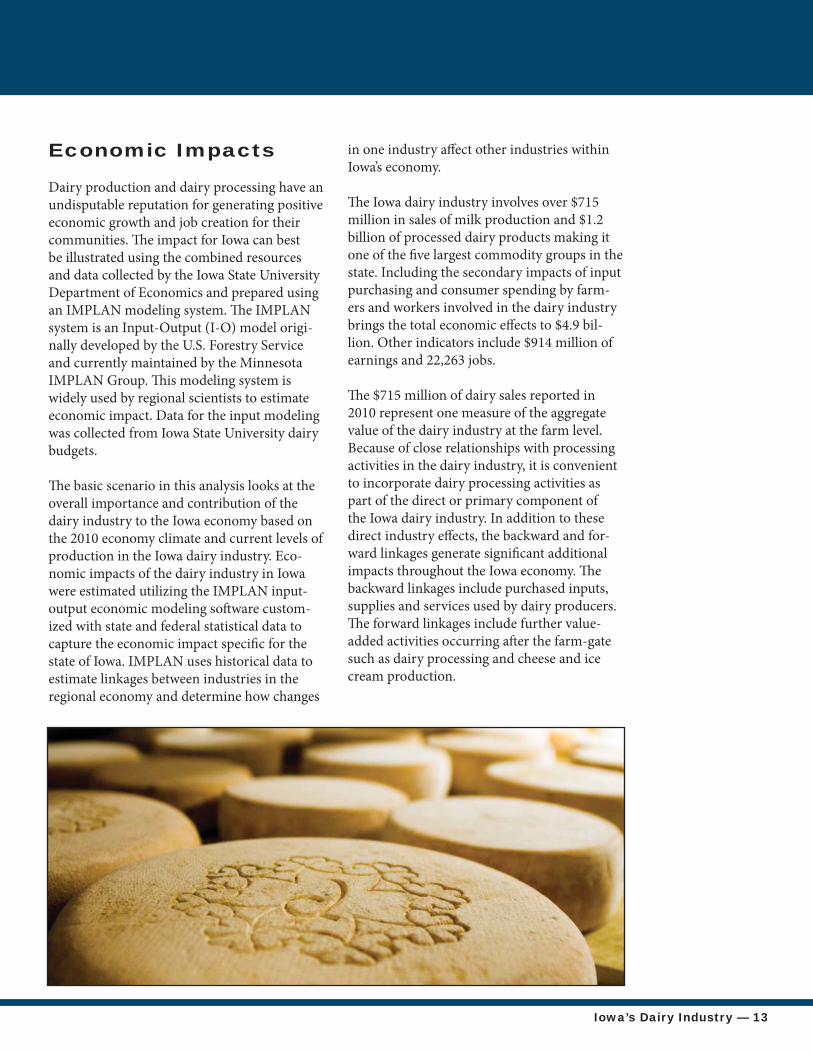
Economic Impacts
Dairy production and dairy processing have an undisputable reputation for generating positive economic growth and job creation for their communities. Th e impact for Iowa can best be illustrated using the combined resources and data collected by the Iowa State University Department of Economics and prepared using an IMPLAN modeling system. Th e IMPLAN system is an Input-Output (I-O) model origi-nally developed by the U.S. Forestry Service and currently maintained by the Minnesota IMPLAN Group. Th is modeling system is widely used by regional scientists to estimate economic impact. Data for the input modeling was collected from Iowa State University dairy budgets.
Th e basic scenario in this analysis looks at the overall importance and contribution of the dairy industry to the Iowa economy based on the 2010 economy climate and current levels of production in the Iowa dairy industry. Eco-nomic impacts of the dairy industry in Iowa were estimated utilizing the IMPLAN input-output economic modeling soft ware custom-ized with state and federal statistical data to capture the economic impact specifi c for the state of Iowa. IMPLAN uses historical data to estimate linkages between industries in the regional economy and determine how changes
in one industry aff ect other industries within Iowa’s economy.
Th e Iowa dairy industry involves over $715 million in sales of milk production and $1.2 billion of processed dairy products making it one of the fi ve largest commodity groups in the state. Including the secondary impacts of input purchasing and consumer spending by farm-ers and workers involved in the dairy industry brings the total economic eff ects to $4.9 bil-lion. Other indicators include $914 million of earnings and 22,263 jobs.
Th e $715 million of dairy sales reported in 2010 represent one measure of the aggregate value of the dairy industry at the farm level. Because of close relationships with processing activities in the dairy industry, it is convenient to incorporate dairy processing activities as part of the direct or primary component of the Iowa dairy industry. In addition to these direct industry eff ects, the backward and for-ward linkages generate signifi cant additional impacts throughout the Iowa economy. Th e backward linkages include purchased inputs, supplies and services used by dairy producers. Th e forward linkages include further value-added activities occurring aft er the farm-gate such as dairy processing and cheese and ice cream production.
14 — Iowa’s Dairy Industry
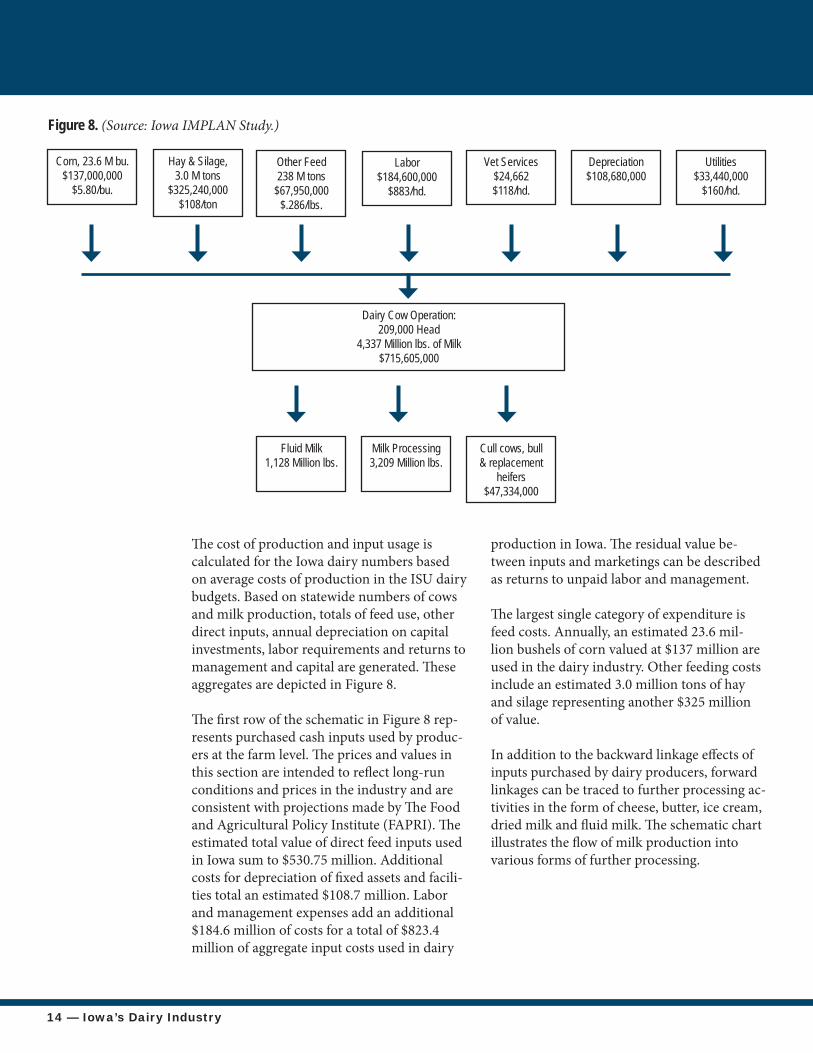
Th e cost of production and input usage is calculated for the Iowa dairy numbers based on average costs of production in the ISU dairy budgets. Based on statewide numbers of cows and milk production, totals of feed use, other direct inputs, annual depreciation on capital investments, labor requirements and returns to management and capital are generated. Th ese aggregates are depicted in Figure 8.
Th e fi rst row of the schematic in Figure 8 rep-resents purchased cash inputs used by produc-ers at the farm level. Th e prices and values in this section are intended to refl ect long-run conditions and prices in the industry and are consistent with projections made by Th e Food and Agricultural Policy Institute (FAPRI). Th e estimated total value of direct feed inputs used in Iowa sum to $530.75 million. Additional costs for depreciation of fi xed assets and facili-ties total an estimated $108.7 million. Labor and management expenses add an additional $184.6 million of costs for a total of $823.4 million of aggregate input costs used in dairy
production in Iowa. Th e residual value be-tween inputs and marketings can be described as returns to unpaid labor and management.
Th e largest single category of expenditure is feed costs. Annually, an estimated 23.6 mil-lion bushels of corn valued at $137 million are used in the dairy industry. Other feeding costs include an estimated 3.0 million tons of hay and silage representing another $325 million of value.
In addition to the backward linkage eff ects of inputs purchased by dairy producers, forward linkages can be traced to further processing ac-tivities in the form of cheese, butter, ice cream, dried milk and fl uid milk. Th e schematic chart illustrates the fl ow of milk production into various forms of further processing.
Corn, 23.6 M bu. $137,000,000
$5.80/bu.
Hay & Silage, 3.0 M tons
$325,240,000 $108/ton
Other Feed238 M tons
$67,950,000$.286/lbs.
Labor$184,600,000
$883/hd.
Vet Services$24,662$118/hd.
Depreciation$108,680,000
Utilities$33,440,000
$160/hd.
Dairy Cow Operation:209,000 Head
4,337 Million lbs. of Milk$715,605,000
Fluid Milk1,128 Million lbs.
Milk Processing3,209 Million lbs.
Cull cows, bull & replacement
heifers$47,334,000
Figure 8. (Source: Iowa IMPLAN Study.)
Iowa’s Dairy Industry — 15
Economic Importance of the Dairy Industry in IowaDairy has a long history in rural Iowa and has made signifi cant contributions to the state’s economic vitality. Th e dairy farm itself plus all the related processing and service industries impact the greater economic performance of the state. Current estimates of employment in the dairy sector (both farm and non-farm) are approximately 23,000 FTE, (Figure 9). Th e total economic impact in dollars is over $900,000,000 from direct, indirect, and in-duced employment. Th e basic scenario in this analysis looks at the overall importance and contribution of the dairy industry to the Iowa economy based on the 2010 situation and cur-rent levels of production in the Iowa dairy in-dustry. Economic impacts of the dairy industry in Iowa were estimated utilizing the IMPLAN input-output economic modeling soft ware customized to capture the economic impact for the state of Iowa. IMPLAN uses historical data to estimate linkages between industries in the regional economy and determine how changes in one industry aff ect other industries within Iowa’s economy. Input-output models are used to estimate three types of eff ects:
Direct eff ects are economic impacts generated directly by the dairy industry. Indirect eff ects are economic impacts generated by purchases of goods and services by the dairy industry in other sectors, such as logistics, utilities, transportation, fi nancial services, etc. Induced eff ects are the impact of spending by employees on goods and services outside the industry, like gro-cery stores, education, and other retail. Employment comes in many forms; on farm help, dairy product processing, transportation, veterinary services, plus secondary and tertiary employment in small town retail and service industries.
As a result, the full set of linkages of dairy pro-duction to in-state feed grain production and processing as well as the consumer eff ects are included as part of the total impacts.
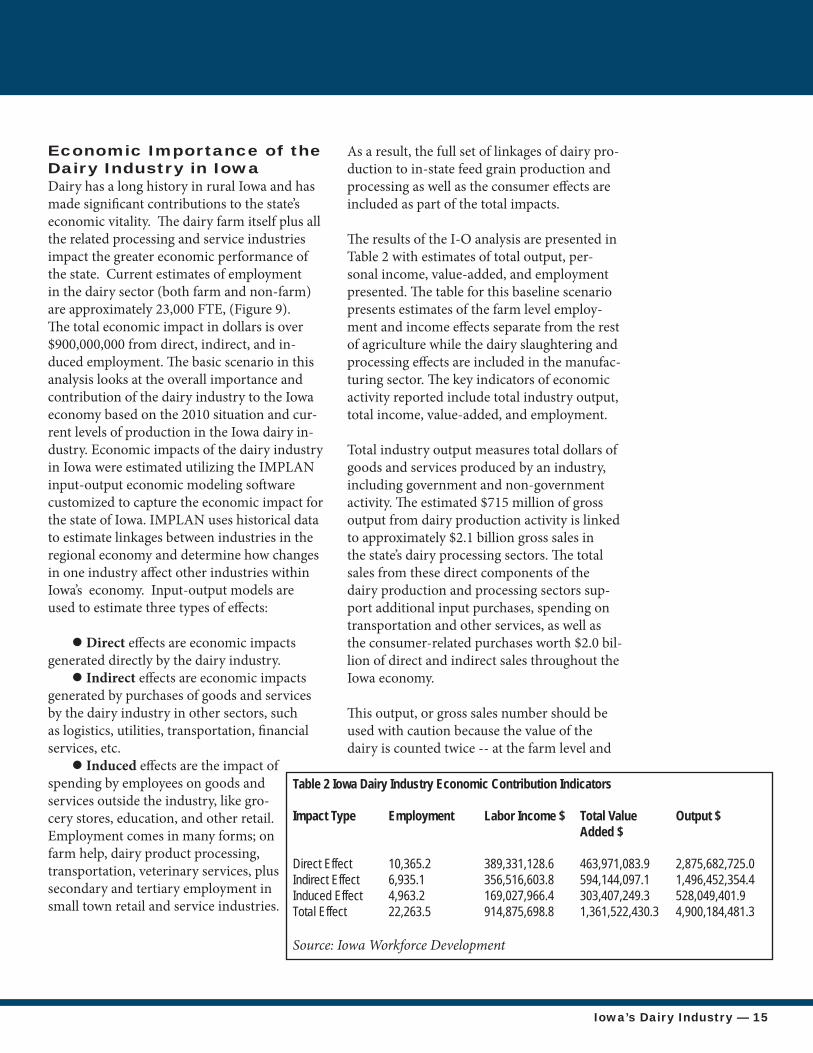
Th e results of the I-O analysis are presented in Table 2 with estimates of total output, per-sonal income, value-added, and employment presented. Th e table for this baseline scenario presents estimates of the farm level employ-ment and income eff ects separate from the rest of agriculture while the dairy slaughtering and processing eff ects are included in the manufac-turing sector. Th e key indicators of economic activity reported include total industry output, total income, value-added, and employment.
Total industry output measures total dollars of goods and services produced by an industry, including government and non-government activity. Th e estimated $715 million of gross output from dairy production activity is linked to approximately $2.1 billion gross sales in the state’s dairy processing sectors. Th e total sales from these direct components of the dairy production and processing sectors sup-port additional input purchases, spending on transportation and other services, as well as the consumer-related purchases worth $2.0 bil-lion of direct and indirect sales throughout the Iowa economy.
Th is output, or gross sales number should be used with caution because the value of the dairy is counted twice -- at the farm level and
Table 2 Iowa Dairy Industry Economic Contribution Indicators Impact Type Employment Labor Income $ Total Value Output $ Added $ Direct Effect 10,365.2 389,331,128.6 463,971,083.9 2,875,682,725.0Indirect Effect 6,935.1 356,516,603.8 594,144,097.1 1,496,452,354.4Induced Effect 4,963.2 169,027,966.4 303,407,249.3 528,049,401.9Total Effect 22,263.5 914,875,698.8 1,361,522,430.3 4,900,184,481.3
Source: Iowa Workforce Development
16 — Iowa’s Dairy Industry
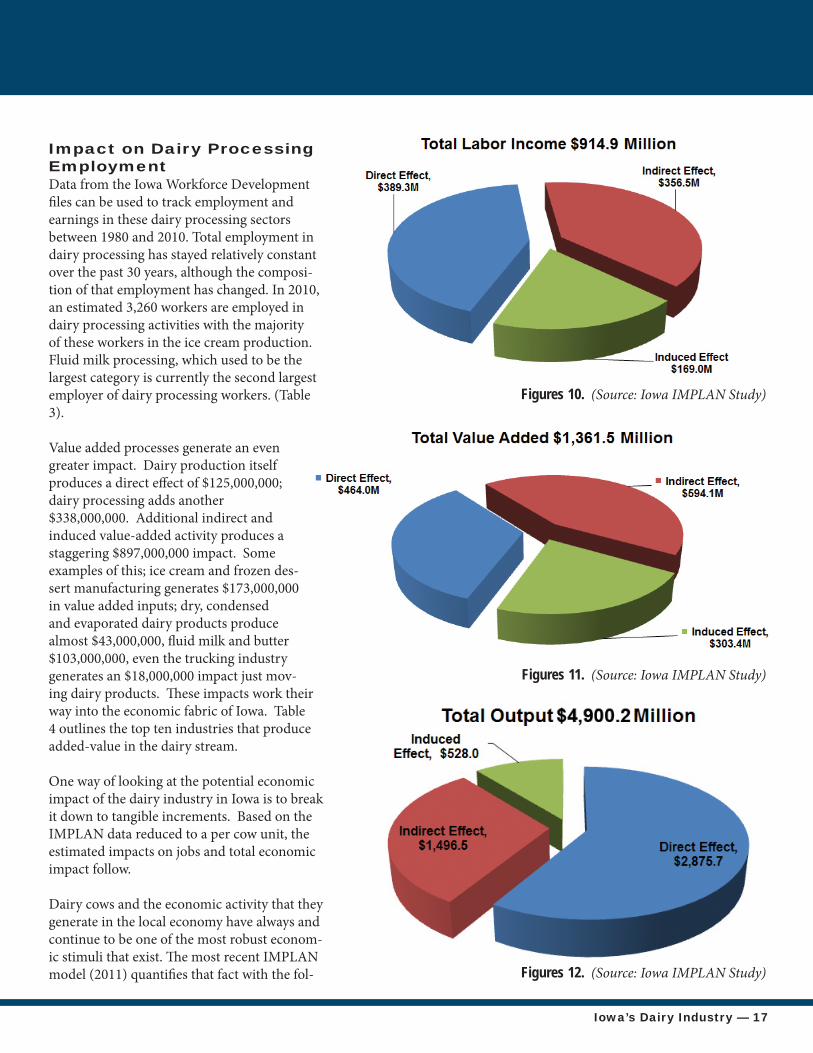
as part of the total value of dairy products when it is sold from the processor. While much of the impacts is concentrated in the ag-ricultural and input supply sectors, economic linkages beyond the farm gate capture addi-tional activities such as transportation, han-dling, processing and the personal consumer spending eff ects. As a result, the eff ects of the dairy industry are distributed throughout the economy, benefi ting rural and urban areas including the services and trade sectors. Total personal income is a composite of wage and salary income and return to proprietors. Th is more comprehensive measure of income is chosen because most farm income is re-ported as proprietor income. Th e estimate of $185 million of direct income to dairy produc-ers is linked to an additional $204 million of earnings to workers in dairy processing and to $525.6 million of additional income through-out the Iowa economy for a total impact of $914.9 million of personal income (Figure 10). Again the service and retailing sectors receive strong stimulus from the initial eff ect of in-come earned in the dairy sector. Total value added measures the total gain in economic activity to the economy resulting
from production of goods or services. Wages, salaries, taxes, and profi ts are included in the value-added measure. Th e value-added measure is a good indicator of net economic activity as only the net incremental value is summed at each transaction to avoid double counting. Th e estimated $125 million of value added for dairy production and $338 million in dairy processing is linked to $897 million of additional indirect and induced value-added activity in the state’s economy for a total value added of $1.364 million (Figure 11).
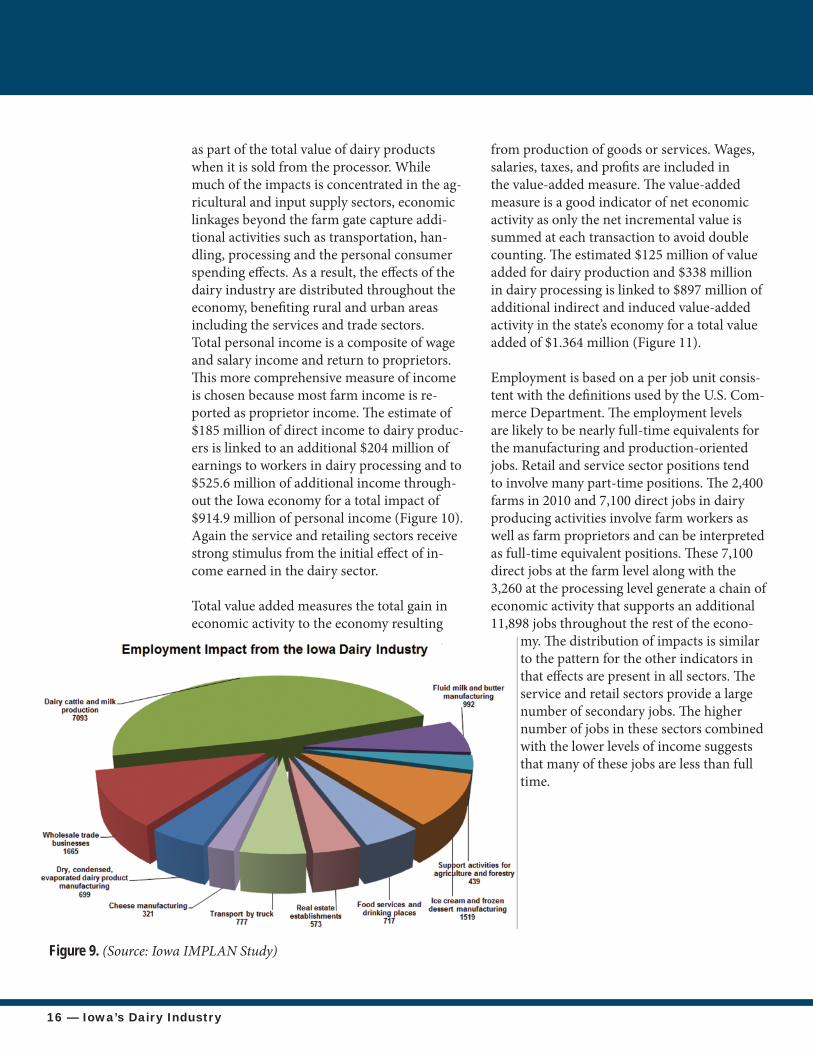
Employment is based on a per job unit consis-tent with the defi nitions used by the U.S. Com-merce Department. Th e employment levels are likely to be nearly full-time equivalents for the manufacturing and production-oriented jobs. Retail and service sector positions tend to involve many part-time positions. Th e 2,400 farms in 2010 and 7,100 direct jobs in dairy producing activities involve farm workers as well as farm proprietors and can be interpreted as full-time equivalent positions. Th ese 7,100 direct jobs at the farm level along with the 3,260 at the processing level generate a chain of economic activity that supports an additional 11,898 jobs throughout the rest of the econo-
my. Th e distribution of impacts is similar to the pattern for the other indicators in that eff ects are present in all sectors. Th e service and retail sectors provide a large number of secondary jobs. Th e higher number of jobs in these sectors combined with the lower levels of income suggests that many of these jobs are less than full time.
Figure 9. (Source: Iowa IMPLAN Study)
Iowa’s Dairy Industry — 17
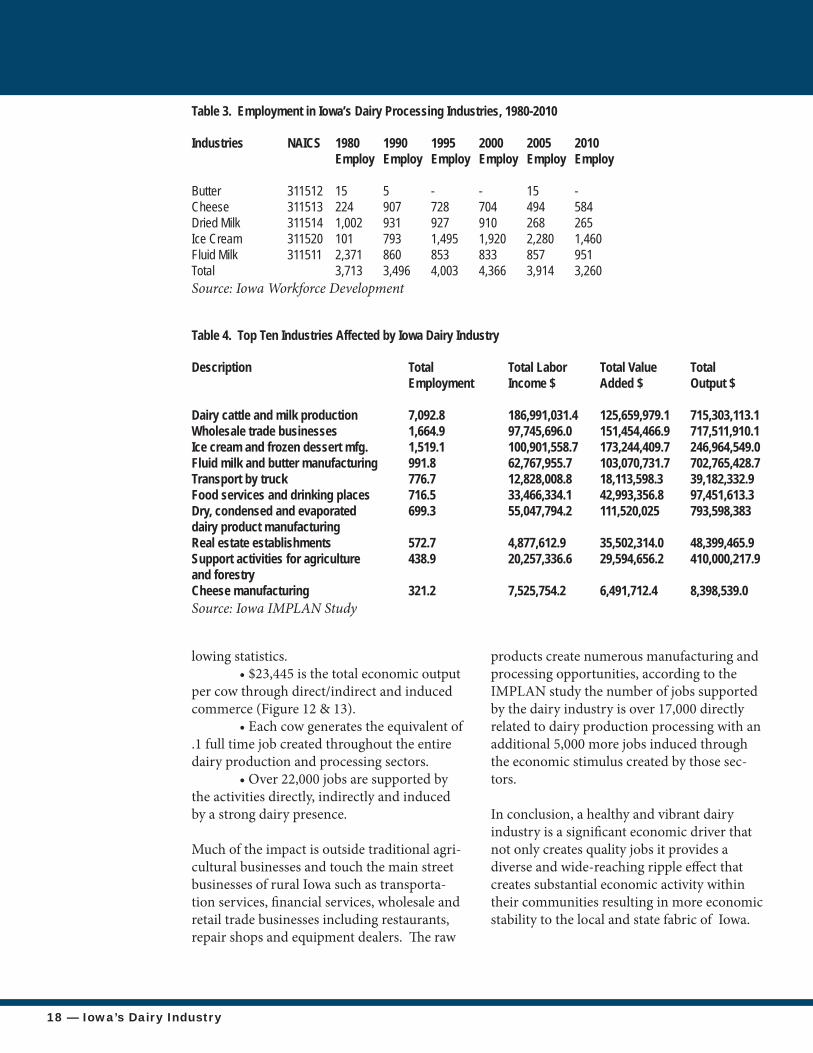
Impact on Dairy Processing EmploymentData from the Iowa Workforce Development fi les can be used to track employment and earnings in these dairy processing sectors between 1980 and 2010. Total employment in dairy processing has stayed relatively constant over the past 30 years, although the composi-tion of that employment has changed. In 2010, an estimated 3,260 workers are employed in dairy processing activities with the majority of these workers in the ice cream production. Fluid milk processing, which used to be the largest category is currently the second largest employer of dairy processing workers. (Table 3).
Value added processes generate an even greater impact. Dairy production itself produces a direct eff ect of $125,000,000; dairy processing adds another $338,000,000. Additional indirect and induced value-added activity produces a staggering $897,000,000 impact. Some examples of this; ice cream and frozen des-sert manufacturing generates $173,000,000 in value added inputs; dry, condensed and evaporated dairy products produce almost $43,000,000, fl uid milk and butter $103,000,000, even the trucking industry generates an $18,000,000 impact just mov-ing dairy products. Th ese impacts work their way into the economic fabric of Iowa. Table 4 outlines the top ten industries that produce added-value in the dairy stream.
One way of looking at the potential economic impact of the dairy industry in Iowa is to break it down to tangible increments. Based on the IMPLAN data reduced to a per cow unit, the estimated impacts on jobs and total economic impact follow.
Dairy cows and the economic activity that they generate in the local economy have always and continue to be one of the most robust econom-ic stimuli that exist. Th e most recent IMPLAN model (2011) quantifi es that fact with the fol-
Figures 10. (Source: Iowa IMPLAN Study)
Figures 11. (Source: Iowa IMPLAN Study)
Figures 12. (Source: Iowa IMPLAN Study)
18 — Iowa’s Dairy Industry
Table 4. Top Ten Industries Affected by Iowa Dairy Industry
Description Total Total Labor Total Value Total Employment Income $ Added $ Output $
Dairy cattle and milk production 7,092.8 186,991,031.4 125,659,979.1 715,303,113.1Wholesale trade businesses 1,664.9 97,745,696.0 151,454,466.9 717,511,910.1Ice cream and frozen dessert mfg. 1,519.1 100,901,558.7 173,244,409.7 246,964,549.0Fluid milk and butter manufacturing 991.8 62,767,955.7 103,070,731.7 702,765,428.7Transport by truck 776.7 12,828,008.8 18,113,598.3 39,182,332.9Food services and drinking places 716.5 33,466,334.1 42,993,356.8 97,451,613.3Dry, condensed and evaporated 699.3 55,047,794.2 111,520,025 793,598,383dairy product manufacturing Real estate establishments 572.7 4,877,612.9 35,502,314.0 48,399,465.9Support activities for agriculture 438.9 20,257,336.6 29,594,656.2 410,000,217.9and forestryCheese manufacturing 321.2 7,525,754.2 6,491,712.4 8,398,539.0Source: Iowa IMPLAN Study
Table 3. Employment in Iowa’s Dairy Processing Industries, 1980-2010
Industries NAICS 1980 1990 1995 2000 2005 2010 Employ Employ Employ Employ Employ Employ
Butter 311512 15 5 - - 15 -Cheese 311513 224 907 728 704 494 584Dried Milk 311514 1,002 931 927 910 268 265Ice Cream 311520 101 793 1,495 1,920 2,280 1,460Fluid Milk 311511 2,371 860 853 833 857 951Total 3,713 3,496 4,003 4,366 3,914 3,260Source: Iowa Workforce Development
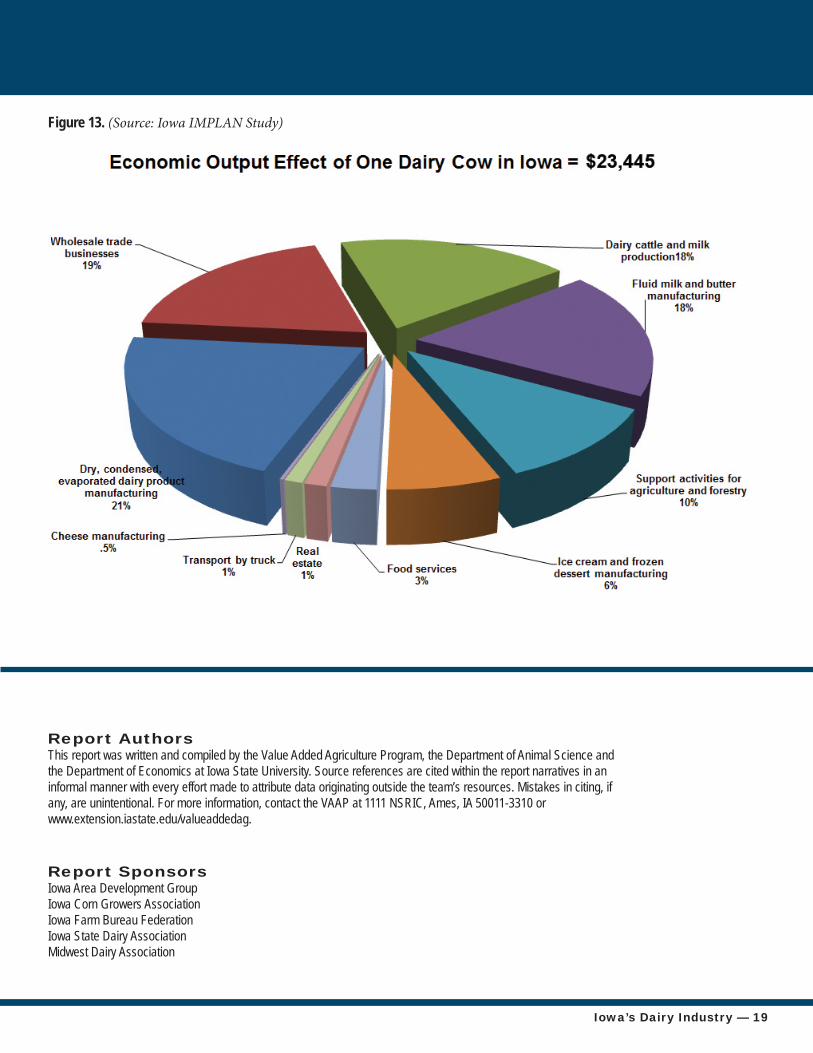
lowing statistics. • $23,445 is the total economic output per cow through direct/indirect and induced commerce (Figure 12 & 13). • Each cow generates the equivalent of .1 full time job created throughout the entire dairy production and processing sectors. • Over 22,000 jobs are supported by the activities directly, indirectly and induced by a strong dairy presence. Much of the impact is outside traditional agri-cultural businesses and touch the main street businesses of rural Iowa such as transporta-tion services, fi nancial services, wholesale and retail trade businesses including restaurants, repair shops and equipment dealers. Th e raw
products create numerous manufacturing and processing opportunities, according to the IMPLAN study the number of jobs supported by the dairy industry is over 17,000 directly related to dairy production processing with an additional 5,000 more jobs induced through the economic stimulus created by those sec-tors.
In conclusion, a healthy and vibrant dairy industry is a signifi cant economic driver that not only creates quality jobs it provides a diverse and wide-reaching ripple eff ect that creates substantial economic activity within their communities resulting in more economic stability to the local and state fabric of Iowa.
Iowa’s Dairy Industry — 19
Report AuthorsThis report was written and compiled by the Value Added Agriculture Program, the Department of Animal Science and the Department of Economics at Iowa State University. Source references are cited within the report narratives in an informal manner with every effort made to attribute data originating outside the team’s resources. Mistakes in citing, if any, are unintentional. For more information, contact the VAAP at 1111 NSRIC, Ames, IA 50011-3310 or www.extension.iastate.edu/valueaddedag.
Figure 13. (Source: Iowa IMPLAN Study)
Report SponsorsIowa Area Development GroupIowa Corn Growers AssociationIowa Farm Bureau FederationIowa State Dairy Association Midwest Dairy Association

20 — Iowa’s Dairy Industry