Embed Size (px)
Citation preview
“Geotechnical Instrumentation
and Monitoring”
W. Allen Marr PE PhD NAE
Geocomp CorporationBoston New York Atlanta Chicago Los Angeles
April 10, 2014
©2014 W. Allen Marr1
Iowa Section of ASCE and SEDC
Geotechnical Conference
Subtopics
• Why instrument and monitor?
• Modern tools for monitoring
• Automation of monitoring
• Some observations
2
1. Show that performance is safe and acceptable.
2. Provide a warning of an impending failure or unsafe
condition.
3. Reveal unknowns and aid use of the Observational
Method.
4. Evaluate contractor’s means and methods.
5. Control construction or operations.
6. Minimize damage to adjacent structures.
7. Inform stakeholders.
8. Satisfy regulators.
9. Document performance for assessing damage.
10. Improve performance and advance
state-of-knowledge.
Reasons to Monitor of Infrastructure
3
Uncertainties and Unknowns Risk
• Subsurface conditions and geo-material complexity
• Loads
• Parameters
• Prediction methods
• Construction methods and results
• Actual performance
Very few engineering disciplines have to deal with
as much uncertainty as we have in infrastructure.
We use performance monitoring to show us when
these uncertainties might lead to negative
impacts so we can take action as soon
as needed.4
• To help client monitor and manage risks.
• Value of performance monitoring is better
understood by clients when the benefits of
performance monitoring are explained as a
means to identify emerging risk so it can be
managed.
Reason to Monitor Performance
5
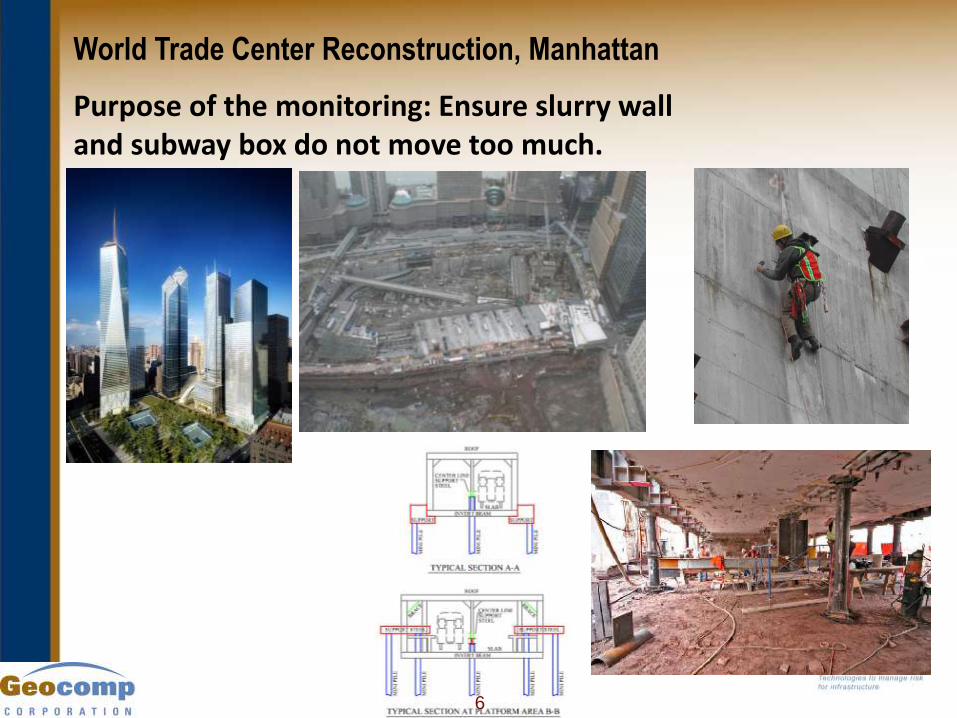
World Trade Center Reconstruction, Manhattan
Purpose of the monitoring: Ensure slurry wall and subway box do not move too much.
6
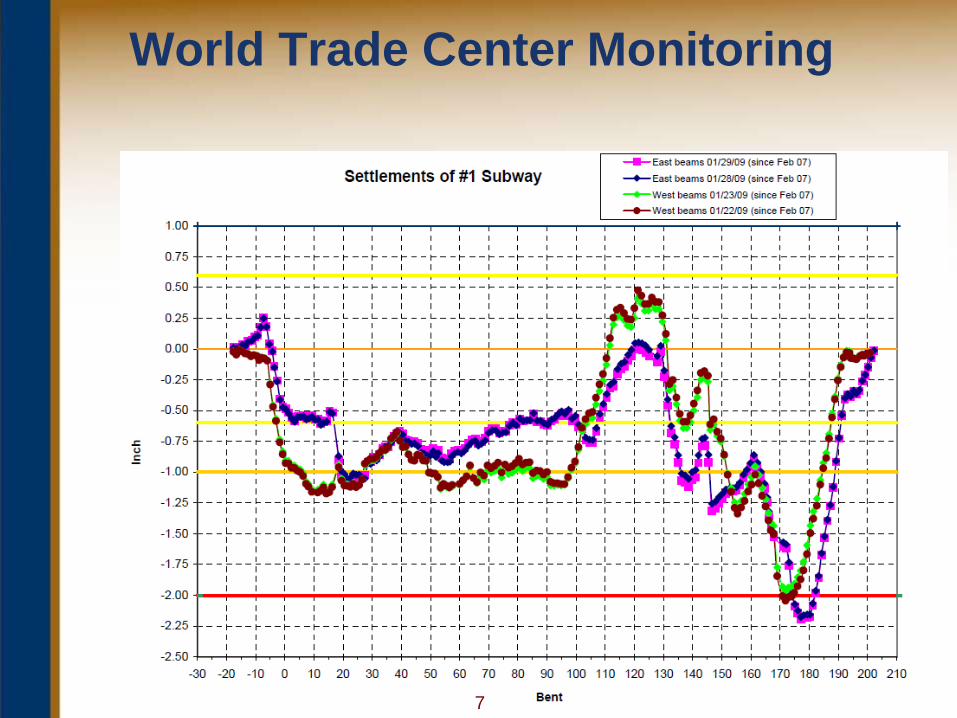
World Trade Center Monitoring
7
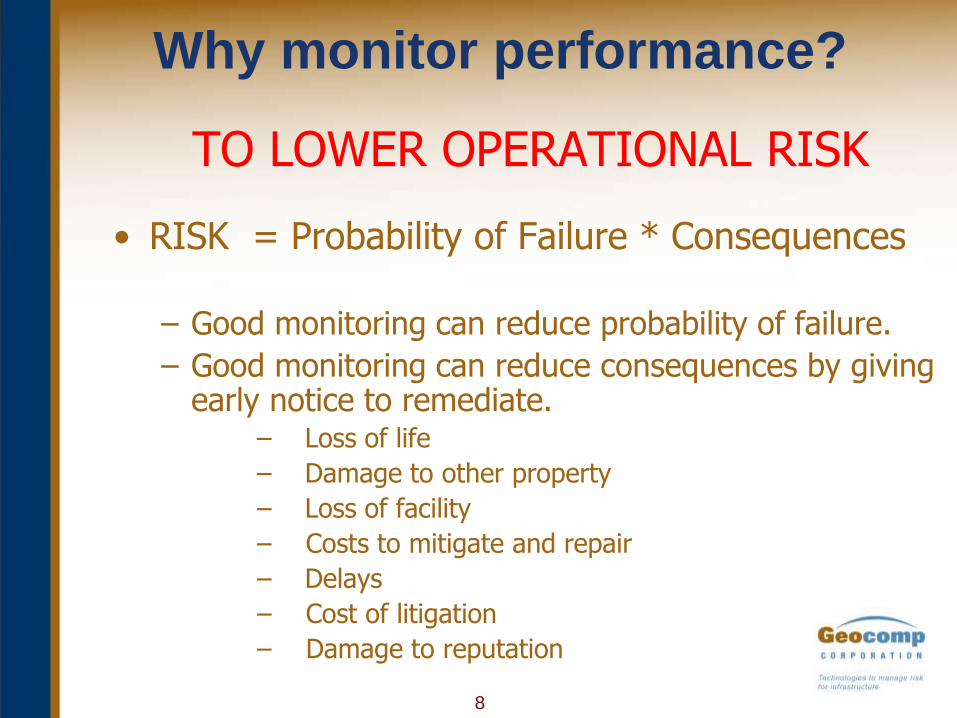
Why monitor performance?
TO LOWER OPERATIONAL RISK
• RISK = Probability of Failure * Consequences
– Good monitoring can reduce probability of failure.
– Good monitoring can reduce consequences by giving early notice to remediate.
– Loss of life
– Damage to other property
– Loss of facility
– Costs to mitigate and repair
– Delays
– Cost of litigation
– Damage to reputation
8
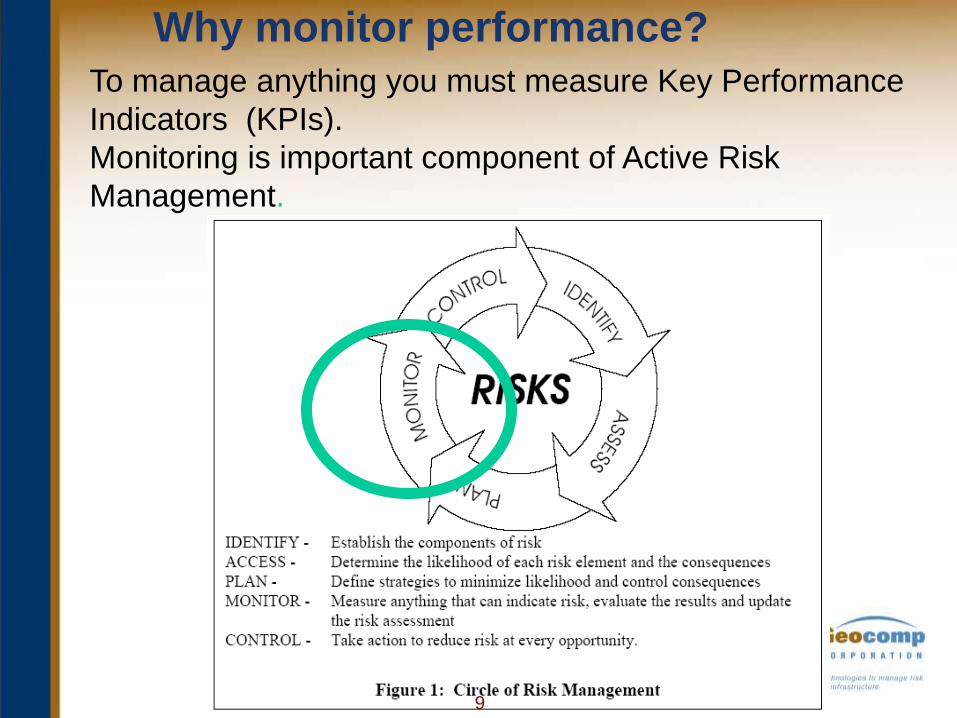
Why monitor performance?
To manage anything you must measure Key Performance
Indicators (KPIs).
Monitoring is important component of Active Risk
Management.
9

10
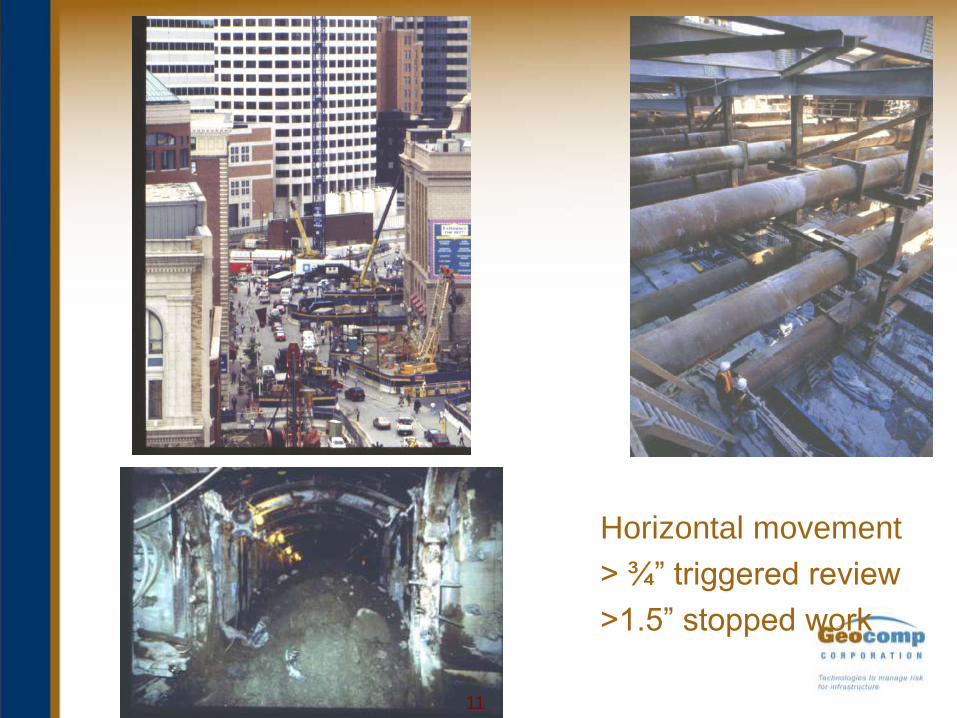
Horizontal movement
> ¾” triggered review
>1.5” stopped work
11
Significant sources of risk
Collapse of one or more major structures
adjacent to the excavations due to failure of the
support system.
Major damage to structures due to failure of
excavation support system.
Architectural damage to historic structures
along the alignment.
Claims by contractors for costly construction
delays caused by damage to adjacent
structures or stoppage of work.
12
CA/T Instrumentation Program
• Estimate of risk without monitoring = $550
million plus potential for significant loss of life
and injury.
• At completion of construction amount paid to
repairs of damages = $9M
• Total cost of monitoring program = $60M
• Monitoring program potentially saved the
project $500M in avoided risk costs.13
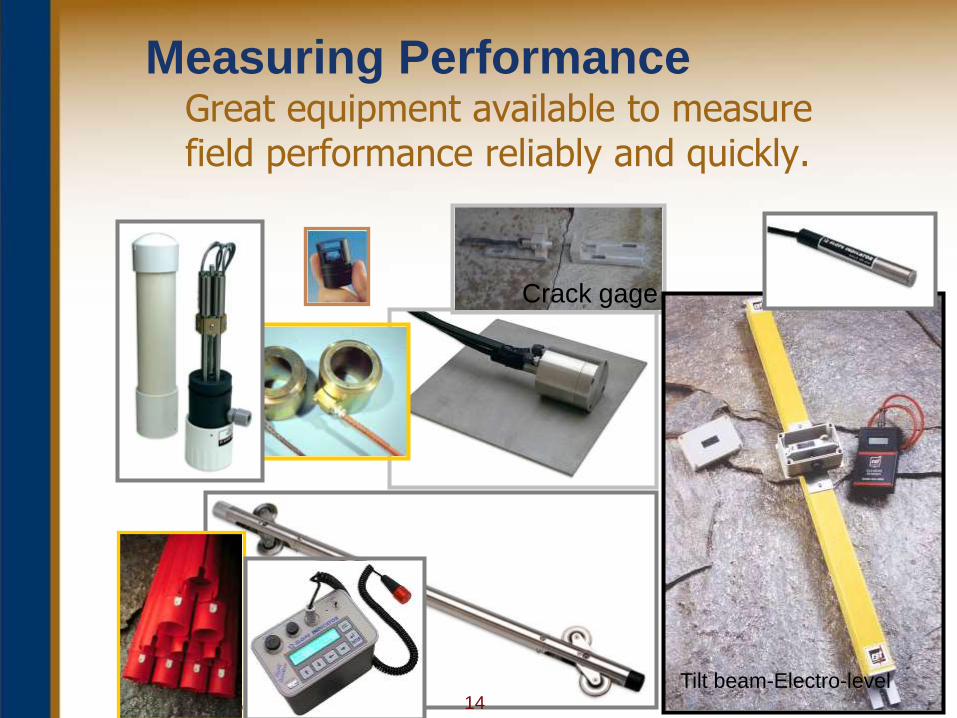
Measuring PerformanceGreat equipment available to measure field performance reliably and quickly.
Crack gage
Tilt beam-Electro-level14
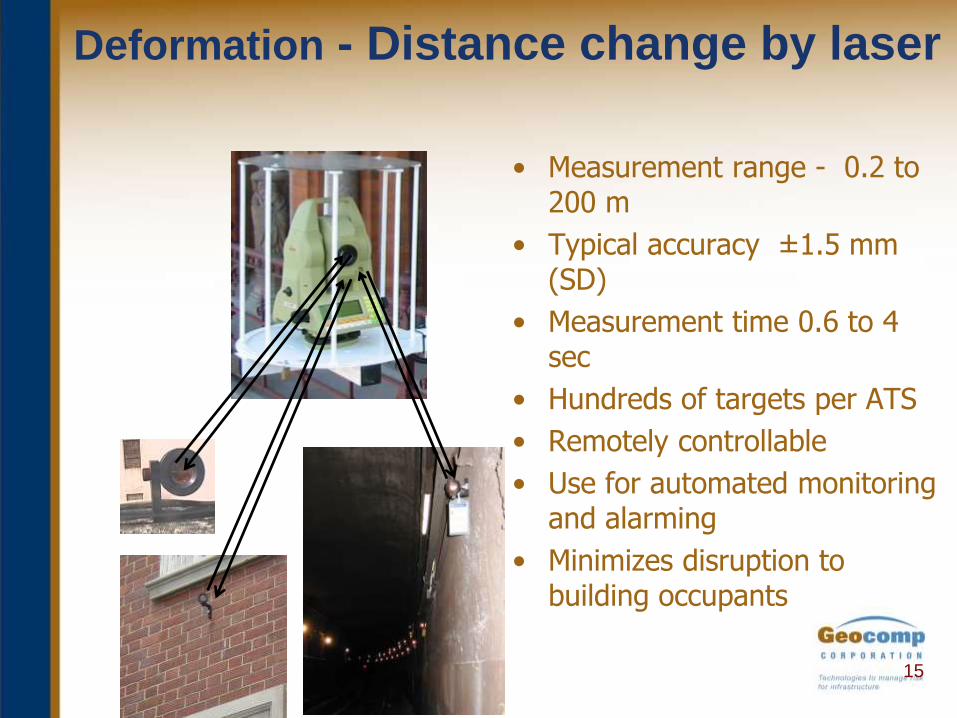
Deformation - Distance change by laser
• Measurement range - 0.2 to 200 m
• Typical accuracy ±1.5 mm (SD)
• Measurement time 0.6 to 4 sec
• Hundreds of targets per ATS
• Remotely controllable
• Use for automated monitoring and alarming
• Minimizes disruption to building occupants
15
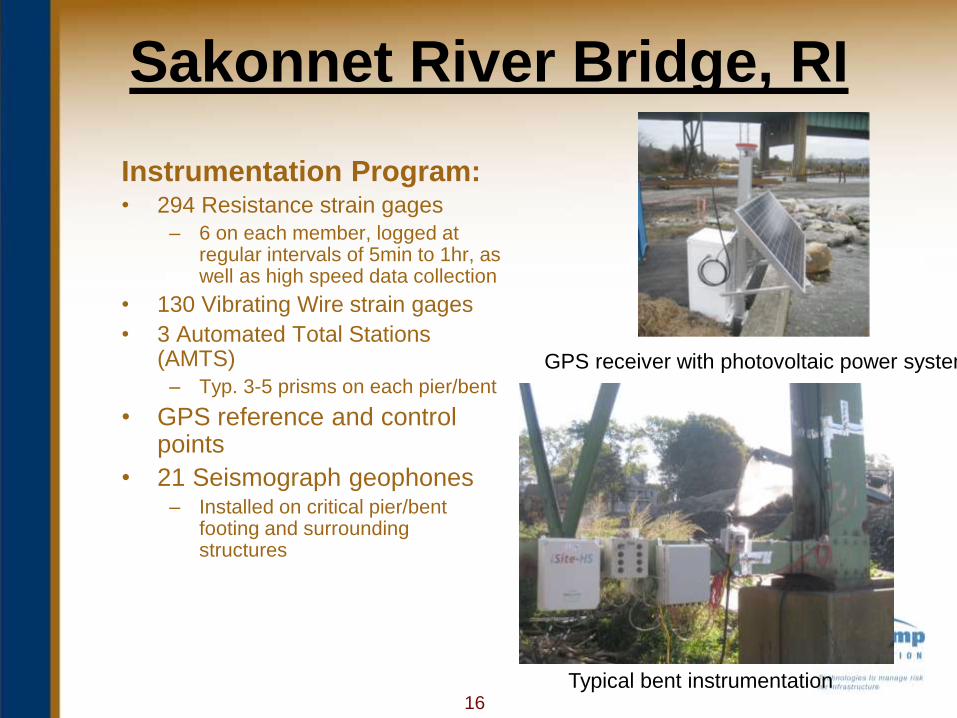
Instrumentation Program:• 294 Resistance strain gages
– 6 on each member, logged at regular intervals of 5min to 1hr, as well as high speed data collection
• 130 Vibrating Wire strain gages
• 3 Automated Total Stations (AMTS)
– Typ. 3-5 prisms on each pier/bent
• GPS reference and control points
• 21 Seismograph geophones– Installed on critical pier/bent
footing and surrounding structures
GPS receiver with photovoltaic power system
Typical bent instrumentation
Sakonnet River Bridge, RI
16
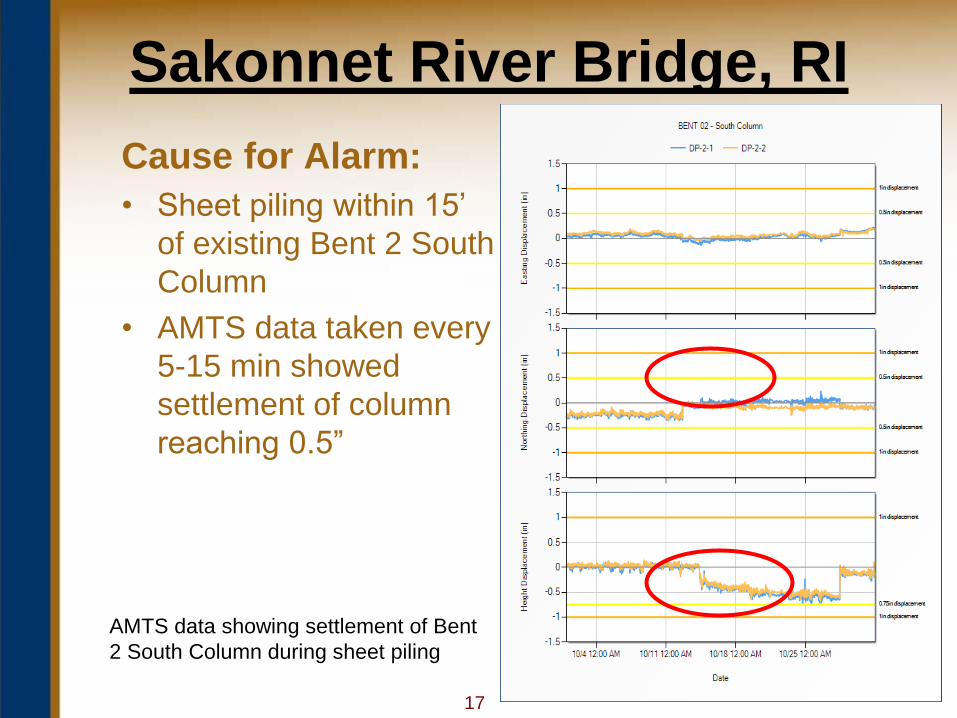
Cause for Alarm:
• Sheet piling within 15’
of existing Bent 2 South
Column
• AMTS data taken every
5-15 min showed
settlement of column
reaching 0.5”
Sakonnet River Bridge, RI
AMTS data showing settlement of Bent
2 South Column during sheet piling
17
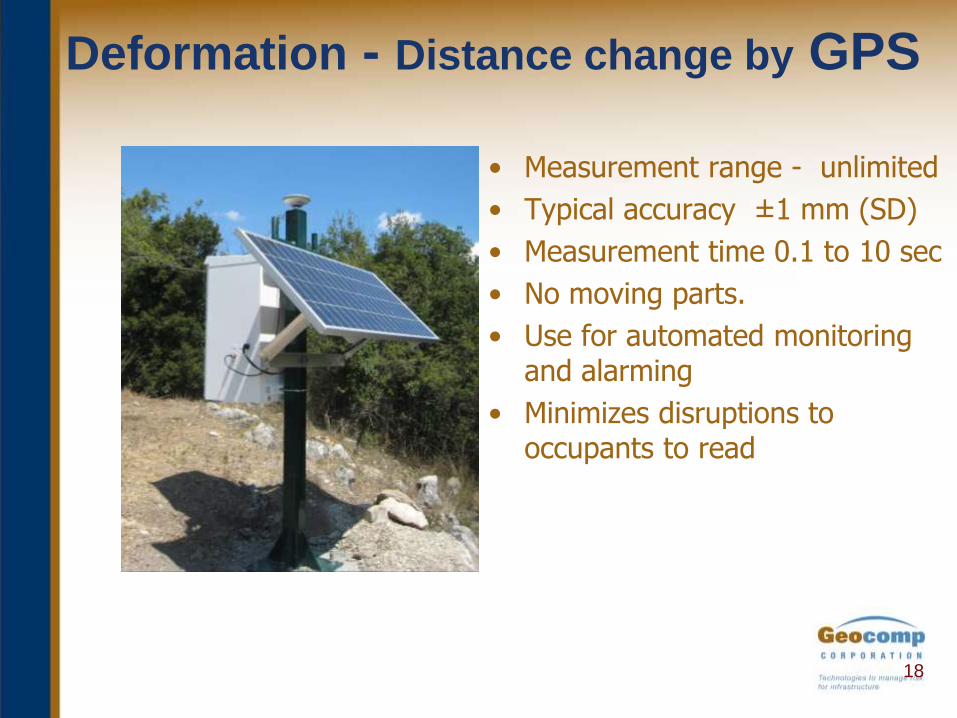
Deformation - Distance change by GPS
• Measurement range - unlimited
• Typical accuracy ±1 mm (SD)
• Measurement time 0.1 to 10 sec
• No moving parts.
• Use for automated monitoring and alarming
• Minimizes disruptions to occupants to read
18
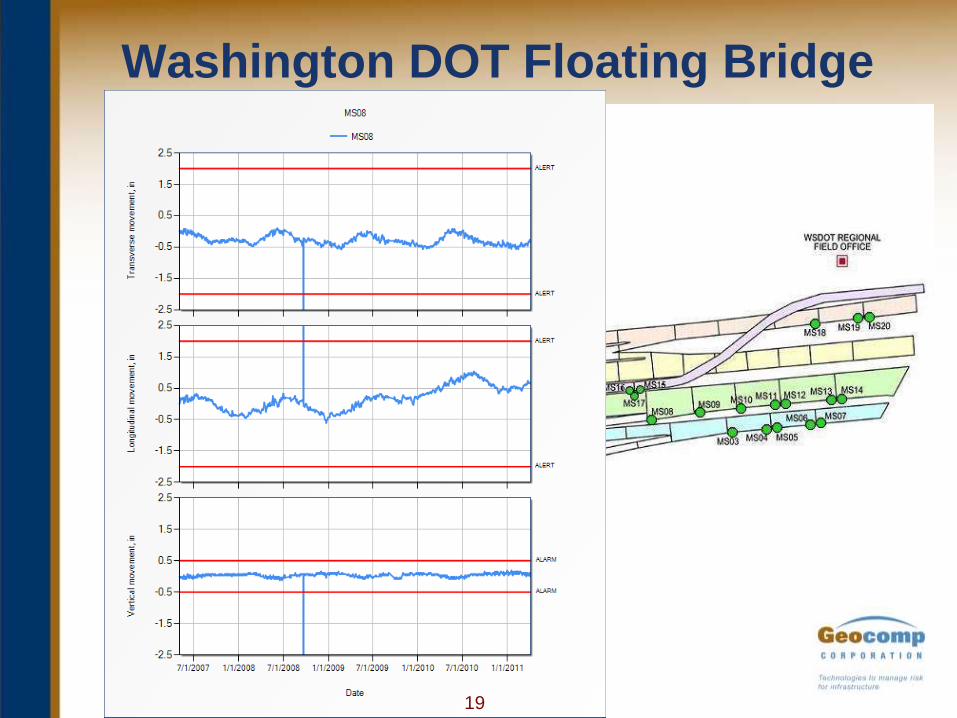
Washington DOT Floating Bridge
19
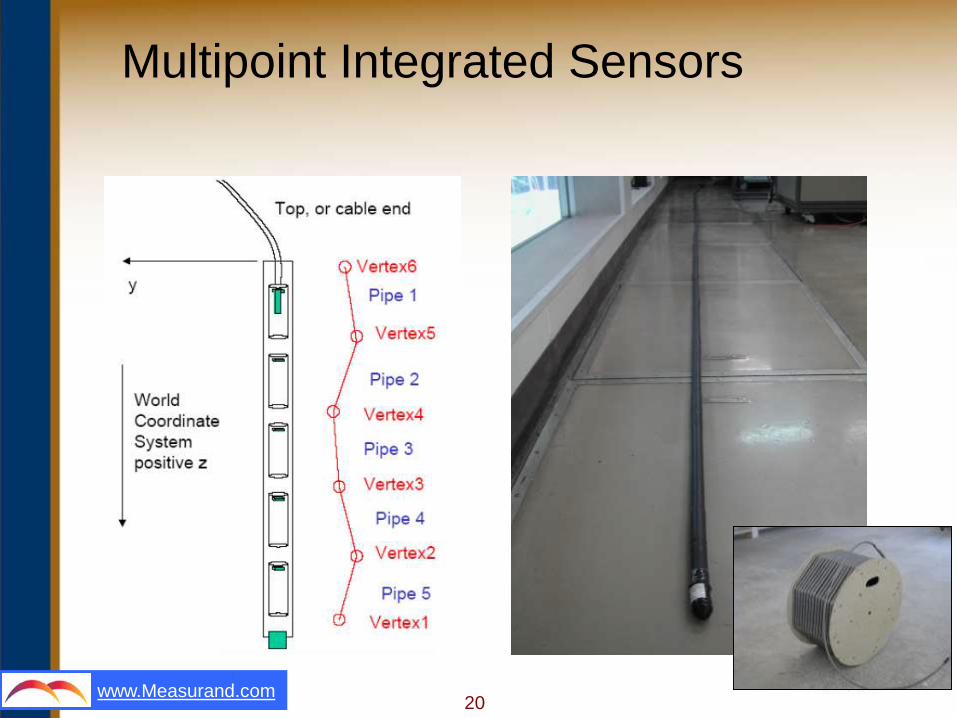
www.Measurand.com
Multipoint Integrated Sensors
20
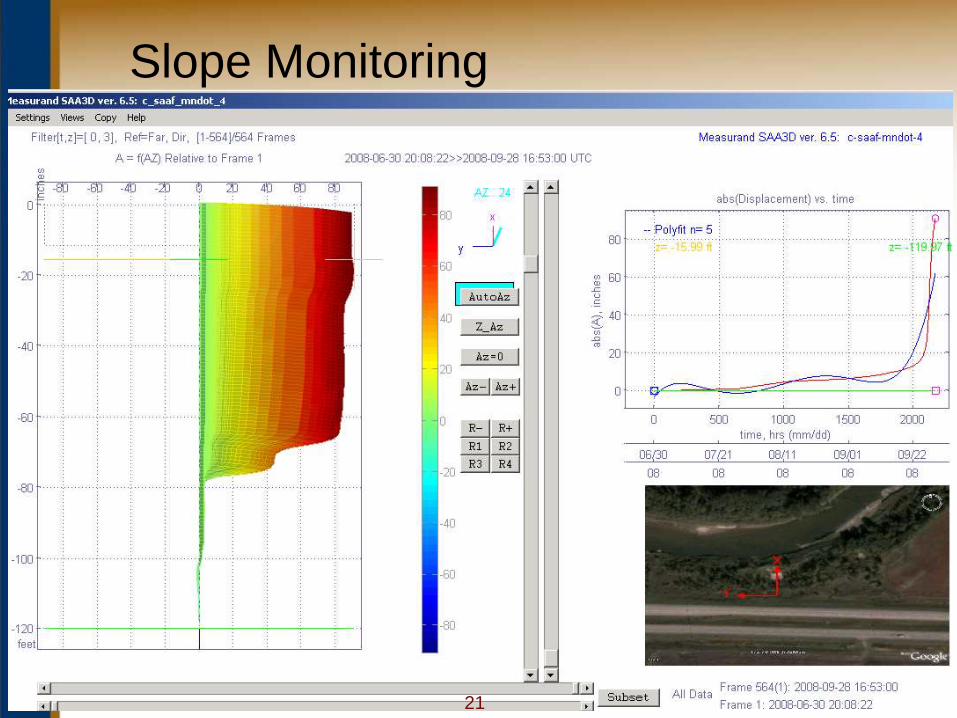
Slope Monitoring
21
Why monitor in real time?
– Failure can occur rapidly with little visible warning, even for an excavation that has been stable for years.
Global instability – shear slide in few hours to weeks
Internal instability – internal erosion – piping
- few hours to years
Other – soil/structural failure - sudden to years
– Failure may be avoided using preventative actions, if we have adequate warning.
– Consequences can be reduced significantly if we have a reliable warning.
– With real-time monitoring we are better able to connect cause and effect.
22
Web-based monitoring
– Deliver evaluated data to those with need to know,
rapidly in form it can be quickly evaluated and
responded to.
– Enabling technologies include:
• Low cost, high speed computers
• Ubiquitous, low cost communications devices
• High data transmission rates
• Reliable, remote data loggers
23
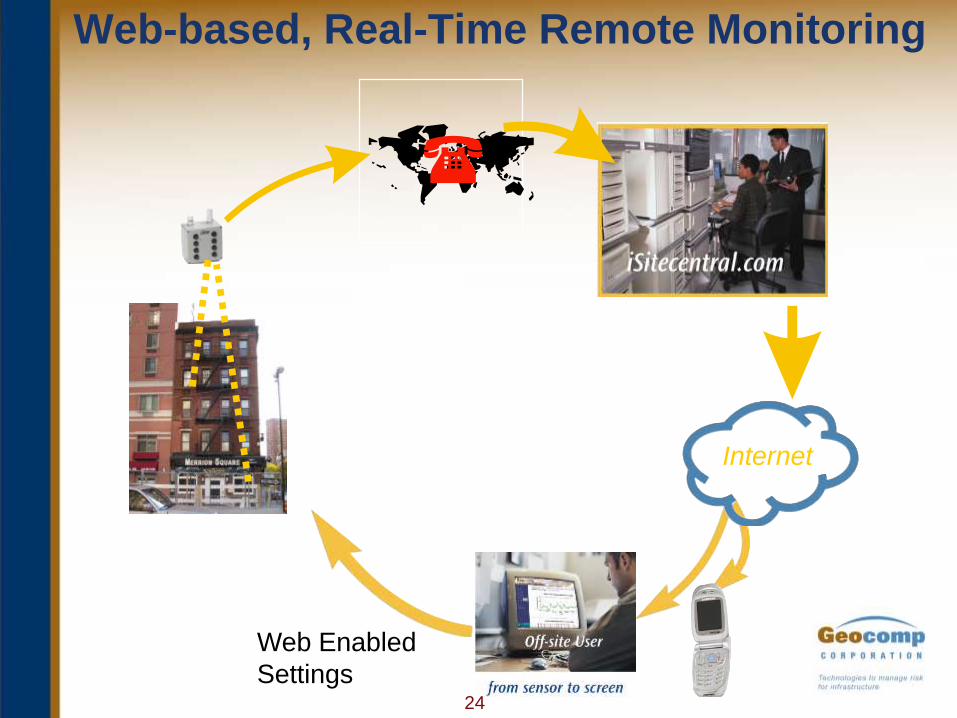
Web Enabled
Settings
Internet
Web-based, Real-Time Remote Monitoring
24
Web-based monitoring
– Components include:
• Sensors
• Signal-to-digital converter
• Communications device
• Communications NETWORK
• Server
• Internet
• User device with Internet accessibility
– Systems are more complex and require more skill
sets than manual approaches
25

Wireless monitoring
• Transferring commands and data without a
wire, i.e. radio frequency signals.
• Serial to modem/landline
• Serial to modem/cell phone
• Serial to modem/satellite
• Serial to radio
• Serial to Ethernet
• Serial to WiFi
• Radio
• Ethernet
• WiFi
27
Communications for automation
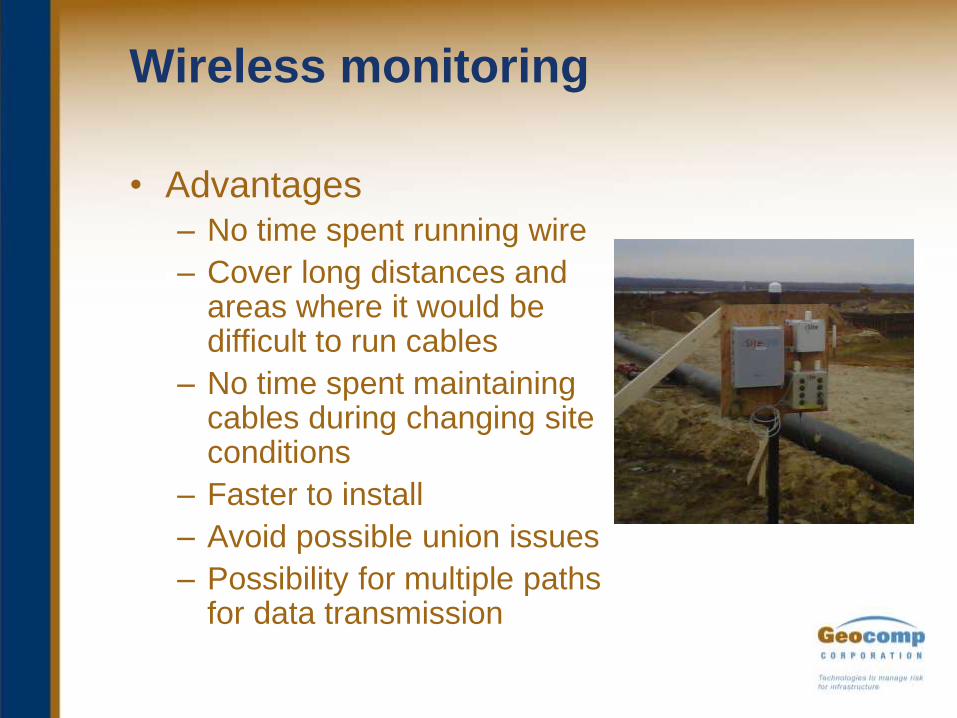
Wireless monitoring
• Advantages– No time spent running wire
– Cover long distances and areas where it would be difficult to run cables
– No time spent maintaining cables during changing site conditions
– Faster to install
– Avoid possible union issues
– Possibility for multiple paths for data transmission
Wireless monitoring
• Pitfalls– Range as spec’d is not often reality- depends on
system components and terrain
– Interference
• Problematic to identify
• Can change through the duration of installation due to new installations
• System management requires time to diagnose
– Technically challenging to integrate with other technologies
– Distributed power needs (no single power location)
– Bandwidth- depends on what you are collecting. Need to size throughput carefully so as not to lose data
– Reliability- systems need capabilities to reboot and reconnect to avoid radio lock-ups that occur
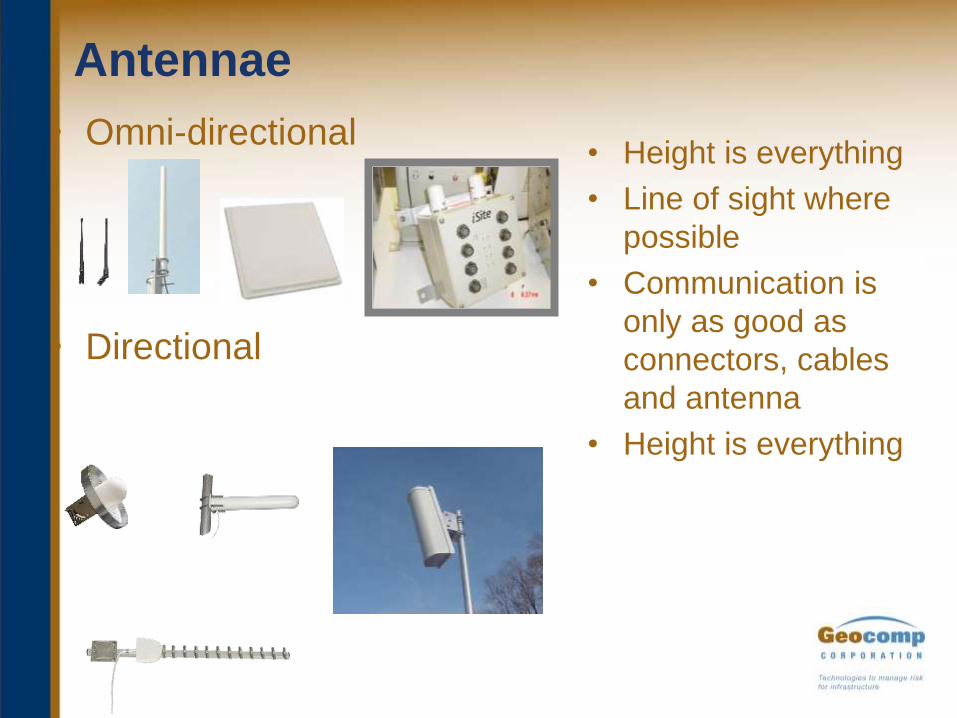
Antennae
• Omni-directional
• Directional
• Height is everything
• Line of sight where
possible
• Communication is
only as good as
connectors, cables
and antenna
• Height is everything

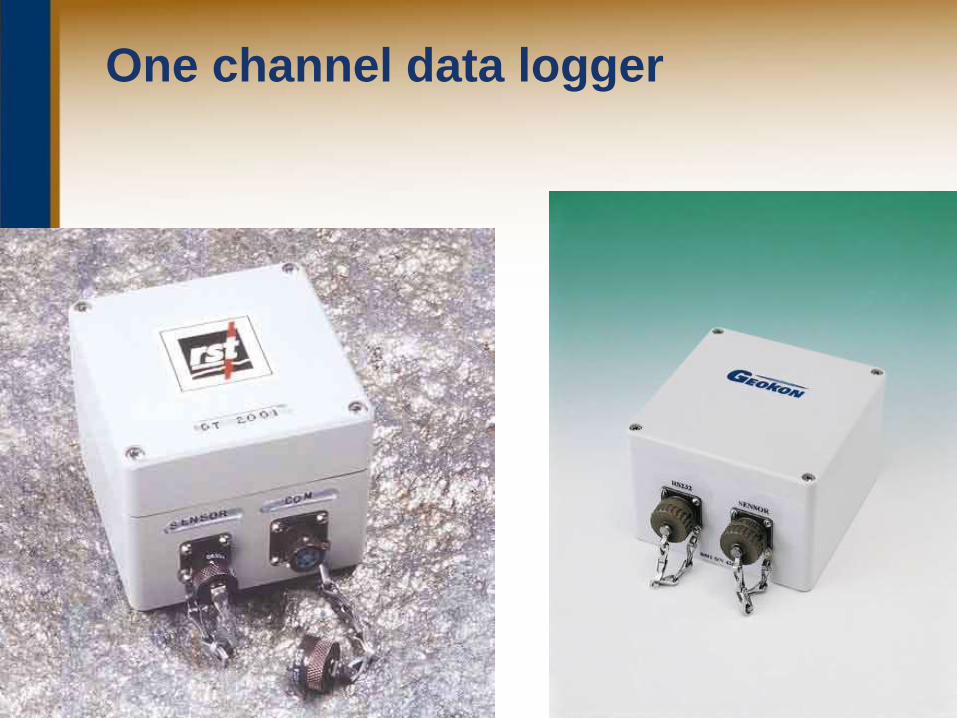
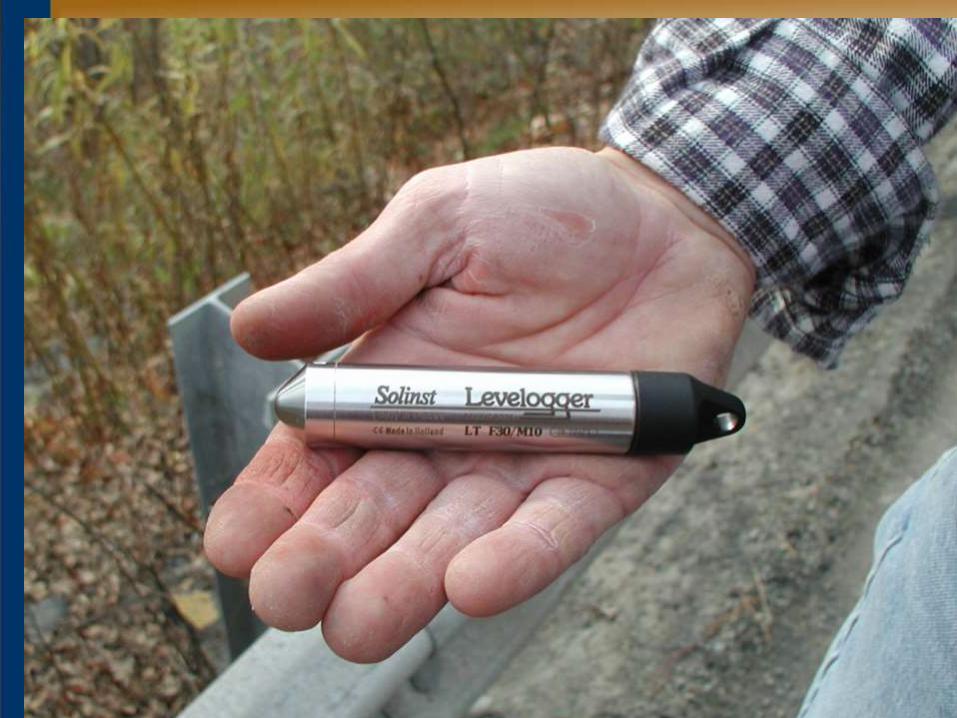
One channel data logger
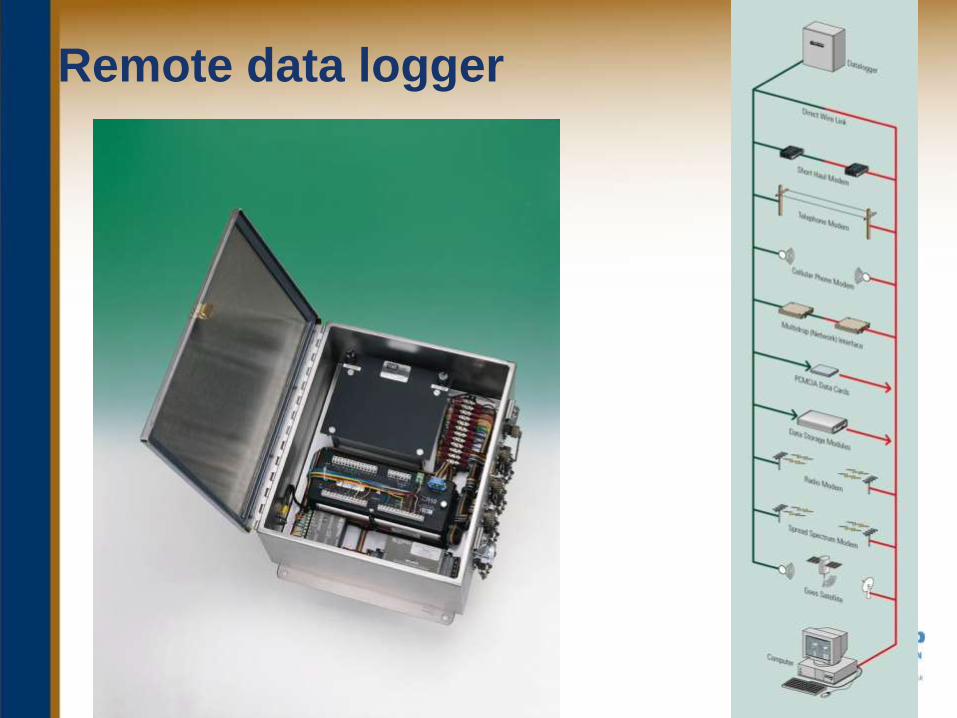
Remote data logger
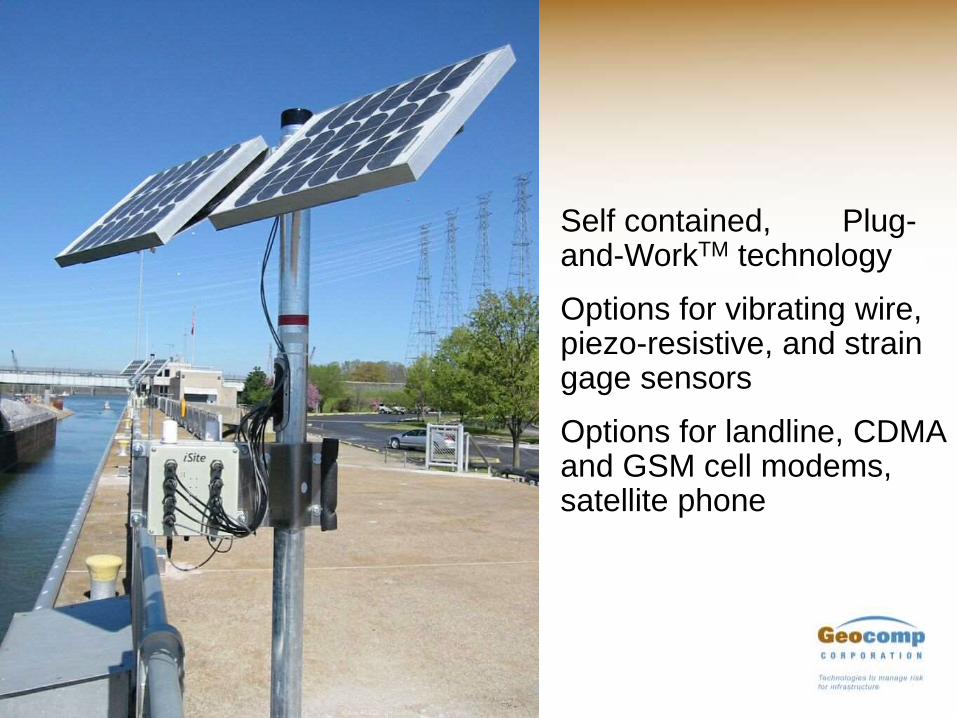
Self contained, Plug-and-WorkTM technology
Options for vibrating wire, piezo-resistive, and strain gage sensors
Options for landline, CDMA and GSM cell modems, satellite phone
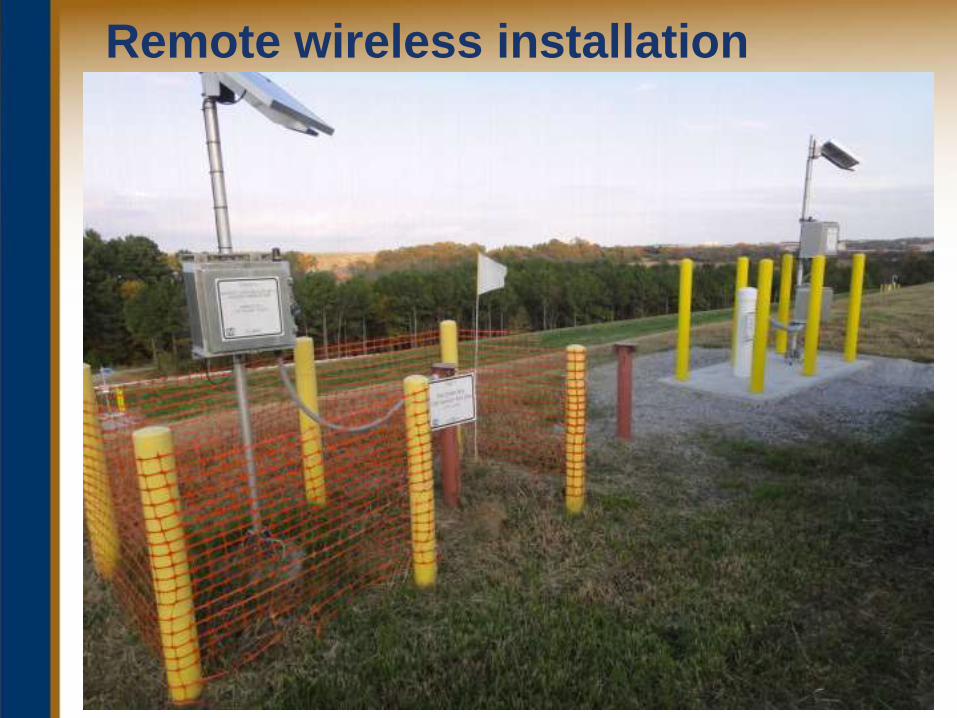
Remote wireless installation
36
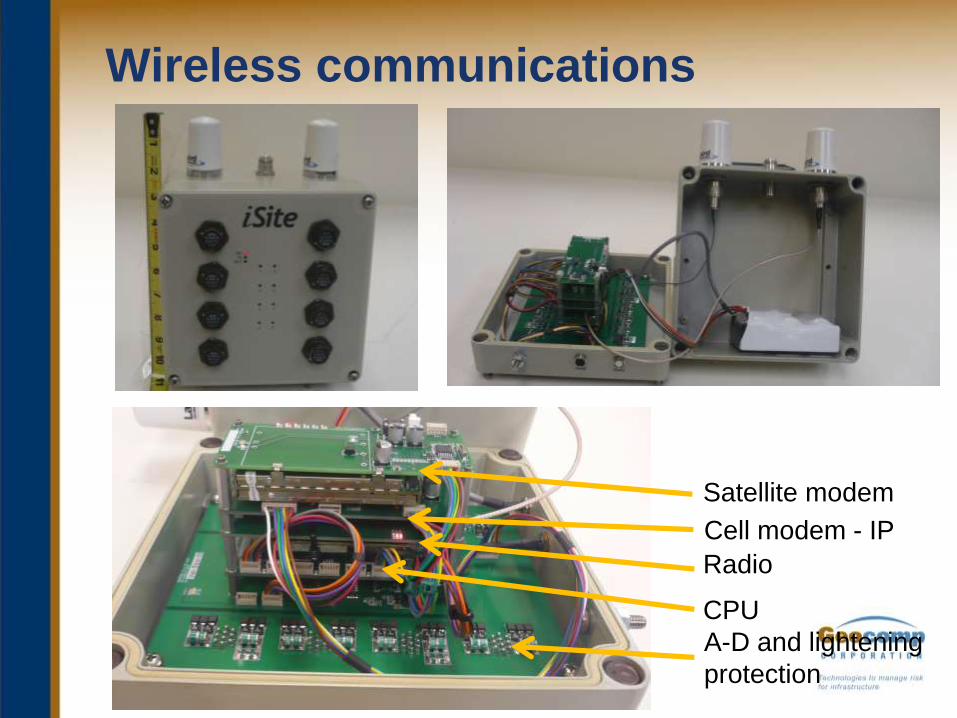
Wireless communications
37
Radio
Satellite modem
Cell modem - IP
CPU
A-D and lightening
protection
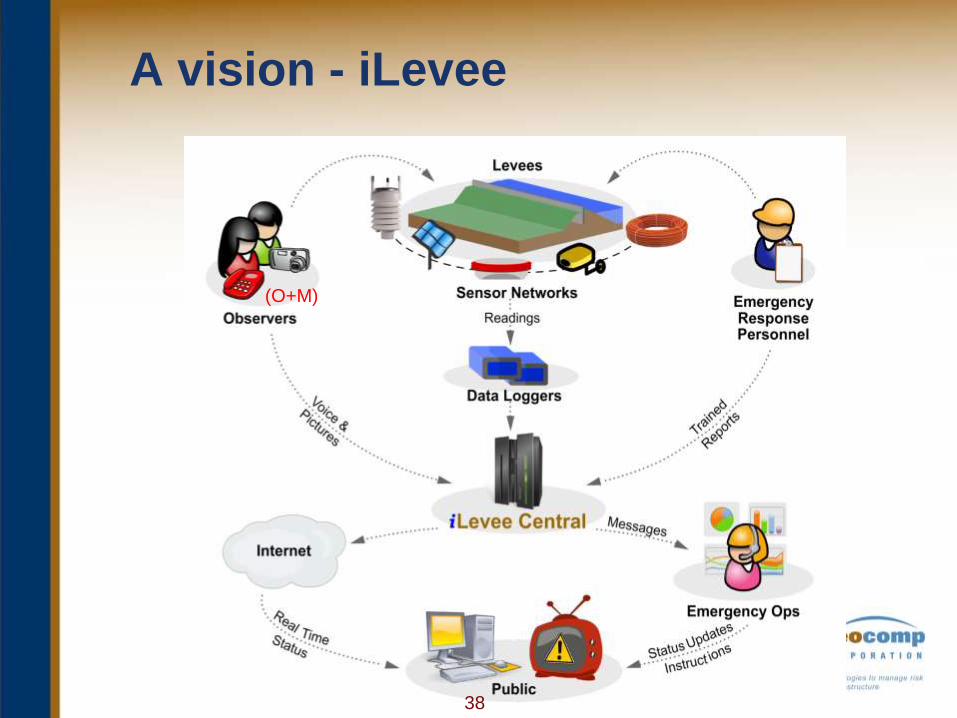
A vision - iLevee
(O+M)
38
Four Use Cases:
1. Normal Operations and Maintenance (O&M);
2. Pre-Event;
3. During Event; and
4. Post Event.
Each use case is developed to have features
and tools useful for flood protection
management before, during or after a storm
event, as well as normal operations.
iLeveeCentral Design
39
• Text
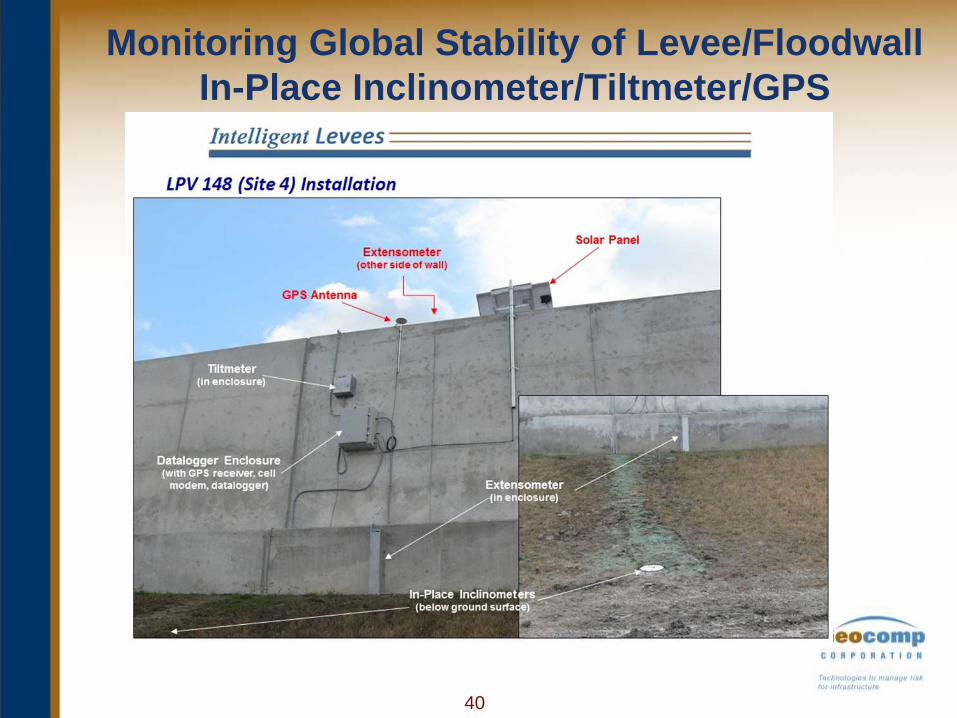
Monitoring Global Stability of Levee/Floodwall
In-Place Inclinometer/Tiltmeter/GPS
40
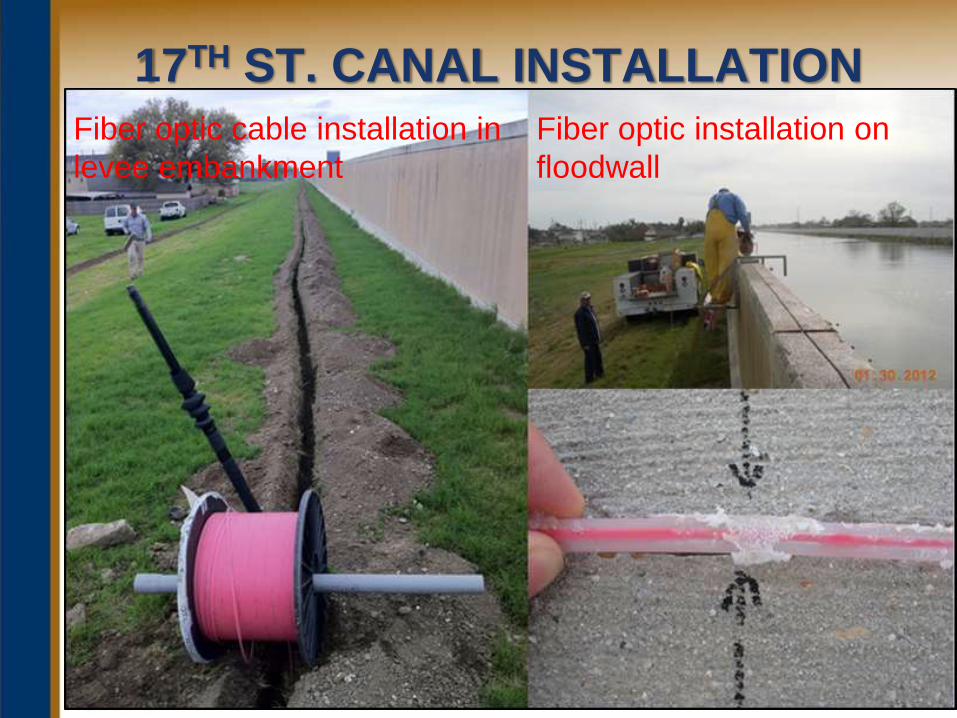
17TH ST. CANAL INSTALLATION
41
Fiber optic cable installation in
levee embankment
Fiber optic installation on
floodwall
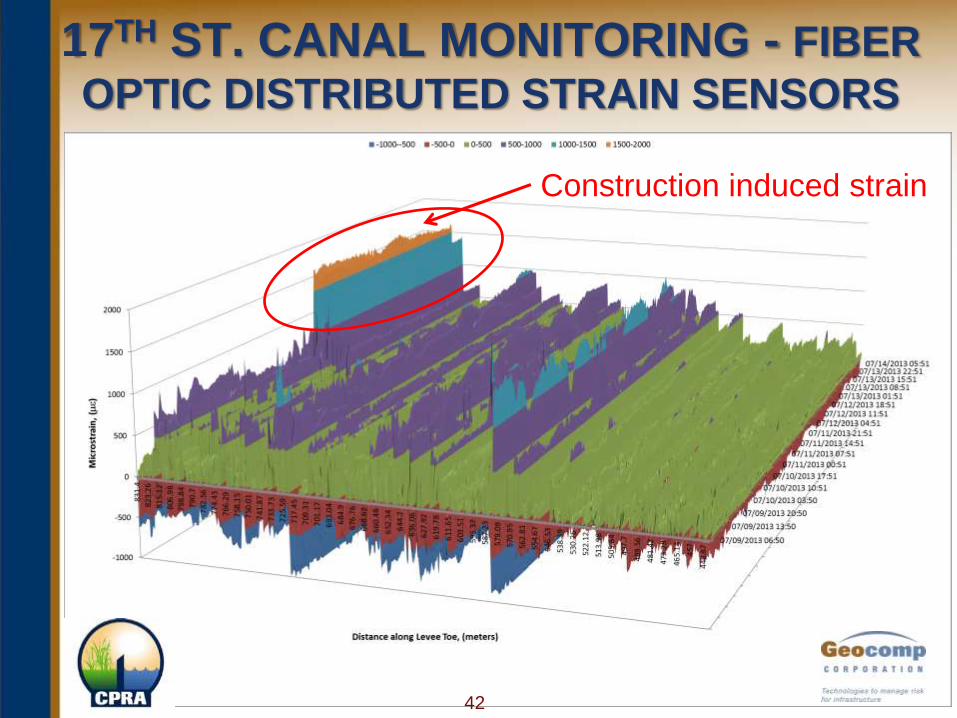
17TH ST. CANAL MONITORING - FIBER
OPTIC DISTRIBUTED STRAIN SENSORS
42
Construction induced strain
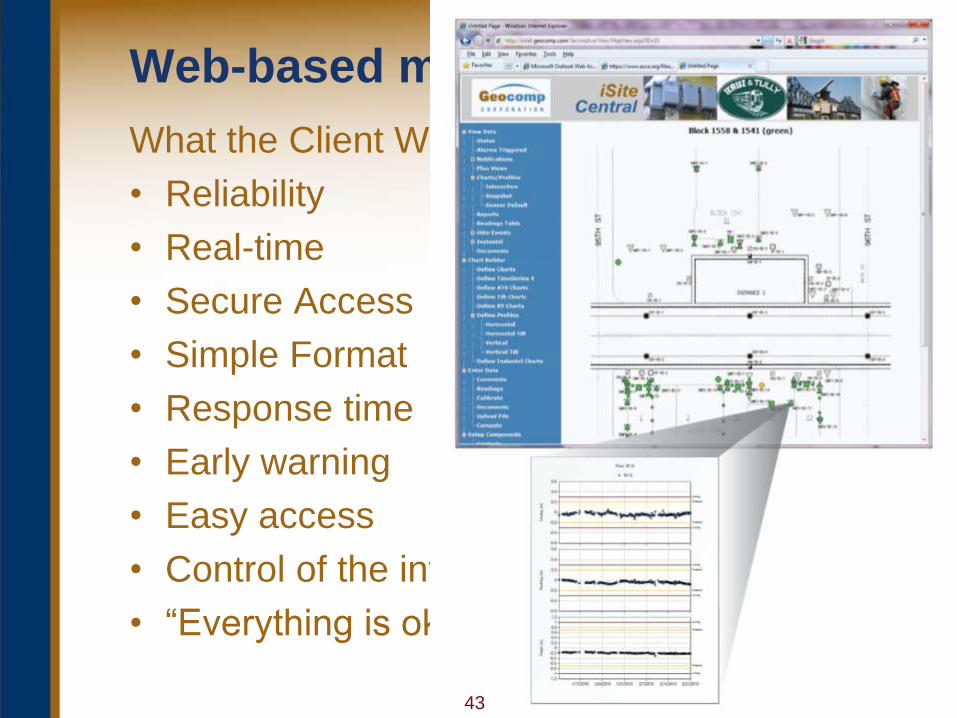
Web-based monitoring
What the Client Wants –
• Reliability
• Real-time
• Secure Access
• Simple Format
• Response time
• Early warning
• Easy access
• Control of the information
• “Everything is ok.”
43
Web-based monitoring - Perspective
• The future of monitoring is the Web and
handheld devices.
• The challenge is to boil large quantities of
information from different sources down to what
is needed in format that is immediately useful.
• The ultimate challenge is using the
measurements to provide more perceived value
– Warnings of unexpected or degrading
performance
– Comfort and confidence
– Process improvement
– Reduce risk
44
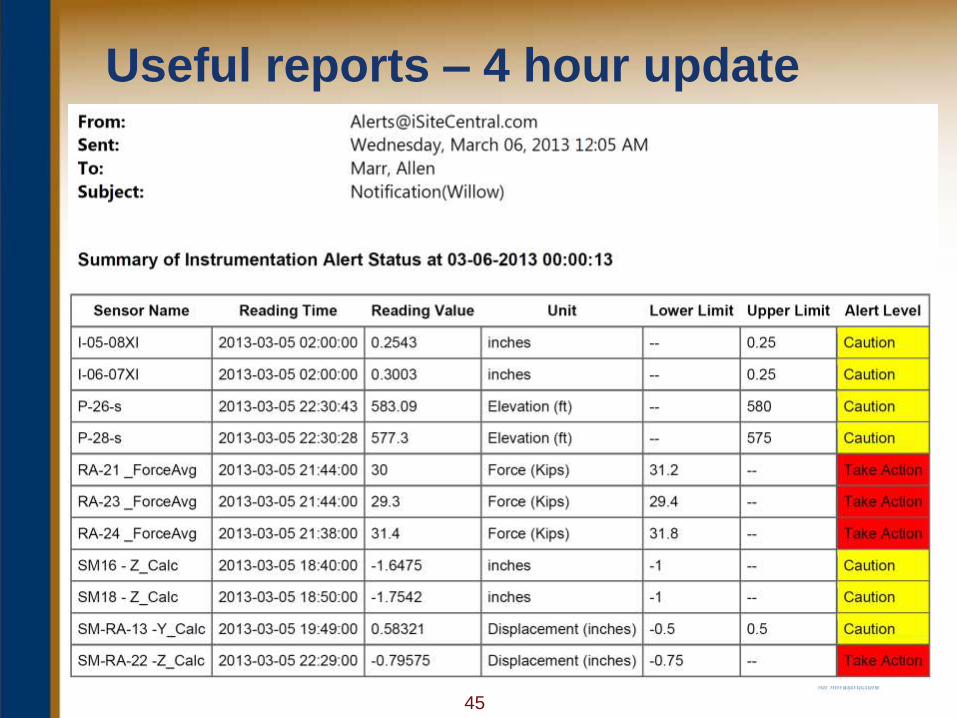
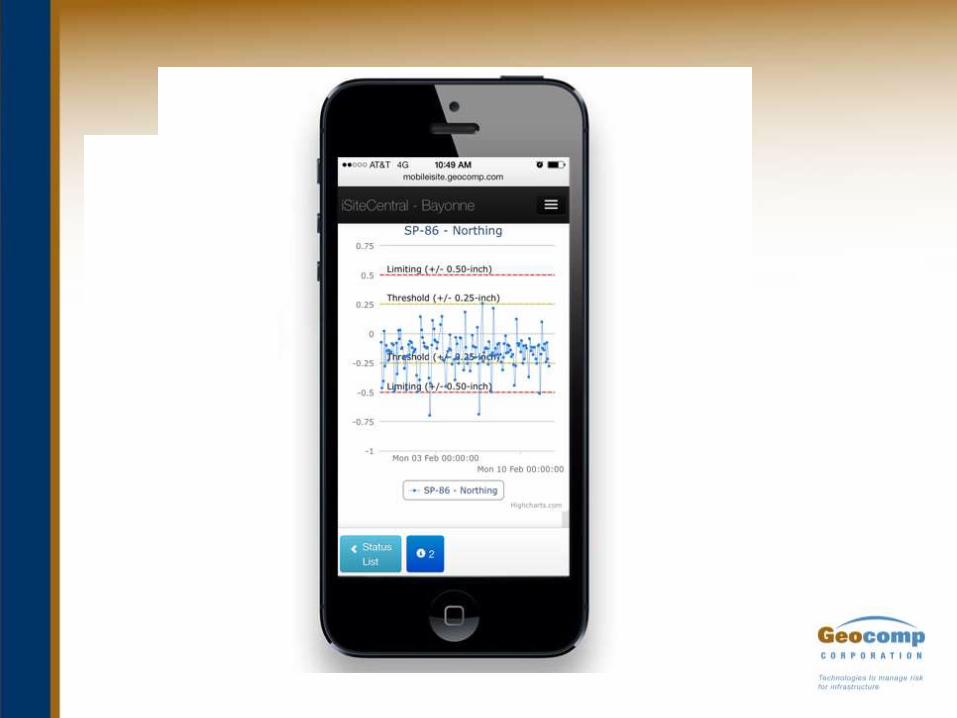
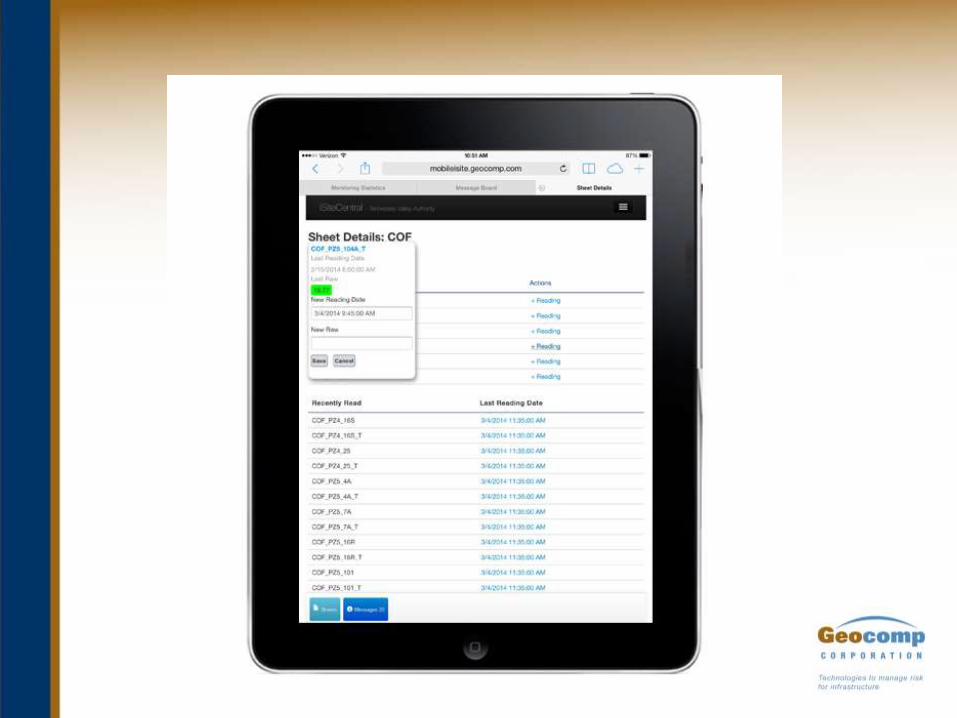
Useful reports – 4 hour update
45
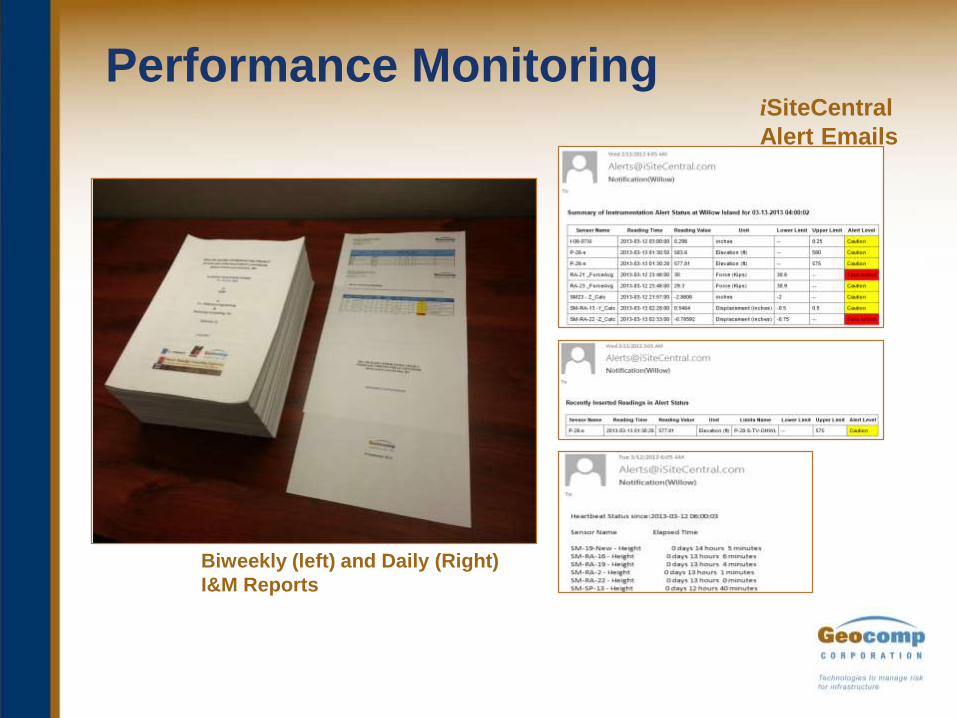
Performance Monitoring
Biweekly (left) and Daily (Right)
I&M Reports
iSiteCentral
Alert Emails
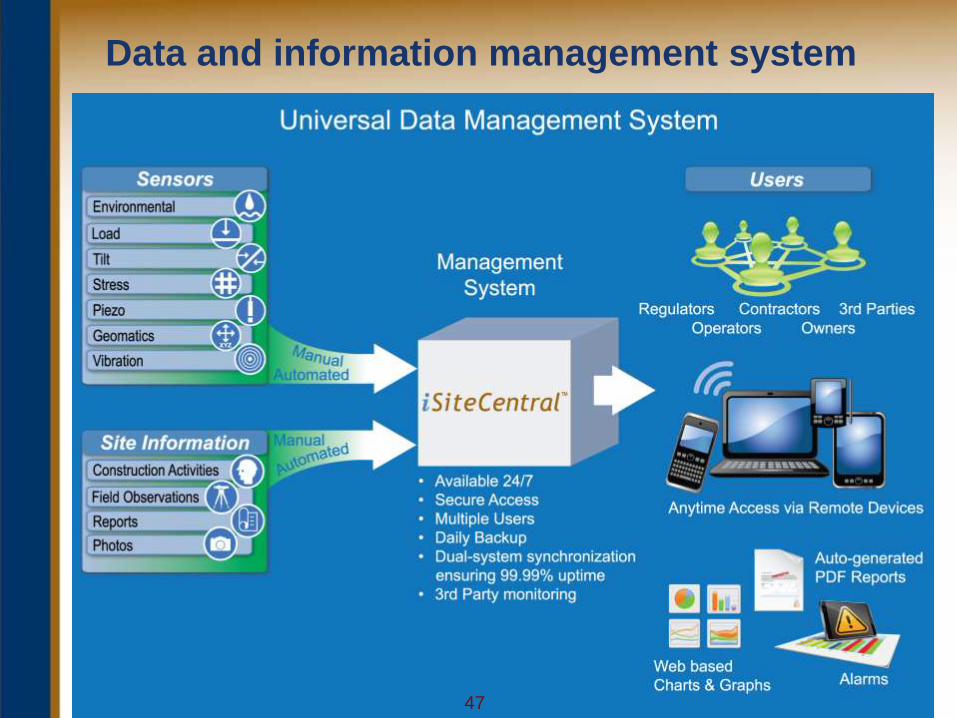
Data and information management system
47

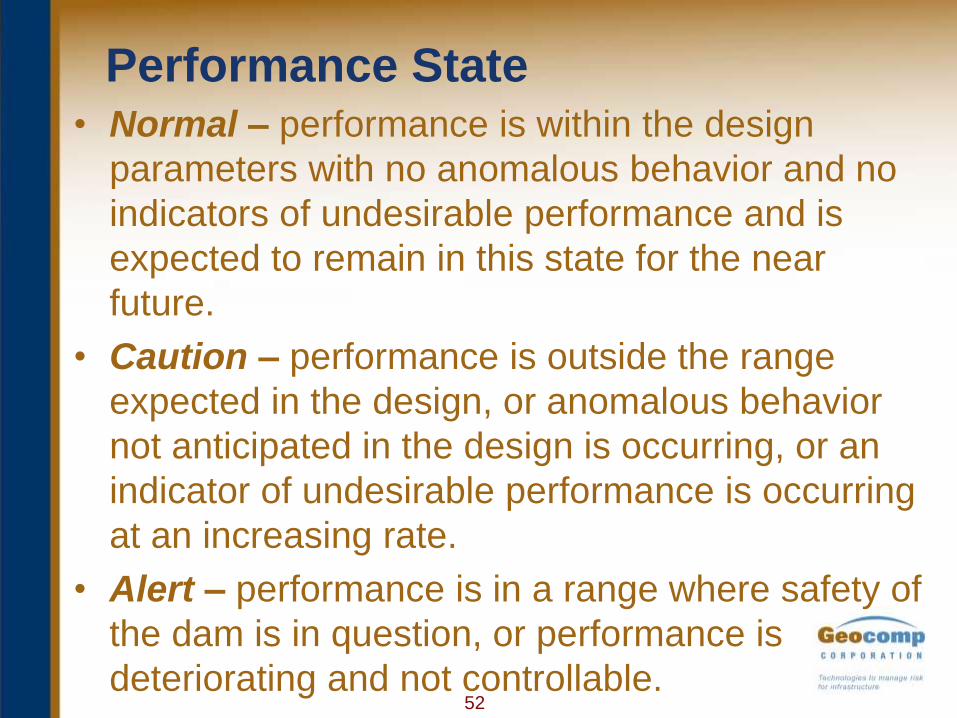
• Normal – performance is within the design
parameters with no anomalous behavior and no
indicators of undesirable performance and is
expected to remain in this state for the near
future.
• Caution – performance is outside the range
expected in the design, or anomalous behavior
not anticipated in the design is occurring, or an
indicator of undesirable performance is occurring
at an increasing rate.
• Alert – performance is in a range where safety of
the dam is in question, or performance is
deteriorating and not controllable.52
Performance State
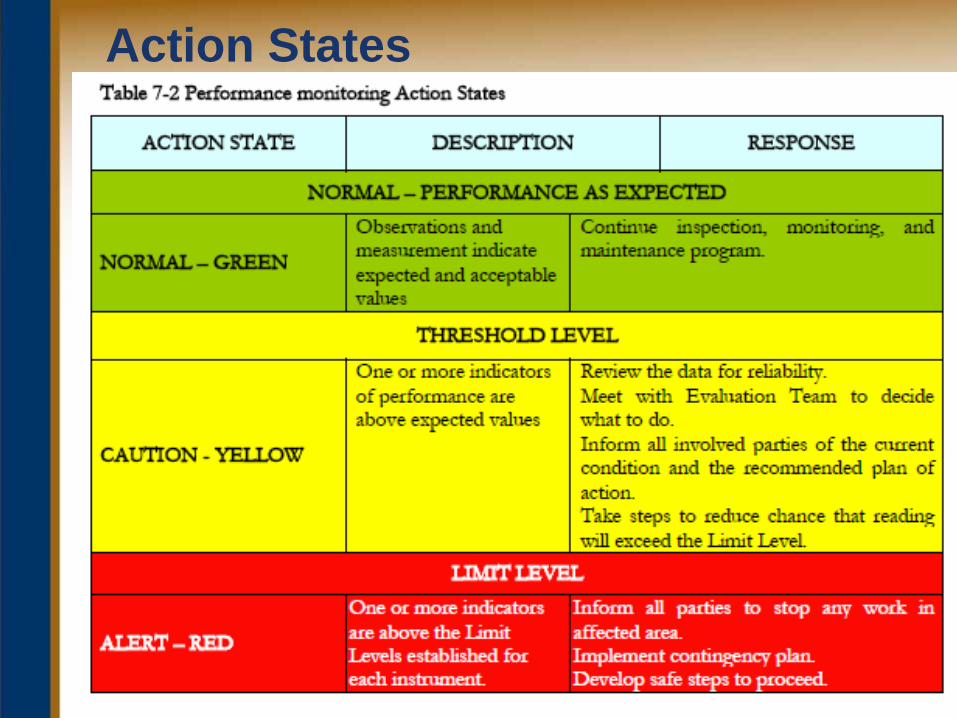
Action States
• Every instrument should have a purpose –
answer a question or quantify an unknown
• I&M should follow a systematic approach
• All details of the systematic approach must be
followed.
• Alert levels and action plans must be
developed and used.
• Contingency plans must exist for failure
modes that have potential for large
consequences.
Marr Geo-Congress 2013
Guidance for success
54
1. Identify what questions need answering.
2. Identify what measurements can and should be
made.
3. Design appropriate monitoring system.
4. Plan installation, calibration, maintenance and
data management.
5. Prepare and update budget.
6. Procure, test, install and verify instruments.
7. Calibrate and maintain instruments and readouts.
8. Collect, process and evaluate data.
9. Interpret and report results quickly.
10.Take action when required. (adapted from Dunnicliff.)
Steps of a Systematic Approach
55
• Detect sudden changes quickly.
• Better detect and define trends early for
more accurate interpretation of data.
• Detect daily and seasonal changes due to
environmental effects so:
– These effects help show data are valid
– These periodic changes can be defined and
removed from the data to better see the primary
changes.
• More data that are reliable and believable
creates a higher degree of confidence in the
information so quick action can be taken.
Automation with readings several
times per day.
56
Web-based monitoring
– Deliver evaluated data to those with need to know,
rapidly in form it can be quickly evaluated and
responded to.
– Enabling technologies include:
• Low cost, high speed computers
• Ubiquitous, low cost communications devices
• High data transmission rates
• Reliable, remote data loggers
– This is undoubtedly one area of big change over
next 20 years.
57
Conclusions• Heavy civil construction involves substantial risk due to
uncertainties and unknowns.
• Effective monitoring programs can help reduce risk and save money.
• Effective monitoring programs need to be real-time.
• New technologies (computers, communications, sensors) make real-time monitoring technically and economically feasible.
• Success requires systematic approach with a dedicated team.
• Contingency plans and their timely implementation are essential for success.
58