Embed Size (px)
Citation preview
IOWA Workforce Development
Manufacturing
2019 IOWA Industry Profile
Executive Summary
https://www.iowalmi.gov/qcew
In 2018, the Manufacturing sector comprised 14.4 percent of covered public and private employment in Iowa with 222,628 employees. This sector is the second-largest by employment in the state after Health Care and Social Assistance. The sector had an average annual wage of $60,240 in 2018, which was 26.8 percent greater than the statewide average of $47,511. Employment in this sector dropped significantly between 2008–10. This decrease is due in large part to the Great Recession, which caused employment to fall from 227,403 in 2008 to 200,782 in 2010. Since the recession, employment in this sector has recovered somewhat, growing by 10.8 percent since 2010. The average wage in the sector has grown every year since 2008, including the years during the recession. In 2008, the average wage in Manufacturing was $47,172; this figure increased to $60,240 in 2018, a 27.7 percent gain. Men dominate this sector, representing 72.2 percent of employment.
Manufacturing
Iowa Industry Profile
https://www.iowalmi.gov/qcew
What is Manufacturing? The Manufacturing sector is comprised of firms engaged in mechanical, physical or chemical transformation of materials, substances, or components into new products. Firms are often described as materials-handling equipment. However, firms that transform materials or substances into new products by hand or in the worker’s home and those engaged in selling to the general public products made on the same premises which they are sold, such as bakeries, candy stores, and custom tailors, may also be included in this sector.
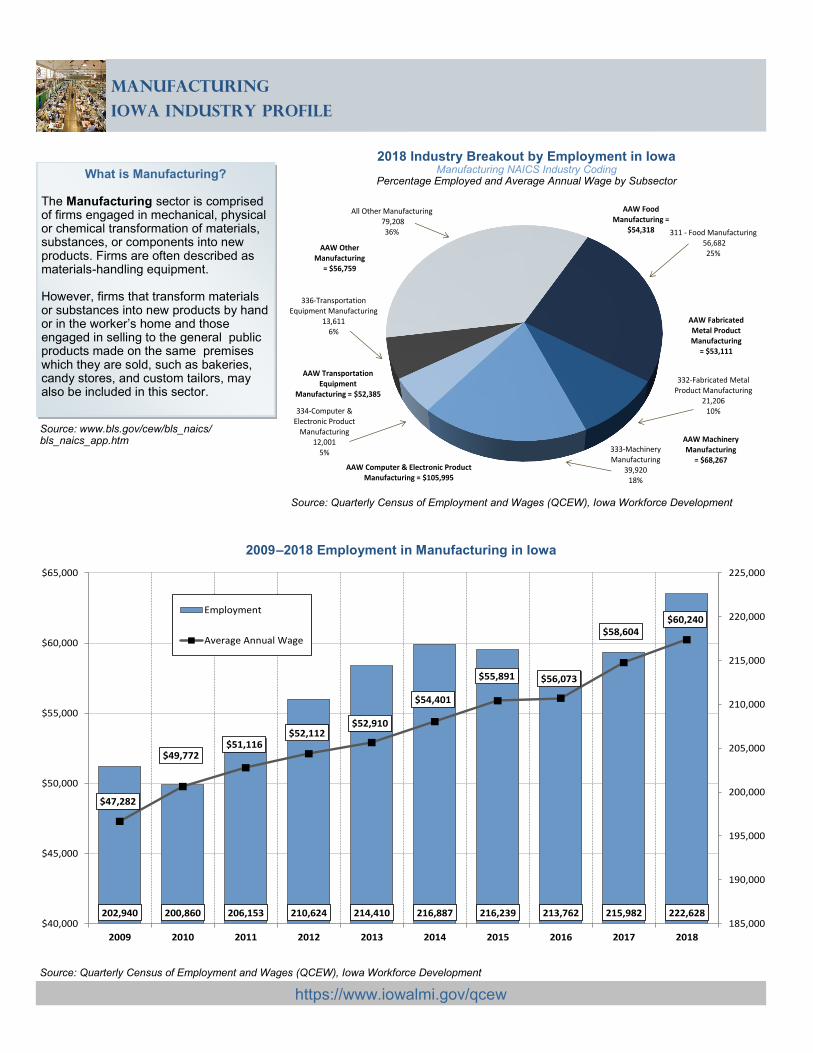
2018 Industry Breakout by Employment in Iowa Manufacturing NAICS Industry Coding
Percentage Employed and Average Annual Wage by Subsector
Source: www.bls.gov/cew/bls_naics/bls_naics_app.htm
Source: Quarterly Census of Employment and Wages (QCEW), Iowa Workforce Development
202,940 200,860 206,153 210,624 214,410 216,887 216,239 213,762 215,982 222,628
$47,282
$49,772$51,116
$52,112$52,910
$54,401
$55,891 $56,073
$58,604 $60,240
185,000
190,000
195,000
200,000
205,000
210,000
215,000
220,000
225,000
$40,000
$45,000
$50,000
$55,000
$60,000
$65,000
2009 2010 2011 2012 2013 2014 2015 2016 2017 2018
Employment
Average Annual Wage
2009–2018 Employment in Manufacturing in Iowa
Source: Quarterly Census of Employment and Wages (QCEW), Iowa Workforce Development
AAW = Average Annual Wage
311 - Food Manufacturing56,682 25%
332-Fabricated Metal Product Manufacturing
21,20610%
333-Machinery Manufacturing
39,92018%
334-Computer & Electronic Product
Manufacturing12,001
5%
336-Transportation Equipment Manufacturing
13,6116%
All Other Manufacturing79,208 36%
AAW Food Manufacturing =
$54,318
AAW Fabricated Metal ProductManufacturing
= $53,111
AAW Computer & Electronic Product Manufacturing = $105,995
AAW Transportation Equipment
Manufacturing = $52,385
AAW Other Manufacturing
= $56,759
AAW MachineryManufacturing
= $68,267
Manufacturing
Iowa Industry Profile
https://www.iowalmi.gov/qcew
Source: Quarterly Census of Employment and Wages (QCEW), Iowa Workforce Development
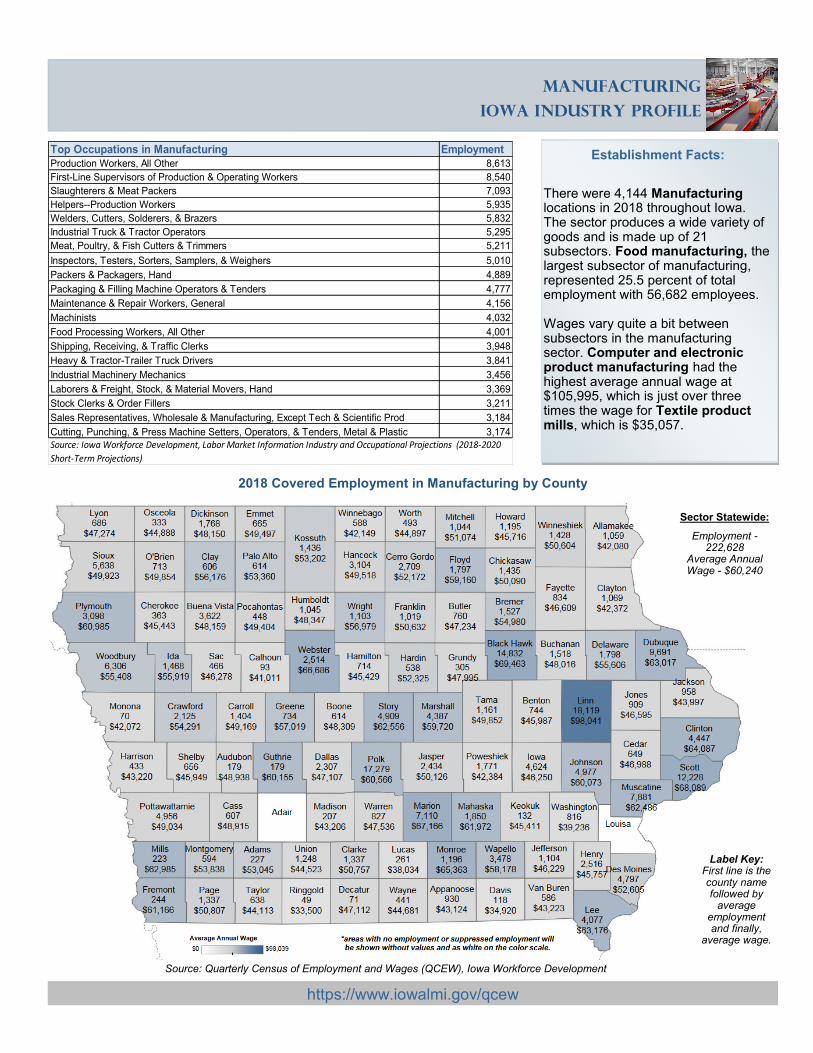
2018 Covered Employment in Manufacturing by County
Label Key: First line is the county name followed by
average employment and finally,
average wage.
Sector Statewide:
Employment - 222,628
Average Annual Wage - $60,240
There were 4,144 Manufacturing locations in 2018 throughout Iowa. The sector produces a wide variety of goods and is made up of 21 subsectors. Food manufacturing, the largest subsector of manufacturing, represented 25.5 percent of total employment with 56,682 employees. Wages vary quite a bit between subsectors in the manufacturing sector. Computer and electronic product manufacturing had the highest average annual wage at $105,995, which is just over three times the wage for Textile product mills, which is $35,057.
Establishment Facts: Top Occupations in Manufacturing Employment
Production Workers, All Other 8,613
First-Line Supervisors of Production & Operating Workers 8,540
Slaughterers & Meat Packers 7,093
Helpers--Production Workers 5,935
Welders, Cutters, Solderers, & Brazers 5,832
Industrial Truck & Tractor Operators 5,295
Meat, Poultry, & Fish Cutters & Trimmers 5,211
Inspectors, Testers, Sorters, Samplers, & Weighers 5,010
Packers & Packagers, Hand 4,889
Packaging & Filling Machine Operators & Tenders 4,777
Maintenance & Repair Workers, General 4,156
Machinists 4,032
Food Processing Workers, All Other 4,001
Shipping, Receiving, & Traffic Clerks 3,948
Heavy & Tractor-Trailer Truck Drivers 3,841
Industrial Machinery Mechanics 3,456
Laborers & Freight, Stock, & Material Movers, Hand 3,369
Stock Clerks & Order Fillers 3,211
Sales Representatives, Wholesale & Manufacturing, Except Tech & Scientific Prod 3,184
Cutting, Punching, & Press Machine Setters, Operators, & Tenders, Metal & Plastic 3,174
Source: Iowa Workforce Development, Labor Market Information Industry and Occupational Projections (2018-2020
Short-Term Projections)
Manufacturing
Iowa Industry Profile
Iowa Workforce Development, Employment Statistics Bureau
1000 E Grand Ave Des Moines, IA 50319
800-532-1249 Fax: 515-281-8195
[email protected] www.iowaworkforcedevelopment.gov
Equal opportunity employer/program. Auxiliary aids and services are available
upon request to individuals with disabilities.
TTY 515-281-4748 1-800-831-1399
Contact Information
https://www.iowalmi.gov/qcew
Source: Quarterly Census of Employment and Wages (QCEW), Bureau of Labor Statistics
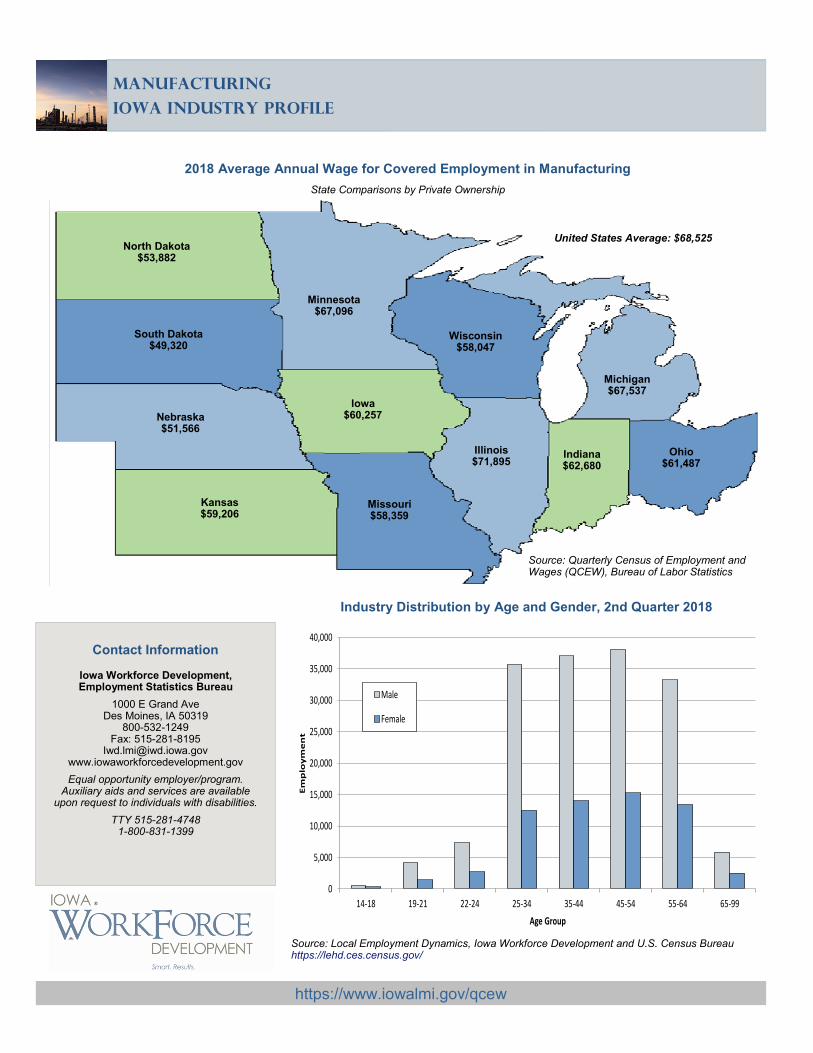
2018 Average Annual Wage for Covered Employment in Manufacturing
State Comparisons by Private Ownership
Nebraska $51,566
Industry Distribution by Age and Gender, 2nd Quarter 2018
0
5,000
10,000
15,000
20,000
25,000
30,000
35,000
40,000
14-18 19-21 22-24 25-34 35-44 45-54 55-64 65-99
Em
plo
ym
en
t
Age Group
Male
Female
Source: Local Employment Dynamics, Iowa Workforce Development and U.S. Census Bureau https://lehd.ces.census.gov/
North Dakota $53,882
United States Average: $68,525
Kansas $59,206
Iowa $60,257
Minnesota $67,096
South Dakota $49,320
Wisconsin $58,047
Illinois $71,895
Indiana $62,680
Michigan $67,537
Ohio $61,487
Missouri $58,359