Embed Size (px)
Citation preview
IOT-BASED COMMUNITY-LED AIR QUALITY MONITORING SYSTEM
THEAH SOON AIK
This Report is Submitted In Partial Fulfilment of Requirement for the Bachelor
Degree of Electronic Engineering (Computer Engineering) with Honours
Faculty of Electronic and Computer Engineering
Universiti Teknikal Malaysia Melaka
June 2017
iii
iv
v
Special dedicate:
To my beloved family for their genuine love, prayers and encouragements. Then to
my supervisors and co-supervisor who guide and give moral support and my entire
friend for your help and support throughout project.
vi
ACKNOWLEDGEMENT
I would like to express my deep sense of thanks and gratitude and to my
supervisor Dr. Soo Yew Guan. His dedication and keen interest above all his
overwhelming attitude to help his students had been solely and mainly responsible for
completing my work. His scholarly advice and scientific approach have helped me to
a very great extent to accomplish my task.
Not forgetting, I owe a deep sense of gratitude to my co-supervisor Professor
Madya Dr. Nurulfajar Bin Abd Manap for his inspirations and timely suggestion have
enable me to finish my thesis.
Lastly, my special thanks to my family and friend for their support and
encouragement that lead me to complete this project.
vii
ABSTRACT
Air pollution is the introduction of impurities such as solid particles and gases
into the atmosphere. Current air monitoring station is limited in number causing less
information on current air quality. This project is to develop a system to monitor air
quality in real time for a decent number of places using WemosD1 Mini and dust
sensor Sharp GP2Y10. Moreover, a Cloud-based platform that manages data coming
from air quality sensors is developed. Lastly, a HTML webpage will display a Google
map with markers to indicate sensor location and also data with respective to the
location. There are 6 marker colors whereby each color will represent different level
of air pollution.
viii
ABSTRAK
Pencemaran udara adalah pengenalan kekotoran seperti zarah pepejal dan gas
ke atmosfera. Stesen pemantauan udara semasa terhad dalam bilangan menyebabkan
kekurangan maklumat kualiti udara semasa. Projek ini adalah untuk membinakan satu
sistem untuk memantau kualiti udara dalam masa sebenar di bilangan tempat yang
mencukupi dengan menggunakan WemosD1 Mini dan sensor debu Sharp GP2Y10.
Selain itu, platform berasaskan awan akan menguruskan data yang diukur dari sensor
kualiti udara yang telah dibinakan. Akhir sekali, halaman web HTML akan
memaparkan peta Google dengan penanda untuk menunjukkan lokasi sensor dan juga
data masing-masing. Terdapat 6 warna penanda di mana setiap warna akan mewakili
tahap pencemaran udara yang berbeza.
ix
TABLE OF CONTENT
CHAPTER TITLE PAGE
PROJECT TITLE i
DECLARATION iii
DEDICATION v
ACKNOWLEDGEMENT vi
ABSTRACT vii
ABSTRAK viii
TABLE OF CONTENT ix
LIST OF TABLES xii
LIST OF FIGURES xiii
LIST OF ABBREVIATIONS xv
LIST OF APPENDIX xvi
I INTRODUCTION
1.1 Project Overview 1
1.2 Objective 2
1.3 Problem Statement 3
1.4 Scope 3
1.5 Project Workflow 4
1.6 Report Structure 5
II LITERATURE REVIEW 6
2.1 Air Pollution 6
x
2.2 Internet of Things 7
2.3 Existing Air Pollution Monitoring System or Application
8
2.4 Summary 12
2.5 Theory 14
2.5.1 Sharp GP2Y10 Dust Sensor 14
III METHODOLOGY 16
3.1 Project Implementation 16
3.1.1 Creating new data stream/database in Sparkfun Server
17
3.1.2 Hosting webpage online using Microsoft Azure
20
3.1.3 Flowchart of Project 23
3.1.3.1 WemosD1 Mini 23
3.1.3.2 HTML Webpage 25
3.1.4 Experimental Set-up 26
IV RESULT AND ANALYSIS 29
4.1 Hardware 29
4.1.1 Prototype 29
4.1.2 Calibrating the sensor 33
4.2 Software 34
4.2.1 Experimental Results 34
4.2.2 Sparkfun Online Database 37
4.2.2.1 Connecting to Access Point and Data Sparkfun Server
37
xi
4.2.2.2 Data received at the server 38
4.2.3 HTML Webpage 39
4.3 Analysis 40
4.3.1 Hardware (Power Consumption) 40
4.3.2 Software (Spider Web Chart in HTML) 43
4.3.2.1 Taman Emas 6 44
4.3.2.2 Pangsapuri Bukit Beruang Permai
46
4.3.2.3 Taman Tasik Utama 47
4.3.2.4 Muzaffar Heights 48
V CONCLUSION AND FUTURE WORK 50
5.1 Conclusion 50
5.2 Future Work 50
REFERENCES 51
xii
LIST OF TABLES
NO. TITLE PAGE
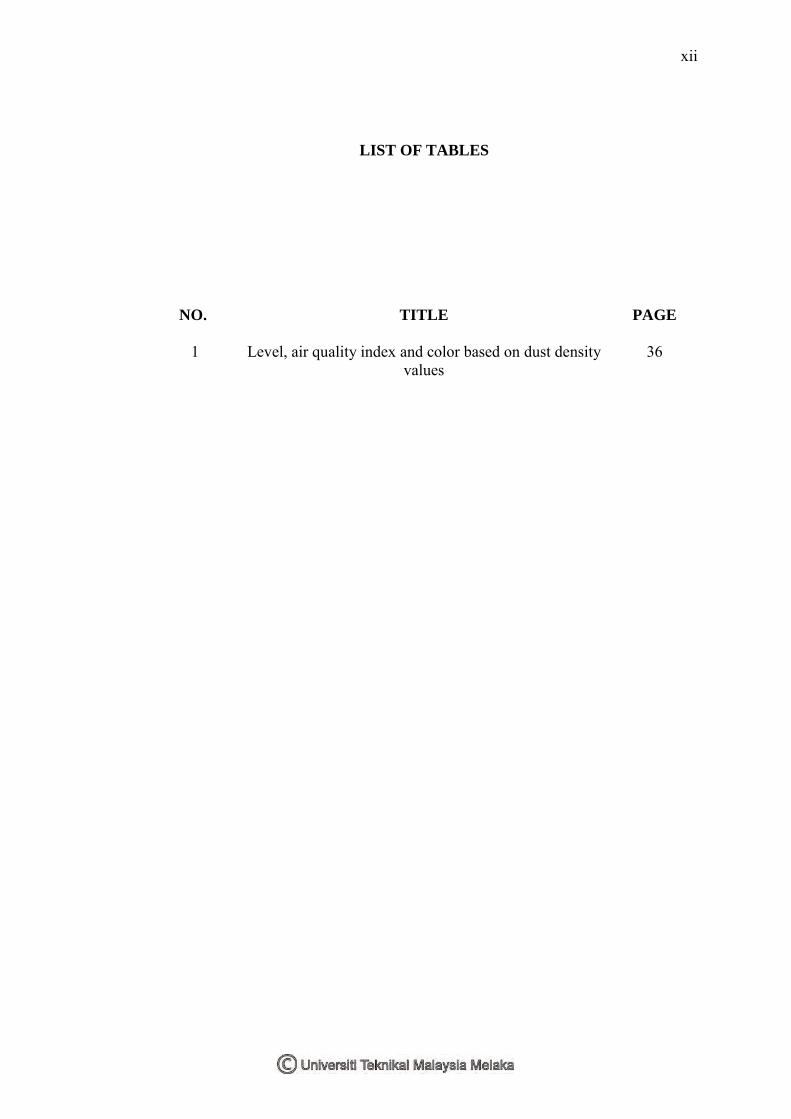
1 Level, air quality index and color based on dust density values
36
xiii
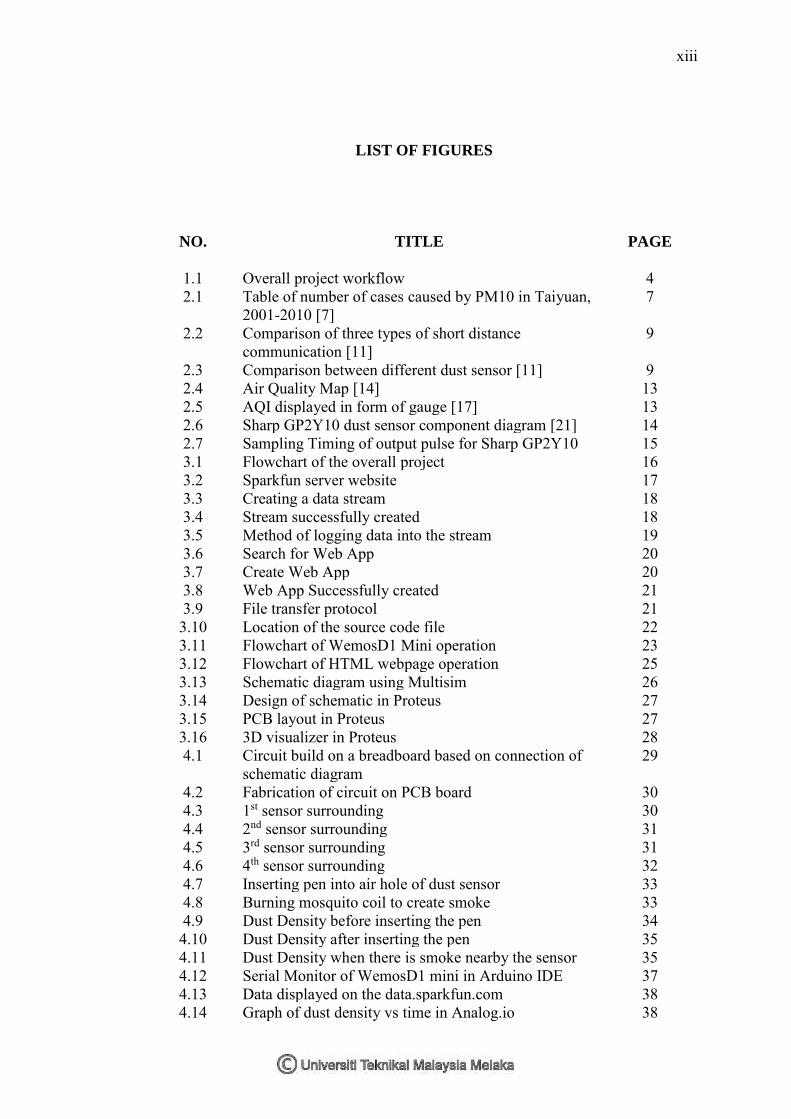
LIST OF FIGURES
NO. TITLE PAGE
1.1 Overall project workflow 4 2.1 Table of number of cases caused by PM10 in Taiyuan,
2001-2010 [7] 7
2.2 Comparison of three types of short distance communication [11]
9
2.3 Comparison between different dust sensor [11] 9 2.4 Air Quality Map [14] 13 2.5 AQI displayed in form of gauge [17] 13 2.6 Sharp GP2Y10 dust sensor component diagram [21] 14 2.7 Sampling Timing of output pulse for Sharp GP2Y10 15 3.1 Flowchart of the overall project 16 3.2 Sparkfun server website 17 3.3 Creating a data stream 18 3.4 Stream successfully created 18 3.5 Method of logging data into the stream 19 3.6 Search for Web App 20 3.7 Create Web App 20 3.8 Web App Successfully created 21 3.9 File transfer protocol 21 3.10 Location of the source code file 22 3.11 Flowchart of WemosD1 Mini operation 23 3.12 Flowchart of HTML webpage operation 25 3.13 Schematic diagram using Multisim 26 3.14 Design of schematic in Proteus 27 3.15 PCB layout in Proteus 27 3.16 3D visualizer in Proteus 28 4.1 Circuit build on a breadboard based on connection of
schematic diagram 29
4.2 Fabrication of circuit on PCB board 30 4.3 1st sensor surrounding 30 4.4 2nd sensor surrounding 31 4.5 3rd sensor surrounding 31 4.6 4th sensor surrounding 32 4.7 Inserting pen into air hole of dust sensor 33 4.8 Burning mosquito coil to create smoke 33 4.9 Dust Density before inserting the pen 34 4.10 Dust Density after inserting the pen 35 4.11 Dust Density when there is smoke nearby the sensor 35 4.12 Serial Monitor of WemosD1 mini in Arduino IDE 37 4.13 Data displayed on the data.sparkfun.com 38 4.14 Graph of dust density vs time in Analog.io 38

xiv
4.15 HTML webpage displaying Google map with markers 39 4.16 Check current consumption using multimeter 40 4.17 Current consumption measured on sensor node with
deep sleep mode. 41
4.18 Opening database csv format in Microsoft Excel 43 4.19 Computational of average dust density 44 4.20 Average Dust Density vs Day (top) and Average Dust
Density vs Time (bottom) 45
4.21 Average Dust Density vs Day (top) and Average Dust Density vs Time (bottom)
46
4.22 Average Dust Density vs Day (top) and Average Dust Density vs Time (bottom)
47
4.23 Average Dust Density vs Day (top) and Average Dust Density vs Time (bottom)
48
xv
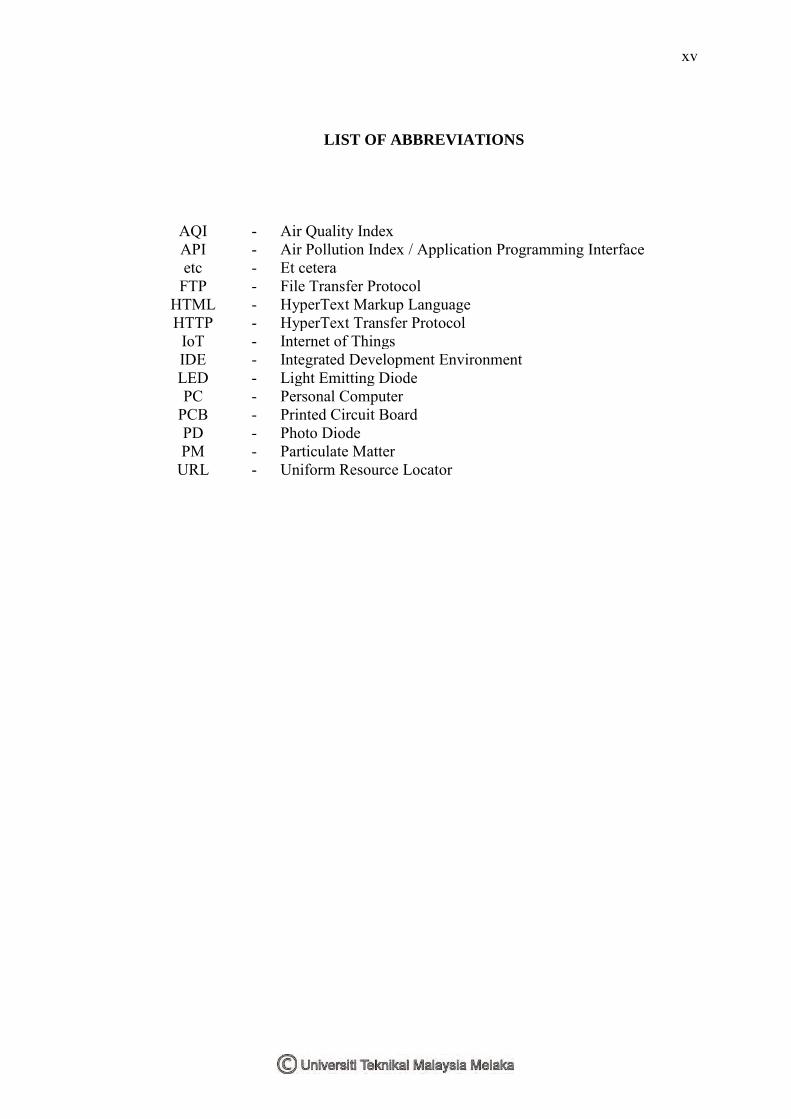
LIST OF ABBREVIATIONS
AQI - Air Quality Index API - Air Pollution Index / Application Programming Interface etc - Et cetera
FTP - File Transfer Protocol HTML - HyperText Markup Language HTTP - HyperText Transfer Protocol
IoT - Internet of Things IDE - Integrated Development Environment LED - Light Emitting Diode PC - Personal Computer
PCB - Printed Circuit Board PD - Photo Diode PM - Particulate Matter
URL - Uniform Resource Locator

xvi
LIST OF APPENDIX
NO. TITLE PAGE
A Coding for WemosD1 mini 54 B Coding for HTML Webpage 56 C Coding for Spider Web Chart 65
CHAPTER 1
INTRODUCTION
1 HEADING 3 – CHANGE COLOR TO WHITE BEFORE PRINTING
Chapter 1 will explain the project overview, objective of the project, problem
statement, the scope of the project, project workflow and report structure.
1.1 Project Overview
Air is important to human beings as they need to breathe to stay alive.
However, the air is polluted with a lot of things such as vehicles, power generating
stations, open burning and many more. The exposure to this polluted air in a long time
will cause negative health impacts to human beings. Therefore, this project aims to
monitor air quality in real time which can raise awareness to the publics and
appropriate actions can be taken to curb the polluted air. Concentration of dust density
will be measured by using dust sensor. The concentration of dust density is then used
to define the Air Quality Index which consist of 6 color and levels indicating the
current air quality.
2
1.2 Objective
The objectives of this project are:
• To develop an IoT-based Air Quality Monitoring System
• To deploy the system to the residential area as the community-led
climate project
• To display the air quality index in a map
The first objective is to develop an IoT-based Air Quality Monitoring System.
This system will use a microcontroller with Wi-Fi module which is to connect the
microcontroller to the Internet and air pollutant sensor which is to measure the air
quality.
The second objective is to deploy the system to the residential area as the
community-led climate project. A few ready and working prototype will be set up at
neighborhood area to measure the air quality.
Lastly, the objective is to display air quality index in a map. The air pollutants
concentration will be converted to air quality index. The map will show the installation
of sensor area indicated with markers. These markers will have color according to the
air quality index value.
3
1.3 Problem Statement
Air pollution happens in most of the countries and causes most of the health
problem such as asthma, lungs infection, etc. In Malaysia, haze is an on-going
problem, which is mainly caused by slash-and-burn practice used by farmers in
Indonesia. Thus, air quality monitoring system is vital to prevent such chaos.
Currently, static air pollution monitoring stations controlled by official authorities are
responsible to monitor the air quality. These stations provide high level of accuracy
and precision readings of air pollutants. However, building and operating these
stations is very costly which limits the number of stations. So far, there is only 2 air
monitoring station in Malacca which means less information on real time air quality
to the public. Community in area located further than the monitoring station will not
know their area air quality and must depend on their judgement.
1.4 Scope
This project will monitor dust density only. Dust is considered as particulate
matter which is one of the main air pollutants. Among other air pollutants such as
nitrogen dioxide, carbon monoxide, sulfur dioxide, lead, and ozone, particulate matter
is the most harmful to human health as it can go deeply into lungs and worst, diffuse
into blood streams. This project will only cover certain neighborhood area in Malacca.

4
1.5 Project Workflow
This project started with title confirmation. Then, literature review based on
previous work related to the title will be carried out. The method, problems, results
and improvement of previous work will be noted down. With these information, the
best method will be chosen to design and develop the new project. Next, hardware and
software design of the project will be carry out. Experiment or testing of hardware and
software will be performed to check whether the project is successful or not. If fail,
the hardware and software design need to be revised again. If successful, the results
will be recorded and analysis of the results is done. Finally, a report is written which
consist of introduction, literature review, methodology, result and analysis and
conclusion.
Title Confirmation
Literature Review
Hardware and Software
Design
Experiment/
Testing
Results and Analysis
Report Writing
Fail
Success
Figure 1.1: Overall project workflow
5
1.6 Report Structure
Chapter 1 explains the project overview, objective of the project, problem
statement, the scope of the project, project workflow and report structure.
Chapter 2 explains literature review based on previous and current existing
technologies to create specific research on this project. The theory to be use for the
project is also discuss in this section.
Chapter 3 describes the flow of the project such as how the software and
hardware are design, integrate and implement.
Chapter 4 discusses the results of the project in detail. Apart from that, analysis
will be done to provide useful information from the results obtained.
Chapter 5 concludes the project findings. Several suggestions for future works
in making this project more effective are included.

CHAPTER 2
LITERATURE REVIEW
2 HEADING 3 – CHANGE COLOR TO WHITE BEFORE PRINTING
This chapter explains literature review based on previous and current existing
technologies to create specific research on this project. The theory to be use for the
project is also discuss in this section.
2.1 Air Pollution
Air pollution is the existence of impurities in a sufficient volume, causing
diseases, allergies and even death to all living organisms on Earth. These impurities
can be categorized into either anthropogenic (arising from human activities), or by
natural events (such as volcano eruption, forest burning), or by the decomposition of
organic compounds[1]. Ozone, particulate matter, carbon monoxide, nitrogen oxide,
sulfur dioxide and lead were the common air pollutants. A previous study states that
PM, particulate matter causes the most negative health impact to human among any
other air pollutants[2][3][4]. Particulate matters can be classified into PM2.5 and
PM10 which represent particles with a diameter of 2.5µm or less and diameter between
2.5µm and 10 µm respectively. The PM10 and PM2.5 particles were able to go deeply
into the various parts of lungs as well as damage the normal circulatory system and
cause cardiovascular and respiratory diseases[5] [6]. In year 2014, a study is conducted
and the effect of PM10 to human health in Taiyuan, China were identified[7]. Based
on the Figure 2.1, the effects of PM10 were premature death, chronic bronchitis,
outpatient visit, emergency room visit and hospital admission.

7
Figure 2.1: Table of number of cases caused by PM10 in Taiyuan, 2001-2010
[7].
2.2 Internet of Things
The Internet which play a significant role in IoT is launch in 1989[8]. Ever
since then, connecting “Things” to the internet developed widely. In 1990, the first
Internet ‘Thing’, a toaster that controlled over the Internet was created by John
Romkey. In 1999, Kevin Ashton, executive director of the Auto-ID Centre, MIT
originate the Internet of Things from initially a concept into a term. In 2000, LG
electronics grab the opportunity in commercializing IoT after announced its plans to
develop a smart refrigerator that could identify the storage levels and notify user if the
food stored is finished. The introduction of IPv6 in 2011 further enhance the growth
in this field. A lot of educational and commercial initiatives with IoT has been done
by IT giants like IBM, Ericson, Cisco, etc.
The Internet of Things consist a network of physical objects, like sensors and
actuators, collecting and exchanging data[9]. With Internet of Things (IoT), massive
amount and variety of data generated by the objects such as home appliances,
monitoring sensor, vehicles, surveillance camera and many more can be put into good
use[10]. For example, development of applications which provide services such as
smart home system, remote health monitoring, environmental monitoring and so on to
the publics.
8
2.3 Existing Air Pollution Monitoring System or Application
Over the years, a lot of air pollution monitoring system had been done.
Different ways of medium deployment of IoT such as wired communication and
wireless communication have been used. Due to disadvantage of wired
communication, hence IoT air quality monitoring system using wireless medium will
be analyzed.
According to Yang et al.,[11] wireless air quality monitoring system is better
than wired air quality monitoring system. This is because wireless system is not
constrained by condition of wiring as it doesn’t require any wiring. In reality, it is
impossible for wired communication to be achieved everywhere. Low mobility and
expensive installation cost are the drawbacks of wired communication. Thus, a simple
alternative for deploying IoT would be the wireless medium as it is higher mobility
and cheaper compared to wired. Moreover, wireless system only needs an Access Point
and wireless network adapter. Three types of 2.4 GHz short distance wireless
communication technology which are Wi-Fi, Bluetooth and Zigbee were compared in
terms of speed, distance, power and security as shown in Figure 2.2. Wi-Fi technology
was chosen due to its speed of 11-54 Mbps and coverage distance of 20m-200m. The
only aspect that need to be improved for Wi-Fi is the security. The significance of data
security depends on the application itself. If the data transferred is not private and
confidential, then the security can be ignored. Besides that, comparison between
common dust sensor available in the market were also done in Figure 2.3. Sharp
GP2Y1010AU0F was chosen as it has lowest cost and acceptable sensitivity compared
to GE SM-PWM-01A, and the SHINYEI PPD42NS PPD4NS. Lastly, an indoor air
monitoring system which consists of Arduino Yun, a smartphone that support HTML
5.0, dust sensor that detects PM 2.5 and PM 10, temperature/humidity sensor and a
Volatile Organic Compound (VOC) sensor was developed. Arduino Yun used an
Atmel ATmega32U4 microcontroller and an Atheros AR9331 Wi-Fi chipset.


![Eclipse IOT [IoT World Santa Clara]](https://img.pdfslide.us/doc/110x75/5a65c4147f8b9aa4758b6a3f/eclipse-iot-iot-world-santa-clara.jpg)
