Embed Size (px)
Citation preview
2ND INTERNATIONAL ONLINE CONFERENCE ON BIOLOGICAL SCIENCES
IOCBS 2018
Conference Proceedings
JULY 22, 2018
INDIA

[This page is intentionally left blank]
IOCBS 2018 2nd International Online Conference on Biological Sciences July 22, 2018 India
All rights reserved. No part of the publication may be reproduced, stored in a retrieval system, or
transmitted, in any form, or by any means, electronic, mechanical, photocopying, recording or otherwise,
without the prior permission of the publisher. This Views and opinions expressed by various authors are in
good faith and are not necessarily those of the Publisher.
ISBN: 978-81-934141-1-8
Publisher: Rayder
Address: C/O, Dipika Ray, Newtown, Netaji Road, Cooch Behar, West Bengal
Pin. 736101. Phone - + 91 9433 668194

[This page is intentionally left blank]
IOCBS 2018
2nd International Online Conference on Biological Sciences
July 22, 2018 India
Conference Proceedings

[This page is intentionally left blank]
2nd International Online Conference on Biological Sciences, July 22, 2018, India
IOCBS 2018 www.iocbs.org Rayder
Program Committee Members
Organizing Chair
(Dr.) Poulami Majumder, Maulana Abul Kalam Azad University of Technology, India
Publicity Chair
Mrs. Dipika Ray, Rayder, India
Scientific Program Committee Member
Dr. Yasha Hasija, Department of Biotechnology, Delhi Technological University, India
Dr. Amritpal Singh Kaleka, Department of Zoology & Environmental Sciences, Punjabi
University, India
Dr. Sushil K. Jha, School of Life Sciences, Jawaharlal Nehru University, India
Dr. Amal K. Bandyopadhyay, Department of Biotechnology, University of Burdwan, India
Dr. Vineet Nair, North Bengal Dental College & Hospital, India
Dr. Sancharini Das, Department of Biotechnology, NIT Sikkim, India
Dr. Samik Bindu, Department of Zoology, Cooch Behar Panchanan Barma University, India
Dr. Ahmad Ali, Department of Life Sceinces, University of Mumbai, India
Dr. Surendra Kumar Trigun, Department of Zoology, Banaras Hindu University, India
Dr. S. Nagaraj, Centre for Advanced Studies in Botany, University of Madras, India
Dr. Dev Raj Joshi, Central Department of Microbiology, Tribhuvan University, Nepal

2nd International Online Conference on Biological Sciences, July 22, 2018, India
IOCBS 2018 www.iocbs.org Rayder
[This page is intentionally left blank]
2nd International Online Conference on Biological Sciences, July 22, 2018, India
IOCBS 2018 www.iocbs.org Rayder
Table of Contents
No. Title Authors Page
Invited Articles
1 Role of artificial sweetener in the prevention of
Glycation
Dr. Ahmad Ali 1
2 Insight into the hyper saline adaptation of halophilic
proteins
Dr. Amal Kumar Bandyopadhyay 3
3 Significance of external genitalic attributes in
superfamily noctuoidea
Dr. Amritpal Singh Kaleka 5
4 Aggressive periodontitis: a genetic and
Clinico‑hematological appraisal
Dr. Vineet Nair 7
5 Development of a genomic information resource on
dermatological disorders
Dr. Yasha Hasija 9
Abstracts
6 Optical Brightening Agents (OBA’s): comparison of In
Silico models for prediction of mutagenicity and its
impact on environment
Sweta Parimita Bera and Shantilal
Kuwar Tank
11
7 Targeting m-calpain for ouabain induced smooth
muscle cell proliferation
Soni Shaikh 12
8 Usefulness of homoeopathic medicines in treatment of
stress urinary incontinence in parous females: a case
series
Sangeeta Jain, Ashok Narayan
Mathur and Arun Phophalia
13
9 Ayurved-historical therapy for future expectation Sushant Sud and Khyati Sud 14
10 A logical exposition of Vishaada w.s.r to GAD in 21st
century
Khyati Sud and Sushant Sud 15
11 In Silico molecular docking studies of antibacterial
drug from Amaranthus viridis L.
Pinkie Cherian, D Sheela and
Kavitha S Nair
16
12 Identification and validation of growth associated snps
in Macrobrachium rosenbergii (De Man 1879) using
Sanger sequencing
Chandan Haldar and A Chaudhari 17
13 Phytochemical, antioxidant and growth modulating
effect of Physalis minima
Geetha Samak, Kumaraswamy N
and Pruthvi K J
18
2nd International Online Conference on Biological Sciences, July 22, 2018, India
IOCBS 2018 www.iocbs.org Rayder
14 Phytochemical analysis and antimicrobial activities of
Emblica officinalis (L) leaf extracts against fish
pathogen Aeromonas hydrophila.
Runa Paul, Asha Khanna and Rita
Bhandari
19
15 A review on applications of CRISPR-gene editing
technology for retinal diseases
Sourab Kulkarni, Vidyashree V
and Sravanti Vaidya
20
16 A novel mtDNA sequence analysis and annotation
paradigm using confusion matrix
Varsha Ravi and Praharshit
Sharma
21
17 Taxonomic significance of external genitalia in genus
metanastria hübner (lasiocampidae: bombycoidea:
lepidoptera)
Amritpal Singh Kaleka, Devinder
Singh and Sujata Saini
22
18 Taxonomic status of genus Pida walker lymantriidae
(noctuoidea: lymantriidae) from north-west India
Amritpal Singh Kaleka, Devinder
Singh and Gaganpreet Kour Bali
23
19 Insulin influences peptidylarginine deiminase 4 activity Binchu V Shaji, Haritha V H and
Anie Y
24
20 Taxonomic significance of internal genitalic organs in
family lymantriidae (lepidoptera)
Amritpal Singh Kaleka and
Navkiran Kaur
25
21 Menstrual hygiene: are “free days” making our rural
adolescent girls feel free?
Supriyalaxmi N Totiger and Syed
Yunus Zama
26
22 Psychosocial determinants of infant weight gain: a
cross sectional study in rural South India
Sushantha and Mudassir Azeez
Khan
27
23 Relationship of shoot gall psylla (Apsylla cistellata
Buckton) oviposition with gall formation, panicle
initiation and adult emergence in mango
Jyoti Raina and Poonam
Srivastava
28
24 Differential Preference of fast-food consumption in
few representative areas of West Bengal
Tanaya De and Moumita Rakshit 29
25
3D Structure modelling, docking studies of NQO1-
isoform 1, 2 with FAD and anti-cancer drug RH1
Gupta Pramodkumar P, Bastikar
Virupaksha A, Kothari Shanker
L, Cicenas Jonas, Valius
Mindaugas
30
26 SAR & QSAR Analysis of Camptothecin (CPT) as
Topoisomerase 1 Inhibitors using molecular modelling
techniques.
Bastikar Virupaksha A, Bhatia
Hitendra, Bastikar Alpana
Chhajed Santosh S and Gupta
Pramodkumar P
31
27 Impact of paternal age and addictions on Down
Syndrome live birth
Poulami Majumder 32
2nd International Online Conference on Biological Sciences, July 22, 2018, India
IOCBS 2018 www.iocbs.org Rayder
Full Papers
28 Reconstruction of phylogenetic history to resolve the
subspecies anomaly of Pantherine cats
Ranajit Das 33-45
29 Characterization of bacteria present in the probiotics in
Indian market
Disha Mandal, Isha Sharma
and Yasha Hasija
46-51
30 Case report: management of Psoriasis (Ekakustha) by
multiple Shodhana and Shamana Chikitsa
Shivani Nirmal, Joyal Patel and
Kalpesh Dattani
52-65
31 Potentiality of mangrove associate species Porteresia
coarctata (salt marsh grass) in acting as an agent of
phytoremediation
Shankhadeep Chakraborty, Sufia
Zaman and Abhijit Mitra
66-73
32 Traditional knowledge and biodiversity of
ethnomedicinal plants used by the ethnic tribal people
of Tripura, North East India
Anupam Guha, Sukla Chowdhury
and Kakoli Noatia
74-81
33 Anthelmintic activity of leaves of Sophora interrputa
Bedd
Bommana Kavitha and N Nirmala 82-87
34 Detailed analysis and land use mapping of tea
development centre, Umsning Meghalaya
Mamita Kalita, Kasturi
Chakraborty, Nilakshee Devi, K
K Sharma and P.L.N Raju
88-95
35 Quantification of RNi-Prognosis marker for renal
dysfunctioning among Leprosy patients
Sibi Joy Manohar, Andrew
Pradeep M, R Sethu Nagarajan
96-101
36 Electronic, thermodynamic and non-linear optical
properties of flavonols: quantum mechanical studies
Sahini Banerjee, Debanjan
Mitra and Amal Kumar
Bandyopadhyay
102-116
37 Assessing the bacterial composition of fresh water
from Gobindsagar reservoir using next generation
sequencing
Archana Chauhan, Taruna Arora,
Phuntsog Dolma, Namita and
Ahmad Ali
117-133

2nd International Online Conference on Biological Sciences, July 22, 2018, India
IOCBS 2018 www.iocbs.org Rayder
This page is intentionally left blank]

2nd International Online Conference on Biological Sciences, July 22, 2018, India
IOCBS 2018 www.iocbs.org Rayder

2nd International Online Conference on Biological Sciences, July 22, 2018, India
IOCBS 2018 www.iocbs.org Rayder
[This page is intentionally left blank]
2nd International Online Conference on Biological Sciences, July 22, 2018, India
IOCBS 2018 ISBN: 978-81-934141-1-8 Rayder
1
Key Note
Role of artificial sweetener in the prevention of Glycation
Dr. Ahmad Ali
Assistant Professor
Department of Life Sciences, University of Mumbai, Vidyanagari, Santacruz (East),
Mumbai 400098, Maharashtra, INDIA
Email: [email protected]
Background: Diabetes has become major metabolic and endocrinological disorder. It has emerged as a
serious public health problem worldwide among non-communicable diseases. Hyperglycaemia is the main
pathophysiological symptom of Diabetes. The consequences of excess glucose lead to malfunctioning of
body via processes like glycation. Glycation is a non-enzymatic and multistep process through the
interaction of carbonyl group of reducing sugars and amino group of nitrogenous compounds like proteins,
nucleic acids etc. This reaction leads to formation of Schiff’s base of reversible nature which further
rearranges them to form Amadori products and Advanced Glycation end-products (AGEs) by oxidation,
reduction, hydration etc. The accumulation of glycation-mediated products interferes with the metabolic
and other functions of body. Glycation is implicated in aging and neurodegenerative diseases due to its
ability to induce protein cross-linking, aggregation and precipitation, misfolding, fibril and amyloid
formation. For the management of diabetes and other health benefits sweeteners are being preferred in
the food and pharmaceutical industries. However there are very few reports on the involvement of
sweeteners in the process of glycation. Therefore the effect of Acesulfame potassium, an artificial sweetener
was checked on glycation and proteins aggregation in the present study.
Materials and Methods: BSA was used as a model protein for checking effect of Food and Drug
Administration approved artificial sweetener (Acesulfame-K). BSA (10 mg/mL), glucose (100 mg/mL) and
acesulfame-K (100 mg/mL) were incubated in the presence of phosphate buffer (100 mM, pH-7.4) and
sodium azide (3mM) for 28 days at 37 ºC. The glycation effect was checked by measurement of browning
at 420 nm, Fructosamine content using NBT method and carbonyl content by DNPH method. The
manifestation of glycation like aggregation was analysed by aggregation index, Congo red assay, and
Electron microscopy technique.
2nd International Online Conference on Biological Sciences, July 22, 2018, India
IOCBS 2018 ISBN: 978-81-934141-1-8 Rayder
2
Key Note
Results: Initially browning was measured which indicated the reduction in presence of acesulfame-K as
compared to glycated proteins. A significant decrease in the amount of Amadori product in presence of
Ace-K was observed when Fructosamines content was measured. The carbonyl content as a marker of
AGEs also showed a pattern similar to browning and fructosamine in the presence of Acesulfame
potassium. The continuous generation and accumulation of glycation-mediated products may contribute in
cross-linking, aggregation, amyloid formation etc. Electron microscopic images also clearly indicated that
presence of Ace-K significantly reversed the formation of β-amyloid cross-structure. Similar result was
also observed with the Congo red assay.
Conclusion: Several factors may affect the generation of Schiff’s base, Amadori products and AGEs and
in β-amyloid cross-structure in vivo. It can be concluded that acesulfame potassium significantly prevented
the generation of glycation-mediated products and glycation-induced protein aggregation.
Keywords: Acesulfame potassium; AGEs; Aggregation; Diabetes; Glycation; Sweetener.
2nd International Online Conference on Biological Sciences, July 22, 2018, India
IOCBS 2018 ISBN: 978-81-934141-1-8 Rayder
3
Key Note
Insight into the hyper saline adaptation of halophilic proteins
Dr. Amal Kumar Bandyopadhyay
Assistant Professor
Department of Biotechnology, The University of Burdwan, West Bengal, 713104, India
Email: [email protected]
Background: Unlike "normal" or mesophiles, halophiles operate their cellular machineries in hypersaline
environments. It is not like endurance but a deliberate style of life that may have emerged via some hitherto
unknown principles of evolutionary surges. Although appears as prokaryotes, halophiles are archaea whose
cellular components are closer to eukaryotes. Compare to prokaryotes, evolutionary devices for genetic
transformation have been highly efficient in halophile, yet it lags behind the eukaryotes, as endosymbiotic
installation of double-membrane mitochondria in its cytoplasm of saturated salts remains unsuccessful,
which were otherwise necessary to settle up with the energy cost necessary for the operation of devices for
massive eukaryotic like evolutionary trials.
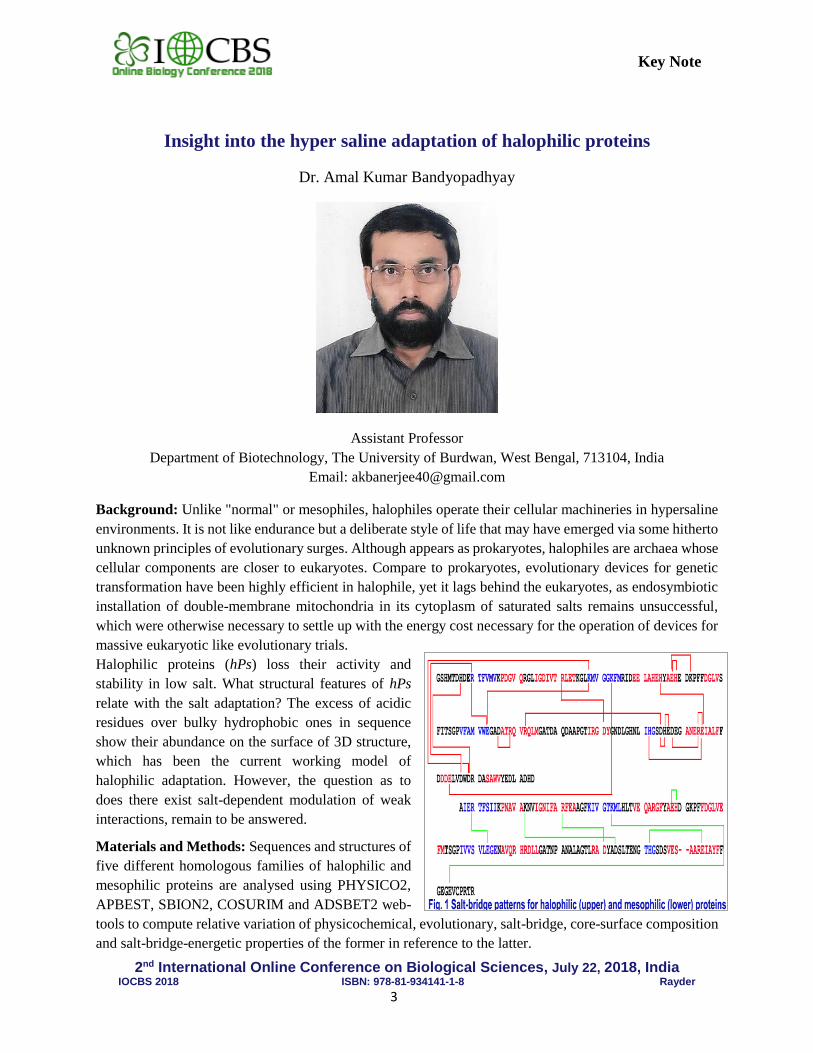
Halophilic proteins (hPs) loss their activity and
stability in low salt. What structural features of hPs
relate with the salt adaptation? The excess of acidic
residues over bulky hydrophobic ones in sequence
show their abundance on the surface of 3D structure,
which has been the current working model of
halophilic adaptation. However, the question as to
does there exist salt-dependent modulation of weak
interactions, remain to be answered.
Materials and Methods: Sequences and structures of
five different homologous families of halophilic and
mesophilic proteins are analysed using PHYSICO2,
APBEST, SBION2, COSURIM and ADSBET2 web-
tools to compute relative variation of physicochemical, evolutionary, salt-bridge, core-surface composition
and salt-bridge-energetic properties of the former in reference to the latter.
2nd International Online Conference on Biological Sciences, July 22, 2018, India
IOCBS 2018 ISBN: 978-81-934141-1-8 Rayder
4
Key Note
Results: The observation of higher mean relative residue abundances (MRRA) of hPs are constituted by
acidic (DE) and basic (HRK) residues but not due to neutral, polar (NQSTYP) ones, indicating that DE and
HRK might have concerted roles in the salt dependent adaptation of hPs. The non-conservative to
conservative substitutions (NCS:CS) is lower in hPs, which may imply divergence in hPs is more decisive.
CS are largely maintained by acidic and hydrophobic residues in halophilic and mesophilic proteins
respectively, suggesting that the functional constraints are differentially maintained in these domains of
life. Surprisingly, the surface of tertiary structure shows higher relative abundance for both DE and HRK
in hPs, which are forming highly stabilizing, extensively networked, long-range salt-bridges (Fig. 1). This
is the first report of such an observation. The fact that hydrophobic force is weak in high-salt solution, some
alternate weak forces that are less affected by multimolar salts would be useful for the maintenance of the
stability of the native state of hPs. Thus, these results suggest for the first time that salt-bridges (Fig. 1) may
be one of the prime forces behind halo-adaptation of hPs.
Conclusion: Although the physical chemistry of the native state of hPs is made by conventional weak
interactions (van der Waals, Hydrogen bond, Electrostatic and Hydrophobic), there seem to exist wide
modulations of these forces, wherein evolutionarily engineered salt-bridges take the major space.
Keywords: Halophilic proteins, Sequences, Structures, Halo-adaptation, Salt-bridge.
2nd International Online Conference on Biological Sciences, July 22, 2018, India
IOCBS 2018 ISBN: 978-81-934141-1-8 Rayder
5
Key Note
Significance of external genitalic attributes in superfamily noctuoidea
Dr. Amritpal Singh Kaleka
Assistant Professor
Department of Zoology & Environmental Sciences
Punjabi University, Patiala-147002, Punjab, India
Email: [email protected]
Insects are economically and ecologically important aspect of the living world, forming the most dominant
group of Kingdom Animalia. Taxonomy identifies and mentions the components of biodiversity providing
a basic knowledge for the management and conservation of biodiversity. In taxonomy, the significance of
male and female external genitalia is unparalleled as it serves as an important tool in distinguishing between
the closely related species (Eberhard, 1985). In Lepidoptera, the morphological details of the external
genitalia play a significant role in resolution of taxonomic identities. According to Mayr (1969), the study
of external male and female genitalia, particularly in insects, is very important as it is highly species specific
and shows much structural details. Traditionally morphological differences in genitalia have been used to
differentiate similar species of Lepidoptera and are the unique characteristic features that “define” a species.
Genitalia are generally complex and very diverse and chiefly derivatives of the integument of the 7th and
10th abdominal segments. In the present study, an effort has been made to study the external genitalic
attributes of super- family Noctuoidea from India so as to strengthen the taxonomy of superfamily
Noctuoidea. The significance of genitalic attributes is based on the lock and key hypothesis which states
that male and female genital compatibility serve to isolate different species reproductively. Patterns and
trends in genital morphology are also considered as important tools in resolving phylogenetic relationships
between different families. The external genitalic characters are species specific there by aiding in
reproductive isolation.
Noctuoidea is the largest superfamily among Lepidoptera, distributed globally with more than 70,000
described species. It is characterized by the presence of meta-thoracic tympanal organs, the structure and
position of which are unique. The moths range in size from small to very large and are typically robust-
bodied. Noctuoidea is divided into two broad groups, those with trifid forewing venation (Oenosandridae,
2nd International Online Conference on Biological Sciences, July 22, 2018, India
IOCBS 2018 ISBN: 978-81-934141-1-8 Rayder
6
Key Note
Notodontidae and Doidea) and those with quadrifid forewing venation (Arctiidae, Lymantriidae, Nolidae,
Noctuidae). The male genitalia in the Superfamily Noctuoidea, as in other Lepidoptera consist of structures
like uncus, gnathos, socii, tegumen, vinculum, juxta, valva and aedeagus. The female genitalia comprise of
structures namely corpus bursae, signum, ductus bursae, ostium bursae, papillae analis, posterior and
anterior apophysis. These characters are species specific and proved to be significant in authentic
identification and differentiation of different taxa.
2nd International Online Conference on Biological Sciences, July 22, 2018, India
IOCBS 2018 ISBN: 978-81-934141-1-8 Rayder
7
Key Note
Aggressive periodontitis: a genetic and clinico‑hematological appraisal
Dr. Vineet Nair
Assistant Professor
Department of Periodontia, North Bengal Dental College
& Hospital, Darjeeling, India
Email: [email protected]
Background: Myeloperoxidase (MPO) is a lysosomal enzyme seen in the azurophilic granules of
polymorphonuclear leukocytes (PMN) and mediates inflammatory tissue destruction in aggressive and
chronic periodontitis (CP). Human telomerase is a multi-subunit ribonucleoprotein enzyme related to
telomeric lengthening and homeostasis in man and it’s level is elevated in inflammatory conditions such as
rheumatoid arthritis and periodontitis. The aim of this study was to assess in aggressive periodontitis (AP)
subjects: (i) The role of MPO‑463G/A gene polymorphism and (ii) the level of telomerase expression.
Human leukocyte antigens (HLA) are reflected as a candidate of genetic risk markers for AP. AP has also
been associated with PMN dysfunction. The role of monocyte subsets in AP is still not clear. Consequently,
the present study was undertaken to assess in, AP subjects, the possible association between defective PMN
adhesion and 2‑integrin expression; defective neutrophil migration and actin polymerization level; the
expression of ABO blood group and HLA antigen; and the percentage of CD14+ CD16+ monocytes and
CD45RA monocytes. All these parameters have been compared with the subjects of CP and that of the
healthy controls.
Materials and Methods: A total of 90 subjects of the age group 20-50 years, free from any known systemic
disease, were divided into three groups – Group I ‑ periodontally healthy control (n = 30), Group II ‑ CP
(n = 30) and Group III ‑ AP (n = 30). Peripheral blood samples and gingival tissue samples were gathered
for MPO gene polymorphism and telomerase expression respectively, for detection by reverse transcriptase
polymerase chain reaction. From the peripheral blood samples, ABO grouping and HLA typing were
performed. 2‑integrin expression, actin polymerization level and percentage of CD14+ CD16+ monocytes
and CD45RA monocytes were estimated by fluorescence‑activated cell sorter analysis.
Results: The frequencies of AG and AA genotypes in the MPO gene polymorphism were more common
in the AP subjects when compared to the controls. The m‑RNA expression of human telomerase reverse
transcriptase (hTERT) was untraceable in the gingival tissue of the control group. Its expression in AP
subjects was significantly higher than that of CP group. Most of the subjects of AP belonged to the blood
2nd International Online Conference on Biological Sciences, July 22, 2018, India
IOCBS 2018 ISBN: 978-81-934141-1-8 Rayder
8
Key Note
group “AB,” and an increased frequency of HLA‑A30, CW1 and DR1 (P < 0.1) and B44 and DQ2 (P <
0.05) were also observed in this group. In the AP group, both average values (2‑integrin and actin level)
were significantly less than those of normal subjects (P < 0.001). The mean percentage of CD14+ CD16+
monocytes was found to be maximum in CP, followed by AP and then in healthy subjects, while the mean
percentage of CD45RA was maximum in AP, followed by CP and then in healthy subjects.
Conclusion: With the present state of knowledge from this study we can conclude that (i) MPO‑463G/A
may be associated with increased risk of AP, (ii) the level of tissue hTERT was elevated in AP subjects as
compared to CP and healthy control groups, (iii) a definite association of ABO blood groups and HLA
phenotypes with periodontal diseases is yet to be established, (iv) leukocytic functional defects were found
in AP subjects, (v) a statistically significant percentage of CD14+ CD16+ and CD45RA monocytes were
found in AP subjects as compared with the normal control and CP groups.
Keywords: blood group; human leukocyte antigens; myeloperoxidase; polymerase chain reaction;
telomerase.
2nd International Online Conference on Biological Sciences, July 22, 2018, India
IOCBS 2018 ISBN: 978-81-934141-1-8 Rayder
9
Key Note
Development of a genomic information resource on dermatological disorders
Dr. Yasha Hasija
Assistant Professor
Department of Biotechnology, Delhi Technological University, Shahbad Daulatpur,
Main Bawana Road, Delhi-110042, India
Email: [email protected]
Background: The human skin is the largest immunological organ that forms an operative barrier between
the internal and external environment. Disturbance of the skin barrier is a central event in various skin
diseases. Although efforts have been made to characterize the underlying disease mechanisms of various
skin diseases through extensive research, a lot remains unclear. Moreover, many skin diseases are
influenced by a variety of genetic and environmental factors miRNAs, have been identified as a key player
in various cellular homeostasis in both normal and diseased skin as they seem to be involved in the
regulation of various genes which are found to be associated with skin diseases. With this premise, the
focus of our laboratory is the computational analysis of genetic factors that may contribute to the
susceptibility to dermatological disorders.
Materials and Methods: List of skin diseases are retrieved from MeSH Browser. MicroRNAs for the
genes associated with these disorders were retrieved from miRTarBase.
Results: We have created an online repository of all the genetic dermatological disorders at one place,
“DemaGene” that allows for clinicians and researchers to look for genetic data on dermatological disorders
and the SNPs associated with them. Each entry in this database contains information on the genes, the SNPs
associated with diseases, the Pub Med IDs of texts referred, the frequency of polymorphism, along with the
population where the study has been conducted. Furthermore, we have created another repository of
microRNAs which contains information on target genes associated with dermatological disorders, named
as “miDerma”. Presently miDerma contains a total of 36,609 associations involving 981 genes which were
targeted by 2504 miRNAs associated with 338 dermatological disorders. As a case study, we applied a
systems biology approach to identify the role of potential miRNAs and susceptible gene variants associated
with vitiligo, a polygenic disorder which results in the progressive loss of functional melanocytes. We
further identified the miRNA target genes and constructed a miRNA-target gene network that revealed
essential miRNAs that might be fundamentally linked to vitiligo. Our protein-protein interaction (PPI)
2nd International Online Conference on Biological Sciences, July 22, 2018, India
IOCBS 2018 ISBN: 978-81-934141-1-8 Rayder
10
Key Note
network in combination with drug-target network highlighted potential protein targets which may be used
as novel drug candidates.
Conclusion: Our database aims to provide a holistic picture of the various dermatological disorders, which
may facilitate researchers in identifying dermatosis causation, in addition to providing insights into
previously undiscovered disease-gene & disease-SNP relationships. We believe tha, our analysis unveiled
significant findings that may drive the way towards better therapeutic interventions for management of
dermatological disorders.
Keywords: Dermatological disorders; genetics; microRNAs.

2nd International Online Conference on Biological Sciences, July 22, 2018, India
IOCBS 2018 www.iocbs.org Rayder
ABSTRACTS

2nd International Online Conference on Biological Sciences, July 22, 2018, India
IOCBS 2018 www.iocbs.org Rayder
[This page is intentionally left blank]
2nd International Online Conference on Biological Sciences, July 22, 2018, India
IOCBS 2018 ISBN: 978-81-934141-1-8 Rayder
11
Abstract Article
Optical Brightening Agents (OBA’s): comparison of In Silico models for
prediction of mutagenicity and its impact on environment
Sweta Parimita Bera1*, S.K.Tank2
1Department of Bioscience, Veer Narmad South Gujarat University, Udhna-Magdalla Road, Surat,
395007, India 2Department of Bioscience, Veer Narmad South Gujarat University, Udhna-Magdalla Road, Surat,
395007, India
*Corresponding email: [email protected]
Abstract
Background: OBA’s also known as fluorescent dyes are chemically synthesized stilbene compounds used
in textile and detergent industry as substitute for the age-old practice of bluing. These compounds are
similar to dyes, with the only difference being the fluorescence system replacing the chromophoric system
in dyes. They absorb the UV light at 340-360nm and emit it back as visible light at 420-460nm. The blue
light thus emitted by the brighteners make reparations for the reduced blue of the treated material and thus
alters the hue away from yellow or brown to bright white. According to a report by the European Ecolab
Commission on criteria for laundry detergents in 2011, “as optical brighteners undergo photo degradation,
numerous metabolites may be produced that are not yet identified, which means we may not know the true
potential impacts upon the environment.” Hence, a list of 20 commercially used OBA's in textile and
detergent industries were selected for this study. The aim was to know the mutagenicity of locally used
OBA’s using In Silico models and then compare the models to know which is better in predicting the
toxicity of this compounds and its impact on the environment.
Materials and Methods: A data list of 20 OBA’s specifically used in detergent and textile industry was
gathered from different sources like, PUBCHEM, Chemical Carcinogenesis Research Information (CCRIS)
and the GeneTox databases. This dataset contains compounds as canonical simplified molecular input line
entry system (SMILES) together with the corresponding Ames test results (given mutagen or not) and
references. The ratio of mutagens to non-mutagens was 9:11 for this dataset. The toxicity of optical
brighteners is examined using computational prediction methods which included QSAR models,
knowledge-based systems, and a combination of both methods. These models are free and available online.
The 3 prediction tools that were taken into consideration are (i)Lazar toxicity prediction; Version: 1.3.05
(ii)Toxtree; Version 2.6.6 (iii)VEGA HUB: Virtual evaluation of chemical properties and toxicity.
Results: The predictions for the compounds out of the training set and inside the respective ADIs were
compared. In our opinion this kind of evaluation is the most important, because it evaluates the real
predictivity (compounds out of training) for the chemicals that are indicated to be inside the AD. The highest
accuracy (0.82, 0.90) was obtained by SARpy and CAESAR, (i.e. VEGA HUB) respectively, followed by
TOXTREE and Lazar. The high performance of the models is associated with the relatively low uncertainty
and variability of the in vitro Ames assay. The models evaluated in this study gave different sensitivity and
specificity.
Conclusion: It appears that the models based on statistical QSAR-based methods gave better results. The
OBS’s do have mutagenic effects on the environment and some of them also carry the potential to cause
cancer.
Keywords: Optical brightening agents, Mutagenicity, In Silico models, Ames test.
2nd International Online Conference on Biological Sciences, July 22, 2018, India
IOCBS 2018 ISBN: 978-81-934141-1-8 Rayder
12
Abstract Article
Targeting m-calpain for ouabain induced smooth muscle cell proliferation
Soni Shaikh1*
1Department of Biochemistry and Biophysics, University of Kalyani, Kalyani 741235, WB, India
*Corresponding email: [email protected]
Abstract
Background: Ouabain, a cardiotonic steroid may result in the growth of myocytes, indicating its role in
the cell growth and proliferation mechanism, which is a prerequisite for ventricular hypertrophy. But the
mechanism still is in smog for such ouabain mediated effect. Ouabain mediated inhibition of Na+/K+
ATPase may result in an increase of cellular calcium level. Whereas increased calcium level is necessary
for the activation of m-calpain that may target a variety of signaling molecules, like PKC. Such information
is a clue to investigate the relationship of ouabain, calpain, and PKC.
Materials and Methods: To aiming the objectives of the current research, bovine pulmonary artery smooth
muscle cells were cultured and subsequently treated with 10 nM ouabain and then determined the
intracellular [Ca2+]i by fluorometric assay using Fura2-AM, a calcium measuring probe and m-calpain
activity by fluorometric SLLVY-AMC substrate assay. Furthermore, m-calpain and PKCα were purified
by serial chromatographic procedure and then studied in vitro cleavage of the purified PKCα by m-calpain
by Western immunoblot. Subsequently, the cell proliferation assay was performed utilizing the redox dye
resazurin.
Results: The results suggested that upon treatment of 10 nM ouabain on bovine pulmonary artery smooth
muscle cells increases [Ca2+]i level, which in turn stimulated m-calpain activity and subsequently
proteolytically activated PKCα of the cells. And then upon activation, PKCα participate in the smooth
muscle cell proliferation mechanism via Go/G1 to S/G2-M phase transition.
Conclusion: Therefore m-Calpain and PKCα both play an important role in ouabain-mediated pulmonary
artery smooth muscle cell proliferation. The present study may provide a strategy in the development of
therapeutic measures for the treatment of pulmonary vascular diseases.
Keywords: Calpain, Calcium, Ouabain, Smooth muscle cells.
2nd International Online Conference on Biological Sciences, July 22, 2018, India
IOCBS 2018 ISBN: 978-81-934141-1-8 Rayder
13
Abstract Article
Usefulness of homoeopathic medicines in treatment of stress urinary
incontinence in parous females: a case series
Sangeeta jain1*, A. N. Mathur2, Arun Phophalia3
1Department of Anatomy, Homoeopathy University, Saipura, Sanganer, Jaipur, Rajasthan, India 2Department of organon of medicine and homoeopathic philosophy, Homoeopathy University,
Saipura, Sanganer, Jaipur, Rajasthan, India 3Department of Surgery, Homoeopathy University, Saipura, Sanganer, Jaipur, Rajasthan, India
*Corresponding email: [email protected]
Abstract
Background: In parous females, stress urinary incontinence (SUI) is a frequently encountered clinical
problem due to laxity of pelvic floor muscle and fascial defects caused by parturition. SUI is a symptom; a
patient may say, "When I cough, I leak urine." SUI is also a sign, urine leakage from the urethral meatus
with cough or Valsalva maneuver. Pelvic floor muscle exercises (PFMEs) are often prescribed without
diagnosis of the type or degree of pelvic floor damage but verbal instruction alone on Kegel exercises
("contract the muscles you would use if you were trying to stop your stream") resulted in appropriate
contraction of the pelvic floor in only 60% of patients. The aim of this study is to treat the parous females
suffering from SUI with homoeopathic medicines as add-on to standard pelvic floor exercise (Kegel’s).
Materials and Methods: A baseline one-hour pad weight test done (1-hour PWT) after confirmation of
SUI. Initiation of a standard regime for Kegel’s to all females suffering from SUI was offered with
additional homoeopathic intervention. Symptoms were leakage of some or more amount of urine on
physical activities which are responsible for increased intra-abdominal pressure like coughing, sneezing,
laughing or lifting weight etc. Descriptive statistics was used for analysis.
Results: Seven patients followed up for a median period of six months. Five patients completely recovered
from SUI, whereas frequency and amount of urine leakage on physical activities reduced in two patients.
No side effects or adverse drug reactions encountered.
Conclusion: This was an initiative to serve homoeopathic treatment of SUI in parous females as add-on to
standard pelvic floor exercise and results were encouraging. Until today, there is no evidence-based
effective treatment as it is all related to laxity of pelvic floor. As optimising, the management of pelvic floor
muscle tone is known to lead to decrease amount of urine leakage, it is important to note that routine pelvic
floor exercise regime (kegel's) was strictly followed by all the patients. Thus, it is plausible that the positive
effects reported above are due to the adjunctive homoeopathic treatment. For an evidence-based evaluation
of this concept, prospective studies are required.
Key words: Parous females, stress urinary incontinence (SUI), pelvic floor exercise, homoeopathy.
2nd International Online Conference on Biological Sciences, July 22, 2018, India
IOCBS 2018 ISBN: 978-81-934141-1-8 Rayder
14
Abstract Article
Ayurved-historical therapy for future expectation
Sushant Sud1*, Khyati Sud2
1Asst. Pros, Department of Agad Tantra Vyavahar Ayurved Evum Vidhivaideyak, Shri Gulabkunverba
Ayurved Mahavidyalaya, Gujarat Ayurved University, Jamnagar, Gujarat 361008, India 2Asso. Prof, Department of Kayachikitsa, Dhanvantari Ayurved College, Koyadam, Tal- Virpur, Dist-
Mahisagar, Gujarat, India
*Corresponding email: [email protected]/ [email protected]
Abstract
Background: Ayurved is a science of life that is, first and foremost, about creating harmony with one's
environment. Ayurved teaches us that when we live in harmony we shall be healthy, and that disease is the
normal expression of living out of harmony. Only then can we make the life changes necessary for healing
to take place.
Materials & Methods: Everything in universe has medicinal values. It is important to know how to make
use of it. The challenge is to apply Ayurvedic principles in this changing modern environment. Ayurved
involve the incorporation of several remedial practices of medicine that may span many previous
generations, which often provides valuable guidelines to the selection, preparation and application of
medications not only for the treatment but also to control and manage of variety of disorders.
Results: According to WHO, more than 70% of the global inhabitants depend on conventional system of
medicine. As far as escalating stipulates for Ayurvedic medications, there are also huge concerns arising
about the toxicity, safety, standardization, efficacy and most importantly quality and authenticity of
Ayurvedic medications by stake-holders, health professionals as well as the common community.
Globalized and modernized practices derived from Ayurved traditions are a type of complementary or
alternative medicine. In the Western world, Ayurved therapies and practices (which are manifold) have
been integrated in general wellness applications and as well in some cases in medical use Long the main
healthcare system in India, the origin of Ayurved is lost in the mists of antiquity, therefore improvement in
the quality of herbal medicines could be achieved by deliberate implementation of good agricultural
practices (GAPs) at the point of cultivation of medicinal plants and good manufacturing practices (GMPs)
during the process of manufacture and packaging of finished herbal products, as well as post-marketing
quality assurance surveillance.
Additionally, following the current sustained improvements in quality control and regulatory measures in
many countries of the world, it is envisaged that in the near future, herbal medicinal practices will be
integrated into the conventional medicines. Western medicine is successful in dealing with many vast
surgical situations and medical emergencies. However, there are increasing numbers of diseases, which are
no more single entities, but composite with one leading to another. Looking into our Lifestyle, the best
example is obesity/overweight, which leads to a number of other ailments such as CVD, diabetes, cancer,
osteoarthritis and sleep disorders. As the world faces increasing chronic, psycho-somatic, stress and
lifestyle-related disorders, Ayurved with its unique approach, holistic perspective, emphasis on diet and
lifestyle activities, and time-tested clinical practices can play a crucial role and can give a hope of healthy
life. As a complete healthcare system, it can empower the individual with a healthy way of life.
Conclusion: Ayurved is not a reminder of a past glory but an example of Indian knowledge system having
contemporary and increasing relevance. Its experience and expertise accumulated over several millennia
should be used to benefit suffering people.
Keywords: Ayurved, Western World, GMP, GAP.
2nd International Online Conference on Biological Sciences, July 22, 2018, India
IOCBS 2018 ISBN: 978-81-934141-1-8 Rayder
15
Abstract Article
A logical exposition of Vishaada w.s.r to GAD in 21st Century
Khyati Sud1*, Sushant Sud2
1 Asso. Prof, Department of Kayachikitsa, Dhanvantari Ayurved College, Koyadam, Tal- Virpur, Dist-
Mahisagar, Gujarat, India 2 Asst. Pros, Department of Agad Tantra Vyavahar Ayurved Evum Vidhivaideyak, Shri Gulabkunverba
Ayurved Mahavidyalaya, Gujarat Ayurved University, Jamnagar, Gujarat 361008, India
*Corresponding email: [email protected]
Abstract
Background: Vishaada is a psychological disorder as old as mankind. The Ayurvedic texts have vividly
described about various mental disorders and psychological disturbances. But the detailed description of
these disorders is arbitrary except for Unmada and Apasmara. One such ill defined and unexplored term is
Vishaada. Its references are so scattered which makes it very difficult for the clinicians to differentiate and
diagnose this condition.
Materials and Methods: Ayurvedic researchers have tried to study and compare the symptomatology of
Generalized Anxiety Disorder under the umbrella of several psychological entities but there has been a
lacuna in establishing a concrete conclusion to establish a comparative modern clinical entity in simulation
to Vishaada.
Results: In the present work a detailed analytical, reflective, critical and evaluative review of both the
historical as well as contemporary Ayurvedic medical literature was carried out. Although this work focuses
primarily on Ayurved, multidisciplinary literature and research have been analyzed along with the
philosophical literature that relates to Vishaada.
Conclusion: After studying the disorder in detail it was concluded that the psychological and somatic
presentation of the disease entity Vishaada is similar to Generalized Anxiety Disorder.
Keywords: Ayurved, Vishaada, Generalized Anxiety Disorder.
2nd International Online Conference on Biological Sciences, July 22, 2018, India
IOCBS 2018 ISBN: 978-81-934141-1-8 Rayder
16
Abstract Article
IN SILICO molecular docking studies of antibacterial drug from Amaranthus
viridis L.
Pinkie Cherian1*, D. Sheela2, Kavitha S Nair3
1Department of Botany, St.Teresa’s College, Ernakulam, Kerala, India, 682035 2Department of Botany, St.Teresa’s College, Ernakulam, Kerala, India, 682035
3Department of of Bioinformatics, U.C College Aluva, Kerala, India,
*Corresponding email: [email protected]
Abstract
Background: In silico and In vitro antibacterial activity are evolving as new trend in pharmaceutical
industry. the demand for natural drug are conquering worldwide and drug design using computational
technique provide a promising future
Materials and Methods: In the present study, an attempt was done to screen the in vitro antibacterial
activity of leaf extract of A. viridis against different human pathogenic bacteria species, LCMS analysis
were done to find the phytochemicals present and finally in silico docking of phytochemicals from leaf
extract of A. viridis with the FtsZ and 2X5O proteins of bacteria were carried out using Autodock 4.0.
Results: The methanolic extract of leaf showed significant antibacterial activity against E. coli (14 ±0.31
mm) and B. cereus (13±0.23 mm). The LCMS analysis of A. viridis plant possess pharmaceutical and
therapeutical phyto-compounds which shows antimicrobial, antioxidant and antimutagenic activity.
Conclusion: This study act as a platform for the future design of more potent antimicrobial agents and also
regarding the obtained results, caffeic acid could serve as an appropriate starting point for designing new
chemical entities as potent bacterial inhibitor.
Keywords: Antibacterial, Antioxidant, Antimutagenic, Molecular docking.
2nd International Online Conference on Biological Sciences, July 22, 2018, India
IOCBS 2018 ISBN: 978-81-934141-1-8 Rayder
17
Abstract Article
Identification and validation of growth associated SNPs in Macrobrachium
rosenbergii (De Man 1879) using Sanger sequencing
Chandan Haldar* and A. Chaudhari
Fish Genetics and Biotechnology Division, ICAR-Central Institute of Fisheries Education, Versova,
Mumbai – 61
* Corresponding email: [email protected]
Abstract
Background: Performance traits such as body growth, resistance to diseases, meat quality etc. highly
influence the profitability of the food animals including fishes. Unlike terrestrial animals or plants fishes
rarely represent any strains or varieties. Improvement of performance traits through traditional selection
integrated with molecular tools is fast and more accurate and permits us to understand the genetic
mechanism affecting performance traits. Among the molecular tools, SNPs are the most abundant
throughout the genome with high genotyping efficiency and data quality and analytical simplicity allowing
whole genome association studies and genomic selection. Quantitative traits like body growth and disease
resistance involve the interaction of potentially hundreds of genes.
Methods: In order to discover novel polymorphisms in candidate genes that could be associated with
performance traits, we screened a total of 8 candidate genes related to disease resistance, housekeeping and
regulatory functions and studied their association with body growth using growth selected and unselected
individuals of Macrobrachium rosenbergii. The genes of interest included Cytochrome oxidase subunit I
(COX1), Sodium-potassium ATPase alpha subunit (NaK), Phosphoenolpyruvate carboxykinase (PEP),
Mitochondrial Mn Super Oxide Dismutase (MSOD), Lipocalin (LIPC), Tachylectin (TLEC), Lectin 3
(Lec3), Lectin 4 (Lec4). The SNPs were found in five genes except for NaK, MSOD and TLEC. All genes
were sequenced using Sanger’s method and aligned with the reference sequence (NCBI) to detect the
polymorphism.
Result: A total of 29 SNPs were identified from five genes using 23 individuals each from growth selected
and unselected wild individuals. Out of these 29 SNPs, 8 are found in LIPC and 7, 3, 8, 3 SNPs in LEC3,
LEC4, PEP and COX1 genes, respectively. A total of 19 transitions, 10 transversions were detected among
polymorphic SNPs, A/G is the most common (12) and G/T the least common (2) substitutions observed.
Out of these SNPs, 4 each were unique in LIPC and PEP gene, 1 each in LEC3, LEC4 and COX1 gene for
growth selected individuals with high frequencies (> 65%) indicating a line specific allele segregation
tendency.
Conclusion: SNP markers from the candidate genes associated with the body growth will be useful towards
QTL identification and marker assisted selection as well as SNP chip.
Keywords: Giant freshwater prawn, Sanger sequencing, Single nucleotide polymorphism, Selective
breeding, Genetic improvement.
2nd International Online Conference on Biological Sciences, July 22, 2018, India
IOCBS 2018 ISBN: 978-81-934141-1-8 Rayder
18
Abstract Article
Phytochemical, antioxidant and growth modulating effect of Physalis minima
Geetha Samak1*, Kumaraswamy N1, Pruthvi K J1
1 DVS College of Arts and Science, Shimoga, 577201, Karnataka, India
*Corresponding email: [email protected]
Abstract
Background: Physalis minima Linn. is widely used in the indigenous system of medicine for the treatment
of diuretic, fevers, dropsy etc.
Materials and Methods: Present study was made to evaluate phytochemical constituents, antioxidant and
growth modulating activities of the plant extracts. Shade dried leaf powder of this plant has extracted with
water and fractionated with different organic solvents. An estimation of Phytochemical constituents of the
extracts such as phenolic compounds (Folin-Ciocalteau’s reagent method), flavonoids (Aluminum chloride
colorimetric method) and vitamins were done using standard methodology. Extracts and their solvent
fractions were analyzed for their antioxidant activity with the help of ferric reducing ability of plasma
(FRAP) assay. Growth modulating effects of plant extract was carried out using popular animal models
Paramecium and Drosophila culture.
Results: Physalis minima extracts contain high amount of total phenolics and showed significant reducing
power which is almost on par with the known synthetic antioxidant Butylated hydroxyanisole (BHA).
Physalis minima extract also having significant amount of flavonoids and showed positive response on
growth and multiplication of paramecia. It contains moderate amount of water soluble vitamins (vitamin B
and vitamin C) and showed positive response on growth and multiplication of Drosophila melanogastor in
agar culture medium. Striking Growth promoting effect was found at lower concentrations of extract and
was seen in all stages of fruit fly development.
Conclusion: Physalis minima contains high amount of antioxidant phenolics, plant extracts showed
significant positive response on growth and multiplication of paramecia and Drosophila flies.
Keywords: Antioxidant, Flavonoids, Phenolics.
2nd International Online Conference on Biological Sciences, July 22, 2018, India
IOCBS 2018 ISBN: 978-81-934141-1-8 Rayder
19
Abstract Article
Phytochemical analysis and antimicrobial activities of Emblica officinalis (L)
leaf extracts against fish pathogen Aeromonas hydrophila
Runa Paul1*, Asha Khanna2, Rita Bhandari3
1Department of Zoology, St. Aloysius’ College (Auto), Jabalpur (M.P), India
2Department of Zoology & Biotech, Govt. Model Science College (Auto) Jabalpur (M.P), India
3Department of Zoology Govt. OFK Degree College, Khamaria, Jabalpur (M.P), India
*Corresponding email: [email protected]
Abstract
Background: Plants with medicinal values are known to human since prehistoric times. Today medicinal
plants are broadly used in everyday life mainly because they are cheaper, effective with no side
effects. Emblica officinalis (L) commonly known as Indian Gooseberry is a sacred tree in India with edible
fruits. All parts of the amla plant are widely used in various ayurvedic treatments as it is a good source of
vitamin C, possess antioxidant property and contains many minerals and vitamins.
Materials and Methods: The present study was to evaluate the qualitative screening of phytochemical
constituents and quantitative study of total flavonoid content, total phenol content, total tannin and in-vitro
antioxidant activity; these were determined by aluminium chloride colorimetric method, Folin-ciocalteu
method, and ferric reducing antioxidant power method respectively. The anti-bacterial activity of aqueous
leaf extracts of different concentration of (25%, 50%, 75% and 100%) Emblica officinalis against
Aeromonas hydrophila was done by agar well diffusion methods.
Results: Qualitative study reported the presence of tannins, saponins, flavanoids and phenols. Quantitative
investigation showed variable amounts of phytochemical constituents such as tannins, flavonoid, and
phenol and antioxidant activity in the leaf extract. The most efficient inhibitory activity was examined in
higher concentration (100%) of aqueous extract leaf extracts of Emblica officinalis.
Conclusion: From the results, the present study indicated that Emblica officinalis not only contains high
amount of phytochemical compounds but showed higher medicinal value. Emblica officinalis possess
powerful antimicrobial activity against Aeromonas hydrophila and can be used in various ayurvedic
treatments.
Keywords: Emblica officinalis, phytochemical constituents, Quantitative, Qualitative analysis,
Aeromonas hydrophila.
2nd International Online Conference on Biological Sciences, July 22, 2018, India
IOCBS 2018 ISBN: 978-81-934141-1-8 Rayder
20
Abstract Article
A review on applications of CRISPR-gene editing technology for retinal
diseases
Sourab Kulkarni1,*, Vidyashree V1, Sravanti Vaidya1
1Department of Biotechnology, Ramaiah Institute of Technology
*Corresponding email: [email protected]
Abstract
Background: CRISPR (Clustered regularly interspaced short palindromic sequences) are palindromic
sequences which serve as acquired immunity for bacteria against Bacteriophage genome. CRISPRs are
found in approximately 50% of sequenced bacterial genomes and nearly 90% of sequenced archaea.
Bacterial type II CRISPR sequences create guide RNAs that direct site-specific DNA cleavage by the Cas9
endonuclease in cultured cells. The CRISPR-Cas 9 system functions in-vivo to induce targeted genetic
modifications that can have various applications in disease pathology. CRISPR-Cas 9 can also be used for
silencing pathogenic mutations which can be achieved by using a pair of sgRNAS (single guide RNAs).
These sgRNAs bind to either side of target region in the DNA resulting in its excision. Based on this
CRISPR technology treatment for retinal diseases like Leber Congenital Amaurosis type 10 (LCA10) and
Retinitis Pigmentosa (RP) have been developed. Similarly, CRISPR-Cas9 system is being applied for
treatment of various diseases. LCA 10 retinal disease is caused by mutations in intron 26 of CEP 290 gene
(Centrosomal Protein) leading to severe loss of vision. This mutation generates a premature stop codon in
half of all transcripts due to aberrant splicing resulting in reduced CEP 290 activity. Retinitis Pigmentosa
(RP) is characterised by loss of rod cells leading to secondary cone cell death causing reduced night and
peripheral vision. It is estimated that over 3000 mutations in about 60 genes are responsible for RP. Nrl and
Nr2e3 are transcription factors involved in the differentiation and regulation of rod cells which are mutated
in the disease.
Materials and methods: Using a pair of sgRNAs produced in CRISPR a section of DNA containing a
pathogenic mutation was removed. Ruan et al. proposed that this method can be used to cure LCA 10 retinal
disease. For RP, despite the absence of transcription factors, mutationally sensitive rod cells can be
converted into cone cells by CRISPR induced cellular reprogramming. CRISPR/Cas9 is used to cause
targeted gene disruption of either Nrl or Nr2e3 via subretinal injection of mice between P7 and P14
postnatal days.
Results: Applying CRISPR-Cas9 technology intron 26 of CEP 290 was successfully removed from wild-
type mice retinal cells in vivo in 7.5% to 26.4% of cases leading to reduction in the disease. Treating RP
with CRISPR, researchers observed a downregulation of rod-specific genes and an up-regulation of some
cone-specific genes. Zhu et al. (2017) reported significantly improved cone and rod cell function. Yu et al.
(2017) reported functional cone and rod activity at 4 months of age in the mouse lines.
Conclusion: Thus, in both cases of LCA10 & RP retinal diseases CRISPR provided a new face of gene
editing technology which is highly efficient compared to the conventional gene therapy. Thus CRISPR can
aid in treatment of severe diseases.
Key words: Crisper, cas-9, Leber Congenital Amaurosis type 10, Retinitis pigmentation.
2nd International Online Conference on Biological Sciences, July 22, 2018, India
IOCBS 2018 ISBN: 978-81-934141-1-8 Rayder
21
Abstract Article
A novel mtDNA sequence analysis paradigm using confusion matrix
Varsha Ravi1, Praharshit Sharma2*
1Bachelor of Technology (Bioinformatics), SASTRA University, Thanjavur, Tamil Nadu, India
2Professional Member, ISCB: International Society for Computational Biology, USA
*Corresponding email: [email protected]
Abstract
Background: Traditional DNA sequence analysis have been chiefly focusing on HMMs/ Hidden Markov
Models (short-range), Fourier-transform (Long-range), GC-content (%, Percentage of content of Guanine+
Cytosine in the single-strand DNA) and for instance rho-Score (Ratio of particular di-Nucleotide frequency
to product of corresponding Individual nucleotide frequencies). There is a Need for a comprehensive
outlook of DNA sequence analysis framework, which we aim to address in this work by correlating the 4
Bases of DNA (A|C|G|T) to confusion matrix parameters (TP|TN|FP|FN), as follows.
Materials and Methods: Human Mitochondrtial DNA (mtDNA) of rCRS (Revised Cambridge Reference
Sequence) updated version with RefSeq Accession J01415.2 was obtained from NCBI and based on “No-
replacement permutations” of the 4 nuclotides with respect to Confusion Matrix parameters, namely TRUE-
Positive/ Negative and FALSE-Positive/ Negative, each of the resultant parameters were computed and
graphically represented, such as Sensitivity/ Recall/ Hit rate/ TPR (True Positive Rate), Specificity/ TNR
(True Negative Rate), Precision/ PPV (Positive Predictive Value), NPV/ Negative Predictive Value), Miss
Rate/ FNT (False Negative Rate), Fall-out/ FPR (False Positive Rate), FDR (False Discovery Rate), FOR
(False Ommission Rate), Classification Accuracy (CA) and Error Rate (ER), F1-score (Harmonic mean of
Precision, Recall),
Fr-measure (Weighted Harmonic Mean of Precision, Recall), MCC (Matthews Correlation Coefficient),
BM (Bookmarker Informedness), Markedness (MK), Postive and Negative Likelihood, BCR (balanced
Classifcation Rate), Youden's index, Discriminant power and We plot the ROC curve (Receiver Operating
Characterisric) and Cumulative Life Chart (CLC).
Results: We examine the graphical representations of each parameter inspired by Confusion matrix above
and seek to correlate thresholds for functional annotation of mtDNA genes, 13 of 37 being protein-coding,
which are conserved Maternally.
Conclusion: Our results can be extended to various Genes and Genomes, for generating a comparative
framework within which each parameter can be assigned some carefully computed threholds toward going
forward to characterize their Ontolgies and annotations (Molecular Fucntion, Biological Process and
Cellular Component) purely based on DNA sequence analysis, as per parameters calculated above.
Keywords: mtDNA analysis, DNA sequence, Sequence annotation, Parameter thresholds, Genotype
phenotype, One-to-One-correspondence, Nucleotides, Binary classification.
2nd International Online Conference on Biological Sciences, July 22, 2018, India
IOCBS 2018 ISBN: 978-81-934141-1-8 Rayder
22
Abstract Article
Taxonomic significance of external genitalia in genus metanastria hübner
(lasiocampidae: bombycoidea: lepidoptera)
Amritpal Singh Kaleka, Devinder Singh, and Sujata Saini*
Department of Zoology and Environmental Sciences
Punjabi university, Patiala-147002, Punjab
*Corresponding emails: [email protected]; [email protected]
Abstract
Background: Insects are a highly specialized group of invertebrates belonging to largest animal phylum,
the Arthropoda. Lepidoptera comprising moths and butterflies is third largest order in the insect world
(Zhang, 2013). The family Lasiocampidae belonging to the superfamily Bombycoidea is one of the
important families of this order. The significance of the morphological details of external genitalic features
for identification and differentiation of different taxa is well known in insects and particularly in moths and
butterflies referable to order Lepidoptera. The family name Lasiocampidae was given by Harris (1841)
based on the Greek words ‘Lasio’ (wooly) and ‘Campa’ (caterpillar). These moths are commonly known
as Eggar moths (the neat egg-shaped cocoons), Snout moths (unique protruding mouth parts resembling the
large nose) or Lappet moths (decorative skin flaps found on the caterpillar’s prolegs). This cosmopolitan
family has about 1500 species referable to 150 genera (Leurat, 2006). It is further classified into two
subfamilies: Lasiocampinae and Pinarinae (Zolotuhin and Pinratana, 2005). Dendrolimus sibiricus
Chetverikov and Dendrolimus superans Chetverikov are important defoliators of coniferous trees and
Metanastria hyrtaca Cramer and Streblote siva Lefebvre are major pests of vegetables.
Materials and Methods: During present studies, members of two species of genus Metanastria Hübner
have been collected from different localities of Himachal Pradesh, Jammu & Kashmir and Uttarakhand
using light traps. The species were identified as Metanastria hyrtaca (Cramer) and Metanastria mantra
Zolotuhin. The procedure given by Robinson (1976) to explore the external genitalic attributes has been
followed and to study wing venation, the procedure given by Zimmerman (1978) has been adopted. The
terminology for naming different genitalic features is after Klots (1970).
Results: The species Metanastria hyrtaca (Cramer) and Metanastria mantra Zolotuhin. are closely related
and it is very difficult to separate out on the basis of external morphological characters only. The male
genitalic features such as tegumen; socii; vinculum; saccus; juxta; valvae and aedeagus of these species
have been explored in detail and it has been found that these genitalic features proved to be the most reliable
and important taxonomic tool in differentiating these closely related species.
Conclusion: The present study signifies the role of external genitalic features in differentiation and
diagnosis of different taxa that are morphologically identical in family Lasiocampidae.
Keywords: Lasiocampidae, External genitalia, Metanastria Hübner.
2nd International Online Conference on Biological Sciences, July 22, 2018, India
IOCBS 2018 ISBN: 978-81-934141-1-8 Rayder
23
Abstract Article
Taxonomic status of genus Pida walker lymantriidae (noctuoidea:
lymantriidae) from north-west india
Amritpal Singh Kaleka, Devinder Singh, and Gaganpreet Kour Bali*
Department of Zoology and Environmental Sciences
Punjabi university, Patiala-147002, Punjab
*Corresponding emails: [email protected]; [email protected]
Abstract
Background: The class Insecta of the phylum Arthropoda is one of the most diverse groups containing
about 66% of the total described animal species. Insects are extremely successful in all kinds of natural and
modified terrestrial and aquatic ecosystems (Gullan and Cranston, 1994). Lepidoptera comprising of moths
and butterflies is the third largest order in the Insect world after Coleoptera and Diptera (Zhang, 2013).
Lepidoptera comprising of phytophagous insects and the largest order that is almost entirely associated with
angiospermous plants. The family Lymantriidae, referable to Superfamily Noctuoidea, commonly known
as tussock moths forms an assemblage of fascinating group of moths having immense economic,
environmental and aesthetic importance. These moths are well represented in all zoo-geographic regions
with about 2500 species under 360 genera (Holloway, 1999) many of which are of agronomic importance
(Chao, 2003). The present study deals with the taxonomic status of genus Pida Walker from North-West
India. Walker (1865) established this genus with apicalis Walker as its type species from Khasis hills
(Assam, India). Hampson (1892) described two species namely Pida apicalis Walker and Pida stragipennis
Moore from India. Chao (2003) included five species of this genus in Fauna Sinica.
Materials and Methods: The adult moths were collected by conducting survey cum collection tours in
different localities of North-West India by using light traps equipped with a 160 w mercury bulb and a 2 ×
2.5m white screen. The present species under reference was sorted out from the collected material and
identified on the basis of external morphological characters. To study of wing venation, the methodology
proposed by Zimmermann was followed. The specimen was dissected out to examine the male external
genitalic features and the terminology for naming various genitalic parts given by Klots was followed.
Results: The external morphological characters including wing venation and external genitalic features of
two species of genus Pida Walker have been extensively studied in detail. Though these species are distinct
on the basis of external morphological features such as general colouration, wing maculation and
ornamentation of different body parts but the wing venation and genitalic features has strengthen the
morphotaxonomy of these species for their authentic identification.
Conclusion: From the present studies, it has been concluded that the study of external male and female
genitalia, particularly in Lepidoptera, is very important as it is highly species specific and shows much
structural details. The two species referable to genus Pida Walker are authentically identified and
differentiated from each other using external genitalic features. Thus, the external genitalic characters are
species specific there by aiding in species differentiation.
Keywords: Lepidoptera, genitalia, morphotaxonomy.
2nd International Online Conference on Biological Sciences, July 22, 2018, India
IOCBS 2018 ISBN: 978-81-934141-1-8 Rayder
24
Abstract Article
Insulin influences peptidylarginine deiminase 4 activity
Binchu V Shaji1, Haritha V H1, Anie Y1 *
1School of Biosciences, Mahatma Gandhi University, Kottayam, Kerala, India
*corresponding email: [email protected]
Abstract
Background: Peptidylarginine deiminase (PAD) catalyses the post translational modification of certain
proteins - termed as citrullination or deimination. During this process, positively charged arginine residues
present in the protein is converted to neutral citrulline. Among the five different PAD isoenzymes, PAD4
gains special interest because of its role in immunity and its participation in various autoimmune and
inflammatory diseases. PAD4 is localized mainly in immune cells such as granulocytes, monocytes,
macrophages etc. Hypercitrullination of proteins has a major impact on immune regulation and so,
emerging evidences of influence on PAD4 activity by endocrine system is intriguing. High PAD4
associated activity in hyperglycemia is shown to be responsible for immune activation and microvascular
complications in diabetes patients. Considering the facts that the insulin is the major hormones involved in
glucose homeostasis and that it influences many functions of neutrophils and monocytes, it is very
important to reveal the relation between insulin and PAD4 activity. Therefore, the present study looks into
changes in PAD4 activity in the presence of insulin.
Materials and Methods: First, freshly isolated human neutrophils were pre-treated with insulin (100 pM
and 400 pM) for 5 minutes. Then, the cells were stimulated using S. aureus culture supernatant (SCS) for
1 or 3 hours or were lysed without giving SCS treatment. PAD4 activity was determined in them by the
method described by Senshu et al. (1989) and the results were compared with appropriate controls.
Results: Even in the absence of SCS stimulation, PAD4 activity was found to be increased in both insulin
concentrations (p<0.0001). Though PAD activity remain unchanged in insulin-treated neutrophils (100pM
and 400pM) in the presence of SCS, control (without insulin) showed dramatic increase in PAD activity
(p<0.0001). However, increase in the duration of SCS treatment from 1 hr to 3 hrs caused slight increase
in PAD4 activity only in the presence of 400 pM insulin.
Conclusion: Insulin seems to be a positive regulator of PAD4 activity in the absence of any stimulus; this
could be necessary for maintaining physiological citrullination levels in proteins. But upon stimulation,
presence of insulin does not elevate PAD4 activity to levels that facilitate adequate protein citrullination or
associated immune activation that are necessary to tackle infection. So, lower insulin levels are anticipated
just after infection to generate a prompt and heightened immunity. This finding can be correlated with
increased stress hormone activity or reduced insulin activity observed in humans after infections.
Keywords: insulin, neutrophil, peptidylarginine deiminase, S. aureus culture supernatant.
2nd International Online Conference on Biological Sciences, July 22, 2018, India
IOCBS 2018 ISBN: 978-81-934141-1-8 Rayder
25
Abstract Article
Taxonomic significance of internal genitalic organs in family lymantriidae
(lepidoptera)
Amritpal Singh Kaleka1 and Navkiran Kaur2*
1,2Department of Zoology and Environmental Sciences, Punjabi University, Patiala, 147 002, India
*Corresponding Author Email: [email protected], [email protected]
Abstract
Background: Insects are the most significant species both in variety and number, blanketing our planet
with over 1,020,007 species (Wilson, 1992) and stand out as the most successful organisms. In class Insecta,
the order Lepidoptera comprises moths and butterflies is one of the largest insect orders. The family
Lymantriidae with world-wide distribution comprising of important pests affect the agricultural crops, trees
and ornamental plants in fields, forests and urban areas. The internal genitalic structures are considered to
be significant because these features are highly species specific. The present research work has been
initiated since September 2014 to study and evaluate the taxonomic significance of internal genitalic
features in Lymantriid moths. As many as 50 localities falling in the State of Himachal Pradesh and
Uttarakhand have been extensively surveyed for the collection. So far, the specimens of 15 species have
been dissected out to explore and examine the male and female internal genitalic organs. The first reference
about the examination of the genital system goes back to 1669 when Malphigi perhaps for the first time
made an attempt to study the anatomy of silk moth, Bombyx mori Linnaeus. His publication not only
provided means for such kind of studies but also aroused the interest of other workers in this altogether
neglected subject.
Materials and Methods: Immediately after collection, adult Lymantriid moths were starved for 8-10 hours.
After starvation moths were killed with ethyl acetate vapours in killing jars. The abdomens of killed moths
were detached and rolled on cellophane tape for the removal of the scales (Fatzinger, 1970). The dissections
were done in physiological saline solution as advocated by different workers like Weidner (1935), Williams
(1941) and Fatzinger (1970). The genitalic organs of different species were preserved in a mixture of 70%
alcohol and 5% glycerol in the ratio 1:4.
Results: Internal male genitalia of family Lymantriidae comprises of a pair of testis, seminal vesicles, vasa
deferentia, ductus ejaculatorius duplex, accessory glands, primary simplex, constrictor muscular area and
cuticular tube. The internal female genitalia comprises of a pair of ovaries, common terminal filament, egg
tubes, pedicels, a pair of lateral oviducts, pair of common oviducts, vestibulum, infundibulum, vagina,
spermathecal gland divisible into utriculus, lagena and spermathecal duct, accessory glands, ductus
seminalis and bulla seminalis.
Conclusion: Compared to the long tradition of using characters of the external genitalia in lepidopteran
species taxonomy, the taxonomic use of internal genitalia is a relatively recent and rapidly developing
aspect of research (Mikkola, 2007). During present studies, as many as 15 species have been dissected out
and has been examined for male and female internal genitalic features. These features will provide a new
insight in the taxonomic attributes of family Lymantriidae.
Keywords: lymantriidae, moths, species, genitalia.
2nd International Online Conference on Biological Sciences, July 22, 2018, India
IOCBS 2018 ISBN: 978-81-934141-1-8 Rayder
26
Abstract Article
Menstrual hygiene: are “free days” making our rural adolescent girls feel
free?
Supriyalaxmi N Totiger1*, Syed Yunus Zama1
1 Department of Community medicine, Mysore Medical College & Research Institute, Irwin Road
Mysuru, 570001, India
*Corresponding email: [email protected]
Abstract
Background: Menstruation is a phenomenon unique to the females. Adolescent girls constitute a
vulnerable group. Women having better knowledge regarding menstrual hygiene and safe practices are less
vulnerable to RTI and its consequences. Scheme for promotion of menstrual hygiene started in 2010 under
NHM aimed ensuring adolescent girls in rural areas have adequate knowledge and information about
menstrual hygiene and use of sanitary napkins. The sanitary napkins are provided under NHM’s brand,
‘Free days’. The present study was planned with the objectives as follows.
1. To assess the knowledge and practice of menstrual hygiene and sanitary napkins usage.
2. To assess the factors related to menstrual hygiene
3. To assess the quantitative and qualitative satisfaction of the users of the “FREE DAYS”.
Materials and Methods: A Cross-sectional study was conducted among all [census method] the adolescent
girls of rural residential school of rural Mysuru. Data collection was done using validated self-administered
questionnaires having four sections, Socio-demographic characteristics, questions about knowledge,
attitude and practice regarding menstrual hygiene and sanitary napkins usage.
Results: A total of 117 girls were interviewed out of which 47 had not attained menarche and hence
excluded from the study. Average age of the study population is 13-15 years. Average age of menarche of
the study population is 12-14 years. 92.8% (N= 65) study population use absorbents only. Knowledge and
practice regarding menstrual hygiene practices are adequate and satisfactory. From this study we have
known that supply side intervention is done through ensuring a supply of a product (sanitary napkin) which
is reasonably priced and of satisfactory quality. But it has been known that 99.9% of the rural adolescent
girls are not getting enough quantity.
Conclusion: Good menstrual hygiene is essential for the health and dignity of girls and women. Limited
access to products for sanitary hygiene, and lack of safe sanitary facilities could prove to be barriers.
Increasing access to the requisite sanitary infrastructure related to menstrual hygiene is important. Providing
sufficient quantity of sanitary napkins is of paramount importance. Our results study is needed to be carried
out in larger population so that there is more generalised evidence to bring about change in the programme.
Keywords: Menstrual Hygiene, Adolescent girls, Free Days.
2nd International Online Conference on Biological Sciences, July 22, 2018, India
IOCBS 2018 ISBN: 978-81-934141-1-8 Rayder
27
Abstract Article
Psychosocial determinants of infant weight gain in rural South India
Sushantha1*, Mudassir Azeez Khan2
1Post-graduate student, Department of Community Medicine, Mysore Medical College & Research
Institute, Rajiv Gandhi University, Irwin Road, Mysuru, 570001, India 2Professor & Head, Department of Community Medicine, Mysore Medical College & Research Institute,
Rajiv Gandhi University, Irwin Road, Mysuru, 570001, India
*Corresponding email: [email protected]
Abstract
Background: Growth of the child in the intra-natal period and in the first year of life are known to be
essential for development of the child in all domains. Early detection of risk factors of malnutrition is
necessary as intervention as early as possible would be beneficial to curb malnutrition in the growing child.
Obstetric & medical factors contributing to infant weight gain have been taken care of via various
programmes. Hence the study is planned to create evidence for other determinants especially psycho-social
determinants so that if found significant, can be included in the programme.
Materials and Methods: Infants born between May 2016 and April 2017 were included in the study. Their
weights were regularly monitored at the sub-centres where the children were registered; and also, at the end
of first year by self. The mothers were chosen as informants considering their reliability. Also, they were
screened for PPD with Edinburgh Postnatal Depression Scale. Risk factors were evaluated by a self-made
questionnaire based on literature. Data collected was entered & analysed using Epi-info software.
Results: The study shows that one of the most important determinants of infant weight gain is Post-partum
depression (p value: 0.022). Other psychological determinants were overall relationship with the husband,
parents & in-laws apart from pressure to become pregnant from the elderly/ pressure for a female child. It
was interesting to know that gender of the child was not significantly associated with the nutritional status.
Regarding social aspects, maternal age, education & occupation of the couple, type of family & their
socioeconomic status was found to be significant determinants. A new determinant significantly associated
with inadequate infant weight is absence of father for most of the days.
Conclusion: Psycho-social determinants play a major role in growth of the children during their infancy.
Since the country has now taken care of medical determinants via programmes & the country is in its
transition phase with regards to disease trends, it is necessary to start paying attention towards these
determinants.
Keywords: Infant weight gain, Post-partum depression, Social determinants, Mental health.
2nd International Online Conference on Biological Sciences, July 22, 2018, India
IOCBS 2018 ISBN: 978-81-934141-1-8 Rayder
28
Abstract Article
Relationship of shoot gall psylla (Apsylla cistellata Buckton) oviposition with
gall formation, panicle initiation and adult emergence in mango
Jyoti Raina1* and Poonam Srivastava2
1Ph.D Scholar, Department of Entomology, GBPUAT, Pantnagar, Uttarakhand 2Associate Professor, Department of Entomology, GBPUAT, Pantnagar, Uttarakhand
*Corresponding email: [email protected]
Abstract
Background: Shoot gall psylla, Apsylla cistellata Buckton is a harmful pest of mango in Uttarakhand,
where it is quite familiar with the name of Ghundi rog, as it leads to the formation of conical shaped galls
in place of reproductive and vegetative buds, which directly interfere with the inflorescence and affect the
yield of mango crop in later stages.
Materials and Methods: The investigation was carried out with 5 treatments- leaves with no egg/twig (15
cm length), leaves with 10 eggs/twig, leaves with 50 eggs/twig, leaves with 100 eggs/twig, and leaves with
200 eggs/twig, with the aim to determine a relationship between a number of eggs laid by mango shoot gall
psylla on leaves and number of galls formation, panicles initiation and adults emergence.
Results: It was found that galls formation was not recorded on twigs without eggs and as the number of
eggs were increasing on leaves, gall formation was also increasing proportionately in the same manner. In
case of leaves with maximum 200 eggs/twig, gall formation was also found maximum (41.01 and 40.11
galls/twig) by transforming all buds into galls, during 2016 and 2017. On calculation of gall: egg ratio it
was observed that in case of leaves with 10 eggs (1 gall: 1.69 and 1.22 eggs) ratio was found followed by
50 eggs with ratio 1 gall: 1.96 and 2.25 eggs which was found significantly higher than 100 eggs and 200
eggs with ratio 1 gall: 3.28 and 2.85 eggs and 1 gall: 4.88 and 4.99 eggs, respectively during both the years
of investigation. This clearly quantified that as the number of eggs were increasing on leaves, the gall: egg
ratio was also increasing at the same time per twig. However, panicle emergence was found reducing as the
number of eggs were increasing. Panicle initiation in case of twigs without egg bearing leaves (3.25 and
3.15 panicles/twig), was found significantly higher than the twigs with 200 eggs, in which panicle initiation
was not recorded. Results on reduction in panicle emergence revealed that in case of leaves with 10
eggs/twig panicle emergence was reduced by 49.23 and 32.06%, followed by leaves with 50 eggs (66.46
and 67.94%), whereas maximum reduction (100%) was found in case of leaves with 200 eggs/twig. It was
also recorded that adult emergence also increased proportionately as the number of eggs increased on a
twig. Maximum adult emergence (156.25 and 150.79 adults/twig) was recorded in case of twig with 200
eggs. Correlation analysis also revealed a positive significant association eggs and galls formation (r =
0.923, 0.916) and adults emergence (r= 0.956 and 0.945), whereas, egg number was found significantly
negatively related to (r= -0.885, -0.881) panicle emergence during both the years of experiment.
Conclusion: As the pest scenario is changing frequently year by year due to several factors viz., ecological
factors. This study could be proved helpful in implementing successful management practices for this pest.
Keywords: Shoot gall psylla, panicles, correlation.
2nd International Online Conference on Biological Sciences, July 22, 2018, India
IOCBS 2018 ISBN: 978-81-934141-1-8 Rayder
29
Abstract Article
Differential preference of fast-food consumption in few representative areas of
West Bengal
Tanaya De1,*, Moumita Rakshit2 1 Department of Zoology, Hooghly Mohsin College, Chinsurah, Hooghly, Pin -712101, India
2 Department of Zoology, Barasat Govt. College, Barasat, Kolkata – 700124, India
*Corresponding email: [email protected]
Abstract
Background: Globalisation and urbanisation have greatly affected the food-habits of people at large. Many
have been inclined to consume high-calorie fast-foods. These are foods designed for ready-availability, sold
at restaurants for quick-availability. Different types include samosas, rolls, chats in Indian context, also
burger, pizza, oily-fries etc. have entered India. The spread of fast-food has penetrated so deep in psyche
that it has become a global-phenomenon. It has impacted health and incidence of several problems like
obesity, cardiovascular and digestive anomalies, diabetes, hypertension etc. have been correlated by several
studies to fast-food consumption.
Materials and Methods: We designed field survey in two interior Panchayet-areas in North-24-pgs and
on two regions of proper-city, Kolkata as well as an online-survey. Questionnaires were prepared for the
said surveys.
Results: In field-survey, fast-food consumption index showed that 25% of city-respondents preferred fast-
food consumption everyday while in the Panchyet-area no respondent said about their daily consumption.
However, 50% of respondents in both sites preferred fast-food in alternate days. When overworked, the
83.3% respondents in Panchyet-area preferred to boil something to eat, while only 8.3% preferred fast-food
at that situation, in contrast, the 41.7% of city-respondents were inclined to fast-food when tired and
overworked. Influence of advertisements too was found much more in respondents of Panchayet-areas
compared to city (25% versus 0%). Consciousness that fast-food may cause overweight and obesity is also
more in city-respondents (91.7%) compared to 25% respondents of Panchayet-area. BMI-Index calculated
were near-normal in 83.3% of Panchayet-area-respondents compared to only 25% of city-respondents who
showed near-normal BMI. In online survey, pattern of rate of fast-food consumption differed, everyday and
every-alternate day consumption was found very less in respondents and 36.4% showed their inclination to
consume once a week. Influence of advertisements was very less too, only in 4.5%. Knowledge of being
overweight was also found in 68.2% respondents as compared to half- or no-knowledge in other
respondents.
Conclusion: These differences between field and online studies may be due to the fact that online studies
had respondents with age 22 to 30 yrs while field study had a much wider range of age of respondents. The
online-respondents, moreover, are mostly from city and town area of West Bengal, as expected, due to the
availability and acceptability of cyber-systems. The trend is thus, though city persons have the idea that
fast-food causes obesity and health-problems, yet urban-busy life prompts them to depend on such high-
calorie food especially when exhausted. Thus, the BMI of city-respondents was found to be more than that
of interior Panchayet-areas. Types of fast-food availability may have been also different in city and interior
areas. This regressive change in life-style should be taken seriously and conscious efforts are to be taken to
avoid such temptations.
Keywords: Fast-food, Obesity, Urban-life.
2nd International Online Conference on Biological Sciences, July 22, 2018, India
IOCBS 2018 ISBN: 978-81-934141-1-8 Rayder
30
Abstract Article
3D structure modelling, docking studies of NQO1- isoform 1, 2 with FAD and
anti-cancer drug RH1
Gupta Pramodkumar P1,2,6*, Bastikar Virupaksha A1,3, Kothari Shanker L2, Cicenas
Jonas1,4,5, Valius Mindaugas1
1Proteomics Center, Institute of Biochemistry, Vilnius University Life Sciences Center, Vilnius,
Lithuania. 2Amity Institute of Biotechnology, Amity University Rajasthan, Jaipur, Rajasthan, 303002,
India. 3Amity Institute of Biotechnology, Amity University Mumbai, Maharashtra, India.; 4Department of
Microbiology, Immunology and Genetics, Max F. Perutz Laboratories, University of Vienna, 1030
Vienna, Austria; 5MAP Kinase Resource, Bioinformatics, Melchiorstrasse 9, Bern, 3027, Switzerland.; 6School of Biotechnology and Bioinformatics, D Y Patil Deemed to be University, Navi Mumbai,
Maharashtra, India
*Corresponding email: [email protected] / [email protected]
Abstract
Background: NQO1 (NAD(P)H Quinone Dehydrogenase 1) is a Protein Coding gene. NQO1 is a FAD
binding protein form homodiners that reduces quinones to hydroquinones. The enzymatic activity of NQO1
prevents the one electron reduction of quinones that results in production of radical species. High levels
expression of NQO1 has been noted in numerous human malignancies such as breast cancer, pancreatic
cancer, colorectal cancer, cholangiocarcinoma, uterine cervical cancer, melanoma, and lung cancer. FAD
is co-factor to NQO1 that supports the binding of RH1 drug into the cavity of NQO1. Here we have
modelled 3D – structure of NQO1 – isoform 1 and 2 and perform molecular dynamic simulation and
molecular docking studies to identify the appropriate binding strategy of FAD and RH1 in NQO1-isoform
1 and 2.
Materials and Methods: The NQO1-isoform 1 and 2 was retrieved from Uniprot id: P15559. The
homodimer 3D structure of NQO1 isoform 1 and 2 was modelled using SWISS-MODEL server. The 3D
modelled protein was selected as an initial input to dynamic simulation using NAMD under water body
solvent system for 5000 iterations keeping 2ps each at 373K. The cavity selected for the FAD and RH1
were pre-defined from 1H66 pdb-id, i.e. a solved 3D crystallized structure of NQO1 with FAD and RH1,
calculated using multiple sequence alignment approach. The molecular docking simulation is carried out
using Autodock vina implementing genetic algorithm. Total 10 docked poses were generated and top most
with least energy is considered as the optimum conformation of docking result. The protein – ligand
complex wre generated using Chimera and interactions were visualized in BioVia discovery studio 12.0
Results: The homology between the query sequence and template were scored with 99.6% to 100%. NOQ1-
isoform 1 resulted a 99.6% identity with pdb-id: 1H66, whereas the NQO1-isoform2 has a deleted part, but
the rest of the sequence exhibited a 100% identity with the template structure pdb-id: 5EA2. The dynamic
study revealed a good degree of optimization and minimum deviation from its initial model to final one.
The docking studies revealed a good binding energy and identical pharmacophoric interactions with respect
to NQO1-isoform1, whereas due to the deletion of – amino acid residue in the NQO1-isoform 2 leads a
structural change in cavity area exhibited a similar binding pattern.
Conclusion: Currently our study revealed only in-silico based results, where the presence of FAD a
cofactor to NQO1 is an important to anticancer drug RH1 binding in the cavity of the NQO1. The outcomes
reveal that though there is a deleted region in the NQO1-isoform 2, the partial region of cavity for FAD and
RH1 binding holds a good degree of interaction.
Keywords: NQO1, FAD, RH1, Molecular docking, Cancer.
2nd International Online Conference on Biological Sciences, July 22, 2018, India
IOCBS 2018 ISBN: 978-81-934141-1-8 Rayder
31
Abstract Article
SAR & QSAR analysis of Camptothecin (CPT) as Topoisomerase 1 Inhibitors
using molecular modelling techniques
Bastikar Virupaksha A1*, Bhatia Hitendra2, Bastikar Alpana 3 Chhajed Santosh S4 and Gupta
Pramodkumar P2
1Amity Institute of Biotechnology, Amity University Mumbai, Maharashtra, India. 2School of Biotechnology and Bioinformatics, D Y Patil Deemed to be University, Navi Mumbai,
Maharashtra, India 3CADD Department, Navin Saxena Research and Technology Pvt Ltd, Kandla, Gujarat, India
4Department of Pharmaceutical Chemistry, Bhujbal Knowledge City, MET's Institute of Pharmacy
Adgaon, Nashik, Maharashtra, India.
*Corresponding email: [email protected]
Abstract
Background: Camptothecin (CPT) a unique pentacyclic quinoline alkaloid originally isolated from a native
tree of Tibet and China called Camptotheca acuminata in latin and Xi Shu in Chinese, is one of the
prominent lead compounds in anticancer drug development. CPT has a planar pentacyclic ring structure,
that includes a pyrrolo[3,4-β]-quinoline moiety (rings A, B and C), conjugated pyridone moiety (ring D)
and one chiral centre at position 20 within the alpha-hydroxy lactone ring with (S) configuration (the E-
ring). Enzyme DNA topoisomerases exist in all living organisms. In humans, there are 6 topoisomerase
genes coding for nuclear topoisomerase I (Top1), mitochondrial Top1 (Top1mt), topoisomerase II a and II
b, and topoisomerase III a and III b. A critical function of Top1 is to relax supercoiled DNA in transcribing
and replicating chromatin. Topo1 may also play roles in DNA repair and recombination’s. DNA
topoisomerases are the targets of antimicrobial and anticancer drugs, and mammalian Top1 is the selective
target of CPT.
Materials and Methods: In this study, we performed molecular docking of CPT derivatives against Topo-
I using Autodock Vina. Pharmacophore mapping was done to validate the binding interactions between
CPT analogues and the receptor molecule topoisomerase I. In order to perform the anticancer activity
screening of the CPT derivatives, 2D quantitative structure activity relationship (2D-QSAR) model was
generated for a set of 400 CPT lead derivatives, by employing k-nearest neighbour molecular field analysis
(kNN MFA) technique using VLife MDS 3.5 software.
Results: The predictive squared correlation coefficient (q2) (Q square) value was found to be 0.6052.
QSAR model helps to determine the anticancer activity & to delineate the important descriptors responsible
for the biological activity of the CPT derivatives. Thus, we have high expectations for the next generation
and further development of new and better antitumor CPT derivatives.
Conclusion: The knowledge of SAR, together with the generation of QSAR model, constitutes a large body
of evidence that may assist in the development of new molecules with excellent biological activity and low
toxicity. One can very well have concluded that the camptothecin (CPT) analogues are emerging as a
promising group of chemotherapeutic agents. Thus, we have high expectations for the next generation and
further development of new and better antitumor CPT derivatives.
Keywords: Topoisomerase I, Camptothecin, Molecular docking, QSAR and KNN-MFA.
2nd International Online Conference on Biological Sciences, July 22, 2018, India
IOCBS 2018 ISBN: 978-81-934141-1-8 Rayder
32
Abstract Article
Impact of paternal age and addictions on Down Syndrome live birth
Poulami Majumder*
Department of Biotechnology, Centre for Genetic studies, School of Biotechnology and Biological
Sciences, West Bengal University of Technology, Kolkata, West Bengal 70064, India
*Corresponding email: [email protected]
Abstract
Background: The purpose of this study is to analyse the effects of paternal age and addiction on the Down
Syndrome live births. Down Syndrome (DS) is one of the most frequent types of chromosomal anomaly,
caused by the presence of an extra chromosome-21 in human cell. Paternal age refers the age of a man at
the time he conceives a baby. A feasible pernicious paternal age effects on the child health due to its implied
mutations caused by the paternal origin. Myriad researches have been carried out to find the cause of DS
live birth around the world. Most of the potential causes are found to be significantly associated with
maternal epidemiological factors like age, contraception, meiotic nondisjunction, addiction etc. While it is
known that maternal age plays a key role of occurrence of DS during child bearing, the information on the
possible effects of father’s age is not clear till date. We aim to examine the association of paternal age and
paternal practice of alcohol smoke and chewing tobacco with incidence of DS birth.
Materials and Methods: In this paper we have evaluated the risk of DS live birth associated with the old
paternal age predisposition to meiotic non-disjunction. A case-control study has been carried out. 512 cases
of DS have been reported from Kolkata and its adjoining areas. After excluding such incomplete data, we
have selected 493 cases and 500 controls on their merits. All participants gave their consent towards this
study and all related publications. Statistical analysis has been conducted with logistic regression model to
analyse the possible interactions among paternal age and paternal addiction with DS live birth.
Results: Out of 493 cases, 33.79% DS born children have been found whose fathers’ paternal age is more
than 40 years. We found a significant association between older paternal age (≥40) to DS birth (OR=
3.0642; 95% CI= 2.0024 to 4.6891 at p value of < 0.0001) by keeping maternal age constant. A statistically
significant risk of DS live birth with alcoholic fathers (OR= 1.7231; 95% CI= 1.3297 to 2.2329 at p value
of < 0.0001) has been seen while smokers (OR= 1.1691; 95% CI= 0.9029 to 1.5138 at p value of 0.236)
and tobacco users (OR= 0.6385; 95% CI= 0.4904 to 0.8312 at p value of 0.0009) show no significant
association with it.
Conclusion: Present study reveals the detrimental effects of advanced paternal age on the occurrence of
DS child. It can be concluded that risk of DS cases is not only due to the advanced maternal age and some
others maternal factors (genetic and environmental) but also due to advanced paternal age as well as their
addiction may be involved in the formation of a trisomic zygote.
Keywords: Down Syndrome, Trisomy, Paternal Age, Epidemiology, Meiotic Nondisjunction.

2nd International Online Conference on Biological Sciences, July 22, 2018, India
IOCBS 2018 www.iocbs.org Rayder
FULL PAPERS

2nd International Online Conference on Biological Sciences, July 22, 2018, India
IOCBS 2018 www.iocbs.org Rayder
[This page is intentionally left blank]
2nd International Online Conference on Biological Sciences, July 22, 2018, India IOCBS 2018 ISBN: 978-81-934141-1-8 Rayder
33
Full Research Article
Reconstruction of phylogenetic history to resolve the subspecies anomaly of Pantherine cats
Ranajit Das*
Manipal Centre for Natural Sciences (MCNS), Manipal Academy of Higher Education, Manipal, Karnataka 576104, India
*Corresponding email: [email protected]
Abstract Background: All charismatic big cats including tiger, lion, leopard, snow leopard, and jaguar are grouped into the subfamily Pantherinae. Several mitogenomic approaches have been employed to reconstruct the phylogenetic history of the Pantherine cats but the phylogeny has remained largely unresolved till date. One of the major reasons for the difficulty in resolving the phylogenetic tree of Pantherine cats is the small sample size. While previous studies included only 5-10 samples, I have used 43 publically available taxa from GenBank (https://www.ncbi.nlm.nih.gov/genbank/) to reconstruct Pantherine phylogenetic history. Materials and Methods: omplete mtDNA sequences were used from all individuals excluding the control region (15,489bp). A Bayesian MCMC approach was employed to investigate the divergence times among different Pantherine clades. Results: Both maximum likelihood and Bayesian phylogeny generated a dendrogram: Neofelis nebulosa (Panthera tigris (Panthera onca (Panthera uncia (Panthera leo, Panthera pardus)))), grouping lions with leopards and placing snow leopards as an outgroup to this clade. The phylogeny revealed that lions split from their sister species leopard ~3 million years ago (Mya) and the divergence time between snow leopards and the clade including lions and leopards was estimated to be ~5 Mya. Conclusion: My study revealed that the morphology-based subspecies designation for both lions and tigers is largely not valid. The estimated tMRCA of 2.9 Mya between Barbary lions and Sub-Saharan African lions depicts the restriction of female-mediated gene flow between the lion populations in the backdrop of the habitat fragmentation taking place from late Pliocene to early to mid-Pleistocene creating islands of forest refugia in central Africa.
Keywords: Panthera, Bayesian MCMC, mitogenome, subspecies anomaly.
1. Introduction
The charismatic big cats: tiger (Panthera tigris), lion (Panthera leo), leopard (Panthera pardus), snow leopard (Panthera uncial), and jaguar (Panthera onca) are grouped into the subfamily Pantherinae [1]. All of these big cats are endangered and are found in small fragmented populations in the world. Tigers are given an endangered status by IUCN [2]. Their current distribution is mentioned in Table 1. Lions are given a vulnerable conservation sta. They are found in two widely isolated geographical areas: various parts of Africa (African lion), and the Gir forest of Southwestern Gujarat, India (Asiatic). While all Asiatic lion belong to the same subspecies (P. l. persica), the African lions are grouped into five separate subspecies (Table 1). Leopards are designated as near thretened in IUCN. These charismatic cats have a wide range of distribution from in sub-Saharan Africa to Southeast Asia and Siberia (Table1). Snow leopards (Panthera
Full Paper
2nd International Online Conference on Biological Sciences, July 22, 2018, India IOCBS 2018 ISBN: 978-81-934141-1-8 Rayder
33
Full Research Article
uncia) are listed as endangered in IUCN Red List of Threatened Species. They are native to mountains of Central and South Asia. Jaguars are nearly endangered according to IUCN Red List and they are native to southern North America, Central and South America (Table 1). Reconstruction of the phylogenetic history of these charismatic cats can provide us a plethora of information about their species, subspecies, and population genetic status, which can be helpful for the conservation of these threatened animals. Several morphological, biochemical, and molecular approaches have been employed to resolve the phylogenetic history of the Pantherine cats such as morphological [3], cytogenetic [4], immunological [5], biochemical [6], sex-chromosome based [7], chemical [8], and molecular genetic [1, 9-11]. In spite of several trials to reconstruct the phylogenetic history of Pantherine cats, their phylogeny has remained largely unresolved. Johnson et al. (2006) grouped snow leopards with tigers based on 18,853 bp of nuclear DNA concatenated data [9]. In contrast, a later phylogenetic analysis grouped snow leopards with lions based on their complete mtDNA sequences [11]. They estimated that N. nebulosa shared a common ancestor with other Pantherine cats about 8.66 Mya and that the leopards shared a common ancestor with the lion-snow leopard clade about 4.35 Mya. Recently, another mitogenomic study grouped lion and leopards together and placed snow leopard as the sister taxa to this clade . Although Panthera phylogeny has been reconstructed multiple times, none of these studies used multiple subspecies of Pantherine cats. So, the subspecies anomaly remained unresolved.
All previous phylogenetic studies were performed using 5-10 Pantherine cats, taking one individual from each species, which made it difficult to assess the phylogenetic tree at a high resolution and determine the subspecies level genetic diversity. In the present study I have used complete mitochondrial DNA sequences excluding the control region (15,489bp) from 43 publicly available Pantherine taxa including multiple individuals and subspecies of big cats to resolve the phylogenetic history of the gennus Panthera and to genetically validate the ‘subspecies’ status of various Pantherine taxa. This study thus offers an
unparalleled and in-depth view of Pantherine phylogeny and genetically assess the ‘subspecies’ question
that has remained elusive till date, which can aid in providing more effective conservation measures for these charismatic big cats.
2. Materials and Method
2.1 Molecular phylogenetic analysis
I retrieved 43 publicly available Pantherine mitogenomes including all available subspecies of six charismatic cats: tiger, lion, leopard, snow leopard, jaguar, and Neofelis from GenBank [12] (Table 2). The mitogenome sequences were first aligned using Clustal Omega online server [13]. The fasta alignment of the complete mitogenome sequences was then exported to MEGA v6.06, where the control region (D-loop) sequences were eliminated. Pair-wise genetic distances among the Pantherine taxa were calculated in MEGA v6.06 [14]. A model test was performed to determine the best fitting nucleotide substitution model for the dataset, using Akaike’s information criteria with correction (AICc) and Bayesian information criteria
(BIC) using jModelTest v2.1.4 [15]. The alignment of 43 Pantherine taxa was used for maximum likelihood phylogenetic reconstruction, with 1000 bootstrap replicates, using MEGA v6.06. Bayesian phylogenetic tree was reconstructed using MrBayes v3.2.5 [16].
2.2 Dating the phylogenetic tree
For dating, I used a Bayesian Markov Chain Monte Carlo approach (MCMC) implemented in BEAST v1.8.2 [17]. The BEAST input file was generated using BEAUTi v1.8.2 [17]. An uncorrelated lognormal
34
Full Paper
2nd International Online Conference on Biological Sciences, July 22, 2018, India IOCBS 2018 ISBN: 978-81-934141-1-8 Rayder
33
Full Research Article
relaxed molecular clock was used to allow the evolutionary rate to vary from branch to branch. Previous studies have shown that has showed that relaxed molecular clock provides better estimate of time to most recent common ancestor (tMRCA) over the strict molecular clock that does not allow the evolutionary rate to vary among branches [18]. SRD06 model of nucleotide substitution was used to partition the nucleotide data by codon position. SRD06 by default uses HKY nucleotide substitution model. The rate of evolution was calibrated using lognormally distributed priors with lognormal means of zero and lognormal standard deviation of 0.56. Since lognormally distributed priors sample values from the more distant past more frequently than recent values, it performs better than both normally distributed and exponentially distributed priors, when using fossil calibration points for dating a phylogenetic tree [19]. I offset the lognormal distributions of the priors at the internal node of Panthera-Neofelis split by 7 Mya, so that the median values of the sampled distributions were equal to and the mean values were slightly greater than the split date of ~8 Mya between the two. This calibration method has been previously employed for reconstructing phylogenetic history of other mammalian subfamily level taxa [20-22]. Yule speciation process, which has
been shown to be more appropriate when analyzing sequences from different species, was used for the divergence estimation [23]. MCMC simulation ran for 10 million generations, sampling every 500 steps. 10% of the trees were removed as ‘burnin’. The maximum clade credibility (MCC) tree was identified and annotated using TreeAnnotator
v1.8.2 [17]. Nodes with posterior probabilities exceeding 90% (P > 0.9) were used for the tree building. The MCC tree generated by TreeAnnotator v1.8.2 was visualized and graphically represented using FigTree v1.4.2 (http://tree.bio.ed.ac.uk/software/figtree). The posterior estimates of the parameters sampled by the Markov Chain was summarized in Tracer v1.6 [24]. tMRCA means, medians, and 95% highest posterior density (95% HPD) intervals (all in Myr) were also calculated in Tracer v1.6.
3. Results
3.1 Sequence divergence and the subspecies dilemma
Among lions, identical nucleotide sequences were observed among P. l. senegalensis (KP001502), P. l. azandica (KP001506), P. l. nubica (KP001495), and P. leo (NC_028302), raising questions about the validity of the different subspecies status for these individuals. The two Barbary lions (KF776494 and KF907306) are genetically most distant from the rest of the clade, showing 2.2 - 3% divergence of the mitogenome. The remaining lion subspecies shows 0 - 0.6% genetic divergence among each other. Our results thus indicate that the morphological variation among the different African lion populations may not be enough to consider them as different ‘subspecies’. The validity of the subspecies status is also questionable in case of the tigers with P. t. amoyensis (HM589215) and P. t. altaica (HM185182) showing identical nucleotide sequences. The mean tiger mitogenome divergence was 0.5% and the largest divergence was observed between the Amoy tigers (HM589214 and HM589215) and the rest of the tree (1.2%). Thus, similar to lions, most of the tiger subspecies are also potentially not valid genetically. Leopard subspecies show 0 – 0.9% genetic divergence among each other with the highest divergence between P. p. pardus (KP001507) and P. p. japonensis (EF551002) (0.9%).
3.2 Phylogenetic analyses
The maximum likelihood (ML) tree was constructed using Hasegawa-Kishino-Yano model of nucleotide substitution with gamma distribution and invariable sites (HKY+G+I), which was selected to be the best fitting model for the dataset by jModelTest v2.1.4. The ML based phylogeny grouped lions (N = 16) and
35
Full Paper
2nd International Online Conference on Biological Sciences, July 22, 2018, India IOCBS 2018 ISBN: 978-81-934141-1-8 Rayder
33
Full Research Article
leopards (N = 5) together with 100% bootstrap support and placed show leopards (N = 3) as the sister taxa to this clade (100% bootstrap support) (Figure 1). Jaguars (N = 4) were designated to be the sister taxa of the lion-leopard-snow leopard clade. The deepest root within the lions was observed between the Barbary lions (P. l. leo) and the rest of the subspecies with 100% bootstrap support. For the tigers (N = 13), the deepest root was observed between the Amoy tigers and the rest (100% bootstrap support). Similar grouping of the Patherine taxa was revealed in the Bayesian phylogenetic tree (Figure 2). Overall, the phylogenetic analyses revealed a dendrogram: Neofelis nebulosa (Panthera tigris (Panthera onca (Panthera uncia (Panthera leo, Panthera pardus)))).
3.3 Estimates of divergence dates
As mentioned before (see methods) a single calibration point of Neofelis-Panthera split of 8 Mya was used to estimate the divergence time. Similar to the ML tree, the Bayesian tree also grouped lions and leopards together and placed snow leopard as the sister taxa to this clade. The MCMC analysis employed in BEAST revealed that lions split from its sister species leopard 3.45 Mya (1.75 – 5.17) (Table 3). The divergence time between snow leopards and the clade including lions and leopards was estimated to be 4.97 Mya (2.9 -7.24). Tigers appeared to split from the rest four charismatic big cats 7.47 Mya (4.97 – 9.24). The deepest roots within the tigers was estimated to be ~2 Mya between the Amur tiger and the remainder of the tiger clade. As revealed by the ML tree, the deepest split within lions was between the Barbary lions and the remainder of the subspecies (including all Sub-Saharan African and Asian subspecies) (2.87 Mya). The divergence between the Asian lions from the East-Central African subspecies is relatively new 1.39 Mya (0.63 – 4.2). 4. Discussions
4.1 mtDNA based phylogeny: advantages of large sample size
For the last two decades mtDNA is being used to reconstruct Pantherine phylogeny. However, all previous phylogenetic analyses in this regard were employed using 5 – 10 Pantherine taxa. Moreover, none of them included multiple subspecies and/or individuals from a species. Consequently, the deepest root within the species remained largely unknown. Also, due to low resolution, the Pantherine species were often wrongly grouped, often generating contrasting results. For instance, Johnson et al (2006) grouped snow leopards with tigers and Wei et al. (2011) grouped them with lions. I used 43 Pantherine taxa in this study, including individuals and subspecies from all charismatic big cats. Complete mtDNA sequences excluding the control regions (15,489bp) were used for phylogenetic analysis. The control regions were excluded in this study on two major accounts: i) this area of the mitogenome is very difficult to align across the big cats and ii) the repeat sequences found in this region results in different mitogenome sizes across the Pantherine cats [1]. Therefore several recent phylogenetic studies on Pantherine cats have either included only the protein coding genes or the complete mtDNA sequence excluding the control [1,11]. Proper and systematic sampling method employed here aids to the robustness of the analyses by increasing the statistical power. Both ML and Bayesian based phylogeny revealed the same grouping of all Pantherine taxa. Overall, the current study revealed a dendrogram: Neofelis nebulosa (Panthera tigris (Panthera onca (Panthera uncia (Panthera leo, Panthera pardus)))). The inclusion of multiple individuals and subspecies from all species and incorporation of jaguars has helped to reconstruct hitherto unresolved Pantherine phylogeny with high confident. Snow leopards are genetically distant from the tigers with 7.5 –
36
Full Paper
2nd International Online Conference on Biological Sciences, July 22, 2018, India IOCBS 2018 ISBN: 978-81-934141-1-8 Rayder
33
Full Research Article
8.1% sequence divergence and therefore grouping them with tigers is potentially an artifact of improper and inadequate sampling [9]. Lions are genetically close to both leopards (4 – 5% sequence divergence) and snow leopards (5.5 – 6.1% sequence divergence). So, if multiple individuals from all species are not included in the analyses, lions can be, at random, wrongly grouped with snow leopards, and this is what has potentially occurred in case of the phylogeny described in Wei et al. (2011) who used only six Pantherine taxa in their study. Unlike the aforementioned studies, the recent-most Pantherine tree described in Bagatharia et al. (2013) revealed correct species level phylogeny by grouping lions and leopards together and placing snow leopards as the sister species to the lion-leopard clade. But the low sample size (six Pantherine cats) of the study and the exclusion of jaguars in all analyses resulted in a low-resolution phylogeny. 4.2 Subspecies anomaly
Our study raised question on ‘subspecies’ designation based on morphology. In most cases I found that the current ‘subspecies’ designation is not genetically valid and needs serious taxonomic change.
For instance, current lion subspecies status is largely based on morphological characteristics mentioned in Hemmer (1966) [25]. The current study raises questions about the authenticity of the subspecies status of various Sub-Saharan African lion subspecies based on morphology. Although currently geographically isolated, P. l. senegalensis (KP001502), P. l. azandica (KP001506), P. l. nubica (KP001495), and P. leo (NC_028302) share identical nucleotide sequences. In contrast, the two P. l. senegalensis individuals (KP001497 and KP001502) show 0.3% nucleotide divergence. Similar nucleotide divergence (0.4%) was observed between the two P. l. bleyenberghi individuals (KP001504 and KP001505). These results indicate recent geographical isolation of Sub-Saharan African lion populations, who potentially have not yet accumulated subspecies level genetic divergence. For decades’ authors have debated on the exact number
of lion subspecies (eight vs. ten). Our study conclusively revealed that there are potentially only three ‘subspecies’ of lion currently exists in this planet: North African Barbary Lion, Sub-Saharan African Lion, and Asiatic Lion. The genetic variations observed among the Sub-Saharan African Lions are potentially mere individual variations. The validity of the subspecies status is also questionable in case of the tigers with P. t. amoyensis (HM589215) and P. t. altaica (HM185182) showing identical nucleotide sequences and two P. t. altaica individuals (HM185182 and JF357973) showing high (1.1%) nucleotide divergence. The aforementioned results clearly indicate more individual level variation (intra-population) than subspecies level variation (inter-population), raising questions about the validity of morphology-based subspecies designation. It can be speculated that if more samples were analyzed, individuals from different populations would have grouped together disobeying their current ‘subspecies’ status.
4.3 Migration and isolation of Pantherine taxa
Tigers potentially split from other five big cats sometime in late Miocene. As speculated in previous studies, Panthera species such as lions potentially migrated into America and Africa from Asia in the Pliocene [26]. The migration path of the Pantherine cats mentioned in Johnson et al. (2006) fits with the divergence times of Pantherine cats mentioned in this study. Snow leopards potentially got isolated from lions and leopards in early Pliocene (~5Mya), when these cats started migrating to Africa. The estimated tMRCA of 2.9 Mya between Barbary lions and the Sub-Saharan African lions is an indication of potential restriction of female-mediated gene flow between these populations. The habitat fragmentation from late Pliocene to early to
37
Full Paper
2nd International Online Conference on Biological Sciences, July 22, 2018, India IOCBS 2018 ISBN: 978-81-934141-1-8 Rayder
33
Full Research Article
mid-Pleistocene resulted in the islands of forest refugia in central Africa, isolating Barbary lions from other lion populations. However, migration and intermixing potentially continued among the Sub-Saharan African subspecies till forests were converted into the savannas during late Pleistocene. Additionally, it is interesting to note that be noted here that the mitogenome divergence among the lion populations potentially began at the same time as other African mammals such as chimpanzees, bonobos, and gorillas. Overall, this study provides a holistic and in-depth view of Pantherine phylogeny, indicating the importance of using large number of samples for confident resolution of mammalian phylogenetic history.
5. Conclusion
Overall, this study provides a holistic and in-depth view of Pantherine phylogeny, indicating the importance
of using large number of samples for confident resolution of mammalian phylogenetic history. Proper and
systematic sampling method employed here aids to the robustness of the analyses by increasing the
statistical power. Both ML and Bayesian based phylogeny revealed the same grouping of all Pantherine
taxa, which is also encouraging. However, the major limitation of this study is that all Pantherine sequences
were obtained from GenBank and none were sequenced in my lab. If we could sequence additional tiger,
lion or leopard samples from India, it would not only have increased the resolution of panthera phylogeny
but also would have enhanced the novelty of this study.
References
[1] IUCN. The IUCN Red List of Threatened Species. 2015 [cited 2015; 2015-3:[Available from: http://www.iucnredlist.org/.
[2] Salles, L.O., Felid phylogenetics: extant taxa and skull morphology (Felidae Aeluroidea). American Museum Novitates, 1992. 3047: p. 1-67.
[3] Wurster-Hill, D. and C. Gray, The interrelationships of chromosome banding patterns in procyonids, viverrids, and felids. Cytogenetic and Genome Research, 1975. 15(5): p. 306-331.
[4] Collier, G.E. and S.J. O'Brien, A molecular phylogeny of the Felidae: immunological distance. Evolution, 1985: p. 473-487.
[5] Slattery, J.P., et al., Phylogenetic reconstruction of South American felids defined by protein electrophoresis. Journal of Molecular Evolution, 1994. 39(3): p. 296-305.
[6] Slattery, J.P. and S.J. O'Brien, Patterns of Y and X chromosome DNA sequence divergence during the Felidae radiation. Genetics, 1998. 148(3): p. 1245-1255.
[7] Bininda‐Emonds, O.R., D.M. Decker‐Flum, and J.L. Gittleman, The utility of chemical signals as phylogenetic characters: an example from the Felidae. Biological Journal of the Linnean Society, 2001. 72(1): p. 1-15.
[8] Johnson, W.E., et al., The late Miocene radiation of modern Felidae: a genetic assessment. Science, 2006. 311(5757): p. 73-77.
[9] Johnson, W.E. and S.J. O’brien, Phylogenetic reconstruction of the Felidae using 16S rRNA and NADH-5 mitochondrial genes. Journal of Molecular Evolution, 1997. 44(1): p. S98-S116.
[10] Wei, L., et al., Mitogenomic analysis of the genus Panthera. Science China Life Sciences, 2011. 54(10): p. 917-930.
[11] Benson, D.A., et al., GenBank: update. Nucleic Acids Res, 2004. 32(Database issue): p. D23-6. [12] Sievers, F., et al., Fast, scalable generation of high-quality protein multiple sequence alignments using
Clustal Omega. Mol Syst Biol, 2011. 7: p. 539. [13] Tamura, K., et al., MEGA6: Molecular Evolutionary Genetics Analysis version 6.0. Mol Biol Evol, 2013.
30(12): p. 2725-9.
38
Full Paper
2nd International Online Conference on Biological Sciences, July 22, 2018, India IOCBS 2018 ISBN: 978-81-934141-1-8 Rayder
33
Full Research Article
[14] Guindon, S. and O. Gascuel, A simple, fast, and accurate algorithm to estimate large phylogenies by maximum likelihood. Syst Biol, 2003. 52(5): p. 696-704.
[15] Huelsenbeck, J.P. and F. Ronquist, MRBAYES: Bayesian inference of phylogenetic trees. Bioinformatics, 2001. 17(8): p. 754-5.
[16] Drummond, A.J., et al., Bayesian phylogenetics with BEAUti and the BEAST 1.7. Mol Biol Evol, 2012. 29(8): p. 1969-73.
[17] Drummond, A.J., et al., Relaxed phylogenetics and dating with confidence. PLoS Biol, 2006. 4(5): p. e88. [18] Ho, S.Y., Calibrating molecular estimates of substitution rates and divergence times in birds. Journal of
Avian Biology, 2007. 38(4): p. 409-414. [19] Bjork, A., et al., Evolutionary history of chimpanzees inferred from complete mitochondrial genomes. Mol
Biol Evol, 2011. 28(1): p. 615-23. [20] Das, R., et al., Complete mitochondrial genome sequence of the Eastern gorilla (Gorilla beringei) and
implications for african ape biogeography. J Hered, 2014. 105(6): p. 752-61. [21] Raaum, R.L., et al., Catarrhine primate divergence dates estimated from complete mitochondrial genomes:
concordance with fossil and nuclear DNA evidence. J Hum Evol, 2005. 48(3): p. 237-57. [22] Stone, A.C., et al., More reliable estimates of divergence times in Pan using complete mtDNA sequences
and accounting for population structure. Philosophical Transactions of the Royal Society of London B: Biological Sciences, 2010. 365(1556): p. 3277-3288.
[23] Rambaut, A. and A. Drummond, Tracer 1.6. University of Edinburgh, Edinburgh, UK. 2013. [24] Hemmer, H., Untersuchungen zur stammesgeschichte der Pantherkatzen (Pantherinae). 1966. [25] Werdelin, L. and M.E. Lewis, Plio‐Pleistocene Carnivora of eastern Africa: species richness and turnover
patterns. Zoological Journal of the Linnean Society, 2005. 144(2): p. 121-144.
39
Full Paper
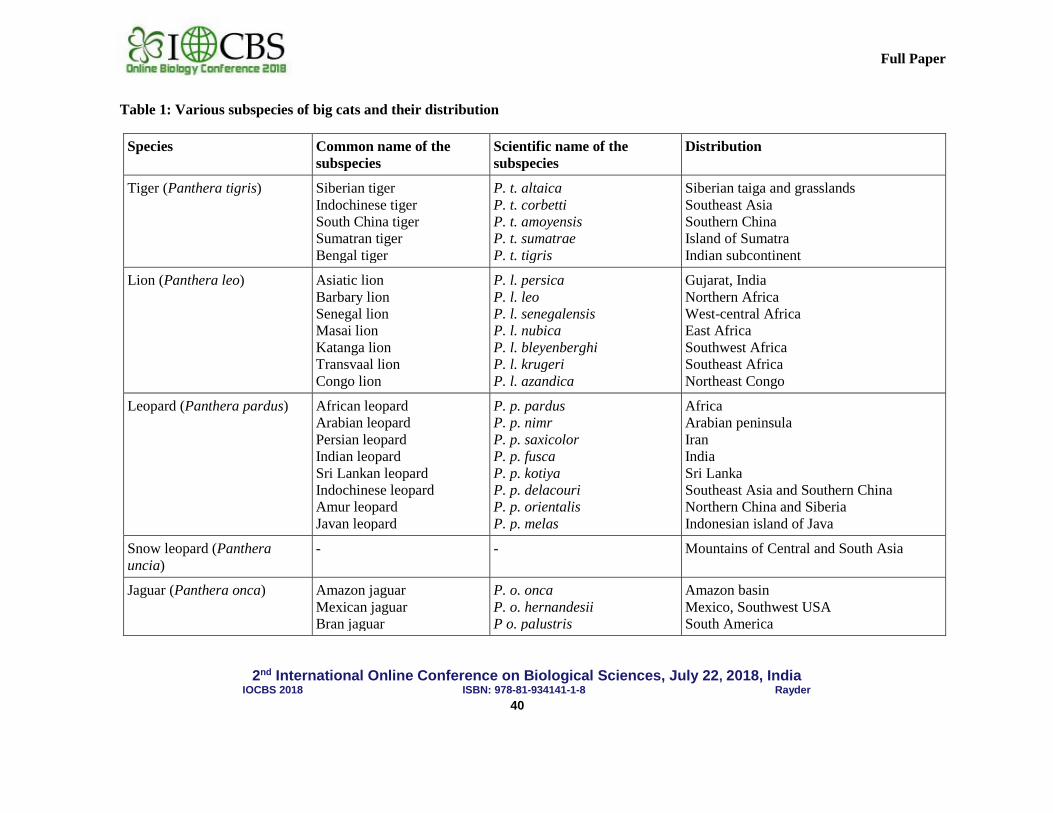
2nd International Online Conference on Biological Sciences, July 22, 2018, India IOCBS 2018 ISBN: 978-81-934141-1-8 Rayder
Research Article
Table 1: Various subspecies of big cats and their distribution
Species Common name of the subspecies
Scientific name of the subspecies
Distribution
Tiger (Panthera tigris) Siberian tiger Indochinese tiger South China tiger Sumatran tiger Bengal tiger
P. t. altaica P. t. corbetti P. t. amoyensis P. t. sumatrae P. t. tigris
Siberian taiga and grasslands Southeast Asia Southern China Island of Sumatra Indian subcontinent
Lion (Panthera leo) Asiatic lion Barbary lion Senegal lion Masai lion Katanga lion Transvaal lion Congo lion
P. l. persica P. l. leo P. l. senegalensis P. l. nubica P. l. bleyenberghi P. l. krugeri P. l. azandica
Gujarat, India Northern Africa West-central Africa East Africa Southwest Africa Southeast Africa Northeast Congo
Leopard (Panthera pardus) African leopard Arabian leopard Persian leopard Indian leopard Sri Lankan leopard Indochinese leopard Amur leopard Javan leopard
P. p. pardus P. p. nimr P. p. saxicolor P. p. fusca P. p. kotiya P. p. delacouri P. p. orientalis P. p. melas
Africa Arabian peninsula Iran India Sri Lanka Southeast Asia and Southern China Northern China and Siberia Indonesian island of Java
Snow leopard (Panthera uncia)
- - Mountains of Central and South Asia
Jaguar (Panthera onca) Amazon jaguar Mexican jaguar Bran jaguar
P. o. onca P. o. hernandesii P o. palustris
Amazon basin Mexico, Southwest USA South America
40
Full Paper
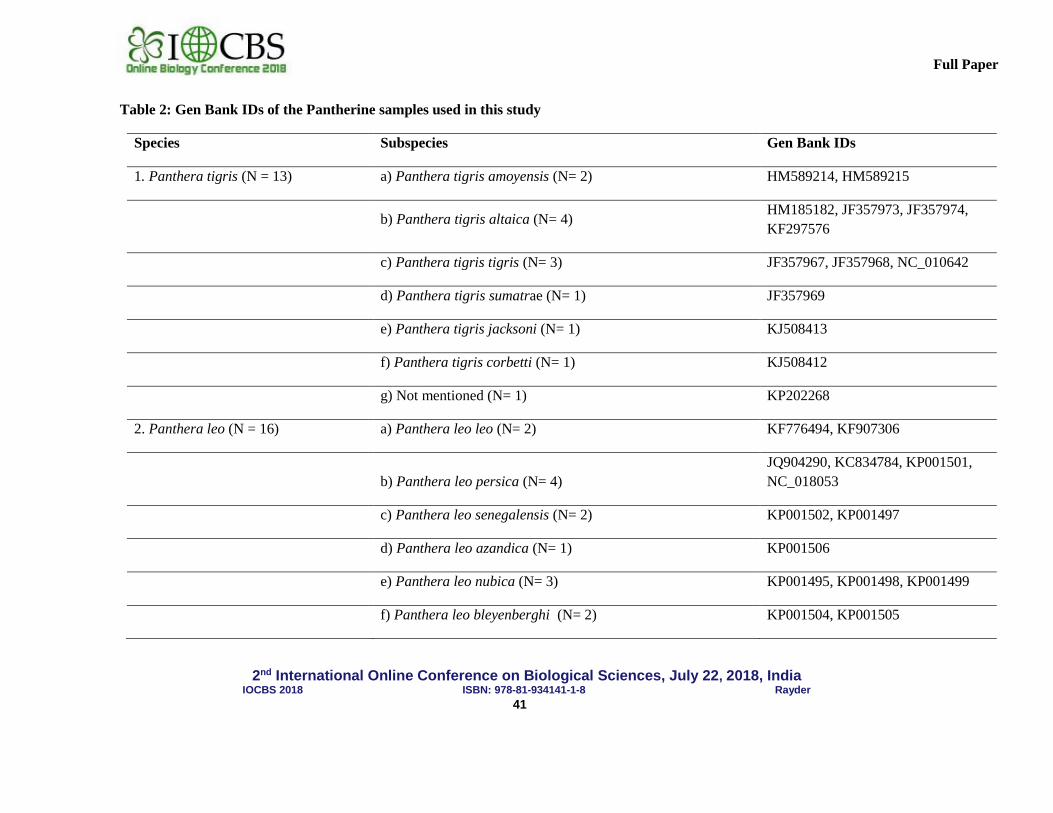
2nd International Online Conference on Biological Sciences, July 22, 2018, India IOCBS 2018 ISBN: 978-81-934141-1-8 Rayder
Research Article
Table 2: Gen Bank IDs of the Pantherine samples used in this study
Species Subspecies Gen Bank IDs
1. Panthera tigris (N = 13) a) Panthera tigris amoyensis (N= 2) HM589214, HM589215
b) Panthera tigris altaica (N= 4)
HM185182, JF357973, JF357974, KF297576
c) Panthera tigris tigris (N= 3) JF357967, JF357968, NC_010642
d) Panthera tigris sumatrae (N= 1) JF357969
e) Panthera tigris jacksoni (N= 1) KJ508413
f) Panthera tigris corbetti (N= 1) KJ508412
g) Not mentioned (N= 1) KP202268
2. Panthera leo (N = 16) a) Panthera leo leo (N= 2) KF776494, KF907306
b) Panthera leo persica (N= 4) JQ904290, KC834784, KP001501, NC_018053
c) Panthera leo senegalensis (N= 2) KP001502, KP001497
d) Panthera leo azandica (N= 1) KP001506
e) Panthera leo nubica (N= 3) KP001495, KP001498, KP001499
f) Panthera leo bleyenberghi (N= 2) KP001504, KP001505
41
Full Paper
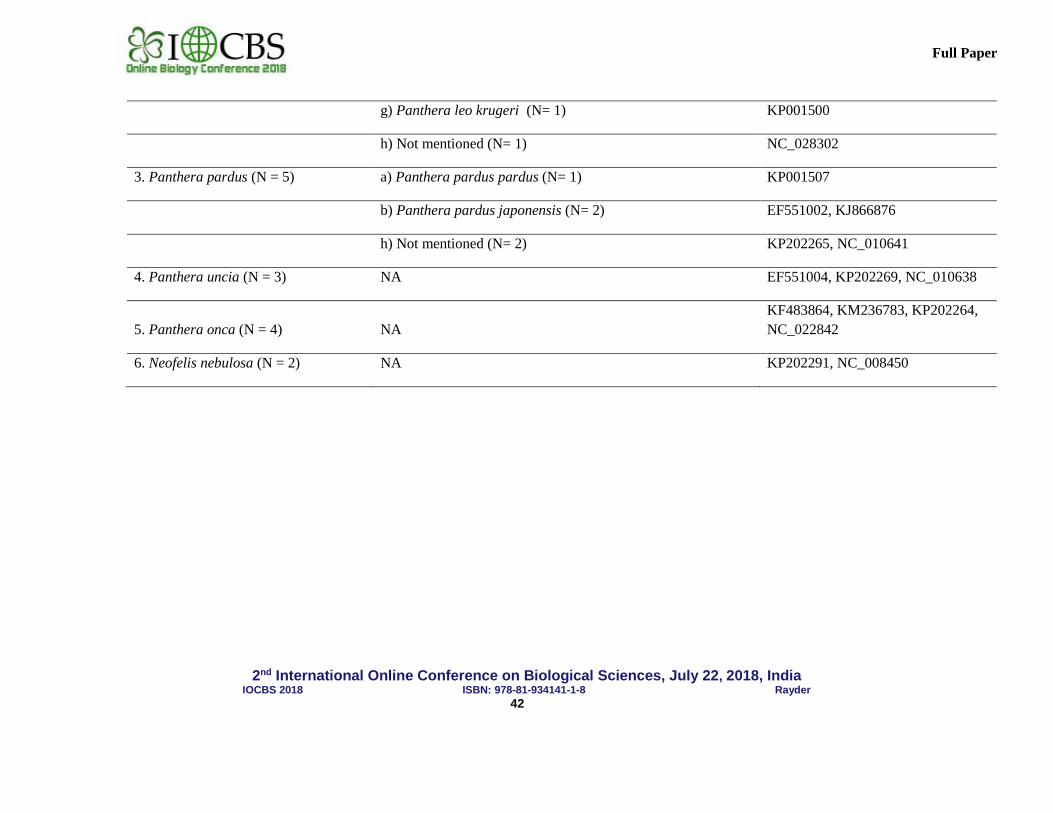
2nd International Online Conference on Biological Sciences, July 22, 2018, India IOCBS 2018 ISBN: 978-81-934141-1-8 Rayder
Research Article
g) Panthera leo krugeri (N= 1) KP001500
h) Not mentioned (N= 1) NC_028302
3. Panthera pardus (N = 5) a) Panthera pardus pardus (N= 1) KP001507
b) Panthera pardus japonensis (N= 2) EF551002, KJ866876
h) Not mentioned (N= 2) KP202265, NC_010641
4. Panthera uncia (N = 3) NA EF551004, KP202269, NC_010638
5. Panthera onca (N = 4) NA
KF483864, KM236783, KP202264, NC_022842
6. Neofelis nebulosa (N = 2) NA KP202291, NC_008450
42
Full Paper
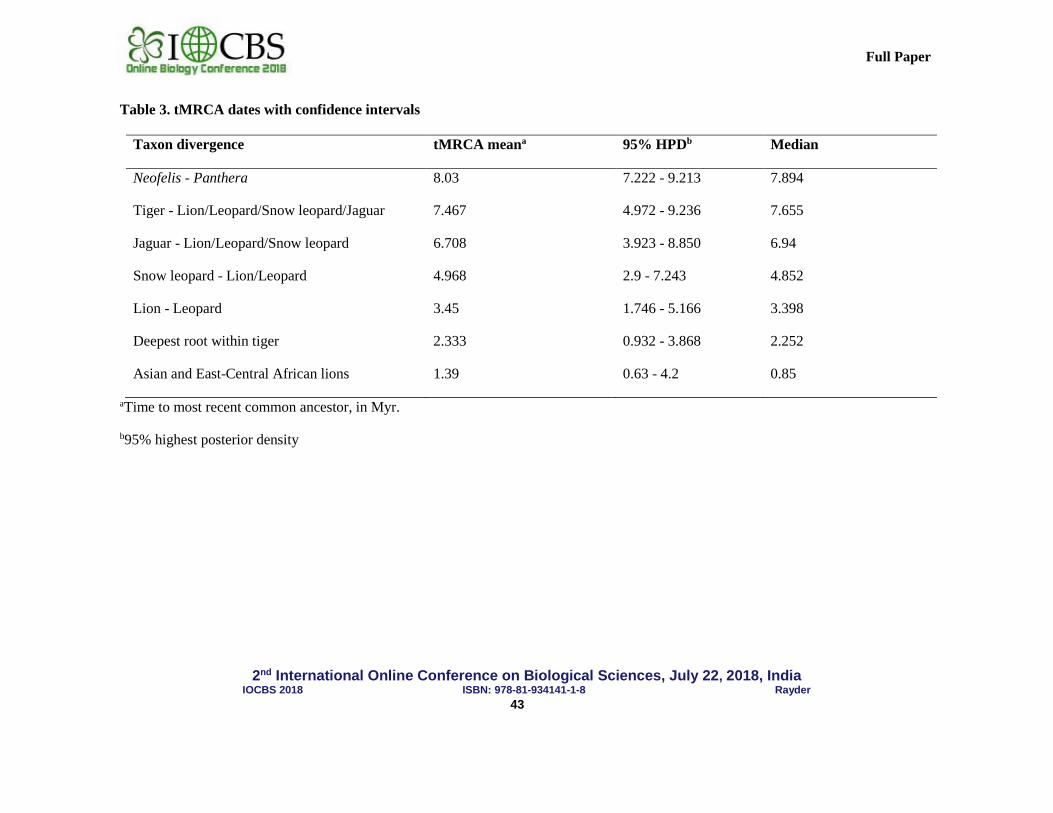
2nd International Online Conference on Biological Sciences, July 22, 2018, India IOCBS 2018 ISBN: 978-81-934141-1-8 Rayder
Research Article
Table 3. tMRCA dates with confidence intervals
Taxon divergence tMRCA meana 95% HPDb Median
Neofelis - Panthera 8.03 7.222 - 9.213 7.894
Tiger - Lion/Leopard/Snow leopard/Jaguar 7.467 4.972 - 9.236 7.655
Jaguar - Lion/Leopard/Snow leopard 6.708 3.923 - 8.850 6.94
Snow leopard - Lion/Leopard 4.968 2.9 - 7.243 4.852
Lion - Leopard 3.45 1.746 - 5.166 3.398
Deepest root within tiger 2.333 0.932 - 3.868 2.252
Asian and East-Central African lions 1.39 0.63 - 4.2 0.85
aTime to most recent common ancestor, in Myr.
b95% highest posterior density
43
Full Paper
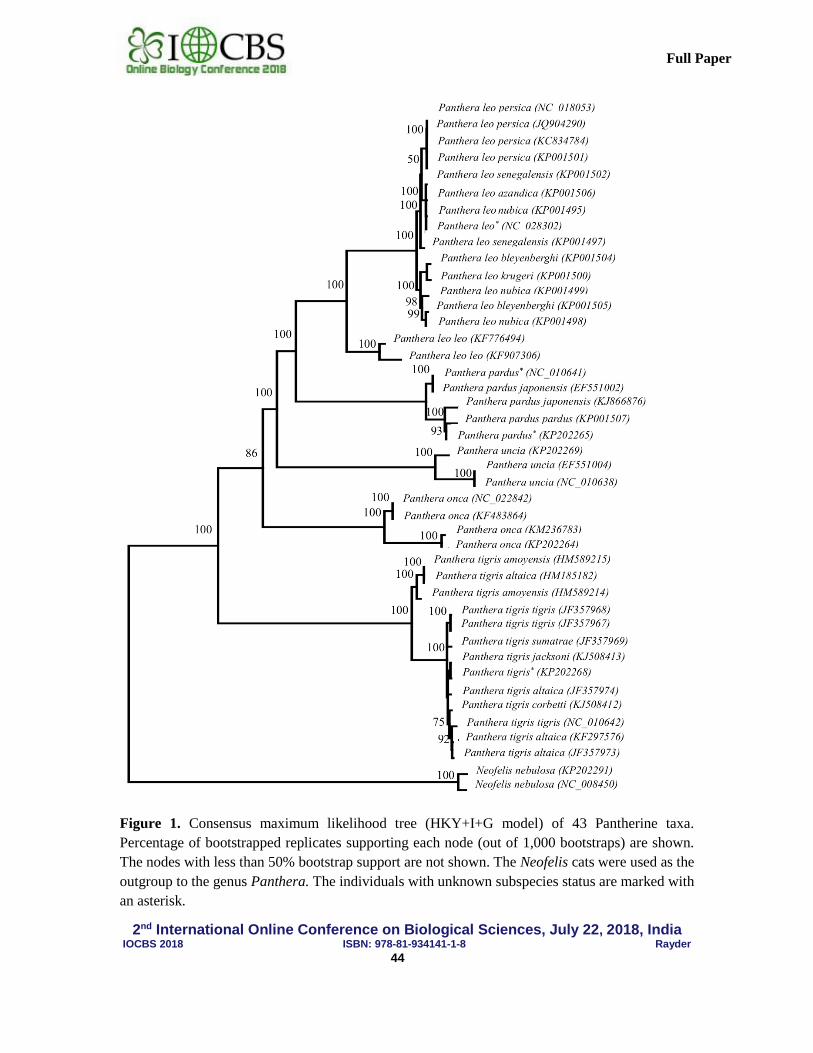
2nd International Online Conference on Biological Sciences, July 22, 2018, India IOCBS 2018 ISBN: 978-81-934141-1-8 Rayder
Research Article
Figure 1. Consensus maximum likelihood tree (HKY+I+G model) of 43 Pantherine taxa. Percentage of bootstrapped replicates supporting each node (out of 1,000 bootstraps) are shown. The nodes with less than 50% bootstrap support are not shown. The Neofelis cats were used as the outgroup to the genus Panthera. The individuals with unknown subspecies status are marked with an asterisk.
44
Full Paper
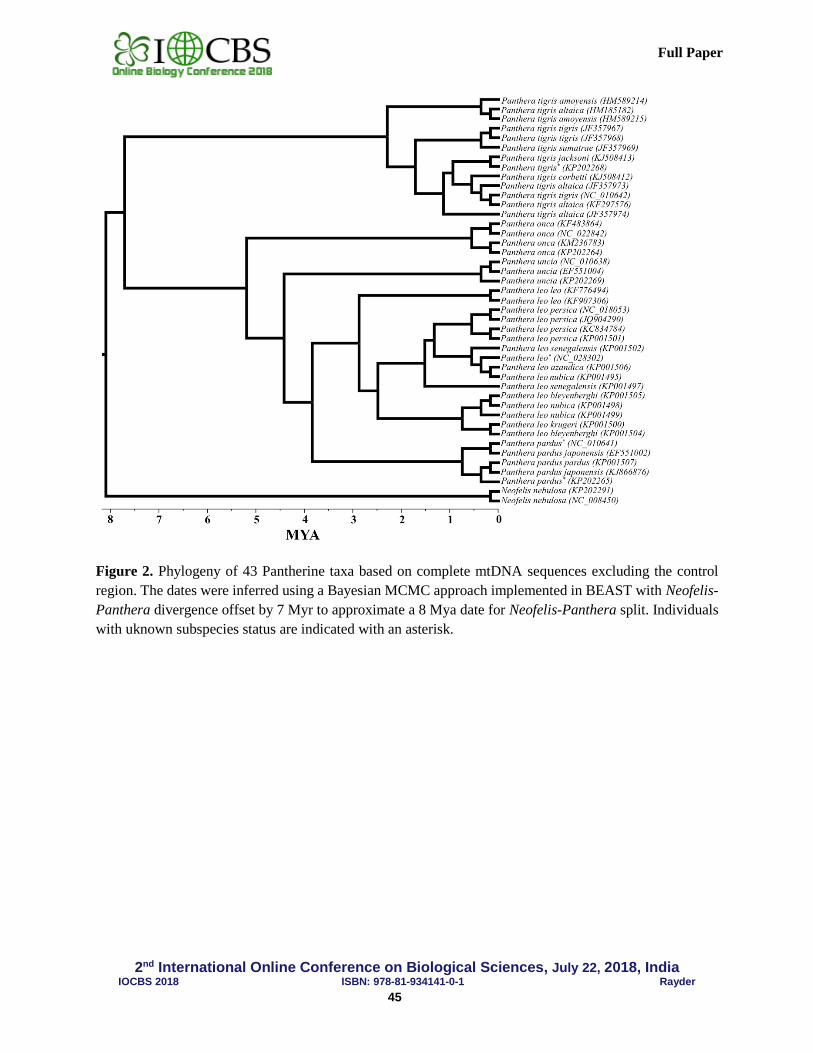
2nd International Online Conference on Biological Sciences, July 22, 2018, India IOCBS 2018 ISBN: 978-81-934141-0-1 Rayder
Key Note
Figure 2. Phylogeny of 43 Pantherine taxa based on complete mtDNA sequences excluding the control region. The dates were inferred using a Bayesian MCMC approach implemented in BEAST with Neofelis-Panthera divergence offset by 7 Myr to approximate a 8 Mya date for Neofelis-Panthera split. Individuals with uknown subspecies status are indicated with an asterisk.
45
Full Paper
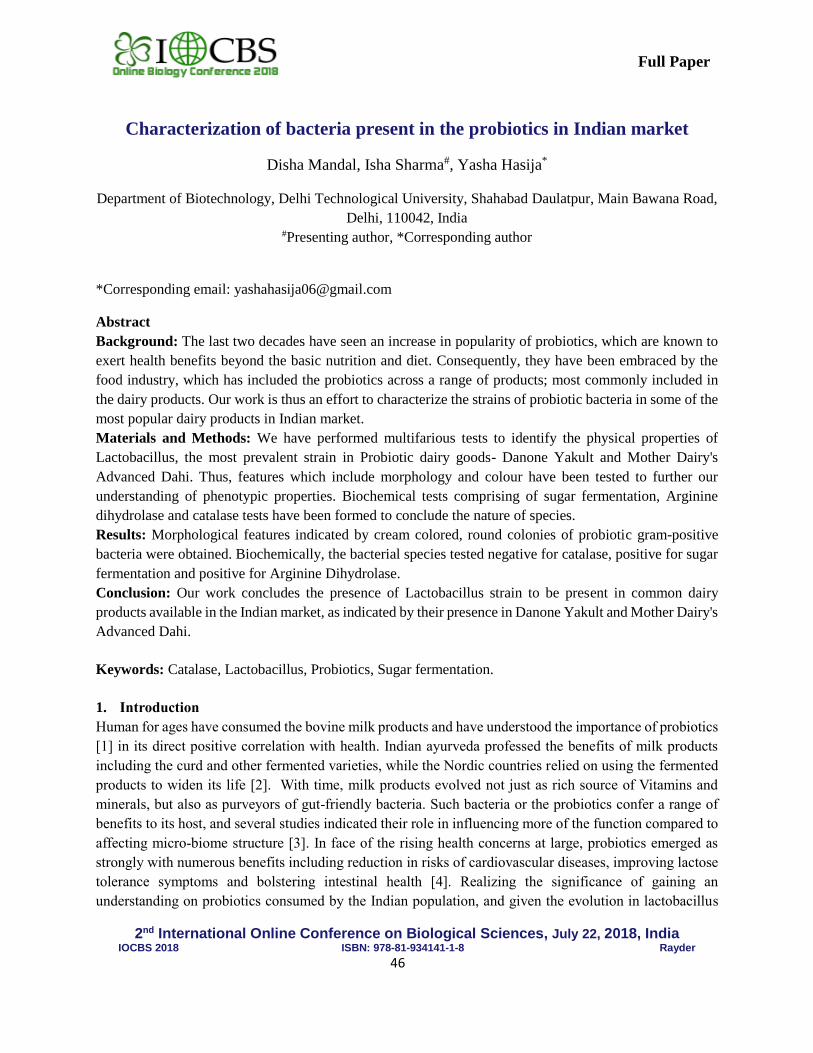
2nd International Online Conference on Biological Sciences, July 22, 2018, India
IOCBS 2018 ISBN: 978-81-934141-1-8 Rayder
46
Full Paper
Characterization of bacteria present in the probiotics in Indian market
Disha Mandal, Isha Sharma#, Yasha Hasija*
Department of Biotechnology, Delhi Technological University, Shahabad Daulatpur, Main Bawana Road,
Delhi, 110042, India #Presenting author, *Corresponding author
*Corresponding email: [email protected]
Abstract
Background: The last two decades have seen an increase in popularity of probiotics, which are known to
exert health benefits beyond the basic nutrition and diet. Consequently, they have been embraced by the
food industry, which has included the probiotics across a range of products; most commonly included in
the dairy products. Our work is thus an effort to characterize the strains of probiotic bacteria in some of the
most popular dairy products in Indian market.
Materials and Methods: We have performed multifarious tests to identify the physical properties of
Lactobacillus, the most prevalent strain in Probiotic dairy goods- Danone Yakult and Mother Dairy's
Advanced Dahi. Thus, features which include morphology and colour have been tested to further our
understanding of phenotypic properties. Biochemical tests comprising of sugar fermentation, Arginine
dihydrolase and catalase tests have been formed to conclude the nature of species.
Results: Morphological features indicated by cream colored, round colonies of probiotic gram-positive
bacteria were obtained. Biochemically, the bacterial species tested negative for catalase, positive for sugar
fermentation and positive for Arginine Dihydrolase.
Conclusion: Our work concludes the presence of Lactobacillus strain to be present in common dairy
products available in the Indian market, as indicated by their presence in Danone Yakult and Mother Dairy's
Advanced Dahi.
Keywords: Catalase, Lactobacillus, Probiotics, Sugar fermentation.
1. Introduction
Human for ages have consumed the bovine milk products and have understood the importance of probiotics
[1] in its direct positive correlation with health. Indian ayurveda professed the benefits of milk products
including the curd and other fermented varieties, while the Nordic countries relied on using the fermented
products to widen its life [2]. With time, milk products evolved not just as rich source of Vitamins and
minerals, but also as purveyors of gut-friendly bacteria. Such bacteria or the probiotics confer a range of
benefits to its host, and several studies indicated their role in influencing more of the function compared to
affecting micro-biome structure [3]. In face of the rising health concerns at large, probiotics emerged as
strongly with numerous benefits including reduction in risks of cardiovascular diseases, improving lactose
tolerance symptoms and bolstering intestinal health [4]. Realizing the significance of gaining an
understanding on probiotics consumed by the Indian population, and given the evolution in lactobacillus
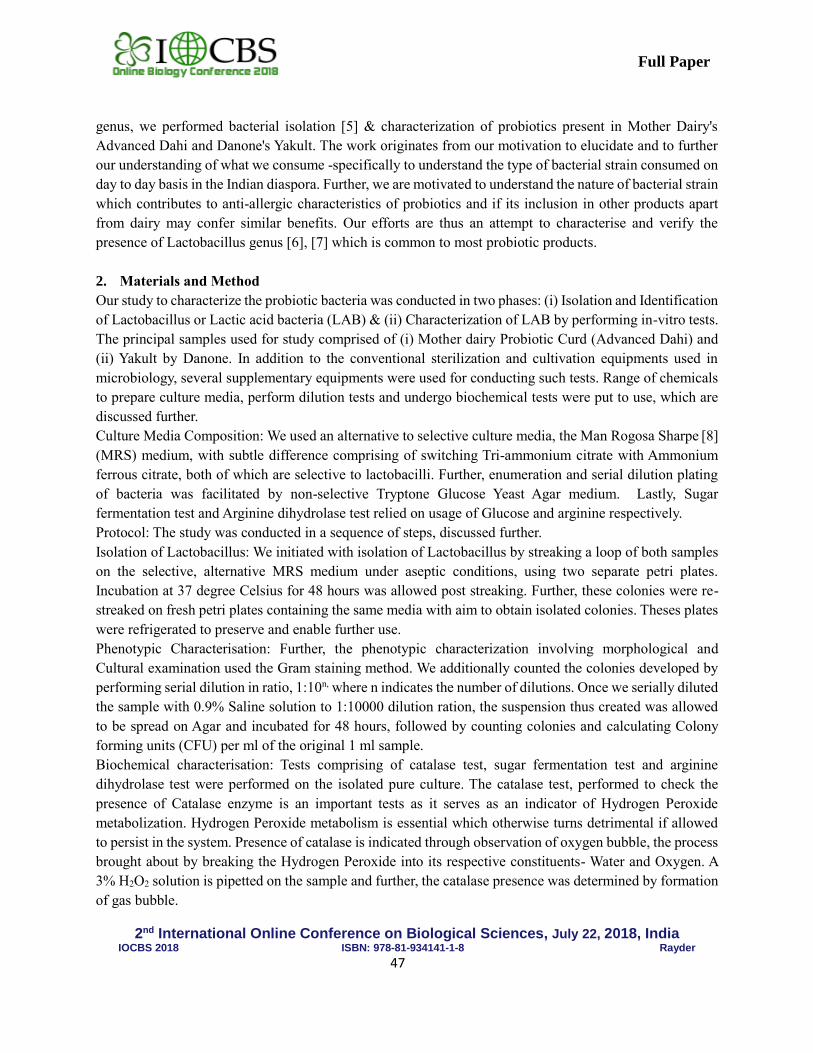
2nd International Online Conference on Biological Sciences, July 22, 2018, India
IOCBS 2018 ISBN: 978-81-934141-1-8 Rayder
47
Full Paper
genus, we performed bacterial isolation [5] & characterization of probiotics present in Mother Dairy's
Advanced Dahi and Danone's Yakult. The work originates from our motivation to elucidate and to further
our understanding of what we consume -specifically to understand the type of bacterial strain consumed on
day to day basis in the Indian diaspora. Further, we are motivated to understand the nature of bacterial strain
which contributes to anti-allergic characteristics of probiotics and if its inclusion in other products apart
from dairy may confer similar benefits. Our efforts are thus an attempt to characterise and verify the
presence of Lactobacillus genus [6], [7] which is common to most probiotic products.
2. Materials and Method
Our study to characterize the probiotic bacteria was conducted in two phases: (i) Isolation and Identification
of Lactobacillus or Lactic acid bacteria (LAB) & (ii) Characterization of LAB by performing in-vitro tests.
The principal samples used for study comprised of (i) Mother dairy Probiotic Curd (Advanced Dahi) and
(ii) Yakult by Danone. In addition to the conventional sterilization and cultivation equipments used in
microbiology, several supplementary equipments were used for conducting such tests. Range of chemicals
to prepare culture media, perform dilution tests and undergo biochemical tests were put to use, which are
discussed further.
Culture Media Composition: We used an alternative to selective culture media, the Man Rogosa Sharpe [8]
(MRS) medium, with subtle difference comprising of switching Tri-ammonium citrate with Ammonium
ferrous citrate, both of which are selective to lactobacilli. Further, enumeration and serial dilution plating
of bacteria was facilitated by non-selective Tryptone Glucose Yeast Agar medium. Lastly, Sugar
fermentation test and Arginine dihydrolase test relied on usage of Glucose and arginine respectively.
Protocol: The study was conducted in a sequence of steps, discussed further.
Isolation of Lactobacillus: We initiated with isolation of Lactobacillus by streaking a loop of both samples
on the selective, alternative MRS medium under aseptic conditions, using two separate petri plates.
Incubation at 37 degree Celsius for 48 hours was allowed post streaking. Further, these colonies were re-
streaked on fresh petri plates containing the same media with aim to obtain isolated colonies. Theses plates
were refrigerated to preserve and enable further use.
Phenotypic Characterisation: Further, the phenotypic characterization involving morphological and
Cultural examination used the Gram staining method. We additionally counted the colonies developed by
performing serial dilution in ratio, 1:10n, where n indicates the number of dilutions. Once we serially diluted
the sample with 0.9% Saline solution to 1:10000 dilution ration, the suspension thus created was allowed
to be spread on Agar and incubated for 48 hours, followed by counting colonies and calculating Colony
forming units (CFU) per ml of the original 1 ml sample.
Biochemical characterisation: Tests comprising of catalase test, sugar fermentation test and arginine
dihydrolase test were performed on the isolated pure culture. The catalase test, performed to check the
presence of Catalase enzyme is an important tests as it serves as an indicator of Hydrogen Peroxide
metabolization. Hydrogen Peroxide metabolism is essential which otherwise turns detrimental if allowed
to persist in the system. Presence of catalase is indicated through observation of oxygen bubble, the process
brought about by breaking the Hydrogen Peroxide into its respective constituents- Water and Oxygen. A
3% H2O2 solution is pipetted on the sample and further, the catalase presence was determined by formation
of gas bubble.
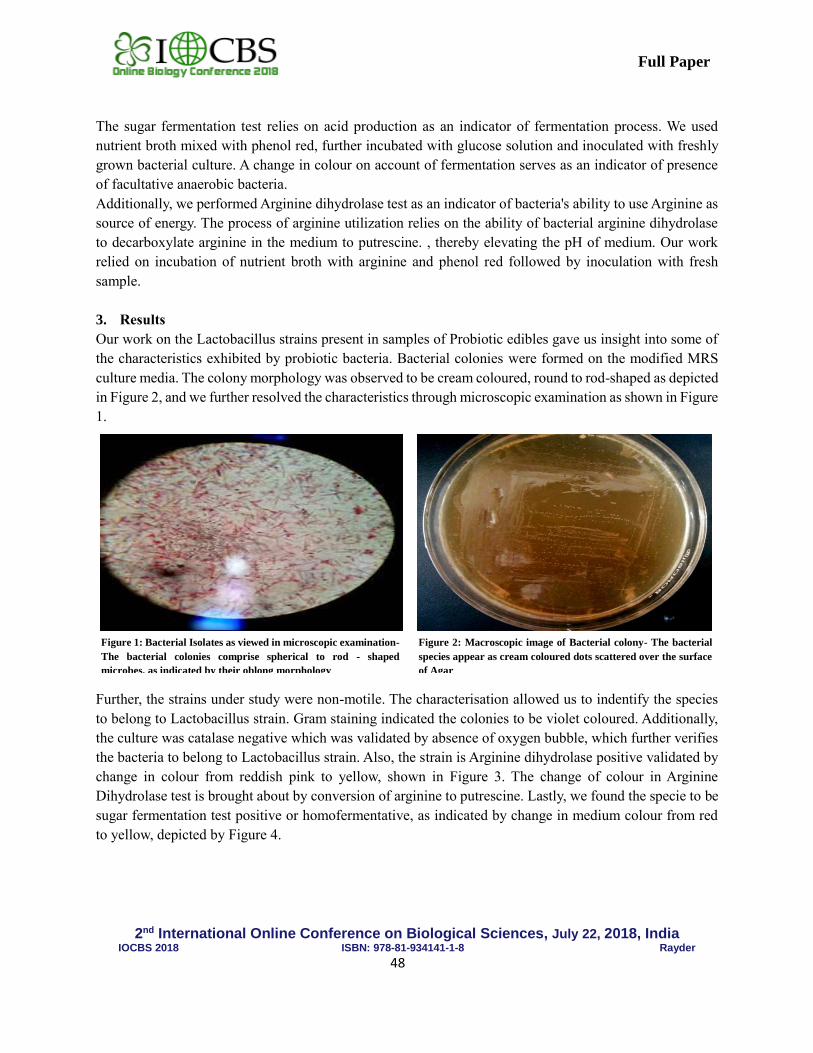
2nd International Online Conference on Biological Sciences, July 22, 2018, India
IOCBS 2018 ISBN: 978-81-934141-1-8 Rayder
48
Full Paper
The sugar fermentation test relies on acid production as an indicator of fermentation process. We used
nutrient broth mixed with phenol red, further incubated with glucose solution and inoculated with freshly
grown bacterial culture. A change in colour on account of fermentation serves as an indicator of presence
of facultative anaerobic bacteria.
Additionally, we performed Arginine dihydrolase test as an indicator of bacteria's ability to use Arginine as
source of energy. The process of arginine utilization relies on the ability of bacterial arginine dihydrolase
to decarboxylate arginine in the medium to putrescine. , thereby elevating the pH of medium. Our work
relied on incubation of nutrient broth with arginine and phenol red followed by inoculation with fresh
sample.
3. Results
Our work on the Lactobacillus strains present in samples of Probiotic edibles gave us insight into some of
the characteristics exhibited by probiotic bacteria. Bacterial colonies were formed on the modified MRS
culture media. The colony morphology was observed to be cream coloured, round to rod-shaped as depicted
in Figure 2, and we further resolved the characteristics through microscopic examination as shown in Figure
1.
Further, the strains under study were non-motile. The characterisation allowed us to indentify the species
to belong to Lactobacillus strain. Gram staining indicated the colonies to be violet coloured. Additionally,
the culture was catalase negative which was validated by absence of oxygen bubble, which further verifies
the bacteria to belong to Lactobacillus strain. Also, the strain is Arginine dihydrolase positive validated by
change in colour from reddish pink to yellow, shown in Figure 3. The change of colour in Arginine
Dihydrolase test is brought about by conversion of arginine to putrescine. Lastly, we found the specie to be
sugar fermentation test positive or homofermentative, as indicated by change in medium colour from red
to yellow, depicted by Figure 4.
Figure 2: Macroscopic image of Bacterial colony- The bacterial
species appear as cream coloured dots scattered over the surface
of Agar
Figure 1: Bacterial Isolates as viewed in microscopic examination-
The bacterial colonies comprise spherical to rod - shaped
microbes, as indicated by their oblong morphology
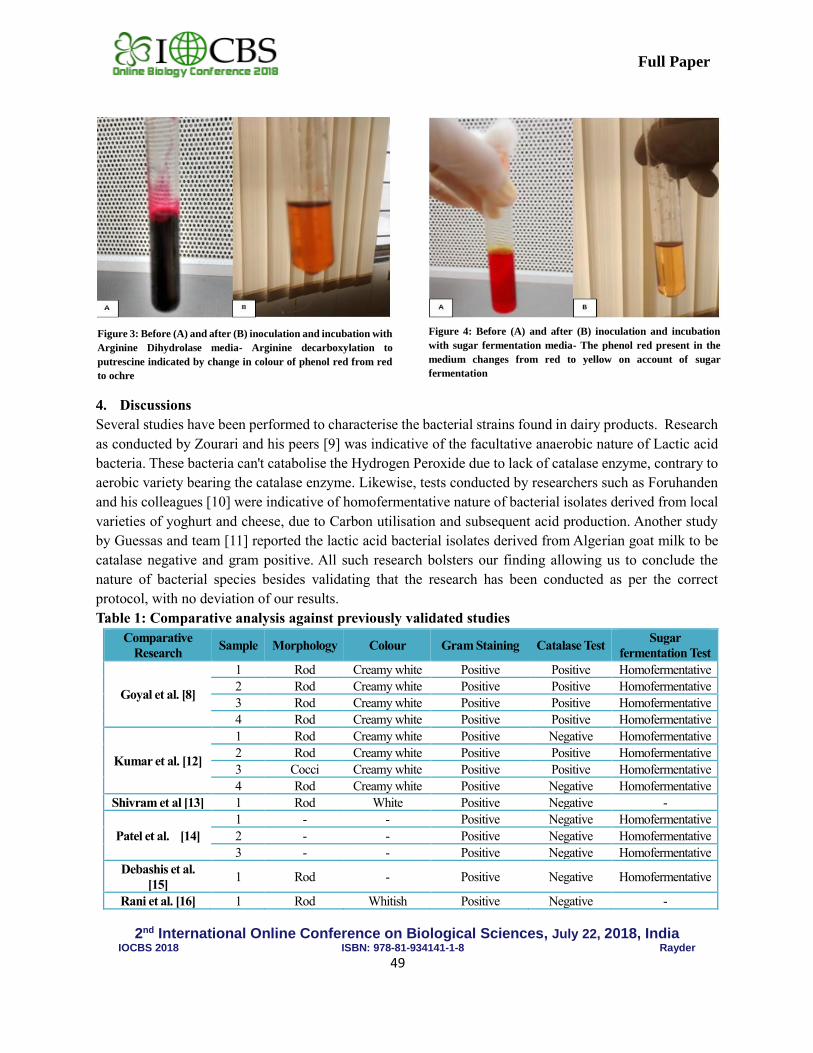
2nd International Online Conference on Biological Sciences, July 22, 2018, India
IOCBS 2018 ISBN: 978-81-934141-1-8 Rayder
49
Full Paper
4. Discussions
Several studies have been performed to characterise the bacterial strains found in dairy products. Research
as conducted by Zourari and his peers [9] was indicative of the facultative anaerobic nature of Lactic acid
bacteria. These bacteria can't catabolise the Hydrogen Peroxide due to lack of catalase enzyme, contrary to
aerobic variety bearing the catalase enzyme. Likewise, tests conducted by researchers such as Foruhanden
and his colleagues [10] were indicative of homofermentative nature of bacterial isolates derived from local
varieties of yoghurt and cheese, due to Carbon utilisation and subsequent acid production. Another study
by Guessas and team [11] reported the lactic acid bacterial isolates derived from Algerian goat milk to be
catalase negative and gram positive. All such research bolsters our finding allowing us to conclude the
nature of bacterial species besides validating that the research has been conducted as per the correct
protocol, with no deviation of our results.
Table 1: Comparative analysis against previously validated studies
Comparative
Research Sample Morphology Colour Gram Staining Catalase Test
Sugar
fermentation Test
Goyal et al. [8]
1 Rod Creamy white Positive Positive Homofermentative
2 Rod Creamy white Positive Positive Homofermentative
3 Rod Creamy white Positive Positive Homofermentative
4 Rod Creamy white Positive Positive Homofermentative
Kumar et al. [12]
1 Rod Creamy white Positive Negative Homofermentative
2 Rod Creamy white Positive Positive Homofermentative
3 Cocci Creamy white Positive Positive Homofermentative
4 Rod Creamy white Positive Negative Homofermentative
Shivram et al [13] 1 Rod White Positive Negative -
Patel et al. [14]
1 - - Positive Negative Homofermentative
2 - - Positive Negative Homofermentative
3 - - Positive Negative Homofermentative
Debashis et al.
[15] 1 Rod - Positive Negative Homofermentative
Rani et al. [16] 1 Rod Whitish Positive Negative -
Figure 3: Before (A) and after (B) inoculation and incubation with
Arginine Dihydrolase media- Arginine decarboxylation to
putrescine indicated by change in colour of phenol red from red
to ochre
Figure 4: Before (A) and after (B) inoculation and incubation
with sugar fermentation media- The phenol red present in the
medium changes from red to yellow on account of sugar
fermentation
2nd International Online Conference on Biological Sciences, July 22, 2018, India
IOCBS 2018 ISBN: 978-81-934141-1-8 Rayder
50
Full Paper
Also, basis the comparative analysis of several existing studies, as shown in table 1, we have been able to
verify our results, thereby serving as a suitable justification for the work done.
Our work thus validates several existing studies striving to affirm the commonality of Lactobacillus strain
for most probiotic products, as compared to probiotic species from other genera such as Saccharomyces
and Bifidobacterium, thereby contributing both to the scientific community and the general masses.
Although several studies are in foray to characterise the probiotics, the novelty of this study arises from the
samples tested, given the huge volume of dairy probiotics emerging in the Indian market. Understandably,
we selected the most popular probiotic products based on a general industry perception, particularly
focusing on the probiotics consumed by the urban metropolitan community. Given that, to the best our
knowledge, no such study has been performed to characterise the packaged probiotic dairy products
consumed by Indians, we have served to impart novelty in this direction by using only the samples from
treated, packaged dairy goods.
The use of handful of samples may serve as its limitations, but we believe that our work provides impetus
for conducting market wide studies across the plethora of other dairy probiotics. Further, this research has
allowed us confirm the significance our work, given the growing need for the Indian community to
understand what we consume in an effort to combat challenges arising from poor health. With understanding
of the anti-allergic benefits which these probiotics offer, we may also consider to potentially make them a
part of diet by enriching other components of food with this bacterial genus. An improved understanding
of general nature of popular consumables amongst Indian can allow us to effectively deploy measures that
can contribute to better health and fitter Indian population. Since dairy products are nearly an indispensible
part of the Indian diet, a characterisation of organisms that makes dairy products beneficial shall allow us
to seek potential ways where the similar organisms can be introduced in other food products.
5. Conclusion
Based on our present work, we conclude that the probiotic samples in dairy products are characterised by
rod-oval shaped cream colonies which are gram positive, sugar fermentation test positive and Arginine
dihydrolase positive. These species were non-motile. Further, no catalase was produced in these strains.
Hence, we could conclude from our characterisation tests that the absence of catalase enzyme indicates the
strains to be Lactobacillus.
Further, the characterisation of bacteria in probiotics in the Indian market serves to be valuable to the
community as it fosters an improved understanding of what we consume. Such attempt enables the
consumers to become more aware of the food they consume, allowing them to discern what is palatable and
what is not. The said work serves as foundation for conducting market wide tests for characterisation of
microbial species in different probiotic products and to further perform comparative analysis from the
bigger pool of samples to rank the probiotics in market basis other factors including safety, tolerance. The
work provides a basic evaluation of bacterial specie based on which further tests can be conducted in future.
2nd International Online Conference on Biological Sciences, July 22, 2018, India
IOCBS 2018 ISBN: 978-81-934141-1-8 Rayder
51
Full Paper
References
[1] Holzapfel WH, Haberer P, Geisen R, Bjorkroth J, Schillinger U. Taxonomy and important features of probiotic
microorganisms in food and nutrition. American Journal for Clinical Nutrition: 73(2): 365s-373s, 2001.
[2] Haug A, Høstmark AT, Harstad OM. Bovine milk in human nutrition – a review. Lipids in Health and Disease: 25
(6) 2007.
[3] Sanders ME, Guarner F, Guerrant F, Holt PR , Quigley EMM, Sartor RB, Sherman PM, Mayer EA. An update on
the use and investigation of probiotics in health and disease. Gut: 62 (5): 787-796, 2013.
[4] Kechagia M, Basoulis D, Konstantopoulou S, Dimitriadi D, Gyftopoulou K, Skarmoutsou N, Fakiri EM. Health
benefits of Probiotics: A Review. ISRN Nutrition. 2013: 1-7, 2013.
[5] Coueret V, Dubernet S, Bernardeau M, Gueguen M, Vernoux J. Isolation, characterisation and identification of
lactobacilli focusing mainly on cheeses and other dairy products. Le Lait, INRA Editions: 83 (4): 269-306, 2003.
[6] Ljungh A and Wadstrom T. Lactic Acid Bacteria as Probiotics. Current Issues Intestinal Microbiology, 7: 73-90,
2006.
[7] Setyawardani T, Rahayu WP, Maheswari R, Palupi NHS. Identification and Characterization of Probiotic Lactic
Acid Bacteria Isolated from Indigenous Goat Milk. Animal Production: 13 (1):57-63, 2011.
[8] Goyal R, Dhingra H, Bajpai P, Joshi N. Characterization of the Lactobacillus isolated from different curd samples. African
Journal of Biotechnology: 11(79): 14448-14452, 2012.
[9] Zourari A, Accolas J P, Desmazeaud H J. Metabolism and biochemical characteristics of yoghurt bacteria. Lait:
7:21-34, 1992.
[10] Forouhandeh H, Vahed ZS, Hejazi MS, Nahaei MR, Dibavar MK. Isolation and Phenotypic Characterization of
Lactobacillus species from various dairy products, Current Research in Bacteriology: 3: 84-88, 2010.
[11] Guessas B, Kihal M . Characterization of lactic acid bacteria isolated from Algerian arid zone raw goats’ milk,
African Journal of Biotechnology: 3:339-342. 2004
[12] Kumar A, Kumar D. Isolation and characterization of bacteria from dairy samples of Solan in Himachal Pradesh for
identification of Lactobacillus spp. International Journal of Pharmaceutical Sciences Review and Research: 25 (2): 110-114,
2014.
[13] Shivram PL, Vishwanath PP. Assessment of Probiotic Potential of Lactobacillus Sp. Isolated from cheese and preparation of
probiotic ice-cream. International Journal of Research in Ayurveda and Pharmacy: 3(4): 532-536, 2012.
[14] Patel SA, Parikh SC. Isolation and Screening of Probiotic Potential Lactic Acid Bacteria from Local Dairy Products.
International Journal of Current Microbiology and Applied Sciences: 5(11): 490-498, 2016.
[15] Halder D, Mandal S. Curd Lactobacilli with Probiotic Potentiality. Translational Biomedicine: 6(2:8): 1-6, 2015.
[16] Rani VU, Pradeep BV. Isolation, identification and characterisation of novel probiotic strain (Lactobacillus paracasei
KUMBB005) from cow milk samples and its antibacterial activity. World Journal of Pharmaceutical Research: 3(5): 599-612,
2014.
2nd International Online Conference on Biological Sciences, July 22, 2018, India
IOCBS 2018 ISBN: 978-81-934141-1-8 Rayder
52
Full Paper
Case report: management of Psoriasis (Ekakustha) by multiple Shodhana and
Shamana Chikitsa
Shivani Nirmal1, Joyal Patel2*, Kalpesh Dattani3
1Private Practitioner, Nirmal Clinic, 5/6-Patel Colony, Road. No.-1, Jamnagar, 361008, India 2Associate Prof., Dept. of ShalyaTantra, SGAM, Gujarat Ayurved University, Jamnagar,361008, India
3Ass. Prof., Dept. of Kaumarbhritya, SGAM, Gujarat Ayurved University, Jamnagar-361008. India
*Corresponding email: [email protected]
Abstract
Background: Psoriasis is a non-infectious chronic relapsing inflammatory skin disease having unknown
aetiology, characterized by well-defined dry scaly erythematous patches and covered with adherent silvery
white scales. Psychological stress is emphasized as one of the major triggering factors in the exacerbation
of the disease. Psoriasis is one such kind of disorders affecting approximately 2% of the population. The
unique treatment modality of Ayurveda provides long lasting results and a better life to patients through its
three basic principles of treatment i.e. Shodhana, Shamana and Nidana Parivarjana.
Materials and Methods: In this study, we have reported a 60 years male patient having symptoms of
Ekakushtha since last 15 years. He had taken allopathic medicine from skin specialist for long time but did
not get any relief. After that he consulted to Nirmal Clinic. He was suffering from large round erythematous
scaly patches over body and also severe itching and dryness over affected lesions. There was no significant
past history of any other chronic illness. The patient was treated with Virechana, Basti, Nasya therapies in
Panchakarma followed by oral medications.
Results: Patient had significant relief after this therapy.
Conclusion: This case study concluded that, Ayurvedic management by Shodhan and Shaman combined
therapy gives better result in Psoriasis.
Keywords: Ekakushta 1, Psoriasis 2, Ayurveda 3, Shodhan 4, Shaman 5.
1. Introduction
Psoriasis is a long-lasting autoimmune disease characterized by patches of abnormal skin [1]. These skin
patches are typically red, itchy, and scaly. Psoriasis varies in severity from small, localized patches to
complete body coverage. There are five main types of Psoriasis: Plaque, Guttate, Inverse, Pustular,
and erythrodermic. Plaque psoriasis, also known as psoriasis vulgaris, makes up about 90 percent of cases.
[2] It typically presents as red patches with white scales on top. Areas of the body most commonly affected
are the back of the forearms, shins, navel area, and scalp. Guttate psoriasis has drop-shaped lesions. Pustular
psoriasis presents as small non-infectious pus-filled blisters. Inverse psoriasis forms red patches in skin
folds. [3] Erythrodermic psoriasis occurs when the rash becomes very widespread, and can develop from
any of the other types. The disease affects two to four percent of the population. [4] Men and women are
affected with equal frequency. The disease may begin at any age, but typically starts in adulthood. Psoriasis
is associated with an increased risk of psoriatic arthritis, lymphomas, cardiovascular disease, Crohn's
2nd International Online Conference on Biological Sciences, July 22, 2018, India
IOCBS 2018 ISBN: 978-81-934141-1-8 Rayder
53
Full Paper
disease and depression. Modern medical science treats psoriasis with PUVA and corticosteroids. But these
therapies give serious side effects like hepato & nephrotoxicity, bone marrow depletion etc. Today, modern
medical science has lots of facilities and upgraded technologies for treatment of patient but still many
diseases are in progressive phase in the society. Hence it is the need of time to find out safe and effective
treatment for Psoriasis and here Ayurveda plays an important role.
In Ayurveda, all skin diseases are grouped under a broad heading of Kushtha Roga.Ekakushtha is
one of such diseases explained under the heading of Kshudra Kushtha (minor skin ailments). [5] even
though, in terms of severity, incidence and prognosis, it is not a minor kind. Treating various types of
Kushtha is a challenge due to involvement of three doshas, [6] incurability and recurrence of nature attracts
the researchers to find out a suitable solutionfor Kushtha. It has even become a challenge to different
medical system including Ayurveda. The classical symptoms of Ekakushtha described in Ayurveda, which
can be correlated with Psoriasis due to very much similarity in their symptoms [7] reduced sweating
(asweda), extended skin lesions (mahavastu), scaling of skin similar to the scales of the fish
(matsyashakalopama), pink discolouration (arunavarna), blackening of the part (Krishnavarna) etc. [8]
which resembles with Psoriasis. The clinical feature of Ekakushtha described by Acharya Kashyap
represents remission, relapse and seasonal variation which are present in Psoriasis. [9]
Panchakarma (Shodhana) therapy is a unique type of treatment for various chronic, auto-immune,
hormonal, degenerative disorders etc., where other sorts of treatments have no satisfactory answer as well
equally beneficial for the promotion and preservation of health. In addition of the Shamana Yoga &
External Application (Bahirparimarjan Chikitsa) of drug is administered after taking the proper course
of Shodhana then it provides additional relief and thus helps in eradication of the diseases (psoriasis)
completely. The present article reviews the concept of psoriasis in Ayurveda and role
of Panchakarma & Shaman Chikitsa in the management of psoriasis.
2. Case Report
Age & Sex: 60 years male
OPD no.: 17168
Chief Complaints: Itching and discolouration of skin, erythematous patches of rounded to irregular shape,
appearance of silvery scales guarding the patches over her trunk, hands, legs and scalp, constipation, gas
trouble, loss of appetite, physical and mental stress and disturbed sleep before 15 years.
History of Present Illness: A patient came to OPD at Nirmal Clinic with above mentioned chief complains.
He was in healthy state, later he started with itching all over body. The area affected with itching slowly
got discoloured and dry. Also, there was appearance of red erythematous patches guarded with scales.
Simultaneously he was suffering from constipation, loss of appetite, physical and mental stress and
disturbed sleep. He had taken treatment of allopathic medicine for years but didn’t get any relief. So, he
consulted Nirmal Clinic for Panchkarma therapy.
Precipitating Factor: Cold weather, mental stress and unhygienic.
Personal History: Addiction: No
Day sleeping: yes
Regular exercise: No
Veg. /Non veg.: Veg.

2nd International Online Conference on Biological Sciences, July 22, 2018, India
IOCBS 2018 ISBN: 978-81-934141-1-8 Rayder
54
Full Paper
Bowel: Constipated
Urine: Normal
Sleep: Less
Appetite: Low
Type of Diet: Frequent use of sour, salty, pungent (pickles, jam and sauce etc.) and fermented foods, curd,
incompatible diet such as fruit salad (combination of milk with citrus fruits i.e., grapes, pomegranate, apple,
banana etc.), milk combine with sour and salty foods, radish, onion.
History related to lifestyle: On counselling, it was observed that patient was used to indulge in faulty life
style such as awakening at night, drinking of cold water/ cold water bath just after sun exposure, day sleep
just after meal. Moreover, suppression of natural urges (defecation, urination) is very common issue
observed in the patient.
Family History: Family members are not having similar complaints in past or present.
Past History: No history of any major systemic illness.
Psychological History: Tension, Irritability, Anxiety
Physical examinations:
• Blood pressure - 130/84 mm of Hg
• Weight-80 kg
• Height -6’ 2”
• Pulse rate – 80/minute
• R.R. - 22/minute
• Temperature: Normal (98.8 °F)
Systemic examination:
• R.S. (Respiratory System): Bilateral equal airway
• G.I.T. (Gastro Intestinal Tract System): NAD
• C.V.S. (Cardio Vascular System): NAD
• Loco motor System: NAD
Local examination of lesion:
• Colour of lesion : rich red with white scaling
• Shape : round and oval shaped
• Border : well demarcated
• Surface : rough
• Variety of lesion : plaque type of variety
• Sensation : normal
• Diagnostic Sign(Auspitz Sign): positive
3. Material and Methods:
In this case written consent has been taken from the patient and prognosis of the disease and detail
treatment plan along with its probable complications were explained to the patient and his relatives. The
patient was treated with Shaman and Shodhan therapy, 2 sitting of Virechan Karma, Basti Karma and Nasya
Karma. The treatment is given in two different ways;
Oral medications: (Shaman Therapy)
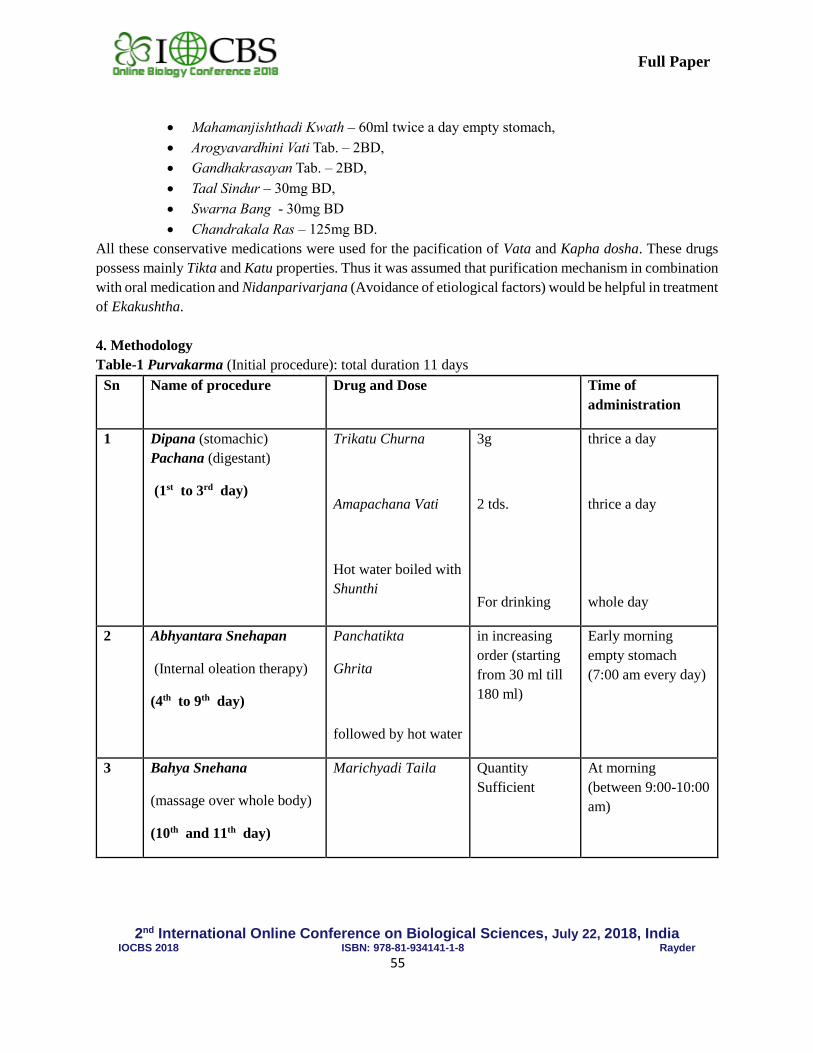
2nd International Online Conference on Biological Sciences, July 22, 2018, India
IOCBS 2018 ISBN: 978-81-934141-1-8 Rayder
55
Full Paper
• Mahamanjishthadi Kwath – 60ml twice a day empty stomach,
• Arogyavardhini Vati Tab. – 2BD,
• Gandhakrasayan Tab. – 2BD,
• Taal Sindur – 30mg BD,
• Swarna Bang - 30mg BD
• Chandrakala Ras – 125mg BD.
All these conservative medications were used for the pacification of Vata and Kapha dosha. These drugs
possess mainly Tikta and Katu properties. Thus it was assumed that purification mechanism in combination
with oral medication and Nidanparivarjana (Avoidance of etiological factors) would be helpful in treatment
of Ekakushtha.
4. Methodology
Table-1 Purvakarma (Initial procedure): total duration 11 days
Sn Name of procedure Drug and Dose Time of
administration
1 Dipana (stomachic)
Pachana (digestant)
(1st to 3rd day)
Trikatu Churna
Amapachana Vati
Hot water boiled with
Shunthi
3g
2 tds.
For drinking
thrice a day
thrice a day
whole day
2 Abhyantara Snehapan
(Internal oleation therapy)
(4th to 9th day)
Panchatikta
Ghrita
followed by hot water
in increasing
order (starting
from 30 ml till
180 ml)
Early morning
empty stomach
(7:00 am every day)
3 Bahya Snehana
(massage over whole body)
(10th and 11th day)
Marichyadi Taila Quantity
Sufficient
At morning
(between 9:00-10:00
am)
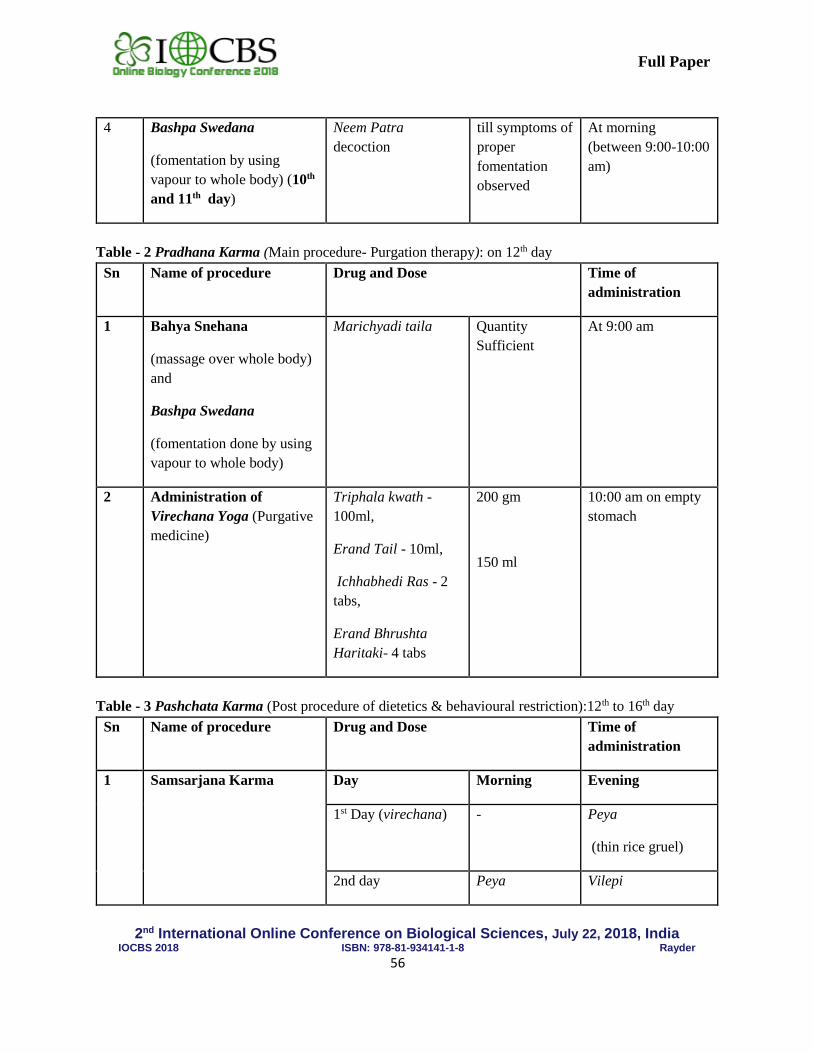
2nd International Online Conference on Biological Sciences, July 22, 2018, India
IOCBS 2018 ISBN: 978-81-934141-1-8 Rayder
56
Full Paper
4 Bashpa Swedana
(fomentation by using
vapour to whole body) (10th
and 11th day)
Neem Patra
decoction
till symptoms of
proper
fomentation
observed
At morning
(between 9:00-10:00
am)
Table - 2 Pradhana Karma (Main procedure- Purgation therapy): on 12th day
Sn Name of procedure Drug and Dose Time of
administration
1 Bahya Snehana
(massage over whole body)
and
Bashpa Swedana
(fomentation done by using
vapour to whole body)
Marichyadi taila Quantity
Sufficient
At 9:00 am
2 Administration of
Virechana Yoga (Purgative
medicine)
Triphala kwath -
100ml,
Erand Tail - 10ml,
Ichhabhedi Ras - 2
tabs,
Erand Bhrushta
Haritaki- 4 tabs
200 gm
150 ml
10:00 am on empty
stomach
Table - 3 Pashchata Karma (Post procedure of dietetics & behavioural restriction):12th to 16th day
Sn Name of procedure Drug and Dose Time of
administration
1 Samsarjana Karma Day Morning Evening
1st Day (virechana) - Peya
(thin rice gruel)
2nd day Peya Vilepi
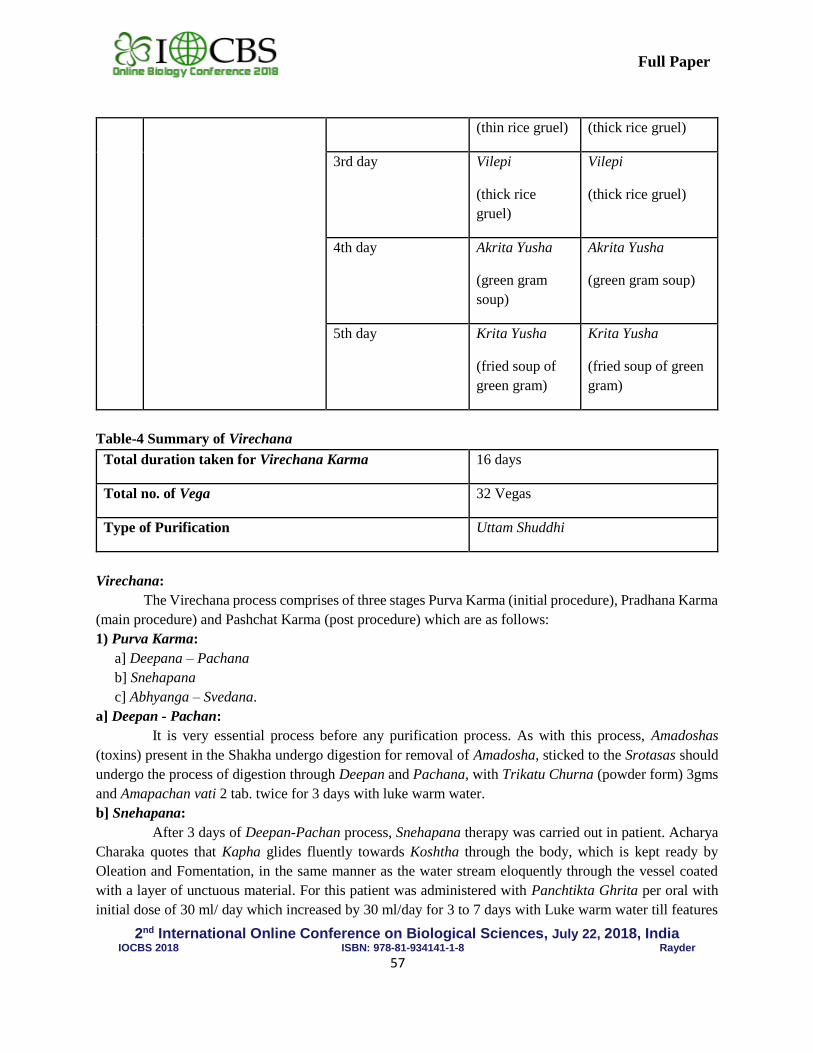
2nd International Online Conference on Biological Sciences, July 22, 2018, India
IOCBS 2018 ISBN: 978-81-934141-1-8 Rayder
57
Full Paper
(thin rice gruel) (thick rice gruel)
3rd day Vilepi
(thick rice
gruel)
Vilepi
(thick rice gruel)
4th day Akrita Yusha
(green gram
soup)
Akrita Yusha
(green gram soup)
5th day Krita Yusha
(fried soup of
green gram)
Krita Yusha
(fried soup of green
gram)
Table-4 Summary of Virechana
Total duration taken for Virechana Karma 16 days
Total no. of Vega 32 Vegas
Type of Purification Uttam Shuddhi
Virechana:
The Virechana process comprises of three stages Purva Karma (initial procedure), Pradhana Karma
(main procedure) and Pashchat Karma (post procedure) which are as follows:
1) Purva Karma:
a] Deepana – Pachana
b] Snehapana
c] Abhyanga – Svedana.
a] Deepan - Pachan:
It is very essential process before any purification process. As with this process, Amadoshas
(toxins) present in the Shakha undergo digestion for removal of Amadosha, sticked to the Srotasas should
undergo the process of digestion through Deepan and Pachana, with Trikatu Churna (powder form) 3gms
and Amapachan vati 2 tab. twice for 3 days with luke warm water.
b] Snehapana:
After 3 days of Deepan-Pachan process, Snehapana therapy was carried out in patient. Acharya
Charaka quotes that Kapha glides fluently towards Koshtha through the body, which is kept ready by
Oleation and Fomentation, in the same manner as the water stream eloquently through the vessel coated
with a layer of unctuous material. For this patient was administered with Panchtikta Ghrita per oral with
initial dose of 30 ml/ day which increased by 30 ml/day for 3 to 7 days with Luke warm water till features
2nd International Online Conference on Biological Sciences, July 22, 2018, India
IOCBS 2018 ISBN: 978-81-934141-1-8 Rayder
58
Full Paper
of samyaksnigdha were appeared. During this period, the patient was kept on semi liquid hot diet with less
unctuous material.
c] Sarvang Abhyang (Whole Body Massage with Oil) and Swedan (Fomentation):
After completion of Oleation therapy, on 7th day patient was subjected for Sarvang Abhyang
(Whole body massage with oil) with Marichyadi Tail and Sarvang Swedan (Fomentation) by Neemba patra
for 2 days for 20-25 minutes or until profuse perspiration occurred. The patient was advised for complete
rest. On this day the patient was advised to take KaphaVardhak and Pitta Vardhaka ahar in the evening on
the second day of Abhyang and Swedan.
2) Pradhan Karma:
On the day of Virechana patient was kept Nil By Mouth (NBM), till the process of Virechana
start. Abhyang along with Swedan was given to the patient. Triphala kwath 100ml, Erand Tail (Castor oil)
10ml, Ichhabhedi Ras 2 tabs, Erand Bhrushta Haritaki 4 tabs this yog was given to patient. After 1 hour of
administration of virechana yog, patient was followed for virechana vega (acts of purgation) to commence
on his own. Time and quantity of administration of Virechana dravyas, acts of Virechana (severe, moderate
and mild), amount of stool along with its consistency colour and other symptoms were noted. The process
was continued till patient was undergone through 24 major and 6 minor purgation acts (Vegas). When
appearance of stool was composed of Pitta and Kapha and also patient felt tired but light, the procedure
was stopped. Sansarjan karma was followed for 7 days.
3) Pashchat Karma:
The time period from the completion of Vegas, till the patient reached his normal diet is crucial
and the specific management that has to be taken at this juncture is known as Paschat Karma (“after” care).
After the completion of Virechan patient kept on SamsarjanaKrama (special dietetic regimen) modified
according to the intensity of the vamana procedure. Patient generally advised to take rest and eat an
individualized peyadi samsarjanakrama (thin rice gruel) for 3 to 5 days. On the 5th day a normal diet is
resumed.
BASTI KARMA (KALA BASTI):
Ingrediants of Niruha Basti:
• Kwath Dravya (200 ml each)
➢ Manjishthadi kwath – 200ml,
➢ Guduchyadi kwath – 200ml,
➢ Triphala kwath – 200ml,
• Prakshepaka (100 gm)
➢ Saindhava, Shatapushpa, Hingu, Madhu, Gaumutraarka, Haridra, Sariva, Vacha,
Madanphala [10]
Ingrediants of AnuvsanaBasti:
• Sneha Dravya 60 ml (each 15 ml)
➢ Tuvarak Tail,
➢ Padmak Tail,
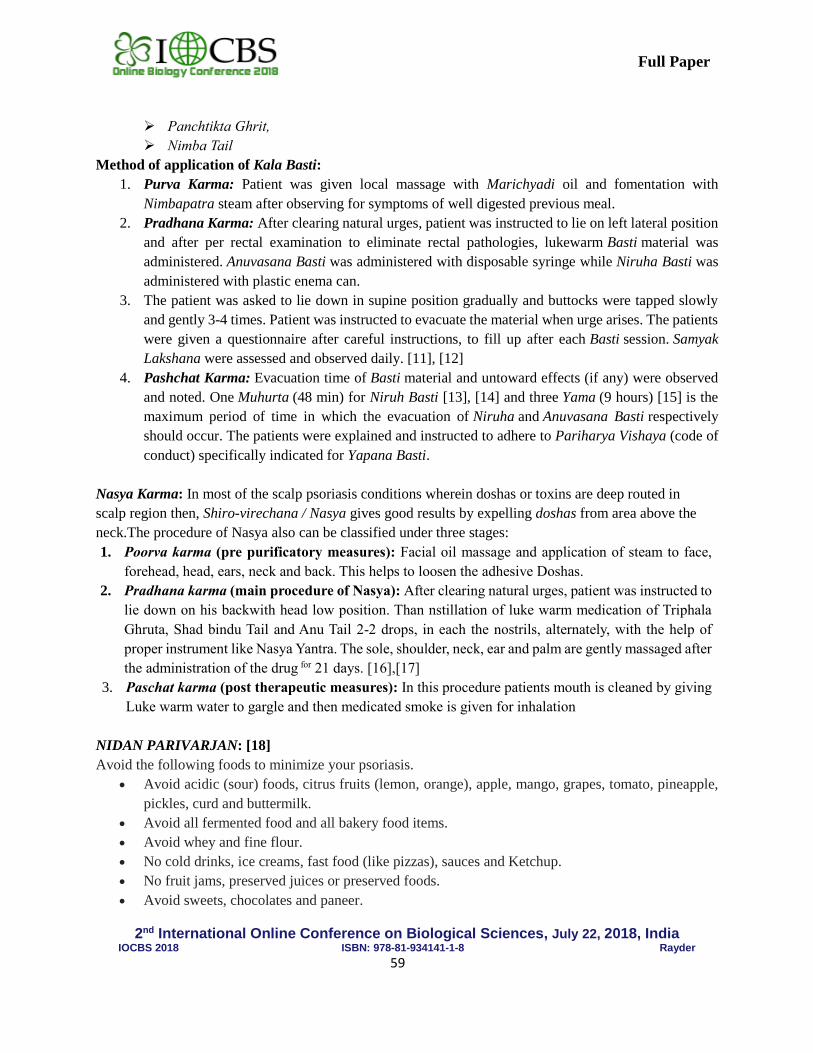
2nd International Online Conference on Biological Sciences, July 22, 2018, India
IOCBS 2018 ISBN: 978-81-934141-1-8 Rayder
59
Full Paper
➢ Panchtikta Ghrit,
➢ Nimba Tail
Method of application of Kala Basti:
1. Purva Karma: Patient was given local massage with Marichyadi oil and fomentation with
Nimbapatra steam after observing for symptoms of well digested previous meal.
2. Pradhana Karma: After clearing natural urges, patient was instructed to lie on left lateral position
and after per rectal examination to eliminate rectal pathologies, lukewarm Basti material was
administered. Anuvasana Basti was administered with disposable syringe while Niruha Basti was
administered with plastic enema can.
3. The patient was asked to lie down in supine position gradually and buttocks were tapped slowly
and gently 3-4 times. Patient was instructed to evacuate the material when urge arises. The patients
were given a questionnaire after careful instructions, to fill up after each Basti session. Samyak
Lakshana were assessed and observed daily. [11], [12]
4. Pashchat Karma: Evacuation time of Basti material and untoward effects (if any) were observed
and noted. One Muhurta (48 min) for Niruh Basti [13], [14] and three Yama (9 hours) [15] is the
maximum period of time in which the evacuation of Niruha and Anuvasana Basti respectively
should occur. The patients were explained and instructed to adhere to Pariharya Vishaya (code of
conduct) specifically indicated for Yapana Basti.
Nasya Karma: In most of the scalp psoriasis conditions wherein doshas or toxins are deep routed in
scalp region then, Shiro-virechana / Nasya gives good results by expelling doshas from area above the
neck.The procedure of Nasya also can be classified under three stages:
1. Poorva karma (pre purificatory measures): Facial oil massage and application of steam to face,
forehead, head, ears, neck and back. This helps to loosen the adhesive Doshas.
2. Pradhana karma (main procedure of Nasya): After clearing natural urges, patient was instructed to
lie down on his backwith head low position. Than nstillation of luke warm medication of Triphala
Ghruta, Shad bindu Tail and Anu Tail 2-2 drops, in each the nostrils, alternately, with the help of
proper instrument like Nasya Yantra. The sole, shoulder, neck, ear and palm are gently massaged after
the administration of the drug for 21 days. [16],[17]
3. Paschat karma (post therapeutic measures): In this procedure patients mouth is cleaned by giving
Luke warm water to gargle and then medicated smoke is given for inhalation
NIDAN PARIVARJAN: [18]
Avoid the following foods to minimize your psoriasis.
• Avoid acidic (sour) foods, citrus fruits (lemon, orange), apple, mango, grapes, tomato, pineapple,
pickles, curd and buttermilk.
• Avoid all fermented food and all bakery food items.
• Avoid whey and fine flour.
• No cold drinks, ice creams, fast food (like pizzas), sauces and Ketchup.
• No fruit jams, preserved juices or preserved foods.
• Avoid sweets, chocolates and paneer.
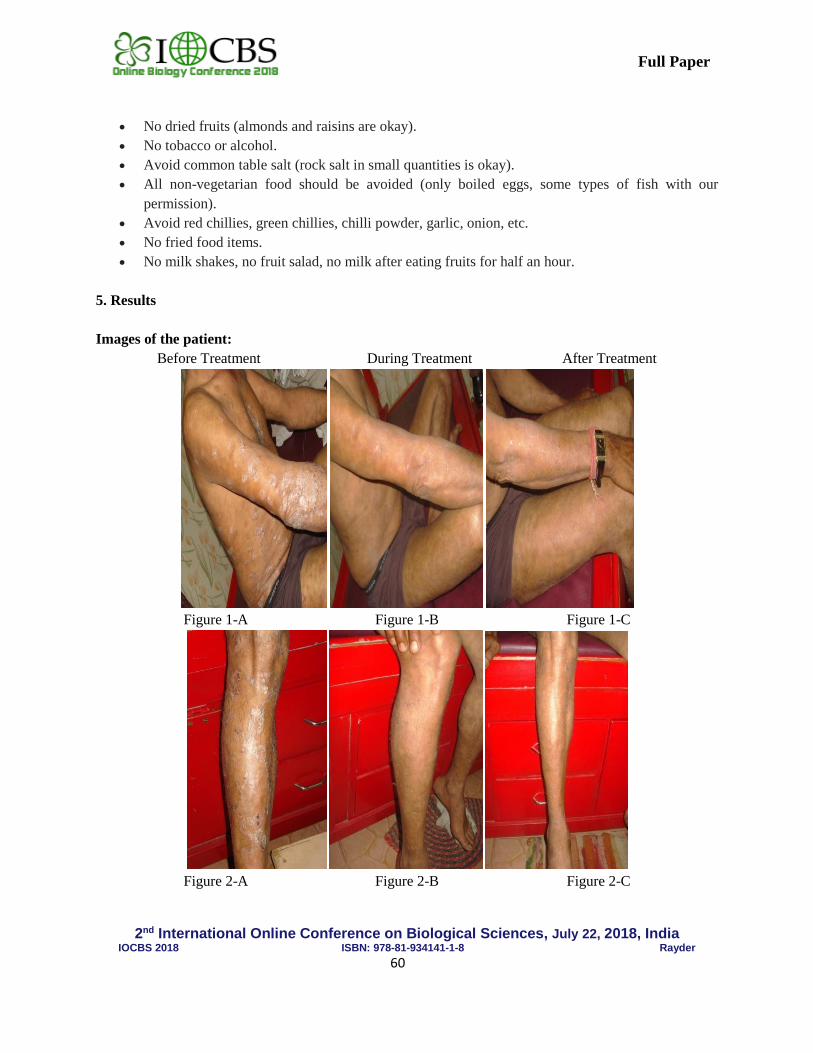
2nd International Online Conference on Biological Sciences, July 22, 2018, India
IOCBS 2018 ISBN: 978-81-934141-1-8 Rayder
60
Full Paper
• No dried fruits (almonds and raisins are okay).
• No tobacco or alcohol.
• Avoid common table salt (rock salt in small quantities is okay).
• All non-vegetarian food should be avoided (only boiled eggs, some types of fish with our
permission).
• Avoid red chillies, green chillies, chilli powder, garlic, onion, etc.
• No fried food items.
• No milk shakes, no fruit salad, no milk after eating fruits for half an hour.
5. Results
Images of the patient:
Before Treatment During Treatment After Treatment
Figure 1-A Figure 1-B Figure 1-C
Figure 2-A Figure 2-B Figure 2-C
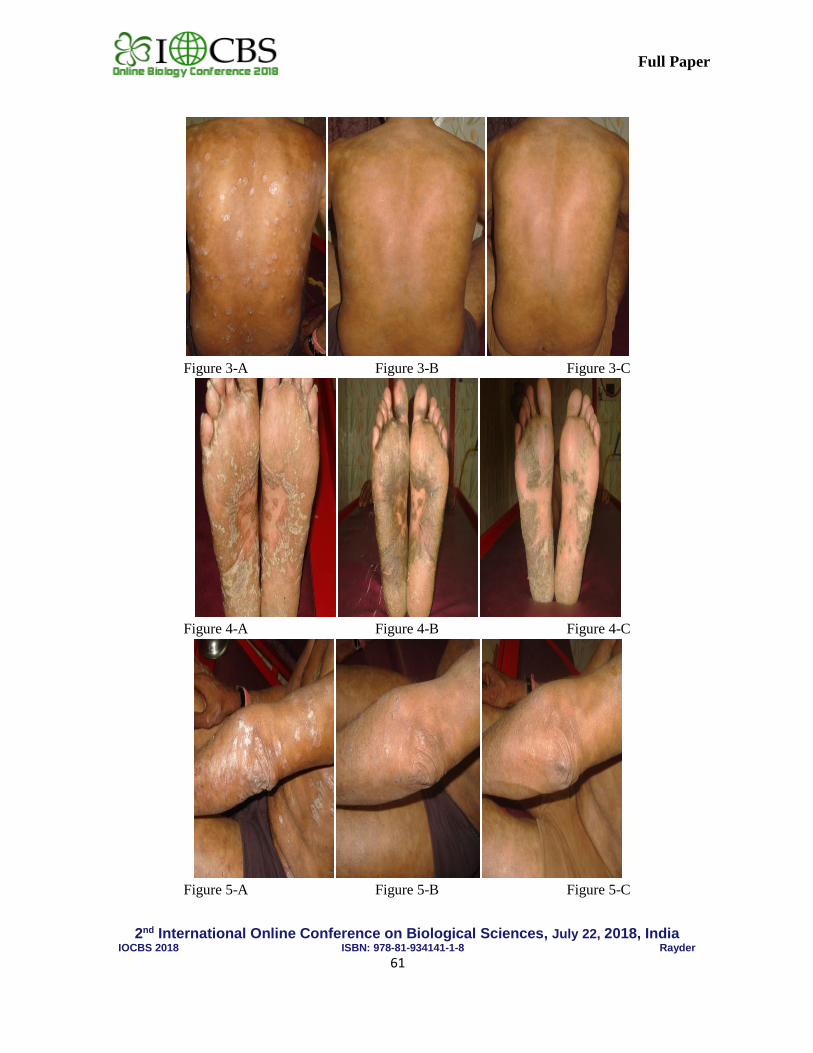
2nd International Online Conference on Biological Sciences, July 22, 2018, India
IOCBS 2018 ISBN: 978-81-934141-1-8 Rayder
61
Full Paper
Figure 3-A Figure 3-B Figure 3-C
Figure 4-A Figure 4-B Figure 4-C
Figure 5-A Figure 5-B Figure 5-C

2nd International Online Conference on Biological Sciences, July 22, 2018, India
IOCBS 2018 ISBN: 978-81-934141-1-8 Rayder
62
Full Paper
Figure 6-A Figure 6-B Figure 6-C
Figure 7-A Figure 7-B Figure 7-C
After purgation therapy, the reddish silvery patches and scaling disappeared at the end of
Samsarjana Krama (dietetics and behavioural restriction) leaving some area of hyper pigmentation over
back, upper and lower extremities. Itching was completely relieved whereas, burning was slightly persisting
after Virechana (therapeutic purgation). Moreover, control of psoriasis symptoms improved the mental
status of the patient remarkably by reducing psychological symptoms like, tension, irritability and anxiety.
But, there was mild improvement in nail changes.
The holistic approach of Virechana procedure removes the toxic waste materials from the body
and also boosts the immune system and provides substantial relief to the patient.
6. Discussion
Effect of therapy:
Skin-related symptoms like Kandu (itching), Daah (burning sensation) and Vaivarnya
(discoloration) were relieved in a very short period after Vaman and Virechan karma. In the G.I. tract an
2nd International Online Conference on Biological Sciences, July 22, 2018, India
IOCBS 2018 ISBN: 978-81-934141-1-8 Rayder
63
Full Paper
excellent result was achieved in symptoms like Amlodgar, Hrillas (nausea), Udardaah (abdominal
burning), Urodaah (heart burn) and Vibandh (constipation).
Mode of Action:
1. The primary one is Samshamana, which is a palliative approach that normalizes the doshas rather
than expelling them from the body. Palliation involves enkindling Agni and stimulating the digestion
through fasting, which in turn neutralizes the toxins. The process by which disturbed dosha subsides
to normal without creating imbalance of other doshas in body is known as shamana. This is usually
achieved by use of digestives, appetisers, sustained hunger and thirst, exercise, sunbathing and sitting
in the fresh air etc.
2. Samshodana (radical treatment which reaches the root cause and eliminate the causative factors) in
the form of Vamana (therapeutic vomiting), Virechana (purgation therapy), and Basti (herbalized
enema) and Nasya (intra nasal medication which purify upper respiratory track) viz. Panchakarmas in
conjunction with proper internal medication is considered as the best line of effective treatment.
Mode of action of Ushna Jala (Hot water)
Ushna Jala (Hot water) as an Anupana (post prandial drink) is indicated in drinking of four type
of Sneha (fat/ghee). [19] The fat molecules are larger in size and hence are hard to digest. But it should be
considered that lipids are hydrophilic in nature and hence, it will have affinity for hot water. [20] The fat
molecules will easily dissolve with water molecules and thus gets easily digested without causing any
Snehana Vyapada (complications due to improper oleation)
Virechan is very effective in pittaj vikara, acts on the Pitta dosha from half part of the duodenum
to the ileocecal junction or till the umbilicus, that is, the small intestine, which is 20 – 25 feet in
length. Virechan remove Pitta from the Koshtha. They are driven toward the Koshtha with the help
of Snehan and Swedan. In this manner Virechan act on the vitiated Doshas of the whole body.
Basti acts on the Vaat-dominting area i.e. Pakvashyaya (large intestine),which is the root of all
types of Vata. The vitiated Vata may irritate the nervous system and according to Ayurveda, Basti is the
best solution for pain, it removes the cause of pain by eliminating the vitiated vaat.
“Nasa Hi Shirso Dwaram”. [21] The medication which administered by nostrils is effect brain
rapidly. Nasya is very effective in the disorders of the nasopharyngeal tract, it removes the
vitiated Kapha that gets thickened, obstructs the nostrils and the opening of the sinuses, resulting in the
obstruction of the function of Vata. Nasya breaks this pathology by lubricating the nasopharyngeal tract,
and thus it not only removes the sticky Kapha, but also subdues the vitiated Vata by its Oleating quality.
Benefits of Samsarjana Karma:
Just as a spark of fire after being fed by grass, powder of dry cow dung etc, gets augmented
gradually and becomes great, steady, and capable of burning everything, similarly, the internal digestion
fire, by the Samsarjana regimen, in the patient who has undergone Vamana karma, gains strength. [22]
2nd International Online Conference on Biological Sciences, July 22, 2018, India
IOCBS 2018 ISBN: 978-81-934141-1-8 Rayder
64
Full Paper
7. Conclusion
This case study concluded that, Ayurvedic management by Shodhan and Shaman therapy in Psoriasis gives
better result, as well as it is equally beneficial for the promotion and preservation of health by removing
toxic wastes, by balancing morbid humours which gives the healthy and peaceful life to patient of Psoriasis.
References
[1] https://wikivisually.com/wiki/Psoriasis, "Questions and Answers about Psoriasis". National Institute of Arthritis
and Musculoskeletal and Skin Diseases. October 2013. Archived from the original on 8 July 2015. Retrieved 1
July2015.
[2] Boehncke, WH; Schön, MP 26 May 2015. "Psoriasis". Lancet. 386: 983–94. Doi: 10.1016/S0140-
6736(14)61909-7. PMID 26025581.
[3] Jain, Sima (2012). Dermatology: illustrated study guide and comprehensive board review. Springer. pp. 83–
87. ISBN 978-1-4419-0524-6. Archived from the original on 2017-09-08.
[4] Parisi R, Symmons DP, Griffiths CE, Ashcroft DM (February 2013). Identification and Management of
Psoriasis and Associated ComorbidiTy (IMPACT) project team. "Global epidemiology of psoriasis: a
systematic review of incidence and prevalence". J Invest Dermatol. 133 (2): 377–85. Doi:
10.1038/jid.2012.339. PMID 23014338.
[5] Kashinath Shastri Charak Samhita of Agnivesha with Vidyotini Hindi Commentry, Chikitsasthan 7/13. (12th
Edition) Chaukhambha Sanskriti Sansthan, Varanasi 1984. Pg. No. 249
[6] Vd. Jadavji T. Acharya, (2005), Charaka Samhita with Ayurveda-Dipika Commentary by Chakrapanidatta,
NidanaSthana, Chapter 5/4, Chaukhamba SurbharatiPrakashana, Varanasi, 216.
[7] Ashwini Patil, Sandhya Pathak, Girbide S G, Reddy A P; psoriasis (eka kushtha) through ayurveda – a case
study; International Ayurvedic Medical journal (IAMJ) Volume 3; Issue 8; August- 2015; Page no.2607-2616.
[8] Kashinath Shastri Charak Samhita of Agnivesha with Vidyotini Hindi Commentry, Chikitsasthan 7/21.
(12thEdition) (Chaukhambha Sanskriti Sansthan, Varanasi) 1984. Pg. No. 252.
[9] Prof. P. V. Tiwari, Kashyapsamhita, Chikitsasthan 9/2; Chaukhambha Viswabharati, Varansi, page no.200
[10] Vijay Shankar MunshiAshtangHrida, Sutrasthan 19/45. (4th Edition) Sastu Sahitya Vardhak Karyalaya,
Ahemdabad, 1983. Pg. No. 145
[11] Dr.Bhaskar Govindji Ghanekar, Sushrut Samhita, Chikitsasthan 38/2-4. (4th Edition) (Motilal Banasaridas,
Varanasi) 1968. Pg. No. 540
[12] Kashinath Shastri Charak Samhita of Agnivesha with Vidyotini Hindi Commentry, Siddhisthan 3/17-18. (12th
Edition) ChaukhambhaSanskritiSansthan, Varanasi) 1984. Pg. No. 991
[13] Dr.Bhaskar Govindji Ghanekar Sushrut Samhita, Chikitsasthan 38/5. (4th Edition) Motilal Banasaridas, Varanasi
1968. Pg. No. 540
[14] Vijay Shankar MunshiAshtangHrida, Sutrasthan 19/45. (4th Edition) Sastu SahityaVardhakKaryalaya,
Ahemdabad 1983. Pg. No. 145
[15] Prof. Ajaykumar Sharma, Kashi Ayurved Granthmala Kayachikitsa, Adhyay 6 ; 4th part, Chaukhamba
Orientaliya, Delhi, Pg. No. 232
[16] Kashinath Shastri Charak Samhita of Agnivesha with Vidyotini Hindi Commentry, Siddhisthan 9/101-103. 12th
Edition Chaukhambha SanskritiSansthan, Varanasi 1984. Pg. No. 1072
[17] Dr.Bhaskar Govindji Ghanekar Sushrut Samhita, Chikitsasthan 40/42. 4th Edition Motilal Banasaridas, Varanasi
1968. Pg. No. 554
[18] https://healthyayurveda.com/living-with-psoriasis-diet-and-life-style-with-ayurveda-management/ assessed on
25/04/2018.
2nd International Online Conference on Biological Sciences, July 22, 2018, India
IOCBS 2018 ISBN: 978-81-934141-1-8 Rayder
65
Full Paper
[19] Kashinath Shastri Charak Samhita of Agnivesha with Vidyotini Hindi Commentry, Sutrasthan13/22 & 62-64.
12th Edition; Chaukhambha Sanskriti Sansthan, Varanasi 1984. Pg. No. 261 &/272
[20] http://www.britannica.com/science/lipid assessed on 25/04/2018.
[21] Kashinath Shastri Charak Samhita of Agnivesha with Vidyotini Hindi Commentry, Siddhisthan 9/88. 12th
Edition; Chaukhambha Sanskriti Sansthan, Varanasi 1984. Pg. No. 1070
[22] Kashinath Shastri Charak Samhita of Agnivesha with Vidyotini Hindi Commentry, Siddhisthan 1/12. 12 th
Edition; Chaukhambha Sanskriti Sansthan, Varanasi, 1984. Pg. No. 962
2nd International Online Conference on Biological Sciences, July 22, 2018, India
IOCBS 2018 ISBN: 978-81-934141-1-8 Rayder
66
Full Paper
Potentiality of mangrove associate species Porteresia coarctata (salt marsh
grass) in acting as an agent of phytoremediation
Shankhadeep Chakraborty1*, Sufia Zaman1 and Abhijit Mitra2
1Department of Oceanography, Techno India University, Salt Lake Campus, Kolkata 700091,
West Bengal, India 2Department of Marine Science, University of Calcutta, 35 B.C. Road, Kolkata-700019,
West Bengal, India
*Corresponding email: [email protected]
Abstract
Background: Pollution from heavy metal is one of the major problems in the modern civilizations. Among
all the solutions regarding this problem, phytoremediation can be regarded as one of the prime important
concept as it is cost-effective and eco-friendly approach. Indian Sundarbans estuarine area is one of the
World’s most productive ecosystems which in recent years, is facing great loss of its diversity due to
pollution from various sources. Among the plants adapted to this ecosystem, Porteresia coarctata (salt
marsh grass) is chosen in this study to test its potentiality towards bioremediation of heavy metals from its
ambient media.
Materials and methods: Concentrations of heavy metals (Zn, Cu, Pb, Hg, Fe and Cd) were determined in
salt marsh grass (Porteresia coarctata) tissue, ambient water and sediment during 3 seasons (premonsoon,
monsoon and postmonsoon) during 2017 in 3 locations in western sector of Indian Sundarbans mangrove
ecosystem. The determinations of heavy metal concentrations were done in Atomic Absorption
Spectrophotometer (Perkin elmer Model 3030).
Results: Mean values of heavy metal concentration were found to follow the order- Fe > Zn > Cu > Pb >
Cd > Hg in all the stations. Significant positive correlations were observed between tissue metal and
dissolved metal whereas, significant negative correlation were observed between tissue metal and
biologically available metals in the sediment.
Conclusion: Results clearly indicate the fact that this species can be a potential candidate for
phytoremediation of ambient water. More work in future on this topic is necessary to establish this fact.
The contamination history in the selected region points clearly that municipal and industrial sources are the
origin of these heavy metals.
Keywords: Porteresia coarctata, Indian Sundarbans, heavy metals, phytoremediation.
1. Introduction
Salt marshes are the most productive ecosystems and provide a buffer zone between terrestrial and aquatic
ecosystems [1]. Physico-chemical and biological interactions between freshwater and saltwater systems can
have significant influences on the transportation of trace and heavy metals in the estuarine environment [2].
Hence, salt marshes are excellent areas to study the pollution status of the coastal and estuarine systems
2nd International Online Conference on Biological Sciences, July 22, 2018, India
IOCBS 2018 ISBN: 978-81-934141-1-8 Rayder
67
Full Paper
because of their fine sediments with high organic content [3]. Salt marshes also act as protective filters and
repositories for runoff pollutants [4], pathogens and different types of nutrients [5]. Porteresia coarctata
(commonly known as saltmarsh grass) is widely distributed in the mud flats of Sundarbans and is a pioneer
species in the process of island ecological succession [6] [7].
2. Materials and methods
Station selection and sampling of selected species: Three stations were selected in and around the western
part of Indian Sundarbans namely Sagar island (21° 39' 04" N; 88° 01' 47" E), Jambu island (21°35'42.03"N;
88°10'22.76"E) and Frasergunj (21° 33′ 47.76″ N, 88° 15′ 33.98″ E). The species was collected at ebb
within 500 meter coastal stretch at three selected stations. The collected samples were brought to laboratory,
washed and dried with tissue paper and stored at -20°C for further analysis.
Collection and analysis of heavy metals in ambient water: Surface water samples were collected using
10-l teflon-lined Go-Flo bottles, fitted with teflon taps and deployed on a rosette or on Kevlar line, with
additional surface sampling carried out by hand. Shortly after collection, samples were filtered through
Nuclepore filters (0.4 μm pore diameter) and aliquots of the filters were acidified with sub-boiling distilled
nitric acid to a pH of about 2 and stored in cleaned low-density polyethylene bottles.
Dissolved heavy metals were separated and pre-concentrated from the seawater using dithiocarbamate
complexation and subsequent extraction into Freon TF, followed by back extraction into HNO3 as per the
standard procedure [8]. Extracts were analyzed for Zn, Cu and Pb by an atomic absorption
spectrophotometer (Perkin Elmer: Model 3030).
Collection and analysis of biologically available heavy metals in sediment: Sediment samples from
surface (1 cm depth) were collected by scrapping using a pre-cleaned and acid-washed plastic scale and
immediately kept in clean polythene bags, which were sealed. The samples were washed with metal-free
double-distilled water and dried in an oven at 105 °C for 5–6 h, freed from visible shells or shell fragments,
ground to powder in a mortar and stored in acid-washed polythene bags.
Analyses of biologically available metals were done after re-drying the samples, from which 1 g was taken
and digested with 0.5 (N) HCl as per the standard procedure [9]. The resulting solutions were then stored
in polythene containers for analysis. The solutions were finally aspirated in a flame atomic absorption
spectrophotometer (Perkin Elmer: Model 3030) for the determination of metal concentrations. No
detectable trace metals were found in the reagent blank.
Analysis of tissue Fe, Zn, Cu, Cd, Pb and Hg: 20 gm of tissue samples of the collected species were oven
dried separately at 105°C overnight to a constant weight. 1 gm of dried sample was digested with a mixture
of 10 ml nitric acid and perchloric acid (3:1) till a clear solution was obtained. The resulting solution was
made up to a constant volume with 0.05N nitric acid. Each sample was analysed for Fe, Zn, Cu, Cd, Pb and
Hg against standard concentration of each metal on a Perkin Elmer Atomic Absorption Spectrophotometer
(Model 3030) equipped with a HGA – 500 graphite furnace atomizer and a deuterium background corrector.
Blank correction was done to bring accuracy to the results.
Data analysis: SPSS 16.0 was used for determination of Pearson correlation co-efficient (r) in order to find
out the inter-relationship between tissue heavy metals and metals in the ambient water and also between
tissue metals and metals in the ambient sediment.
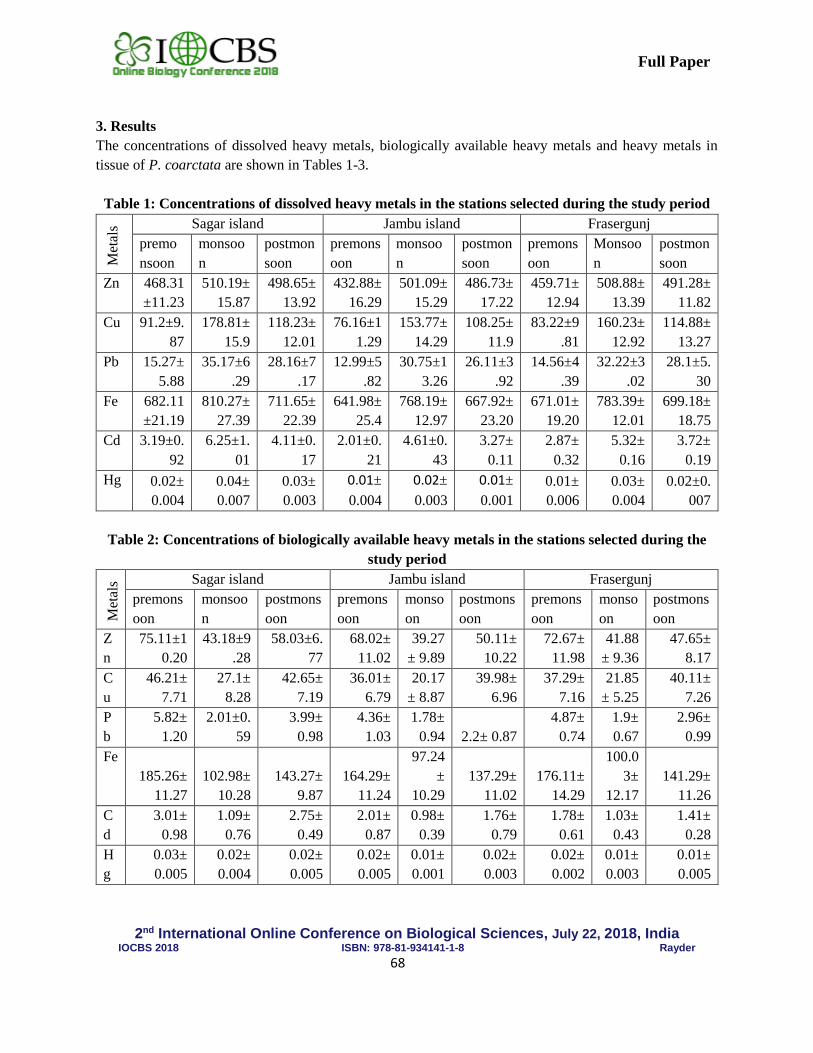
2nd International Online Conference on Biological Sciences, July 22, 2018, India
IOCBS 2018 ISBN: 978-81-934141-1-8 Rayder
68
Full Paper
3. Results
The concentrations of dissolved heavy metals, biologically available heavy metals and heavy metals in
tissue of P. coarctata are shown in Tables 1-3.
Table 1: Concentrations of dissolved heavy metals in the stations selected during the study period
Met
als Sagar island Jambu island Frasergunj
premo
nsoon
monsoo
n
postmon
soon
premons
oon
monsoo
n
postmon
soon
premons
oon
Monsoo
n
postmon
soon
Zn 468.31
±11.23
510.19±
15.87
498.65±
13.92
432.88±
16.29
501.09±
15.29
486.73±
17.22
459.71±
12.94
508.88±
13.39
491.28±
11.82
Cu 91.2±9.
87
178.81±
15.9
118.23±
12.01
76.16±1
1.29
153.77±
14.29
108.25±
11.9
83.22±9
.81
160.23±
12.92
114.88±
13.27
Pb 15.27±
5.88
35.17±6
.29
28.16±7
.17
12.99±5
.82
30.75±1
3.26
26.11±3
.92
14.56±4
.39
32.22±3
.02
28.1±5.
30
Fe 682.11
±21.19
810.27±
27.39
711.65±
22.39
641.98±
25.4
768.19±
12.97
667.92±
23.20
671.01±
19.20
783.39±
12.01
699.18±
18.75
Cd 3.19±0.
92
6.25±1.
01
4.11±0.
17
2.01±0.
21
4.61±0.
43
3.27±
0.11
2.87±
0.32
5.32±
0.16
3.72±
0.19
Hg 0.02±
0.004
0.04±
0.007
0.03±
0.003
0.01±
0.004
0.02±
0.003
0.01±
0.001
0.01±
0.006
0.03±
0.004
0.02±0.
007
Table 2: Concentrations of biologically available heavy metals in the stations selected during the
study period
Met
als Sagar island Jambu island Frasergunj
premons
oon
monsoo
n
postmons
oon
premons
oon
monso
on
postmons
oon
premons
oon
monso
on
postmons
oon
Z
n
75.11±1
0.20
43.18±9
.28
58.03±6.
77
68.02±
11.02
39.27
± 9.89
50.11±
10.22
72.67±
11.98
41.88
± 9.36
47.65±
8.17
C
u
46.21±
7.71
27.1±
8.28
42.65±
7.19
36.01±
6.79
20.17
± 8.87
39.98±
6.96
37.29±
7.16
21.85
± 5.25
40.11±
7.26
P
b
5.82±
1.20
2.01±0.
59
3.99±
0.98
4.36±
1.03
1.78±
0.94 2.2± 0.87
4.87±
0.74
1.9±
0.67
2.96±
0.99
Fe
185.26±
11.27
102.98±
10.28
143.27±
9.87
164.29±
11.24
97.24
±
10.29
137.29±
11.02
176.11±
14.29
100.0
3±
12.17
141.29±
11.26
C
d
3.01±
0.98
1.09±
0.76
2.75±
0.49
2.01±
0.87
0.98±
0.39
1.76±
0.79
1.78±
0.61
1.03±
0.43
1.41±
0.28
H
g
0.03±
0.005
0.02±
0.004
0.02±
0.005
0.02±
0.005
0.01±
0.001
0.02±
0.003
0.02±
0.002
0.01±
0.003
0.01±
0.005
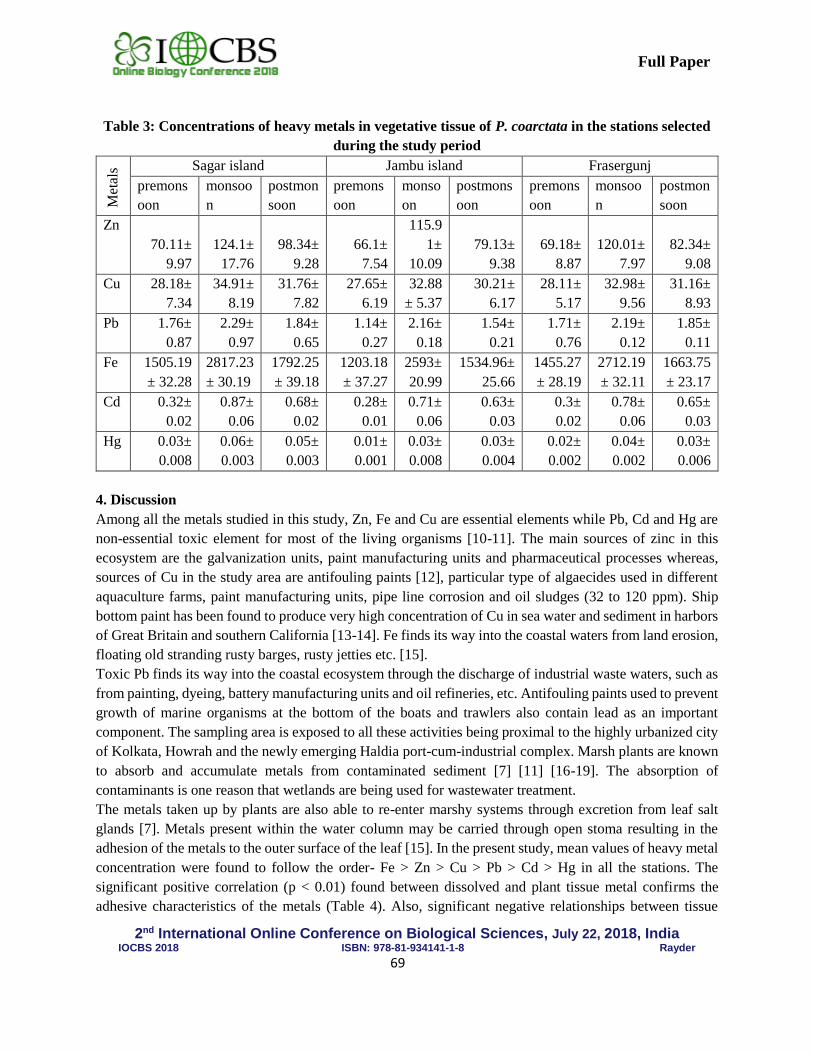
2nd International Online Conference on Biological Sciences, July 22, 2018, India
IOCBS 2018 ISBN: 978-81-934141-1-8 Rayder
69
Full Paper
Table 3: Concentrations of heavy metals in vegetative tissue of P. coarctata in the stations selected
during the study period
Met
als Sagar island Jambu island Frasergunj
premons
oon
monsoo
n
postmon
soon
premons
oon
monso
on
postmons
oon
premons
oon
monsoo
n
postmon
soon
Zn
70.11±
9.97
124.1±
17.76
98.34±
9.28
66.1±
7.54
115.9
1±
10.09
79.13±
9.38
69.18±
8.87
120.01±
7.97
82.34±
9.08
Cu 28.18±
7.34
34.91±
8.19
31.76±
7.82
27.65±
6.19
32.88
± 5.37
30.21±
6.17
28.11±
5.17
32.98±
9.56
31.16±
8.93
Pb 1.76±
0.87
2.29±
0.97
1.84±
0.65
1.14±
0.27
2.16±
0.18
1.54±
0.21
1.71±
0.76
2.19±
0.12
1.85±
0.11
Fe 1505.19
± 32.28
2817.23
± 30.19
1792.25
± 39.18
1203.18
± 37.27
2593±
20.99
1534.96±
25.66
1455.27
± 28.19
2712.19
± 32.11
1663.75
± 23.17
Cd 0.32±
0.02
0.87±
0.06
0.68±
0.02
0.28±
0.01
0.71±
0.06
0.63±
0.03
0.3±
0.02
0.78±
0.06
0.65±
0.03
Hg 0.03±
0.008
0.06±
0.003
0.05±
0.003
0.01±
0.001
0.03±
0.008
0.03±
0.004
0.02±
0.002
0.04±
0.002
0.03±
0.006
4. Discussion
Among all the metals studied in this study, Zn, Fe and Cu are essential elements while Pb, Cd and Hg are
non-essential toxic element for most of the living organisms [10-11]. The main sources of zinc in this
ecosystem are the galvanization units, paint manufacturing units and pharmaceutical processes whereas,
sources of Cu in the study area are antifouling paints [12], particular type of algaecides used in different
aquaculture farms, paint manufacturing units, pipe line corrosion and oil sludges (32 to 120 ppm). Ship
bottom paint has been found to produce very high concentration of Cu in sea water and sediment in harbors
of Great Britain and southern California [13-14]. Fe finds its way into the coastal waters from land erosion,
floating old stranding rusty barges, rusty jetties etc. [15].
Toxic Pb finds its way into the coastal ecosystem through the discharge of industrial waste waters, such as
from painting, dyeing, battery manufacturing units and oil refineries, etc. Antifouling paints used to prevent
growth of marine organisms at the bottom of the boats and trawlers also contain lead as an important
component. The sampling area is exposed to all these activities being proximal to the highly urbanized city
of Kolkata, Howrah and the newly emerging Haldia port-cum-industrial complex. Marsh plants are known
to absorb and accumulate metals from contaminated sediment [7] [11] [16-19]. The absorption of
contaminants is one reason that wetlands are being used for wastewater treatment.
The metals taken up by plants are also able to re-enter marshy systems through excretion from leaf salt
glands [7]. Metals present within the water column may be carried through open stoma resulting in the
adhesion of the metals to the outer surface of the leaf [15]. In the present study, mean values of heavy metal
concentration were found to follow the order- Fe > Zn > Cu > Pb > Cd > Hg in all the stations. The
significant positive correlation (p < 0.01) found between dissolved and plant tissue metal confirms the
adhesive characteristics of the metals (Table 4). Also, significant negative relationships between tissue
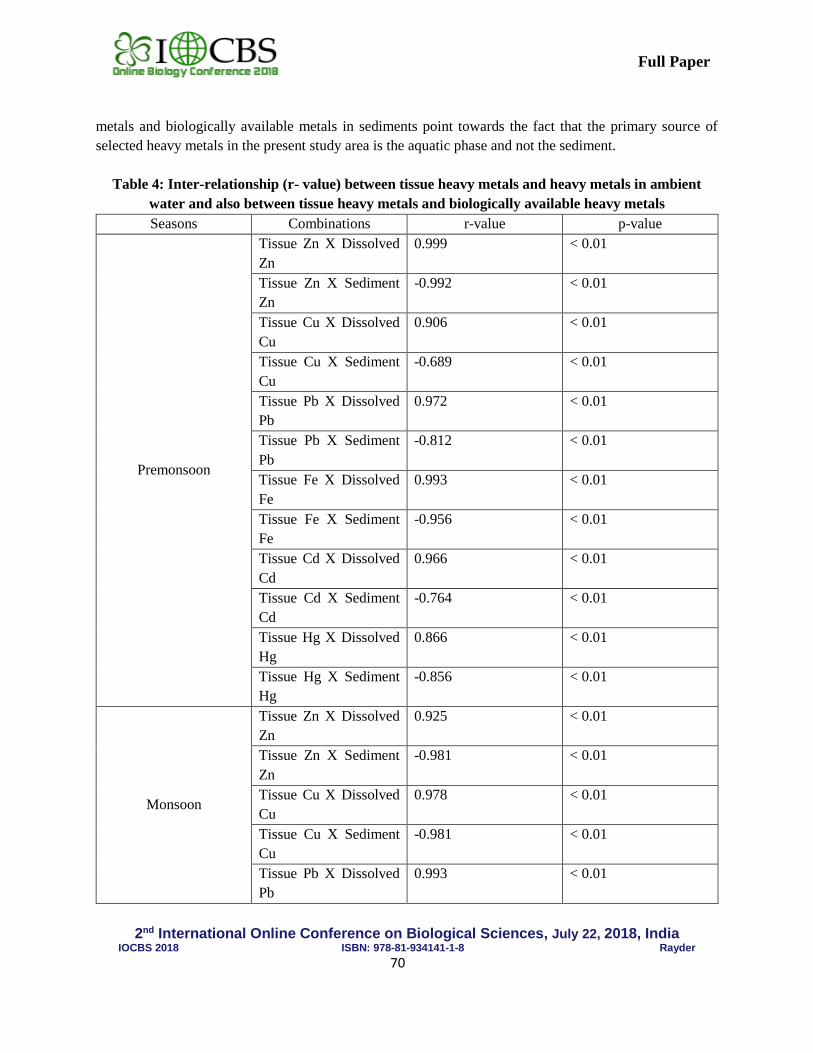
2nd International Online Conference on Biological Sciences, July 22, 2018, India
IOCBS 2018 ISBN: 978-81-934141-1-8 Rayder
70
Full Paper
metals and biologically available metals in sediments point towards the fact that the primary source of
selected heavy metals in the present study area is the aquatic phase and not the sediment.
Table 4: Inter-relationship (r- value) between tissue heavy metals and heavy metals in ambient
water and also between tissue heavy metals and biologically available heavy metals
Seasons Combinations r-value p-value
Premonsoon
Tissue Zn X Dissolved
Zn
0.999 < 0.01
Tissue Zn X Sediment
Zn
-0.992 < 0.01
Tissue Cu X Dissolved
Cu
0.906 < 0.01
Tissue Cu X Sediment
Cu
-0.689 < 0.01
Tissue Pb X Dissolved
Pb
0.972 < 0.01
Tissue Pb X Sediment
Pb
-0.812 < 0.01
Tissue Fe X Dissolved
Fe
0.993 < 0.01
Tissue Fe X Sediment
Fe
-0.956 < 0.01
Tissue Cd X Dissolved
Cd
0.966 < 0.01
Tissue Cd X Sediment
Cd
-0.764 < 0.01
Tissue Hg X Dissolved
Hg
0.866 < 0.01
Tissue Hg X Sediment
Hg
-0.856 < 0.01
Monsoon
Tissue Zn X Dissolved
Zn
0.925 < 0.01
Tissue Zn X Sediment
Zn
-0.981 < 0.01
Tissue Cu X Dissolved
Cu
0.978 < 0.01
Tissue Cu X Sediment
Cu
-0.981 < 0.01
Tissue Pb X Dissolved
Pb
0.993 < 0.01
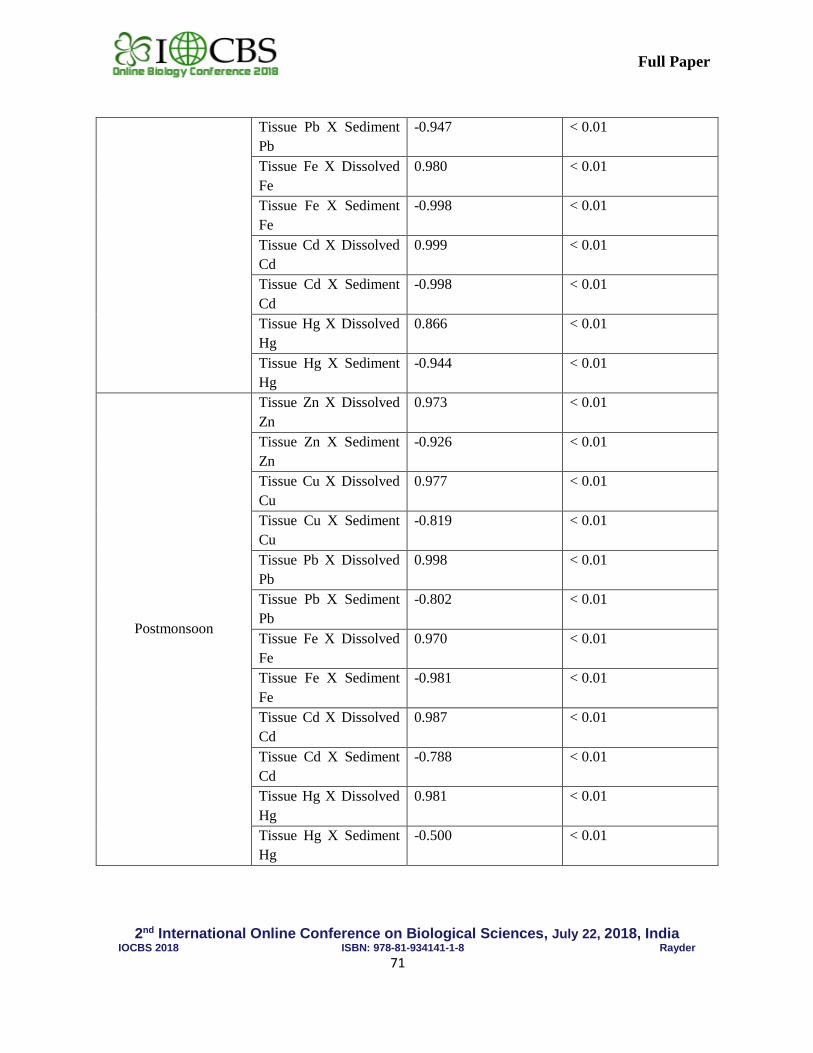
2nd International Online Conference on Biological Sciences, July 22, 2018, India
IOCBS 2018 ISBN: 978-81-934141-1-8 Rayder
71
Full Paper
Tissue Pb X Sediment
Pb
-0.947 < 0.01
Tissue Fe X Dissolved
Fe
0.980 < 0.01
Tissue Fe X Sediment
Fe
-0.998 < 0.01
Tissue Cd X Dissolved
Cd
0.999 < 0.01
Tissue Cd X Sediment
Cd
-0.998 < 0.01
Tissue Hg X Dissolved
Hg
0.866 < 0.01
Tissue Hg X Sediment
Hg
-0.944 < 0.01
Postmonsoon
Tissue Zn X Dissolved
Zn
0.973 < 0.01
Tissue Zn X Sediment
Zn
-0.926 < 0.01
Tissue Cu X Dissolved
Cu
0.977 < 0.01
Tissue Cu X Sediment
Cu
-0.819 < 0.01
Tissue Pb X Dissolved
Pb
0.998 < 0.01
Tissue Pb X Sediment
Pb
-0.802 < 0.01
Tissue Fe X Dissolved
Fe
0.970 < 0.01
Tissue Fe X Sediment
Fe
-0.981 < 0.01
Tissue Cd X Dissolved
Cd
0.987 < 0.01
Tissue Cd X Sediment
Cd
-0.788 < 0.01
Tissue Hg X Dissolved
Hg
0.981 < 0.01
Tissue Hg X Sediment
Hg
-0.500 < 0.01
2nd International Online Conference on Biological Sciences, July 22, 2018, India
IOCBS 2018 ISBN: 978-81-934141-1-8 Rayder
72
Full Paper
5. Conclusion
The importance of this study lies in the facts that- the salt marsh grass species P. coarctata can act as an
agent of bioremediation and can be utilized by coastal industries to biologically treat the effluents
contaminated with heavy metals (with a specific retention time, which has not been studied in the present
program). In the mudflats of Sundarbans, cattle from the adjacent island villages graze on P. coarctata.
Hence, marsh grass contaminated with heavy metals may accumulate in the body tissues of cattle, which
may be further transferred to human beings through their milk and meat.
References
[1] Rajendran N, Suwa Y, Urushigawa Y. Distribution of phosphor-lipid ester-linked fatty acid biomarkers
for bacteria in the sediment of Ise Bay, Japan. Marine Chemistry, 42: 39–56, 1993.
[2] Ip CCM, Li XD, Zhang G, Wai OWH, Li YS, Trace metal distribution in sediments of the Pearl River
Estuary and the surrounding coastal area, South China. Environmental Pollution, 147: 311–323, 2006.
[3] Ashraful MAK. Trace metals in littoral sediments from the North east coast of the Bay of Bengal along
the ship breaking area, Chittagong, Bangladesh. Journal of Biological Science, 3: 1050–1057, 2003.
[4] Williams TP, Bubb JM, Lester JN. Metal accumulation within salt marsh environments: A review.
Marine Pollution Bulletin, 38: 277–90, 1994.
[5] Weis JS, Weis P. Metal uptake, transport and release by wetland plants: implications for phytoreme-
diation and restoration. Environment International, 30: 685–700, 2003.
[6] Jagtap TG, Bhosale S, Singh C. Characterization of Porteresia coarctata beds along the Goa coast, India.
Aquatic Botany. 84: 37–44, 2006.
[7] Sanders JG, Osman RW. Arsenic incorporation in a saltmarsh ecosystem. Estuarine and Coastal Shelf
Science, 20: 387–392, 1985.
[8] Danielsson LG, Magnusson B, Westerlund S. An improved metal extraction procedure for the
determination of trace metals in seawater by atomic absorption spectrometry with electrothermal
atomization. Analytical Chemical Acta. 98: 45–57, 1978.
[9] Malo BA. Partial extraction of metals from aquatic sediments. Environmental Science and Technology.
11: 277–288, 1977.
[10] Trieff RA. Environment and health. Ann Arbor Science Publishers Inc. The Butterworth Group, 1980.
[11] Giblin AE, Bourg A, Valiela I, et al. Uptake and losses of heavy metals in sewage sludge by a New
England saltmarsh. American Journal of Botany. 67, 1059–1068, 1980.
[12] Goldberg ED. The mussel watch – A first step in global marine monitoring. Marine Pollution Bulletin,
6: 111, 1975.
[13] Bellinger E, Benhem B. The levels of metals in dockyard sediments with particular reference to the
contributions from ship bottom paints. Environmental Pollution Assessment. 15(1): 71–81, 1978.
[14] Young DR, Alexander GV, McDermott-Ehrlich D. Vessel related contamination of southern California
harbours by copper and other metals. Marine Pollution Bulletin. 10: 50–56, 1979.
[15] Mitra, A. Status of coastal pollution in West Bengal with special reference to heavy metals. Journal of
Indian Ocean Studies, 1998, 5 (2), 135 –138, 1998.
[16] Kraus ML. Accumulation and excretion of five heavy metals by the saltmarsh cordgrass Spartina
alterniflora. Bulletin of the New Jersey Academy of Sciences, 33: 39–43, 1988.
[17] Kraus ML, Weis P, Crow JH. The excretion of heavy metals by the salt marsh cord grass, Spartina
alterniflora and Spartina’s role in mercury cycling. Marine Environmental Research, 20: 307–316, 1986.

2nd International Online Conference on Biological Sciences, July 22, 2018, India
IOCBS 2018 ISBN: 978-81-934141-1-8 Rayder
73
Full Paper
[18] Mitra A. Sensitivity of Mangrove Ecosystem to Changing Climate. New Delhi: Springer India: Imprint:
Springer. 2013.
[19] Teal JM, Howes BL. Salt marsh values; retrospection from the end of the century. In: Weinstain MP,
Kreeger DA (ed.): Concepts and Controversies in Tidal Marsh Ecology. Kluwer Academic Publishers,
Dordrecht, 3–7, 2000.
2nd International Online Conference on Biological Sciences, July 22, 2018, India
IOCBS 2018 ISBN: 978-81-934141-1-8 Rayder
74
Full Paper
Traditional knowledge and biodiversity of ethnomedicinal plants used by the
ethnic tribal people of Tripura, North East India
Anupam Guha*, Sukla Chowdhury and Kakali Noatia
Department of Botany, Women’s College, Agartala, Tripura
*Corresponding author: [email protected]
Abstract
Background: The importance of the traditional knowledge of ethnic tribal people using plants for
treatments of diseases has become very significant for future benefit of the human society.
Materials and Methods: A field survey was conducted among the ethnic tribal locality of different districts
of Tripura, India during the year 2014-17. The local practitioners and aged persons of different community
were consulted during the survey period.
Results: The survey revealed about the use of more than 62 plant species in several combination for the
treatments of different diseases in the area. Several medicinal plants have been assessed as endangered,
vulnerable and threatened due to over harvesting or unskilful harvesting in wild habitat. Habitat destruction
in the form of deforestation is an added danger.
Conclusion: Now these valuable bio-resources of the area need to be conserved and people should be
trained in good harvest practice and post-harvest technology, otherwise, the resources will extinct gradually
in future.
Keywords: Traditional knowledge, Ethnic people, Ethnomedicin, Conservation.
1. Introduction
The use of plants as a source of medicines has become an important component of present
healthcare system in developing countries like India. The exploration of the traditional knowledge of ethnic
people using different plants for treatment of diseases is very important and also very significant at present
time for future benefit of the society. Protection, preservation and cultivation of the valuable medicinal
plants are now creating a new dimension not only in the field of Ethnobotany but also in Agriculture.
According to World Health Organisation (WHO) over 45,000 plant species in India have medicinal values
and more than 70% of the Indian rural population used traditional medicine for primary healthcare system
that come from the biological resources [1]. The North-east India is a part of foot hills of Himalayas and
Indo-Burma “Biodiversity hot spot” in the world supporting about 50% of India’s biodiversity and 40% of
the flowering plants in this region are endemic [2].
Tripura is third smallest hilly state of India, lies between 22056′ to 24032′N latitude and between
90009′to 92020′E longitudes covering an area of 10,491 sq. Km and inhabited by the Tribal of Tibeto-
Burman stock with as many as 19 different tribal communities [3]. This state is sub divided into 8 districts
namely: North Tripura, West Tripura, South Tripura, Dhalai, Khowai, Unakoti, Sipahijala and Gomati. The
climate of this state is characterized by intermediate temperature and highly humid atmosphere. During
2nd International Online Conference on Biological Sciences, July 22, 2018, India
IOCBS 2018 ISBN: 978-81-934141-1-8 Rayder
75
Full Paper
summer (April-May), maximum temperature reaches 380C with relative humidity ranging from 50-75%
while during monsoon it remains over 85%. The ethological diversity of this state reflects not only the
sociological and cultural aspects but also reveals unique traditional food habit and rural-herbal therapy [4].
Many of these ethno-botanical species and their traditional knowledge of uses associated with health care
system are to be explored scientifically. Several ethno-botanical studies in this state have documented with
folk recipes [5]. A number of workers in the North Eastern Region of India have studied about the medicinal
plants [6-9]. A total of 85 plants belonging to 49 families have been reported to therapeutic use against skin
diseases and as herbal care [10,11] have already been recorded 57 medicinal plants species belonging to
45 genera and 36 families in different states of North Eastern regions. More than 67 medicinal plants
belonging to 27 families have been reported to use against various illnesses by the different tribes in Cachar
district of Assam [12]. Several rare and endangered medicinal plants have been reported by the local healers
from this region which is being destroyed by the people due to the lack of proper knowledge about the
medicinal properties. Hence, the present survey and investigation has been formulated to identify and
document the ethnomedicinal plants used by different ethnic community people of Tripura.
2. Materials and Methods
Study Area
Exhaustive field survey has been undertaken in different villages of Tripura covering all the
seasons, specially, in the month of January to May of the year 2014 – 17 for gathering information on each
and every species specially the less known medicinal plants used meticulously by ethnic community people
of Tripura and also useful in herbal medicine among them. The information’s on medico-botanical aspects
was collected by questionnaires to the traditional practioners, Kavirajs, Maibas and elderly people of
different ethnic people of this state. The plants were collected from the study area, dried, preserved and
identified consulting authentic floristic literatures like Flora of Tripura [13], Flora of Assam [14] and Flora
of British-India [15]. Finally, voucher specimen was prepared following conventional methods [16]
deposited in the departmental herbarium.
3. Results
During this survey a total of 62 plants species belonging to 58 genera and 44 families were recorded
as traditional medicinal plants used by the ethnic tribal people of Tripura. These plants are also used by the
people in various ways such as medicinal, edible, ornamental, building materials and other miscellaneous
purposes in their daily life. The collected plant species were provided with an up to date nomenclature,
family, vernacular name, parts used and traditional uses against different ailments were recorded (Tables-
1).
The highest number of plant species belonging to the family Solanaceae is used as traditional
medicine and followed by Rubiaceae, Euphorbiaceae, Apocynaceae and Lamiaceae for medicinal purposes.
There are several important and rare medicinal plant species which are used by the local healers to treat
various illnesses. Ipomea mauritiana Jacq. is used against blood pressure, liver and stomach problems.
Garcinia cowa Roxb. Ex DC.and G. pedunculata Roxb. are used against dysentery, jaundice, and stomach
problems. Oroxylum indicum (L) Vent. is used against fever, caught, dysentery and join pain. Plumbago
zeylanica L. is used against cuts and wound and also making beer. The seeds of Alpinia nigra (Gaerth) is
used against caught and bronchitis. Boerhavia diffusa L. is use against asthma, jaundice, piles and
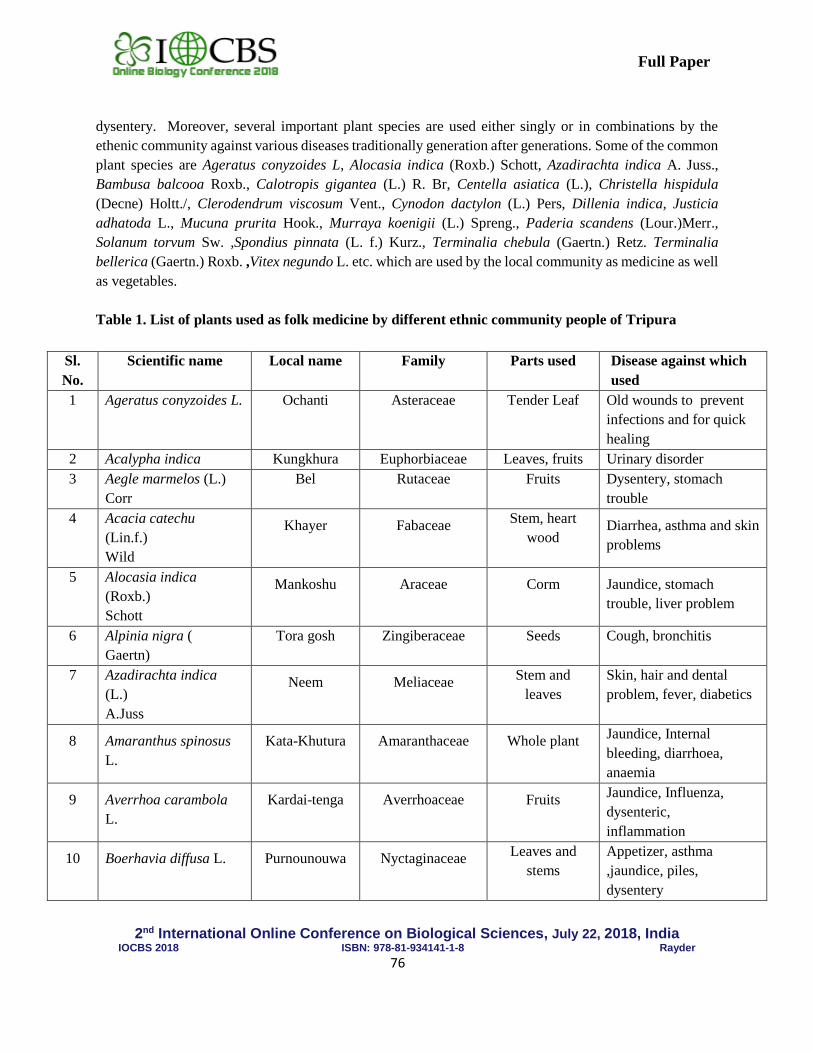
2nd International Online Conference on Biological Sciences, July 22, 2018, India
IOCBS 2018 ISBN: 978-81-934141-1-8 Rayder
76
Full Paper
dysentery. Moreover, several important plant species are used either singly or in combinations by the
ethenic community against various diseases traditionally generation after generations. Some of the common
plant species are Ageratus conyzoides L, Alocasia indica (Roxb.) Schott, Azadirachta indica A. Juss.,
Bambusa balcooa Roxb., Calotropis gigantea (L.) R. Br, Centella asiatica (L.), Christella hispidula
(Decne) Holtt./, Clerodendrum viscosum Vent., Cynodon dactylon (L.) Pers, Dillenia indica, Justicia
adhatoda L., Mucuna prurita Hook., Murraya koenigii (L.) Spreng., Paderia scandens (Lour.)Merr.,
Solanum torvum Sw. ,Spondius pinnata (L. f.) Kurz., Terminalia chebula (Gaertn.) Retz. Terminalia
bellerica (Gaertn.) Roxb. ,Vitex negundo L. etc. which are used by the local community as medicine as well
as vegetables.
Table 1. List of plants used as folk medicine by different ethnic community people of Tripura
Sl.
No.
Scientific name Local name Family Parts used Disease against which
used
1 Ageratus conyzoides L. Ochanti
Asteraceae
Tender Leaf Old wounds to prevent
infections and for quick
healing
2 Acalypha indica Kungkhura Euphorbiaceae Leaves, fruits Urinary disorder
3 Aegle marmelos (L.)
Corr
Bel Rutaceae Fruits Dysentery, stomach
trouble
4 Acacia catechu
(Lin.f.)
Wild
Khayer Fabaceae Stem, heart
wood Diarrhea, asthma and skin
problems
5 Alocasia indica
(Roxb.)
Schott
Mankoshu Araceae Corm Jaundice, stomach
trouble, liver problem
6 Alpinia nigra (
Gaertn)
Tora gosh Zingiberaceae Seeds Cough, bronchitis
7 Azadirachta indica
(L.)
A.Juss
Neem Meliaceae Stem and
leaves
Skin, hair and dental
problem, fever, diabetics
8 Amaranthus spinosus
L.
Kata-Khutura Amaranthaceae Whole plant Jaundice, Internal
bleeding, diarrhoea,
anaemia
9 Averrhoa carambola
L.
Kardai-tenga Averrhoaceae Fruits Jaundice, Influenza,
dysenteric,
inflammation
10 Boerhavia diffusa L. Purnounouwa Nyctaginaceae Leaves and
stems
Appetizer, asthma
,jaundice, piles,
dysentery
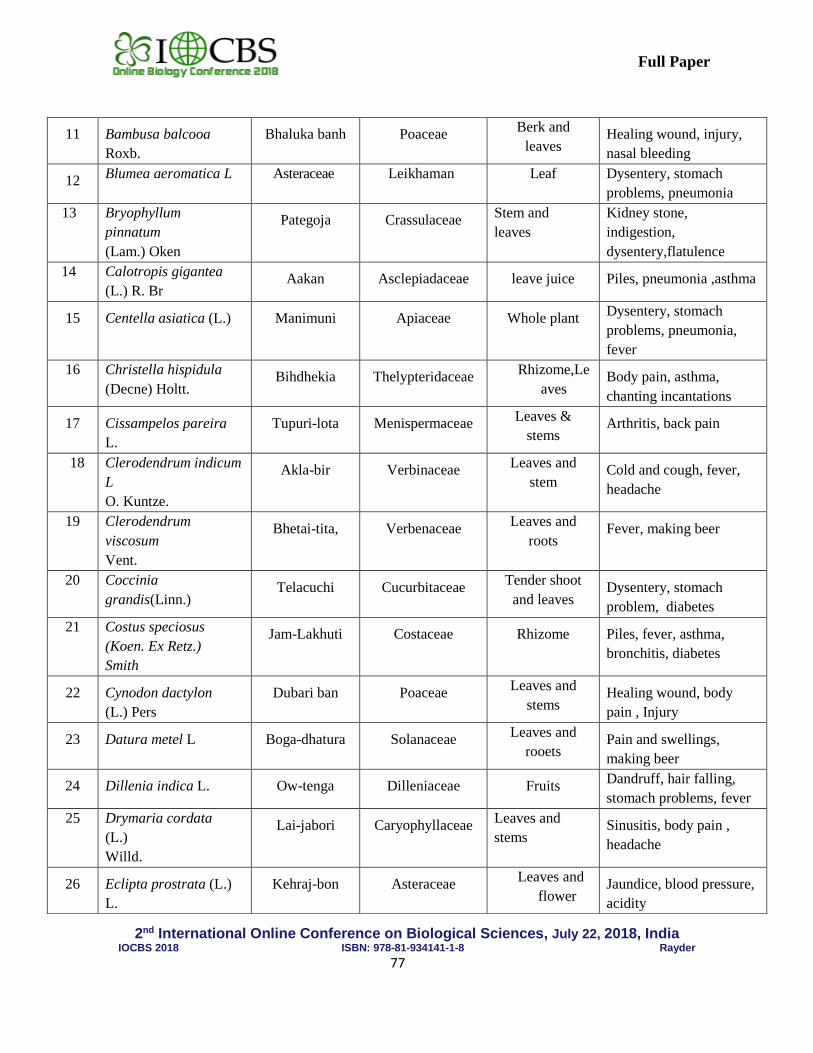
2nd International Online Conference on Biological Sciences, July 22, 2018, India
IOCBS 2018 ISBN: 978-81-934141-1-8 Rayder
77
Full Paper
11 Bambusa balcooa
Roxb.
Bhaluka banh Poaceae Berk and
leaves Healing wound, injury,
nasal bleeding
12 Blumea aeromatica L Asteraceae
Leikhaman Leaf Dysentery, stomach
problems, pneumonia
13 Bryophyllum
pinnatum
(Lam.) Oken
Pategoja Crassulaceae Stem and
leaves
Kidney stone,
indigestion,
dysentery,flatulence
14 Calotropis gigantea
(L.) R. Br Aakan Asclepiadaceae leave juice Piles, pneumonia ,asthma
15 Centella asiatica (L.) Manimuni Apiaceae Whole plant Dysentery, stomach
problems, pneumonia,
fever
16 Christella hispidula
(Decne) Holtt. Bihdhekia Thelypteridaceae
Rhizome,Le
aves Body pain, asthma,
chanting incantations
17 Cissampelos pareira
L.
Tupuri-lota Menispermaceae Leaves &
stems Arthritis, back pain
18 Clerodendrum indicum
L
O. Kuntze.
Akla-bir Verbinaceae Leaves and
stem Cold and cough, fever,
headache
19 Clerodendrum
viscosum
Vent.
Bhetai-tita, Verbenaceae Leaves and
roots Fever, making beer
20 Coccinia
grandis(Linn.) Telacuchi Cucurbitaceae
Tender shoot
and leaves Dysentery, stomach
problem, diabetes
21 Costus speciosus
(Koen. Ex Retz.)
Smith
Jam-Lakhuti Costaceae Rhizome Piles, fever, asthma,
bronchitis, diabetes
22 Cynodon dactylon
(L.) Pers
Dubari ban Poaceae Leaves and
stems Healing wound, body
pain , Injury
23 Datura metel L Boga-dhatura Solanaceae Leaves and
rooets Pain and swellings,
making beer
24 Dillenia indica L. Ow-tenga Dilleniaceae Fruits Dandruff, hair falling,
stomach problems, fever
25 Drymaria cordata
(L.)
Willd.
Lai-jabori Caryophyllaceae Leaves and
stems Sinusitis, body pain ,
headache
26 Eclipta prostrata (L.)
L.
Kehraj-bon Asteraceae Leaves and
flower Jaundice, blood pressure,
acidity
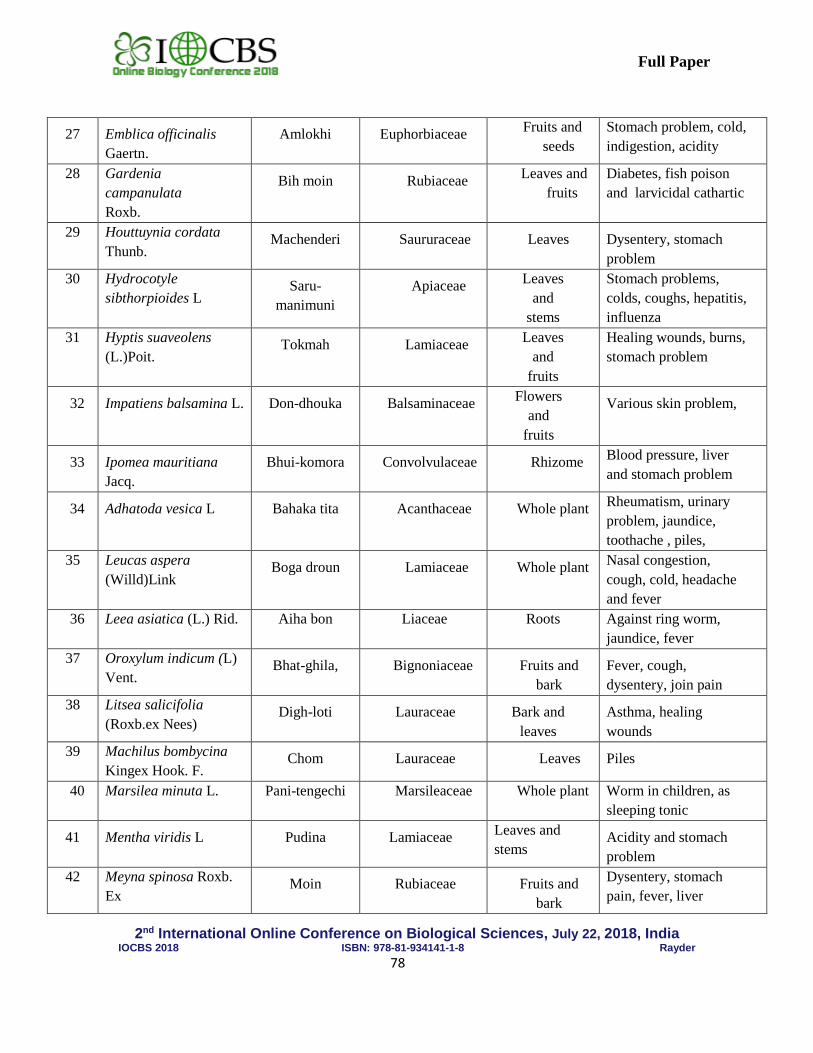
2nd International Online Conference on Biological Sciences, July 22, 2018, India
IOCBS 2018 ISBN: 978-81-934141-1-8 Rayder
78
Full Paper
27 Emblica officinalis
Gaertn.
Amlokhi Euphorbiaceae Fruits and
seeds
Stomach problem, cold,
indigestion, acidity
28 Gardenia
campanulata
Roxb.
Bih moin Rubiaceae Leaves and
fruits
Diabetes, fish poison
and larvicidal cathartic
29 Houttuynia cordata
Thunb. Machenderi Saururaceae Leaves Dysentery, stomach
problem
30 Hydrocotyle
sibthorpioides L Saru-
manimuni
Apiaceae Leaves
and
stems
Stomach problems,
colds, coughs, hepatitis,
influenza
31 Hyptis suaveolens
(L.)Poit. Tokmah Lamiaceae
Leaves
and
fruits
Healing wounds, burns,
stomach problem
32 Impatiens balsamina L. Don-dhouka Balsaminaceae Flowers
and
fruits
Various skin problem,
33 Ipomea mauritiana
Jacq.
Bhui-komora Convolvulaceae Rhizome Blood pressure, liver
and stomach problem
34 Adhatoda vesica L Bahaka tita Acanthaceae Whole plant Rheumatism, urinary
problem, jaundice,
toothache , piles,
35 Leucas aspera
(Willd)Link Boga droun Lamiaceae Whole plant
Nasal congestion,
cough, cold, headache
and fever
36 Leea asiatica (L.) Rid. Aiha bon Liaceae Roots Against ring worm,
jaundice, fever
37 Oroxylum indicum (L)
Vent. Bhat-ghila, Bignoniaceae Fruits and
bark
Fever, cough,
dysentery, join pain
38 Litsea salicifolia
(Roxb.ex Nees) Digh-loti Lauraceae Bark and
leaves
Asthma, healing
wounds
39 Machilus bombycina
Kingex Hook. F. Chom Lauraceae Leaves Piles
40 Marsilea minuta L. Pani-tengechi Marsileaceae Whole plant Worm in children, as
sleeping tonic
41 Mentha viridis L Pudina Lamiaceae Leaves and
stems Acidity and stomach
problem
42 Meyna spinosa Roxb.
Ex Moin Rubiaceae Fruits and
bark
Dysentery, stomach
pain, fever, liver
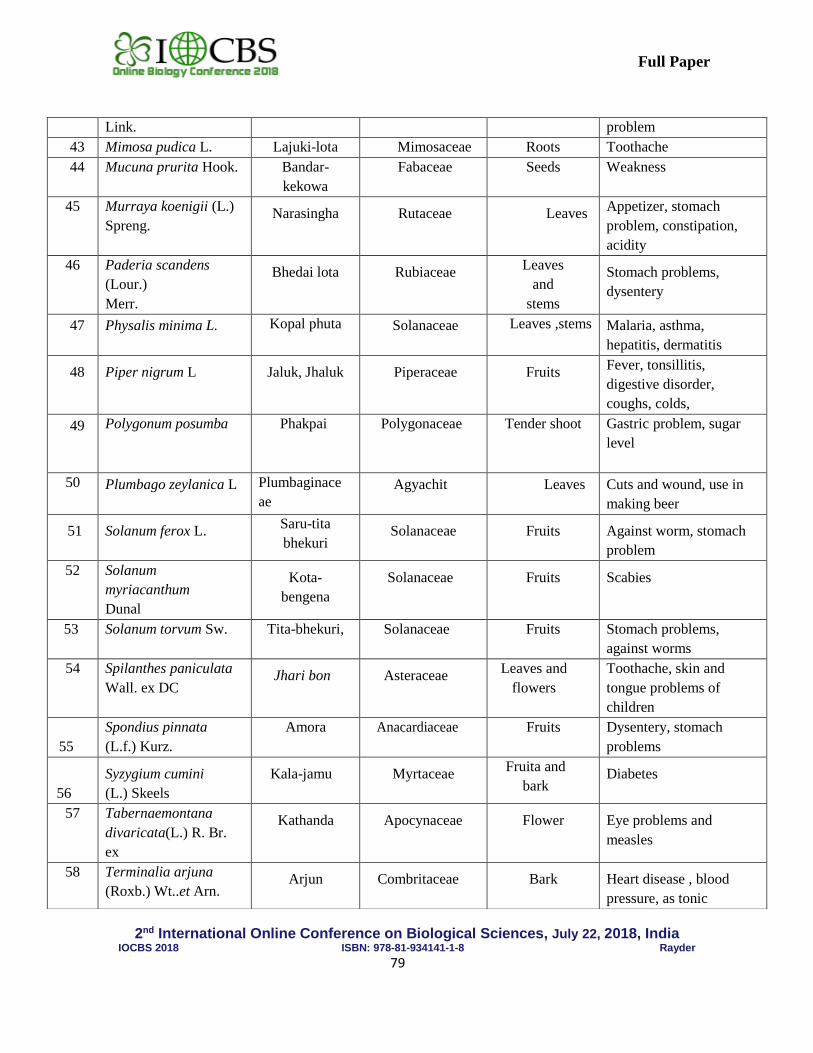
2nd International Online Conference on Biological Sciences, July 22, 2018, India
IOCBS 2018 ISBN: 978-81-934141-1-8 Rayder
79
Full Paper
Link. problem
43 Mimosa pudica L. Lajuki-lota Mimosaceae Roots Toothache
44 Mucuna prurita Hook. Bandar-
kekowa
Fabaceae Seeds Weakness
45 Murraya koenigii (L.)
Spreng. Narasingha Rutaceae Leaves
Appetizer, stomach
problem, constipation,
acidity
46 Paderia scandens
(Lour.)
Merr.
Bhedai lota Rubiaceae Leaves
and
stems
Stomach problems,
dysentery
47 Physalis minima L. Kopal phuta Solanaceae Leaves ,stems Malaria, asthma,
hepatitis, dermatitis
48 Piper nigrum L Jaluk, Jhaluk Piperaceae Fruits Fever, tonsillitis,
digestive disorder,
coughs, colds,
49 Polygonum posumba Phakpai Polygonaceae Tender shoot
Gastric problem, sugar
level
50 Plumbago zeylanica L Plumbaginace
ae
Agyachit Leaves Cuts and wound, use in
making beer
51 Solanum ferox L. Saru-tita
bhekuri Solanaceae Fruits Against worm, stomach
problem
52 Solanum
myriacanthum
Dunal
Kota-
bengena
Solanaceae Fruits Scabies
53 Solanum torvum Sw. Tita-bhekuri, Solanaceae Fruits Stomach problems,
against worms
54 Spilanthes paniculata
Wall. ex DC Jhari bon Asteraceae
Leaves and
flowers
Toothache, skin and
tongue problems of
children
55
Spondius pinnata
(L.f.) Kurz.
Amora Anacardiaceae Fruits Dysentery, stomach
problems
56
Syzygium cumini
(L.) Skeels
Kala-jamu Myrtaceae Fruita and
bark Diabetes
57 Tabernaemontana
divaricata(L.) R. Br.
ex
Kathanda Apocynaceae Flower Eye problems and
measles
58 Terminalia arjuna
(Roxb.) Wt..et Arn. Arjun Combritaceae Bark Heart disease , blood
pressure, as tonic
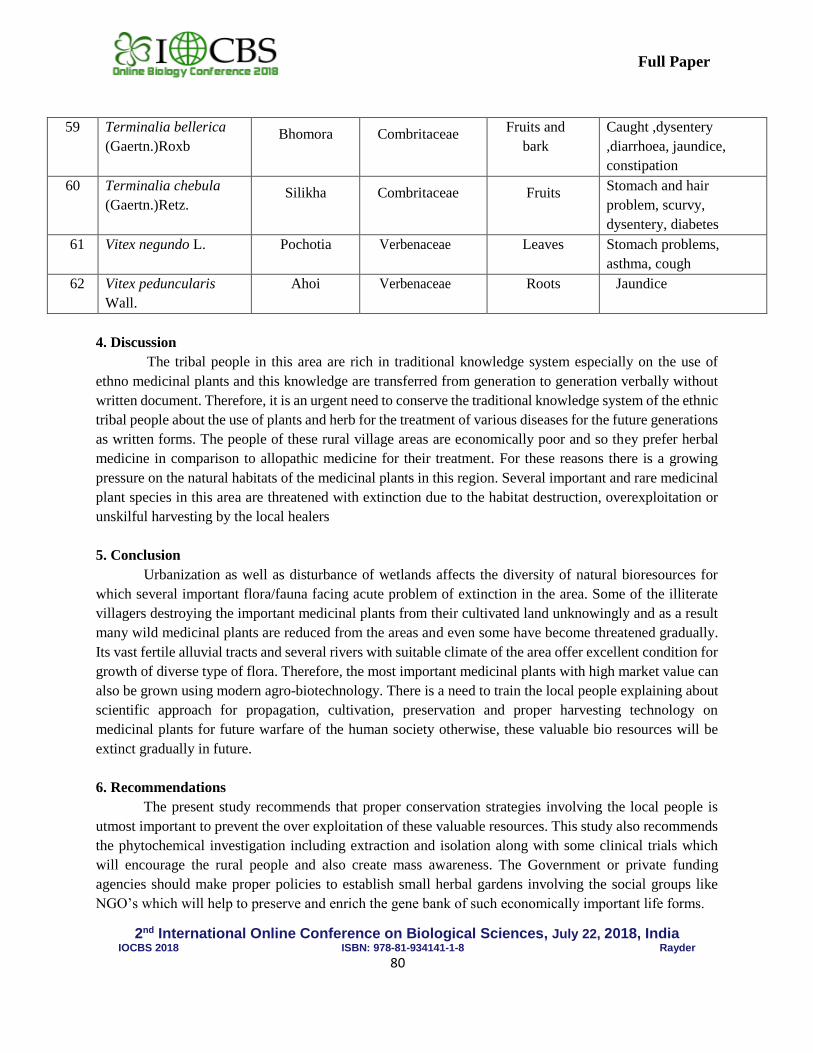
2nd International Online Conference on Biological Sciences, July 22, 2018, India
IOCBS 2018 ISBN: 978-81-934141-1-8 Rayder
80
Full Paper
4. Discussion
The tribal people in this area are rich in traditional knowledge system especially on the use of
ethno medicinal plants and this knowledge are transferred from generation to generation verbally without
written document. Therefore, it is an urgent need to conserve the traditional knowledge system of the ethnic
tribal people about the use of plants and herb for the treatment of various diseases for the future generations
as written forms. The people of these rural village areas are economically poor and so they prefer herbal
medicine in comparison to allopathic medicine for their treatment. For these reasons there is a growing
pressure on the natural habitats of the medicinal plants in this region. Several important and rare medicinal
plant species in this area are threatened with extinction due to the habitat destruction, overexploitation or
unskilful harvesting by the local healers
5. Conclusion
Urbanization as well as disturbance of wetlands affects the diversity of natural bioresources for
which several important flora/fauna facing acute problem of extinction in the area. Some of the illiterate
villagers destroying the important medicinal plants from their cultivated land unknowingly and as a result
many wild medicinal plants are reduced from the areas and even some have become threatened gradually.
Its vast fertile alluvial tracts and several rivers with suitable climate of the area offer excellent condition for
growth of diverse type of flora. Therefore, the most important medicinal plants with high market value can
also be grown using modern agro-biotechnology. There is a need to train the local people explaining about
scientific approach for propagation, cultivation, preservation and proper harvesting technology on
medicinal plants for future warfare of the human society otherwise, these valuable bio resources will be
extinct gradually in future.
6. Recommendations
The present study recommends that proper conservation strategies involving the local people is
utmost important to prevent the over exploitation of these valuable resources. This study also recommends
the phytochemical investigation including extraction and isolation along with some clinical trials which
will encourage the rural people and also create mass awareness. The Government or private funding
agencies should make proper policies to establish small herbal gardens involving the social groups like
NGO’s which will help to preserve and enrich the gene bank of such economically important life forms.
59 Terminalia bellerica
(Gaertn.)Roxb Bhomora Combritaceae
Fruits and
bark
Caught ,dysentery
,diarrhoea, jaundice,
constipation
60 Terminalia chebula
(Gaertn.)Retz. Silikha Combritaceae Fruits
Stomach and hair
problem, scurvy,
dysentery, diabetes
61 Vitex negundo L. Pochotia Verbenaceae Leaves Stomach problems,
asthma, cough
62 Vitex peduncularis
Wall.
Ahoi Verbenaceae Roots Jaundice
2nd International Online Conference on Biological Sciences, July 22, 2018, India
IOCBS 2018 ISBN: 978-81-934141-1-8 Rayder
81
Full Paper
Acknowledgement
Authors are greatly thankful to Dr. Nalini Kanta Chakraborty, Retired Professor, Department of
Botany, M. B. B. College, Agartala for identification and authentication of the plant materials and valuable
suggestions during the work. Special thanks are also extended to all the local practitioners and aged persons
of different ethnic community peoples for their active participation and knowledge sharing during the field
investigation.
References
[1] Ved DK, Goraya GS. Demand and Supply of Medicinal Plants in India. A Report of National Medicinal
Plant Board; Department of Ayush; New Delhi & FRLHT, Bangalore, India; 2008.
[2] Mao AA, Hanniewata TM, Sanjappa M. Plant Wealth of Northeast India with reference to Ethnobotany. Indian
Journal of Traditional Knowledge; 8(1):96-103; 2009.
[3] Deb Varman SBK. The Tribals of Tripura a dissertation. Spl. Series-1, Directorate of
Research Publication,Government of Tripura, Agartala, India;.p.113;1986.
[4] Mukharjee, PK. Proceedings of Inter. conf. on Promotion and Development of Botanicals; 2005.
[5] Deb, DB. Medicinal Plants of Tripura State. Indian Forester; 94 (10): 753-765; 1968.
[6] Borthakur, SK. Less known Traditional Medicinal Plants among the tribes of Karbi Anglong (Mikir Hills),
Assam: Bulletin of Botanical Survey of India; 18 (1-4), 166-171;1976.
[7] Begum SF, Gogai R. Herbal Recipe Prepared during Bohag and Rongali Bihu in Assam: Indian Journal of
Traditional Knowledge; 6(3): 417-422; 2006.
[8] Khanikar G. Sahaj LBDG. Puthitirtha Publications, Assam; 2010.
[9] Saikia AP, Ryakala VK, Sharma P, Goswami P and Bora U.Ethnobotany of medicinal plants used by Assamese
people for various skin ailments and cosmetics. Journal of Ethnopharmacology; 106: 149-57; 2006.
[10] Das R. Use of Plants and Herbs as Traditional Medicine by the People Inhabiting Around the Manas National
Park of Assam, North East India. Natural Products; Recent Advances; Proceeeding Volume of International
Seminar, Organized by Amity University, Noida; 310-317; 2014.
[11] Das AK, Dutta BK and Sharma GD. Medicinal Plants used by different tribes of Cachar District, Assam.
Indian Journal of Traditional Knowledge; 7 (3): 445-454; 2008.
[12] Das S, Khan ML, Rabha A, Bhattacharya D. Ethnomedicinal Plants of Manas National Park, Assam, North
East India. Indian Journal of Traditional Knowledge; 8(4):514-517; 2008.
[13] Deb, DB. The Flora of Tripura State. Today and Tomorrows Printers and Publishers;
New Delhi; 1983.
[14] Kangilal, PC., Dev, RN. Flora of Assam. Omsons Publ.; New Delhi.p.113; 1939.
[15] Hooker, JD. The Flora of British India, SIC, L. Reeve & Co., London; 3: 260-270; 1882.
[16] Jain, SK. and Rao, RR. A handbook of field and herbarium methods. Today and Tomorrow printers and
publishers, New Delhi; 1977.
2nd International Online Conference on Biological Sciences, July 22, 2018, India
IOCBS 2018 ISBN: 978-81-934141-1-8 Rayder
82
Full Paper
Anthelmintic activity of leaves of Sophora interrputa Bedd
B. Kavitha 1*, N. Nirmala1
1Department of Botany, Rayalaseema University, Kurnool, Andhra Pradesh - 518007, India.
*Corresponding email: [email protected]
Abstract
Background: The pathogenic infection causes the severe effect of mortality and other problems that were
uncontrolled due to the anthelmintic resistance that is developed in the host organism. Because of limited
availability of modern medicines most of the world’s population depends to a greater extent on traditional
medicines.
Materials and Methods: The literature survey reveals that Sophora interrupta is used to treat various types
of gastrointestinal problems. Therefore an attempt has been made to evaluate anthelmintic activity of leaves
on adult earthworm Pheretima posthuma.
Results: Sophora interrupta leaves were extracted with aqueous, acetone, alcohol, benzene, chloroform,
ethyl acetate, methanol and petroleum ether for their anthelmintic activity and Albendazole was used as
reference standard and distilled water as control. Results were expressed in terms of time for paralysis and
time for death of worms. Methanol extracts at 10 mg (2.50±0.32) was more effective followed by ethyl
acetate and aqueous extracts and all most all the extracts showed better activity than the standard drug in
taking less time for the paralysis and death of the earth worms.
Conclusion: The results of the present study clearly indicated that the plant possesses significant
anthelmintic activity at 10 mg/ml concentration measured by time taken for paralysis and death of the
worms as compared to standard reference drug.
Keywords: Pheretima posthuma, Sophora interrputa, Albendazole, Leaves, Anthelmintic.
1. Introduction
Helminthic infestations are now being recognized as a cause of chronic ill health and sluggishness
amongst the children. More than half of the population in the world suffers from worm infestations of one
or the other. Helminthes also affect domestic animals and livestock causing considerable economic loss.
[1]. Anthelmintics are a group of anti-parasitic drugs which act locally to expel worms from the
gastrointestinal tract or systemically to eradicate adult helminthes or development forms without causing
significant damage to the host [2]. Anthelmintics from the natural sources may play a key role in the
treatment of these parasite infections [3]. Traditional system of medicine reports the efficacy of several
natural products eliminating helminthes.
There are approximately 219 species in genus Sophora. Sophora interrputa Bedd. commonly called
Pili girgoli and Adavi billu [Family Papilionaceae] is a medicinal plant which grows endemically in
Seshachalam hill ranges, Sesha theertham and Kumaradhara theertham in Thirumala, India. This plant is
woody perennial shrub with pinnate leaves, Leaves are odd- pinnate, and leaflets sub opposite, broadly
ovate, pubescent below emarginated mucronate. Flowers are golden yellow in axillaries and terminal
2nd International Online Conference on Biological Sciences, July 22, 2018, India
IOCBS 2018 ISBN: 978-81-934141-1-8 Rayder
83
Full Paper
racemes. Calyx tube widely companulate, oblique at mouth, teeth short and deltoid. Corolla much exerted
petals 5 clawed, obtuse, stamens 10, and free anthers versatile. Ovary stipulate, many ovules, style incurved,
stigma terminal and minute, pods 4 winged constricted between seeds. Seeds are 3-6, obovoid or globbose
and strophiole [4].
It has multifarious medicinal properties. The plant was investigated and was found out to possess
abortifacient, antibacterial, anti-cholesterolemic, anti-inflammatory, anti-spasmodic, diuretic, emetic,
emollient, febrifuge, hypotensive, purgative, styptic, and tonic properties [5]. The literature survey reveals
that S. interrupta is used to treat various types of gastrointestinal problems. Therefore an attempt has been
made to evaluate anthelmintic activity of leaves on adult earthworm Pheitima posthuma.
2. Materials and Method
Collection and identification of plant material
The leaves of Sophora interrputa Bedd. were collected during September - December 2017 from
Tirumala hills in Tirupati, Andhra Pradesh, India. The taxonomic identification of the plant is confirmed
by Prof. N. Yasodamma. The voucher specimen B.K:2 were deposited in the herbarium, (RUK) Department
of Botany, Rayalaseema University, Kurnool for future reference as per standard methods [6]. The present
work was carried out in the Department of Botany, Rayalaseema University, Tirupati. Plant materials were
thoroughly washed and then dried under shade for one week. The dried parts were ground in a mixer grinder
and sieved. The powders were stored in air sealed polythene bags at room temperature until further use.
Anthelmintic assay
The anthelmintic assay was carried as per the standard method [7]. The assay was performed on adult
Indian earth worm, Pheretima posthuma due to its anatomical and physiological resemblance with the
intestinal round worm parasite of human beings [8-11].
Worm collection
The earthworms Pheretima posthuma of approximately equal size (8 cm) was collected from
Yamuna vermi compost, Peddatekuru, Kurnool Dist., A.P. and the faecal matter present the worms were
washed with normal saline.
Reference Drug
Albendazole: It was prepared by dissolving in distilled water at the concentrations of 5mg and 10 mg.
Preparation of Desired Formulation
Desired Formulation can be prepared by dissolving the standard concentrations of 5 and 10
(Aqueous, acetone, alcohol, benzene, chloroform, ethyl acetate, methanol and petroleum ether) in 25 ml of
Distilled Water.
Experimental procedure
The aqueous, acetone, alcohol, benzene, chloroform, ethyl acetate, methanol and petroleum ether
extracts of leaves were investigated for their anthelmintic activity against P. posthuma. Various
concentrations (5 and 10 mg) of each extract were tested in the bioassay, which involved the determination
of time of paralysis and time of death of the worms. Albendazole was included as standard reference and
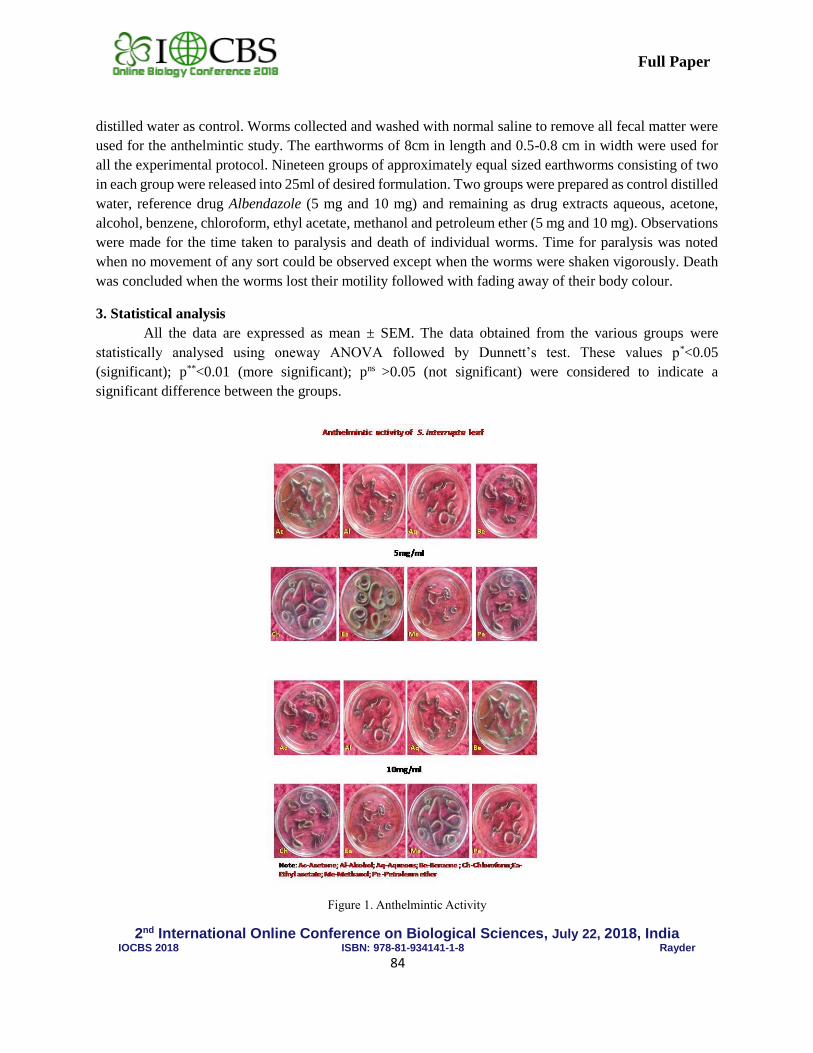
2nd International Online Conference on Biological Sciences, July 22, 2018, India
IOCBS 2018 ISBN: 978-81-934141-1-8 Rayder
84
Full Paper
distilled water as control. Worms collected and washed with normal saline to remove all fecal matter were
used for the anthelmintic study. The earthworms of 8cm in length and 0.5-0.8 cm in width were used for
all the experimental protocol. Nineteen groups of approximately equal sized earthworms consisting of two
in each group were released into 25ml of desired formulation. Two groups were prepared as control distilled
water, reference drug Albendazole (5 mg and 10 mg) and remaining as drug extracts aqueous, acetone,
alcohol, benzene, chloroform, ethyl acetate, methanol and petroleum ether (5 mg and 10 mg). Observations
were made for the time taken to paralysis and death of individual worms. Time for paralysis was noted
when no movement of any sort could be observed except when the worms were shaken vigorously. Death
was concluded when the worms lost their motility followed with fading away of their body colour.
3. Statistical analysis
All the data are expressed as mean ± SEM. The data obtained from the various groups were
statistically analysed using oneway ANOVA followed by Dunnett’s test. These values p*<0.05
(significant); p**<0.01 (more significant); pns >0.05 (not significant) were considered to indicate a
significant difference between the groups.
Figure 1. Anthelmintic Activity
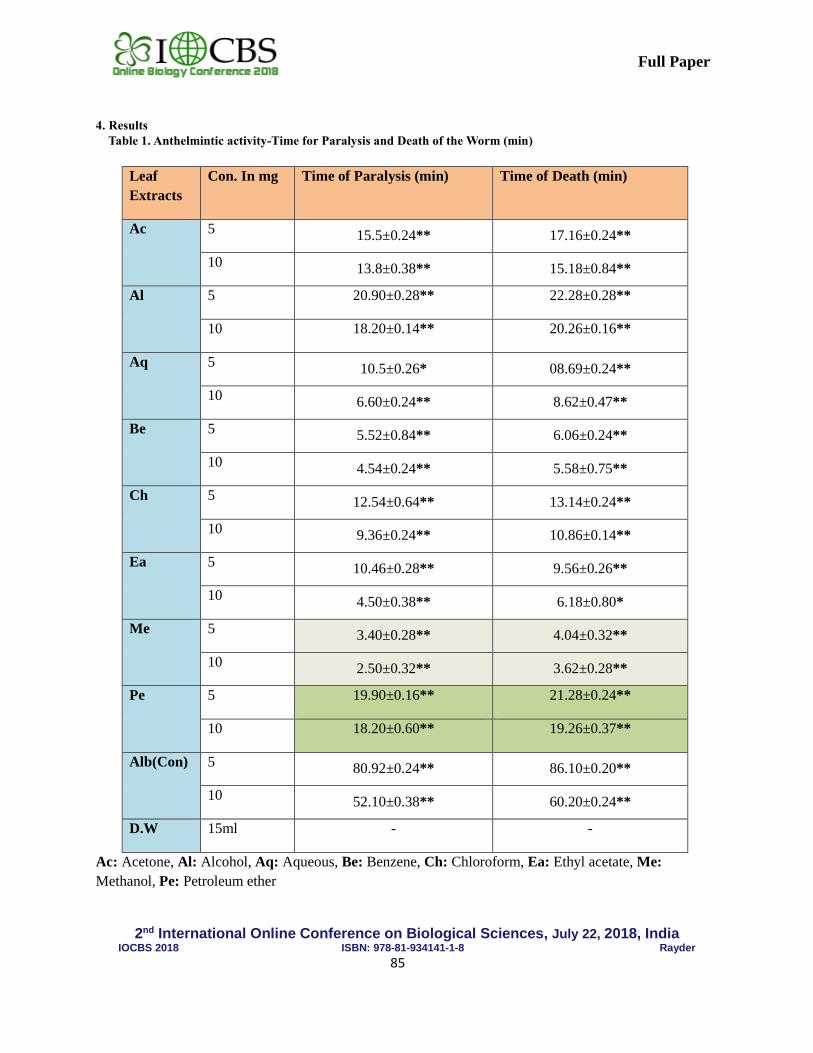
2nd International Online Conference on Biological Sciences, July 22, 2018, India
IOCBS 2018 ISBN: 978-81-934141-1-8 Rayder
85
Full Paper
4. Results
Table 1. Anthelmintic activity-Time for Paralysis and Death of the Worm (min)
Leaf
Extracts
Con. In mg Time of Paralysis (min) Time of Death (min)
Ac 5 15.5±0.24** 17.16±0.24**
10 13.8±0.38** 15.18±0.84**
Al 5 20.90±0.28** 22.28±0.28**
10 18.20±0.14** 20.26±0.16**
Aq 5 10.5±0.26* 08.69±0.24**
10 6.60±0.24** 8.62±0.47**
Be 5 5.52±0.84** 6.06±0.24**
10 4.54±0.24** 5.58±0.75**
Ch 5 12.54±0.64** 13.14±0.24**
10 9.36±0.24** 10.86±0.14**
Ea 5 10.46±0.28** 9.56±0.26**
10 4.50±0.38** 6.18±0.80*
Me 5 3.40±0.28** 4.04±0.32**
10 2.50±0.32** 3.62±0.28**
Pe 5 19.90±0.16** 21.28±0.24**
10 18.20±0.60** 19.26±0.37**
Alb(Con) 5 80.92±0.24** 86.10±0.20**
10 52.10±0.38** 60.20±0.24**
D.W 15ml - -
Ac: Acetone, Al: Alcohol, Aq: Aqueous, Be: Benzene, Ch: Chloroform, Ea: Ethyl acetate, Me:
Methanol, Pe: Petroleum ether
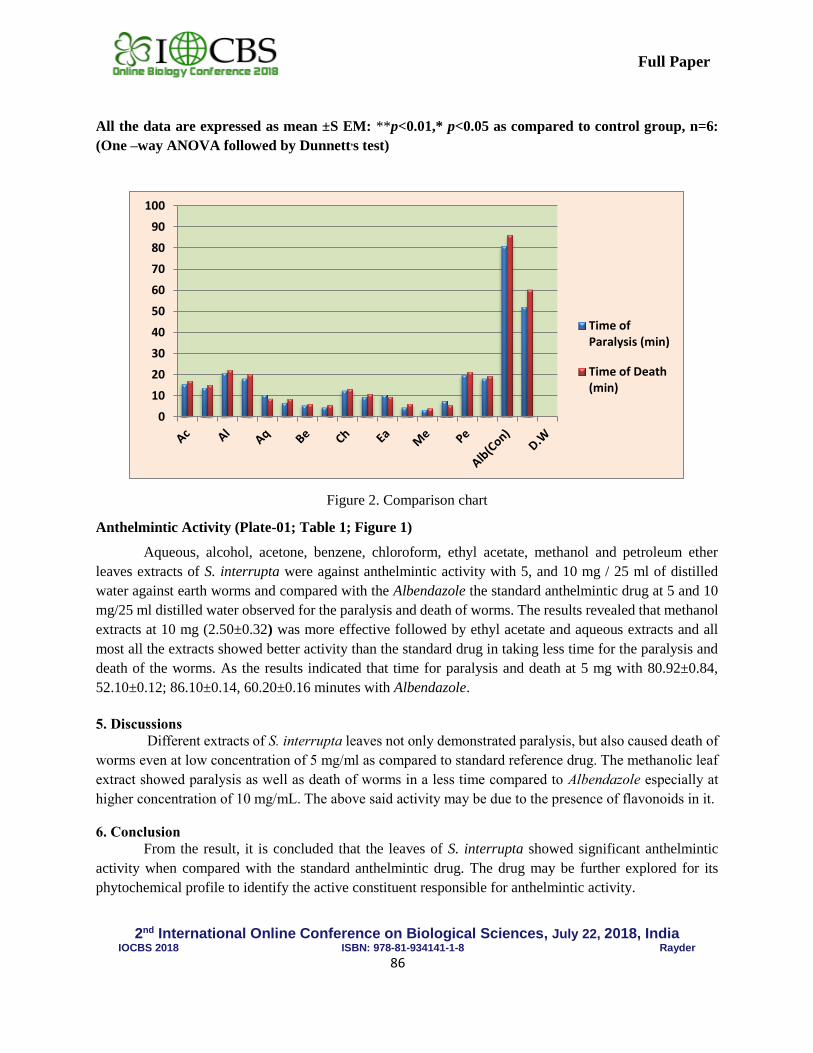
2nd International Online Conference on Biological Sciences, July 22, 2018, India
IOCBS 2018 ISBN: 978-81-934141-1-8 Rayder
86
Full Paper
All the data are expressed as mean ±S EM: **p<0.01,* p<0.05 as compared to control group, n=6:
(One –way ANOVA followed by Dunnett,s test)
Figure 2. Comparison chart
Anthelmintic Activity (Plate-01; Table 1; Figure 1)
Aqueous, alcohol, acetone, benzene, chloroform, ethyl acetate, methanol and petroleum ether
leaves extracts of S. interrupta were against anthelmintic activity with 5, and 10 mg / 25 ml of distilled
water against earth worms and compared with the Albendazole the standard anthelmintic drug at 5 and 10
mg/25 ml distilled water observed for the paralysis and death of worms. The results revealed that methanol
extracts at 10 mg (2.50±0.32) was more effective followed by ethyl acetate and aqueous extracts and all
most all the extracts showed better activity than the standard drug in taking less time for the paralysis and
death of the worms. As the results indicated that time for paralysis and death at 5 mg with 80.92±0.84,
52.10±0.12; 86.10±0.14, 60.20±0.16 minutes with Albendazole.
5. Discussions
Different extracts of S. interrupta leaves not only demonstrated paralysis, but also caused death of
worms even at low concentration of 5 mg/ml as compared to standard reference drug. The methanolic leaf
extract showed paralysis as well as death of worms in a less time compared to Albendazole especially at
higher concentration of 10 mg/mL. The above said activity may be due to the presence of flavonoids in it.
6. Conclusion
From the result, it is concluded that the leaves of S. interrupta showed significant anthelmintic
activity when compared with the standard anthelmintic drug. The drug may be further explored for its
phytochemical profile to identify the active constituent responsible for anthelmintic activity.
0
10
20
30
40
50
60
70
80
90
100
Time ofParalysis (min)
Time of Death(min)
2nd International Online Conference on Biological Sciences, July 22, 2018, India
IOCBS 2018 ISBN: 978-81-934141-1-8 Rayder
87
Full Paper
References
[1] Pal DK, Sahoo M, Mishra AK. Anthelminthic activity of stems of Opuntia vulgaris mill. Asian J Chem;
19:793–95, 2007.
[2] Aaer M, Man I, Mohamed AO, Moustafa FM. Cytotoxic effects of albendazole, antiparasitic drug, on the liver
of the rat: Subchronic study. Egypt J Biol; 1:16-29, 1999.
[3] Aswar M, Aswar U, Watkar B, Vyas M, Wagh A, Gujar KN. Anthelmintic activity of Ficus benghalensis. Int
J Green Pharm; 2:170-172, 2008.
[4] Madhava Chetty K, Sivaji K, Tulasi Rao K. Flowering plants of Chittoor District Andhra Pradesh, India. Student
Offset Printers, Tirupati. 2008.
[5] Poretz RD, Barth RF. Studies on the interaction of the Sophora japonica lectin and concanavalin A with
erythrocytes and lymphocytes. R Immunology; 31:187, 1976.
[6] Jain SK, Rao RR. A Hand book of field and Herbarium. Today and Tomorrow printers and Publishers, New
Delhi. 1977.
[7] Ghosh T, Maity TK, Bose A, Dash GK. Indian J nat Product; 16-19, 2009.
[8] Thorn GW, Adams RD, Braunword E, Isselbacher KJ, Petersdorf RG. Harrison’s principle of internal
medicine. New York, McGraw Hill Co. pp 160, 1977.
[9] Vidyarthi RD. A textbook of Zoology. New Delhi, S. Chand Co. pp 132, 1967.
[10] Vigar Z. Atlas of medical Parasitology, Singapore, P.G.Publishing House. pp 342, 1984.
[11] Chatterjee KD. Parasitology, protozoology and helminthology. Calcutta, Sree Saraswathi Press Ltd.1967.
2nd International Online Conference on Biological Sciences, July 22, 2018, India
IOCBS 2018 ISBN: 978-81-934141-1-8 Rayder
88
Full Paper
Detailed analysis and land use mapping of tea development centre, Umsning
Meghalaya
Mamita Kalita1*, Kasturi Chakraborty1, Nilakshee Devi2, K. K. Sharma1, P. L. N Raju1
1North Eastern Space Applications Centre (NESAC), Department of Space, Umiam,
Meghalaya 793103, India 2Department of Botany, Gauhati University, Guwahati, Assam 781014, India
*Corresponding email: [email protected]
Abstract
Background: The Study area comes under Umsning Block of RiBhoi district, Meghalaya. Meghalaya
literally means “abode of clouds” produces one of the finest qualities of tea in the world due to its unique
climatic conditions and pristine nature. Tea is most important beverages and India is evolving as most
technologically evolved industries in the world. India is one of the largest tea producers in the
world. About 70% of Tea is consumed within India itself. North East region is a major tea
producing part of India. The aromatic beverage is prepared from leaves of Camellia sinensis (L.)
O. Kuntze. The tea cultivation area of Meghalaya is around 440 ha with a total production of 2210 Metric
tonnes. The study area of 9.27 ha is an important contributor of Meghalaya tea industry named under
Megtea ™, an organic tea producer under Directorate of Horticulture, Meghalaya. The products include
Organic green tea, Black tea, and Oolong tea under various grades. The study has been carried out using
remote sensing and GIS technology. Land cover mapping were initially done with help of aerial
photography (Colwell, 1960). The present study is an attempt to map the garden along with
detailed analysis through data acquired through UAV (Unmanned Aerial Vehicle) to get precise
information. Such mappings are very much important for management planning and utilization of natural
resources. Land use analysis is an important parameter for various developmental activities. The land use
mapping of tea garden can be defined as the manner in which human beings employing the land
and its resources. Remote sensing and GIS is an effective technology for obtaining information on natural
resources and modelling.
Materials and Method: UAV (Unmanned aerial vehicle) flight was carried out on 2nd Sept. 2017at a height
of 90 m with spatial resolution of 4cm. An UAV equipped with two sensors was used for the study. Only
absolute GPS coordinate were utilized in this study and the images were synchronized utilizing the GPS.
The study has been carried out in software ArcGIS 10.2 for image processing and interpretation. The field
level digitization has been carried out in 1:500 scales to map the various infrastructures and land use of tea
garden. Visual identification and interpretation were used to extract features. Classification methods are
widely used, however it has limitations in high resolution imageries. For this reason the following study
was based on visual interpretation only.
Results: The tea garden covers an area of 9.27 ha which has been classified into 5 land use features. Study
revealed 59.33% of total area under tea plantation region. Also non cultivated area occupying 32.58% of
2nd International Online Conference on Biological Sciences, July 22, 2018, India
IOCBS 2018 ISBN: 978-81-934141-1-8 Rayder
89
Full Paper
which 1.17 ha wasteland area was identified. Plantation activities can be initiated in wasteland area. The
entire garden has been mapped with information of tea varieties/cultivars grown in each and every block.
A total of 18 blocks/section have been demarcated and featured by particular varieties such as
TINGAMIRA, BETJAN, SUNDARAM, UMRAN, NANDA DEVI, T-78,253, B-157,668, 777, AV-2, P-
312, R-144, TV 1, 9, 14, 16, 17, 18,19,20,24,26,28,29,30.Tea plantation as old as 42 years and as young
as 3years have also been identified to give further information on age distribution.
Conclusion: Field map with land use types for the study area has been generated. Such study will help us
to know degraded areas affected by erosion as well as plantation affected by natural and anthropogenic
activities. The study will provide better network between tea board, tea garden and research institutes for
proper management and for technical as well as marketing support. This will be guide to visitors and also
help workers to plan routes till weighing shed and factory in shortest time possible. Therefore it can be
suggested that GIS can be successfully used in tea sector for its managerial purposes.
Keywords: Land use, Remote sensing, GIS, Unmanned aerial vehicle.
1. Introduction
Tea plantation in India has been introduced by British government in year 1834. Tea is
most important beverages and India is evolving as most technologically evolved industries in the
world. India is one of the largest tea producers in the world. About 70% of Tea is consumed within
India itself. North East region is a major tea producing part of India. The aromatic beverage having
3% caffeine of its dry weight is prepared from leaves of Camellia sinensis (L.) O. Kuntze. Different
varieties like Darjeeling tea, Assam tea, Dooars and Terai tea are grown in N-E India. There are
around 848 registered tea estates in Assam, followed by Tripura (58). Arunachal Pradesh (5), Meghalaya
(3), Manipur (2) and Nagaland (1) registered tea estate. Trees are grown in bushes which are about 3-
4 feet in height. The canopy area of tea bushes are made even from top of which pluckers pluck
the tea leaves. Tea plantation employs a very large group of workers. Land use refers to man's
activity on earth which is directly related to land (Clawson and Stewart 1965). Such mappings are
very much important for management planning and utilization of natural resources. Land use analysis is an
important parameter for various developmental activities. The land use mapping of tea garden can be
defined as the manner in which human beings employing the land and its resources. . Remote
sensing and GIS is an effective technology for obtaining information on natural resources and modelling.
The utilization of UAV was back in 1849 in military services. UAV frameworks give short turnaround
processing, low cost, repeatability, dependability, adaptability and a usability framework (Laliberte et. al.
2008, Rango and Laliberte, 2010). Due to which it’s been widely used in field of agriculture, forestry and
other fields. The time required for getting the imagery is very less and the flight hardly took few minutes
to cover the entire tea garden area. UAV flight can be controlled from ground. Such a technology has the
capability to address precise mapping with section details, garden area, pruning types, shade tree density,
water resources, and garden land use and gap areas. Due to encouraging results of satellite based study,
NRSC (National Remote sensing Centre) has initiated project named as “Tea area development and
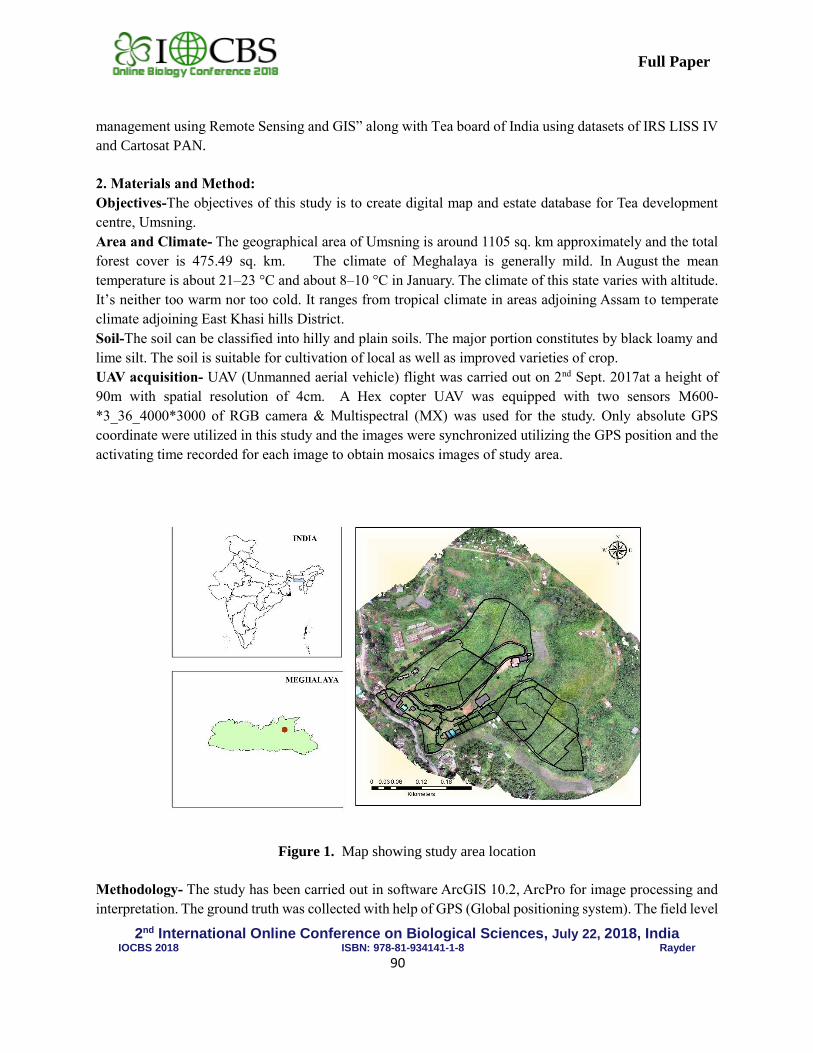
2nd International Online Conference on Biological Sciences, July 22, 2018, India
IOCBS 2018 ISBN: 978-81-934141-1-8 Rayder
90
Full Paper
management using Remote Sensing and GIS” along with Tea board of India using datasets of IRS LISS IV
and Cartosat PAN.
2. Materials and Method:
Objectives-The objectives of this study is to create digital map and estate database for Tea development
centre, Umsning.
Area and Climate- The geographical area of Umsning is around 1105 sq. km approximately and the total
forest cover is 475.49 sq. km. The climate of Meghalaya is generally mild. In August the mean
temperature is about 21–23 °C and about 8–10 °C in January. The climate of this state varies with altitude.
It’s neither too warm nor too cold. It ranges from tropical climate in areas adjoining Assam to temperate
climate adjoining East Khasi hills District.
Soil-The soil can be classified into hilly and plain soils. The major portion constitutes by black loamy and
lime silt. The soil is suitable for cultivation of local as well as improved varieties of crop.
UAV acquisition- UAV (Unmanned aerial vehicle) flight was carried out on 2nd Sept. 2017at a height of
90m with spatial resolution of 4cm. A Hex copter UAV was equipped with two sensors M600-
*3_36_4000*3000 of RGB camera & Multispectral (MX) was used for the study. Only absolute GPS
coordinate were utilized in this study and the images were synchronized utilizing the GPS position and the
activating time recorded for each image to obtain mosaics images of study area.
Figure 1. Map showing study area location
Methodology- The study has been carried out in software ArcGIS 10.2, ArcPro for image processing and
interpretation. The ground truth was collected with help of GPS (Global positioning system). The field level
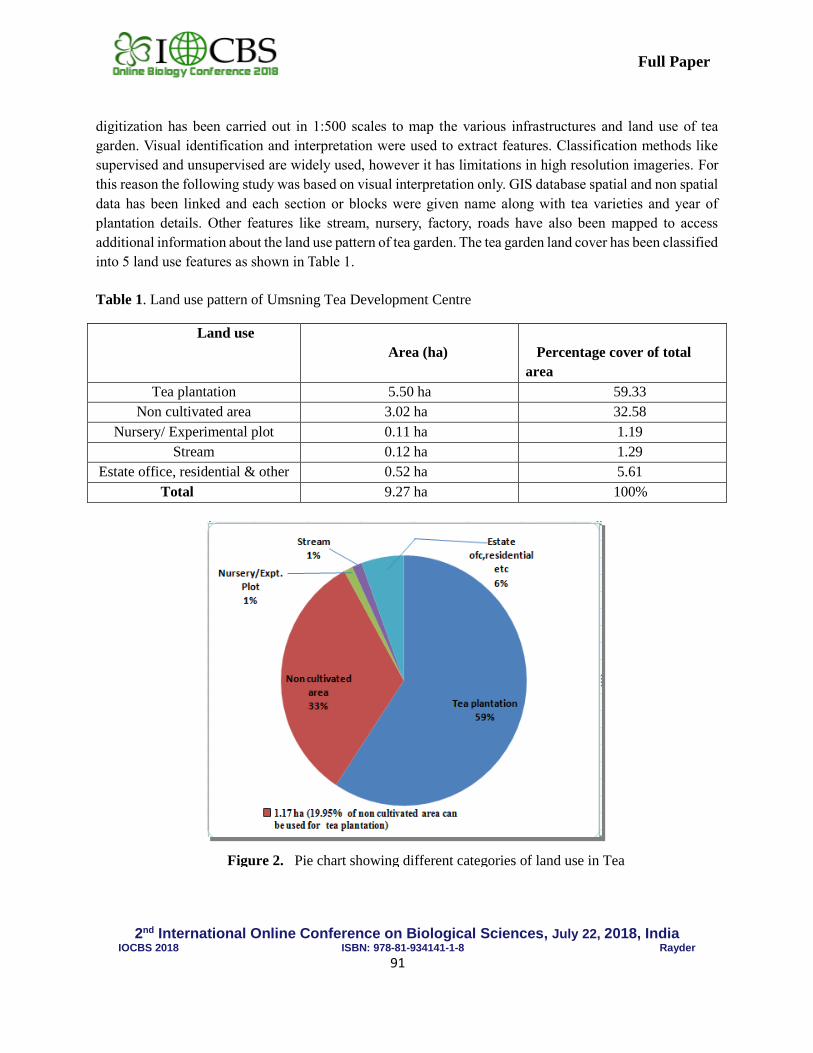
2nd International Online Conference on Biological Sciences, July 22, 2018, India
IOCBS 2018 ISBN: 978-81-934141-1-8 Rayder
91
Full Paper
digitization has been carried out in 1:500 scales to map the various infrastructures and land use of tea
garden. Visual identification and interpretation were used to extract features. Classification methods like
supervised and unsupervised are widely used, however it has limitations in high resolution imageries. For
this reason the following study was based on visual interpretation only. GIS database spatial and non spatial
data has been linked and each section or blocks were given name along with tea varieties and year of
plantation details. Other features like stream, nursery, factory, roads have also been mapped to access
additional information about the land use pattern of tea garden. The tea garden land cover has been classified
into 5 land use features as shown in Table 1.
Table 1. Land use pattern of Umsning Tea Development Centre
Land use
Area (ha)
Percentage cover of total
area
Tea plantation 5.50 ha 59.33
Non cultivated area 3.02 ha 32.58
Nursery/ Experimental plot 0.11 ha 1.19
Stream 0.12 ha 1.29
Estate office, residential & other 0.52 ha 5.61
Total 9.27 ha 100%
Figure 2. Pie chart showing different categories of land use in Tea
garden
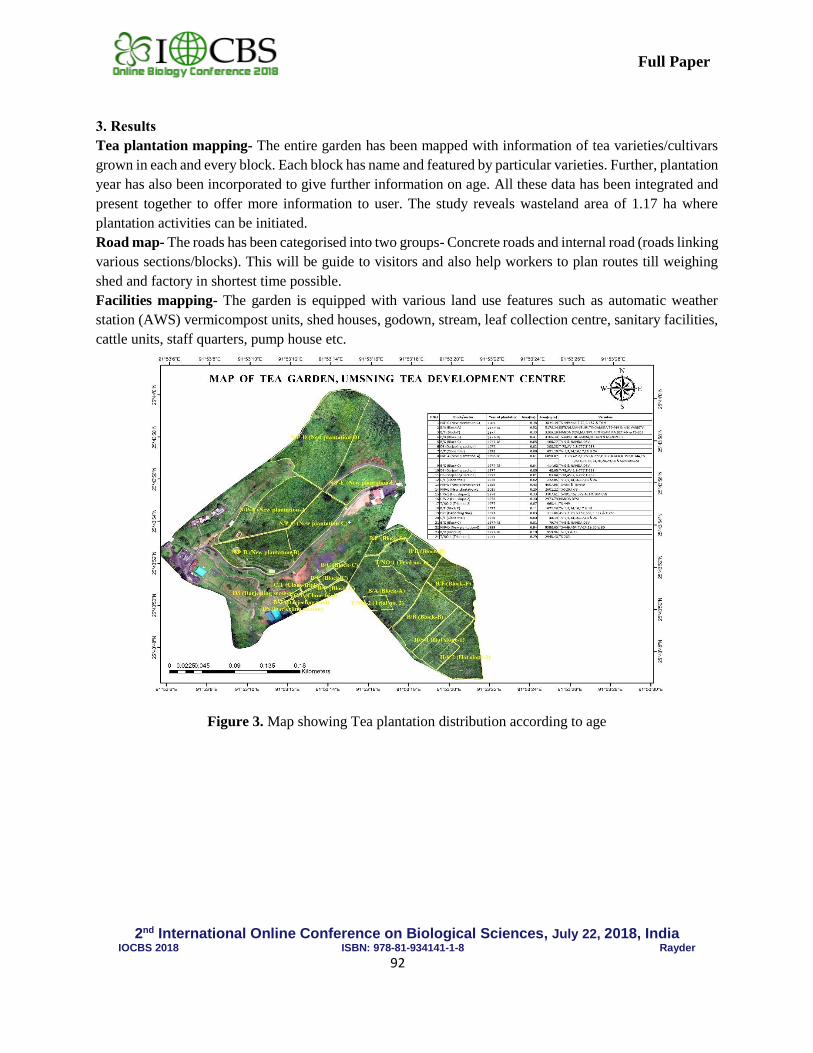
2nd International Online Conference on Biological Sciences, July 22, 2018, India
IOCBS 2018 ISBN: 978-81-934141-1-8 Rayder
92
Full Paper
3. Results
Tea plantation mapping- The entire garden has been mapped with information of tea varieties/cultivars
grown in each and every block. Each block has name and featured by particular varieties. Further, plantation
year has also been incorporated to give further information on age. All these data has been integrated and
present together to offer more information to user. The study reveals wasteland area of 1.17 ha where
plantation activities can be initiated.
Road map- The roads has been categorised into two groups- Concrete roads and internal road (roads linking
various sections/blocks). This will be guide to visitors and also help workers to plan routes till weighing
shed and factory in shortest time possible.
Facilities mapping- The garden is equipped with various land use features such as automatic weather
station (AWS) vermicompost units, shed houses, godown, stream, leaf collection centre, sanitary facilities,
cattle units, staff quarters, pump house etc.
Figure 3. Map showing Tea plantation distribution according to age
2nd International Online Conference on Biological Sciences, July 22, 2018, India
IOCBS 2018 ISBN: 978-81-934141-1-8 Rayder
93
Full Paper
Figure 4. Digital land use map showing Tea plantation section level details
Table 2. Tea plantation varieties along with age distribution and block details
Block Varieties Plantation
year
Age
(years)
Percentage of
total area
B/A(Block-A) BETJAN, MANIPURI, TINGAMIRA,TS-449 & MIX
VARIETY
1977-78 40-41 5.61
B/B(Block-B) TS-449,TINGAMIRA,BETJAN & MANIPURI 1977-78 40-41 4.42
B/C(Block-C) TV-9 & NANDA DEVI 1977-78 40-41 0.11
B/D(Block-D) TV-1,9 & 18 1977-78 40-41 1.11
B/E (Block E) TV-1,9,14,16,17 & 18 1977 41 1.87
B/F (Block-F) NANDA DEVI,MANIPURI, TINGAMIRA,BETJAN &
TS-203
1977 41 3.56
T/NO-1
(Trial no. 1)
TS-203 1977 41 3.13
T/NO-2
(Trial no. 2)
TS-449 1977 41 0.76
DS (Darjeeling
section)
T-78,AV-2,B-777,T-253 1977 41 0.32
D/T (Darjeeling trial) AV-2,T-78,B-157,668,P-312 & T-253 1977 41 0.32
C/T (Clone trial) TV-1,9,14,16,17,18 & 24 1978 40 0.04
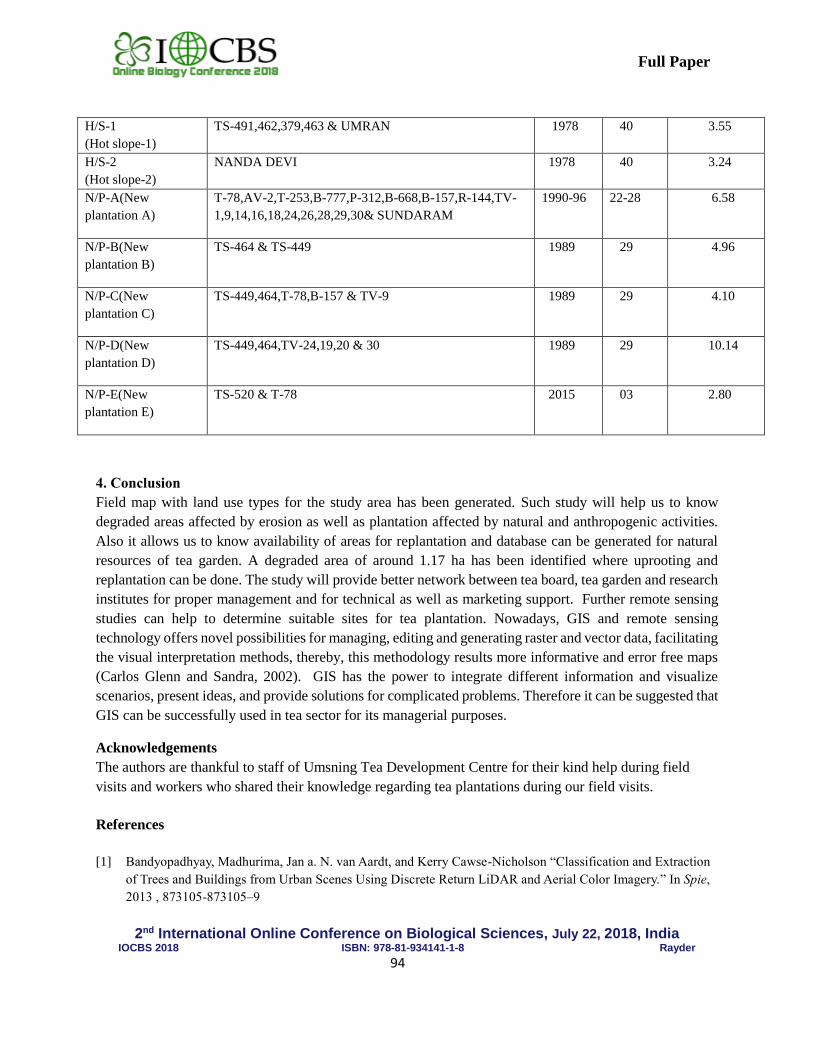
2nd International Online Conference on Biological Sciences, July 22, 2018, India
IOCBS 2018 ISBN: 978-81-934141-1-8 Rayder
94
Full Paper
H/S-1
(Hot slope-1)
TS-491,462,379,463 & UMRAN 1978 40 3.55
H/S-2
(Hot slope-2)
NANDA DEVI 1978 40 3.24
N/P-A(New
plantation A)
T-78,AV-2,T-253,B-777,P-312,B-668,B-157,R-144,TV-
1,9,14,16,18,24,26,28,29,30& SUNDARAM
1990-96 22-28 6.58
N/P-B(New
plantation B)
TS-464 & TS-449 1989 29 4.96
N/P-C(New
plantation C)
TS-449,464,T-78,B-157 & TV-9 1989 29 4.10
N/P-D(New
plantation D)
TS-449,464,TV-24,19,20 & 30 1989 29 10.14
N/P-E(New
plantation E)
TS-520 & T-78 2015 03 2.80
4. Conclusion
Field map with land use types for the study area has been generated. Such study will help us to know
degraded areas affected by erosion as well as plantation affected by natural and anthropogenic activities.
Also it allows us to know availability of areas for replantation and database can be generated for natural
resources of tea garden. A degraded area of around 1.17 ha has been identified where uprooting and
replantation can be done. The study will provide better network between tea board, tea garden and research
institutes for proper management and for technical as well as marketing support. Further remote sensing
studies can help to determine suitable sites for tea plantation. Nowadays, GIS and remote sensing
technology offers novel possibilities for managing, editing and generating raster and vector data, facilitating
the visual interpretation methods, thereby, this methodology results more informative and error free maps
(Carlos Glenn and Sandra, 2002). GIS has the power to integrate different information and visualize
scenarios, present ideas, and provide solutions for complicated problems. Therefore it can be suggested that
GIS can be successfully used in tea sector for its managerial purposes.
Acknowledgements
The authors are thankful to staff of Umsning Tea Development Centre for their kind help during field
visits and workers who shared their knowledge regarding tea plantations during our field visits.
References
[1] Bandyopadhyay, Madhurima, Jan a. N. van Aardt, and Kerry Cawse-Nicholson “Classification and Extraction
of Trees and Buildings from Urban Scenes Using Discrete Return LiDAR and Aerial Color Imagery.” In Spie,
2013 , 873105-873105–9
2nd International Online Conference on Biological Sciences, July 22, 2018, India
IOCBS 2018 ISBN: 978-81-934141-1-8 Rayder
95
Full Paper
[2] Pena-Barragana, J.M et al. “Assessing Land-Use in Olive Groves from Aerial Photographs.” Agriculture,
Ecosystems and Environment 103(1): 117–22, 2004.
[3] Civco, D.L., “Knowledge Based Land-use and Land cover Mapping” Proceedings of Annual Convension of
American Society for Photogrammetry and Remote Sensing, Vol.3, pp. 276-291, 1989.
[4] Qin, Rongjun. “An Object-Based Hierarchical Method for Change Detection Using Unmanned Aerial
Vehicle Images.” Remote Sensing 6(9): 7911–32, 2014.
[5] Ghosh, J.K., H.Lamar and N.Roel, “Forest Cover and Land Use Mapping of a Region of Barak Valley of
Assam, India using IRS LISS II Imagery”. Archives of International Society of Photogrammetry and Remote
Sensing, 1992.
[6] Das, M.K.; Shukta, R.N. and Rathore, J.S. “Vegetation/land use mapping of Dhaulkhand range of Rajaji
National Park using remote sensing technique”, J. of Tropical forestry, II(1): 30-39, (1995).
[7] Wellala N N K, Gunatilake J and Shyamalie H W “Use of Geographic Information System in Tea
Plantation
Management: A Case Study at St. Coombs Estate, Talawakelle” Sri Lanka J. Tea Science, Volume 77, Part (1/2); 70-
82,(2012).
[8] Khairi M, Razil M and Ismail M H “Applying GIS for mapping agricultural roads network in Felda Trolak
Utara for Oil Palm Plantation Management”, Information Management and Business Review 1(1), 11-15, 2010.
[9] Pal, D.K., S.Joseph, S. Sengupta and C.K.U. Nair, “Short-wave IR Bands in Moisture Stress and Garden
condition assessment of tea estates in North-eastern India”, Proceedings of National symposium on Applications of
Resource Management with special emphasis on N.E. Region, pp.424-432, (1993).
[10] Tiwari A.K., “Mapping and Monitoring of Biodiversity using Remote Sensing-A Modern” Global Change
Studies, ISRO, Vol II.1998
[11] Riebsame, W.E.; Meyer, W.B. and Turner, B.L. “Modeling Land-use and Cover as Part of Global
Environmental Change”, Climate Change, II: 28: 45, (1994).
[12] Das, M.K.; Awasthi, A.K.; Pandey, R.; Dwivedi, A. and Koul, M. “Mapping of Forest types and Land
use/Land cover of Singrauli coal field area using satellite Remote Sensing techniques”, J.Tropical Forestry,
23(I&II): 141-150, (2007).
2nd International Online Conference on Biological Sciences, July 22, 2018, India
IOCBS 2018 ISBN: 978-81-934141-1-8 Rayder
96
Full Paper
Quantification of RNi-Prognosis marker for renal dysfunctioning among
Leprosy patients
Sibi Joy Manohar1, Andrew Pradeep M1, R Sethu Nagarajan1*
1Department of Immunology and Microbiology, The American College, Madurai
*corresponding email: [email protected]
Abstract
Background: Leprosy is one of the global burden disease and India represents nearly 76%. Clinical,
histological and immunological criteria identity five forms of Leprosy,in which the Lepromatous leprosy
occupy the major part.M.leprae phagocytosis initiating a series of disturbances in the metabolism of
macrophages which will leads to Nitrostative stress (RNI). Oxidative imbalance is a serious issue in leprosy
victim which leads to Oxidative stress that directly influence on renal dysfunctioning. The renal failure is
the major cause of death in the patients with leprosy.The renal function can be usually determined by
monitoring serum creatinine alone. Serum creatinine is readily and easily measured and it is specific for
renal function, while urea is a non-specific marker of renal function, making it a poor marker relative
creatinine.
Methods: In this study 50 urine and blood samples were collected from the leprosy patients with proper
concern and the samples are allowed for quantification of Reactive Nitrogen Intermediate as a marker for
nitrostative stress and Determination of urea, uric acid and creatinine level as a marker for kidney
dysfunctioning.
Results and Discussion: The results shows the Increased RNi in the infected victims with the antimicrobial
activity mediated through Reactive Nitrogen Intermediates will modifies the bacterial DNA, protein and
Lipids in both microbes and host and also mediate the potential damage to the bacterial DNA influencing
the immune surveillance and establishing resistance against the intracellular infection and the highest
percentage of deviation in the age group 30-39 of serum and vice versa in urine that shows the clear
evidence of renal dysfunctioning. M.leprae has a longer period of incubation and establishment of the
pathogenesis might take place at the diminishing stage of the immune response. As the age proceeds
immune down regulation seem to be one among the major thread for renal dysfunction. Thus, proper
therapeutic and preventive care must be taken to avoid the Kidney damage and increase the survival rate
Key Words: Nitostative stress, Creatinine, Renal dysfunction.
1. Introduction
Historically leprosy has affected mankind since 6000 years ago. India represents nearly 76% of the
global burden of the disease [1]. Clinical, histological and immunological criteria identity five forms of
Leprosy: Tuberculoid, Borderline, Mid Boderline, Boderlinelepromatous and Lepromatous leprosy. [2] In
which the Lepromatous leprosy occupy the major part. Lepromatous leprosy patients lack circulating T-
lymphocytes. There is a defective regulation of M.leprae phagocytosis initiating a series of disturbances in
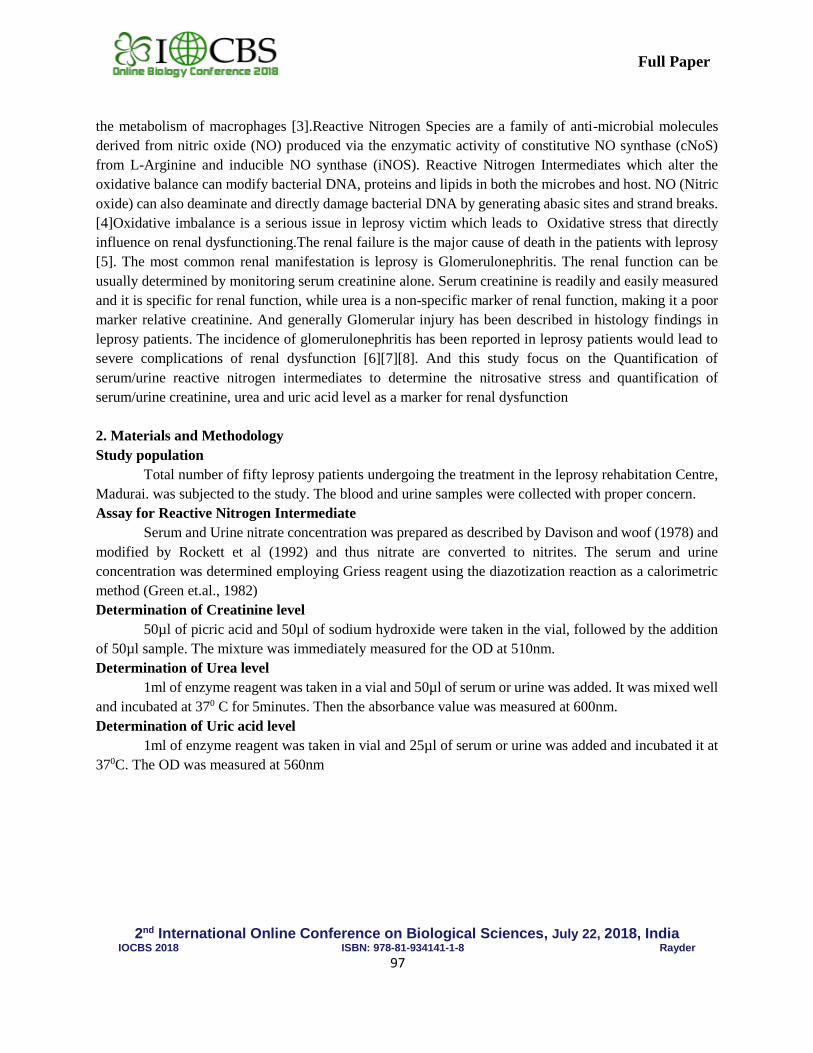
2nd International Online Conference on Biological Sciences, July 22, 2018, India
IOCBS 2018 ISBN: 978-81-934141-1-8 Rayder
97
Full Paper
the metabolism of macrophages [3].Reactive Nitrogen Species are a family of anti-microbial molecules
derived from nitric oxide (NO) produced via the enzymatic activity of constitutive NO synthase (cNoS)
from L-Arginine and inducible NO synthase (iNOS). Reactive Nitrogen Intermediates which alter the
oxidative balance can modify bacterial DNA, proteins and lipids in both the microbes and host. NO (Nitric
oxide) can also deaminate and directly damage bacterial DNA by generating abasic sites and strand breaks.
[4]Oxidative imbalance is a serious issue in leprosy victim which leads to Oxidative stress that directly
influence on renal dysfunctioning.The renal failure is the major cause of death in the patients with leprosy
[5]. The most common renal manifestation is leprosy is Glomerulonephritis. The renal function can be
usually determined by monitoring serum creatinine alone. Serum creatinine is readily and easily measured
and it is specific for renal function, while urea is a non-specific marker of renal function, making it a poor
marker relative creatinine. And generally Glomerular injury has been described in histology findings in
leprosy patients. The incidence of glomerulonephritis has been reported in leprosy patients would lead to
severe complications of renal dysfunction [6][7][8]. And this study focus on the Quantification of
serum/urine reactive nitrogen intermediates to determine the nitrosative stress and quantification of
serum/urine creatinine, urea and uric acid level as a marker for renal dysfunction
2. Materials and Methodology
Study population
Total number of fifty leprosy patients undergoing the treatment in the leprosy rehabitation Centre,
Madurai. was subjected to the study. The blood and urine samples were collected with proper concern.
Assay for Reactive Nitrogen Intermediate
Serum and Urine nitrate concentration was prepared as described by Davison and woof (1978) and
modified by Rockett et al (1992) and thus nitrate are converted to nitrites. The serum and urine
concentration was determined employing Griess reagent using the diazotization reaction as a calorimetric
method (Green et.al., 1982)
Determination of Creatinine level
50µl of picric acid and 50µl of sodium hydroxide were taken in the vial, followed by the addition
of 50µl sample. The mixture was immediately measured for the OD at 510nm.
Determination of Urea level
1ml of enzyme reagent was taken in a vial and 50µl of serum or urine was added. It was mixed well
and incubated at 370 C for 5minutes. Then the absorbance value was measured at 600nm.
Determination of Uric acid level
1ml of enzyme reagent was taken in vial and 25µl of serum or urine was added and incubated it at
370C. The OD was measured at 560nm
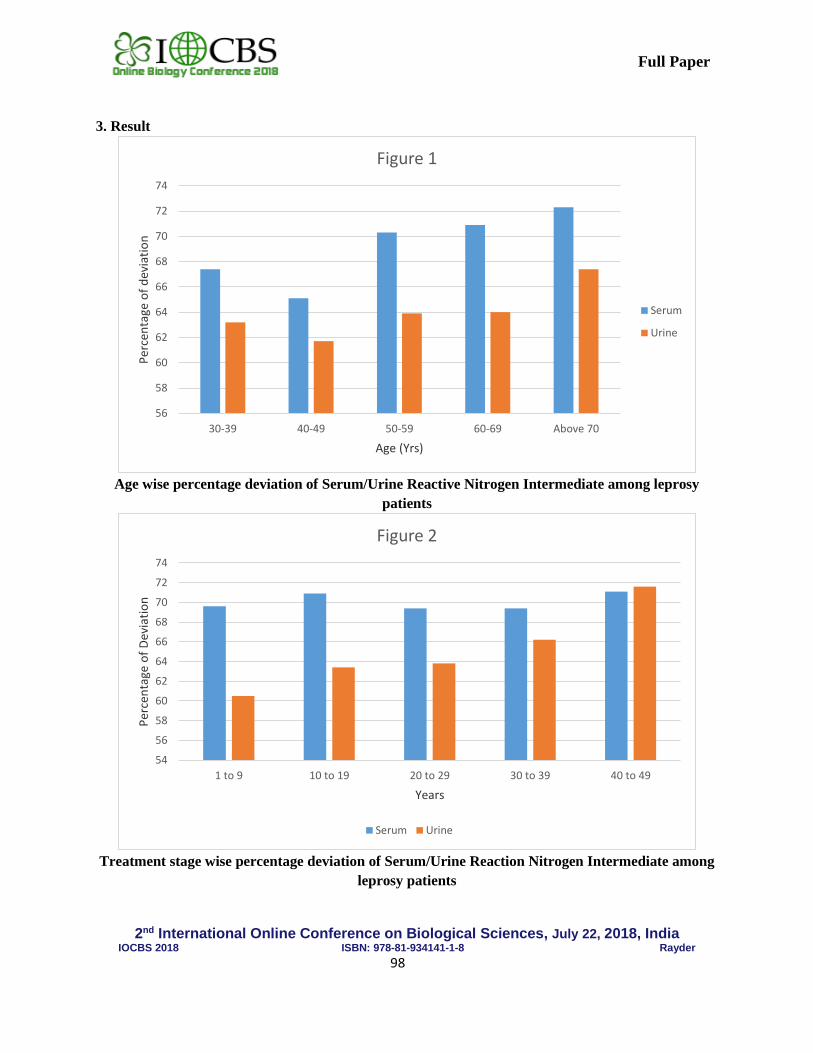
2nd International Online Conference on Biological Sciences, July 22, 2018, India
IOCBS 2018 ISBN: 978-81-934141-1-8 Rayder
98
Full Paper
3. Result
Age wise percentage deviation of Serum/Urine Reactive Nitrogen Intermediate among leprosy
patients
Treatment stage wise percentage deviation of Serum/Urine Reaction Nitrogen Intermediate among
leprosy patients
56
58
60
62
64
66
68
70
72
74
30-39 40-49 50-59 60-69 Above 70
Per
cen
tage
of
dev
iati
on
Age (Yrs)
Figure 1
Serum
Urine
54
56
58
60
62
64
66
68
70
72
74
1 to 9 10 to 19 20 to 29 30 to 39 40 to 49
Per
cen
tage
of
Dev
iati
on
Years
Figure 2
Serum Urine
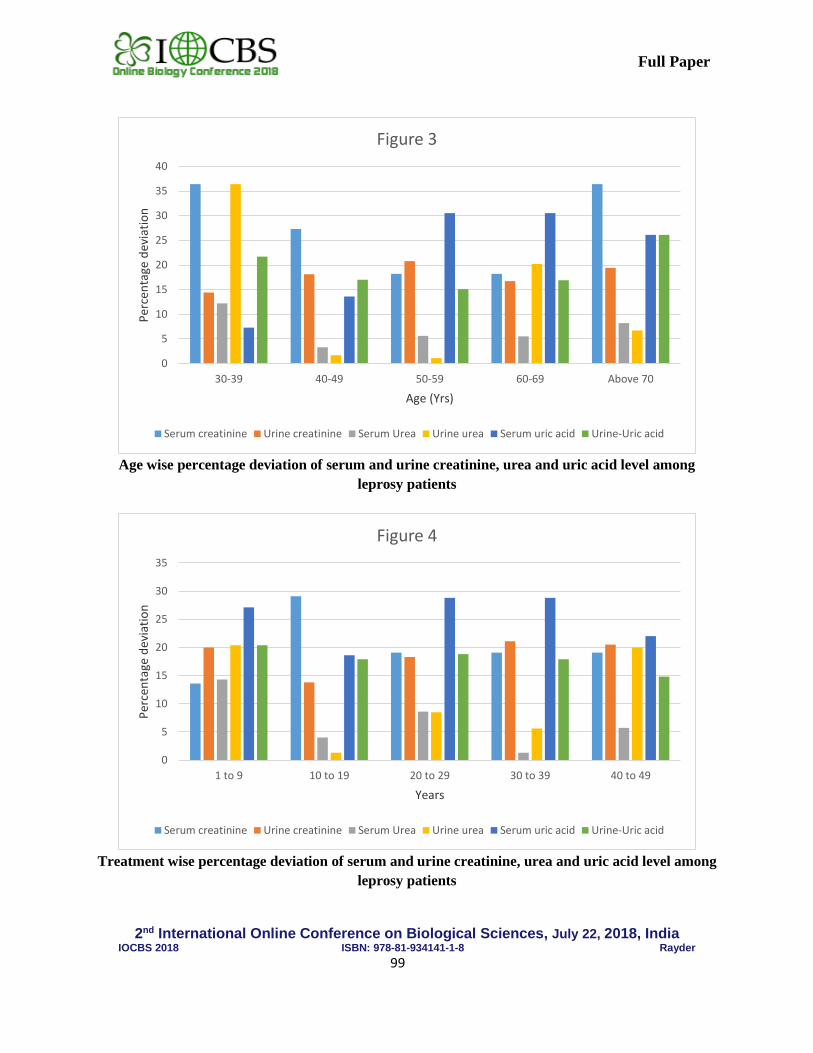
2nd International Online Conference on Biological Sciences, July 22, 2018, India
IOCBS 2018 ISBN: 978-81-934141-1-8 Rayder
99
Full Paper
Age wise percentage deviation of serum and urine creatinine, urea and uric acid level among
leprosy patients
Treatment wise percentage deviation of serum and urine creatinine, urea and uric acid level among
leprosy patients
0
5
10
15
20
25
30
35
40
30-39 40-49 50-59 60-69 Above 70
Per
cen
tage
dev
iati
on
Age (Yrs)
Figure 3
Serum creatinine Urine creatinine Serum Urea Urine urea Serum uric acid Urine-Uric acid
0
5
10
15
20
25
30
35
1 to 9 10 to 19 20 to 29 30 to 39 40 to 49
Per
cen
tage
dev
iati
on
Years
Figure 4
Serum creatinine Urine creatinine Serum Urea Urine urea Serum uric acid Urine-Uric acid
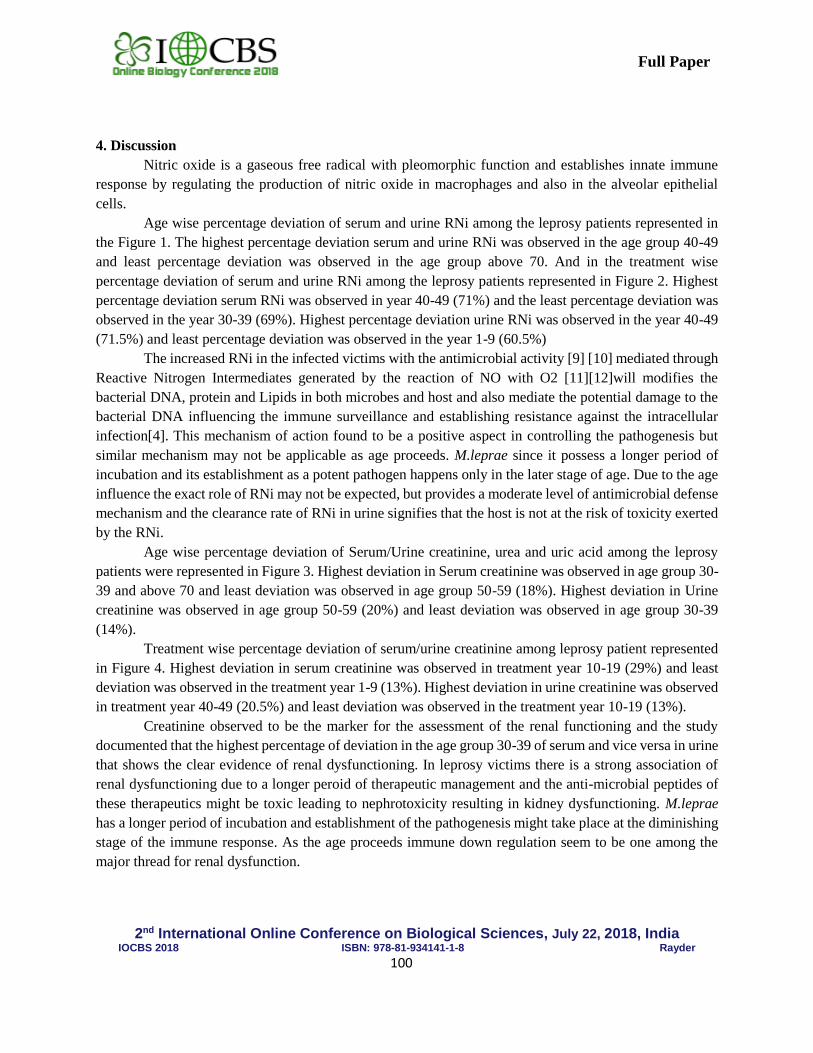
2nd International Online Conference on Biological Sciences, July 22, 2018, India
IOCBS 2018 ISBN: 978-81-934141-1-8 Rayder
100
Full Paper
4. Discussion
Nitric oxide is a gaseous free radical with pleomorphic function and establishes innate immune
response by regulating the production of nitric oxide in macrophages and also in the alveolar epithelial
cells.
Age wise percentage deviation of serum and urine RNi among the leprosy patients represented in
the Figure 1. The highest percentage deviation serum and urine RNi was observed in the age group 40-49
and least percentage deviation was observed in the age group above 70. And in the treatment wise
percentage deviation of serum and urine RNi among the leprosy patients represented in Figure 2. Highest
percentage deviation serum RNi was observed in year 40-49 (71%) and the least percentage deviation was
observed in the year 30-39 (69%). Highest percentage deviation urine RNi was observed in the year 40-49
(71.5%) and least percentage deviation was observed in the year 1-9 (60.5%)
The increased RNi in the infected victims with the antimicrobial activity [9] [10] mediated through
Reactive Nitrogen Intermediates generated by the reaction of NO with O2 [11][12]will modifies the
bacterial DNA, protein and Lipids in both microbes and host and also mediate the potential damage to the
bacterial DNA influencing the immune surveillance and establishing resistance against the intracellular
infection[4]. This mechanism of action found to be a positive aspect in controlling the pathogenesis but
similar mechanism may not be applicable as age proceeds. M.leprae since it possess a longer period of
incubation and its establishment as a potent pathogen happens only in the later stage of age. Due to the age
influence the exact role of RNi may not be expected, but provides a moderate level of antimicrobial defense
mechanism and the clearance rate of RNi in urine signifies that the host is not at the risk of toxicity exerted
by the RNi.
Age wise percentage deviation of Serum/Urine creatinine, urea and uric acid among the leprosy
patients were represented in Figure 3. Highest deviation in Serum creatinine was observed in age group 30-
39 and above 70 and least deviation was observed in age group 50-59 (18%). Highest deviation in Urine
creatinine was observed in age group 50-59 (20%) and least deviation was observed in age group 30-39
(14%).
Treatment wise percentage deviation of serum/urine creatinine among leprosy patient represented
in Figure 4. Highest deviation in serum creatinine was observed in treatment year 10-19 (29%) and least
deviation was observed in the treatment year 1-9 (13%). Highest deviation in urine creatinine was observed
in treatment year 40-49 (20.5%) and least deviation was observed in the treatment year 10-19 (13%).
Creatinine observed to be the marker for the assessment of the renal functioning and the study
documented that the highest percentage of deviation in the age group 30-39 of serum and vice versa in urine
that shows the clear evidence of renal dysfunctioning. In leprosy victims there is a strong association of
renal dysfunctioning due to a longer peroid of therapeutic management and the anti-microbial peptides of
these therapeutics might be toxic leading to nephrotoxicity resulting in kidney dysfunctioning. M.leprae
has a longer period of incubation and establishment of the pathogenesis might take place at the diminishing
stage of the immune response. As the age proceeds immune down regulation seem to be one among the
major thread for renal dysfunction.
2nd International Online Conference on Biological Sciences, July 22, 2018, India
IOCBS 2018 ISBN: 978-81-934141-1-8 Rayder
101
Full Paper
5. Conclusion
Thus this study clearly implies the role of RNi level in determining the severity of the leprosy and
its association in renal dysfunctioning among Leprosy in both age wise and treatment wise. Proper
therapeutic modulation and adopting strategies for maintance of oxidative balancemight reduce the
burdenisation of host from deleterious impact
References
[1] WHO Leprosy Elimination Project Status Re-port (draft 2003. World Health Organization: Geneva
[2] Malcom S. Duthie, Stephen T. Reece, RamanujLahiri, WakakoGoto, Vanitha S Raman. Juliette Kaplan, Greg C.
Ireton, Sylvie Bertholet, Thomas P. Gillis, James L Krahenbuhl and Steven G. Reed (2007) Antigen Specific Cellular
and Humoral Response are Induced by Intradermal M.leprae infection of the Mouse ear. Infect Immun
[3] Birdi T J, Nerges F. Mistry, Mahadevan P.R. and NoshirH.Antia (1983), Alterations in the membrane of
Macrophages from Leprosy Patients, Infect. Immun.41:121-127
[4] Chan J, Tanaka K, Carroll D, Flynn J and B.R. Bloom (2005) Effects of Nitric oxide synthase inhibitor on murine
infection with Mycobacterium tuberculosis. Infect Immun. 63; 736-740
[5] Mitsuda K, and M Ogawa : (1937) A study of one hundred fifty autopsies on cases of leprosy. Int J Leprosy, 5;53-
60
[6] Powell SC, and L.L.Swan (1955) Leprosy: Pathologic changes observed in fifty consecutive necropsies. Int J
Leprosy, 31;1131-1147
[7] Bernard JC and CJ Vazquez (1973): Visceral lesions in lepromatous leprosy, Study of Sixty necropsies. Int J
Leprosy, 41; 94-101
[8] Ahsan N, Don E. Wheeler and Biff F. Palmer(1995) Leprosy-Associated Renal disease; Case report and review of
literature, Journal of American society of Nephrology, 5;1546-1552
[9] Ralph AP, Kelly PM and NM Anstey (2008) L-arginine and Vitamin D; Novel Adjunctive Immunotherapies in
tuberculosis, Trends Microbiol 16;336-344.
[10] Rodrigo A. Oliveira, Geraldo B. Silva Jr, Clodoaldo J. Souza, Eduardo F. Viera, Rosa M.S.Mota, Alice Maria
Costa Martins, Alexandre Braga Liborio and Elizabeth F. Daher (2008): Evaluation of renal function in leprosy: a
study of 59 consecutive patients, Nephrol Dial Transplant, 23; 256-262.
[11] Zaki MH, Akuta T and T.Akaike (2005) Nitric oxide induced nitrative stress involved in microbial pathogenesis,
J PharmacolSci Nitric oxide in Mycobacterial Infection 98; 117-129.
[12] MacMicking J, Xie QW and C.Nathan (1997) Nitric oxide and macrophage function Annu Rev Immunol 15;
323-350
2nd International Online Conference on Biological Sciences, July 22, 2018, India
IOCBS 2018 ISBN: 978-81-934141-1-8 Rayder
102
Full Paper
Electronic properties of flavonols: quantum mechanical studies
Sahini Banerjee1, Debanjan Mitra2 and Amal Kumar Bandyopadhyay2*
1Department of Biotechnology, Institute of Genetic Engineering, West Bengal, 700128, India 2Department of Biotechnology, The University of Burdwan, West Bengal, 713104, India
*Corresponding email: [email protected]
Abstract
Background: Kaempferol (K), Quercetin (Q), Myricetin (M) are flavonols, a class of flavonoid, that are
accumulated in different parts of plants. While plants produce these secondary metabolites for their self-
protection, human make use of these molecules for medicinal, therapeutic, commercial and food purposes.
While studies reveal that these molecules, being in the root-exudates of legume plants, play crucial roles
for the i] establishment of cross-nodulating groups in symbiosis and ii] maintenance of aseptic eco-
chemistry of rhizosphere, understanding of differential molecular properties remain to be worked out.
Present study involves the extraction and comparison of electronic and other properties among K, Q and
M.
Materials and Methods: We use B3LYP/6-311G (d, p) level of theory of GAUSSIAN 09, to extract
differential molecular properties such as EHOMO, ELUMO, band-gap, electrophilicity (γ), chemical potential
(c), chemical hardness (η) , kinetic stability etc, thermodynamic stability and dipole polarizability of
flavonols (i.e. K, Q and M).
Results: The ground state optimized structures are used to extract electronic, thermodynamic, and
polarizability properties. Although, bond length, bond angle are almost similar, dihedral angle between AC
and B rings of Q differs from that of K and M. ELUMO, ω, I, η, IP and band gap follow the order as K>M>Q,
which is reversed for σ and EHOMO. It, therefore, seems the orientation of rings, OH-substituent in them and
their intra molecular stabilization act as determinant for these properties. Thermodynamic stability of
flavonols follow M>Q>K, which is due to additional OH substitutions in rings of these molecules.
Polarizability (α), anisotropy of polarizability (Δα), β, γ|| and γ_|_ show the similar trends in that Q has the
highest with K and M have comparable but lower values.
Conclusion: The study highlights differential electronic, thermodynamic and non-linear optical (NLO)
properties of flavonols, which seems to have relation with their chemical reactivity against cellular targets
in relation to biological nitrogen fixation.
Keywords: Flavonols, Electronic properties, Density Functional Theory, Polarizability, N2-fixation.
1. Introduction
Flavonols, a class of secondary metabolite flavonoids, are produced and accumulated in roots, shoots,
leave, and fruits of plants for their self-protection [1, 2]. Flavonols have 2-phenyl 3-hydroxy-4-chromenone
as core structure with different levels of hydroxylation at A and B rings (Table 1). Each of K, Q and M has
two common OH substitutions, one at position 5 and the other at position 7 of A-ring (Table 1). Number of
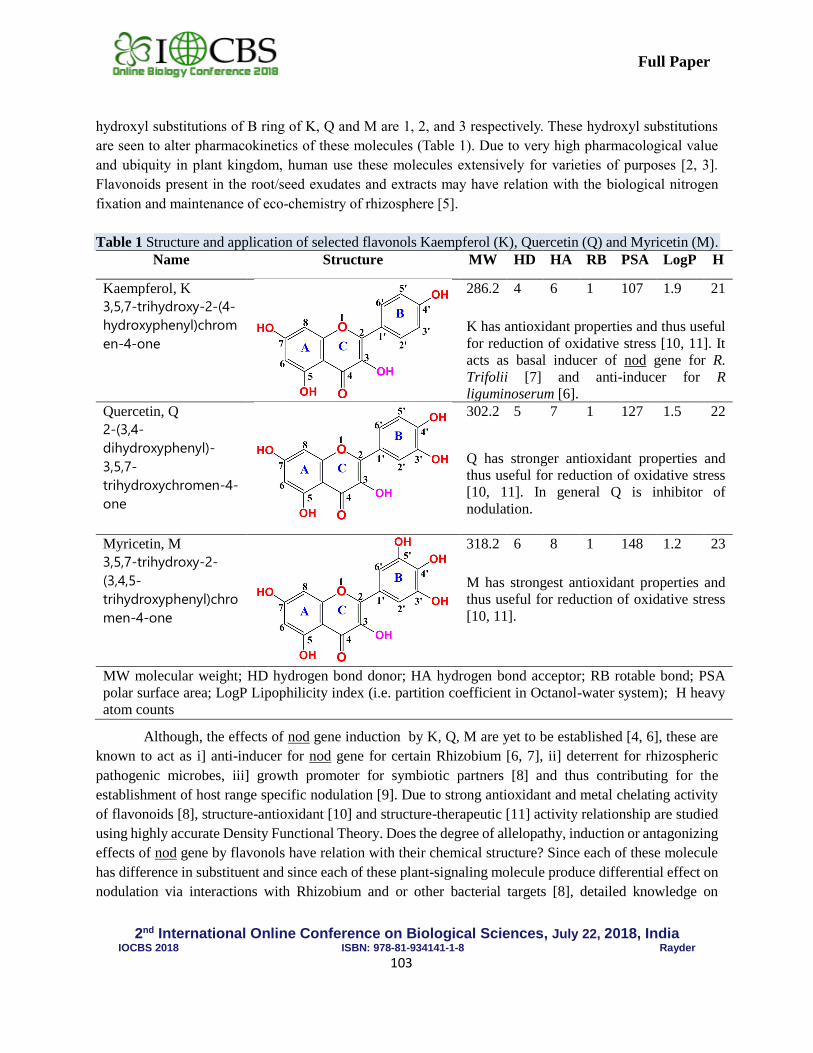
2nd International Online Conference on Biological Sciences, July 22, 2018, India
IOCBS 2018 ISBN: 978-81-934141-1-8 Rayder
103
Full Paper
hydroxyl substitutions of B ring of K, Q and M are 1, 2, and 3 respectively. These hydroxyl substitutions
are seen to alter pharmacokinetics of these molecules (Table 1). Due to very high pharmacological value
and ubiquity in plant kingdom, human use these molecules extensively for varieties of purposes [2, 3].
Flavonoids present in the root/seed exudates and extracts may have relation with the biological nitrogen
fixation and maintenance of eco-chemistry of rhizosphere [5].
Table 1 Structure and application of selected flavonols Kaempferol (K), Quercetin (Q) and Myricetin (M).
Name Structure MW HD HA RB PSA LogP H
Kaempferol, K
3,5,7-trihydroxy-2-(4-
hydroxyphenyl)chrom
en-4-one
286.2 4 6 1 107 1.9 21
K has antioxidant properties and thus useful
for reduction of oxidative stress [10, 11]. It
acts as basal inducer of nod gene for R.
Trifolii [7] and anti-inducer for R
liguminoserum [6].
Quercetin, Q
2-(3,4-
dihydroxyphenyl)-
3,5,7-
trihydroxychromen-4-
one
302.2 5 7 1 127 1.5 22
Q has stronger antioxidant properties and
thus useful for reduction of oxidative stress
[10, 11]. In general Q is inhibitor of
nodulation.
Myricetin, M
3,5,7-trihydroxy-2-
(3,4,5-
trihydroxyphenyl)chro
men-4-one
318.2 6 8 1 148 1.2 23
M has strongest antioxidant properties and
thus useful for reduction of oxidative stress
[10, 11].
MW molecular weight; HD hydrogen bond donor; HA hydrogen bond acceptor; RB rotable bond; PSA
polar surface area; LogP Lipophilicity index (i.e. partition coefficient in Octanol-water system); H heavy
atom counts
Although, the effects of nod gene induction by K, Q, M are yet to be established [4, 6], these are
known to act as i] anti-inducer for nod gene for certain Rhizobium [6, 7], ii] deterrent for rhizospheric
pathogenic microbes, iii] growth promoter for symbiotic partners [8] and thus contributing for the
establishment of host range specific nodulation [9]. Due to strong antioxidant and metal chelating activity
of flavonoids [8], structure-antioxidant [10] and structure-therapeutic [11] activity relationship are studied
using highly accurate Density Functional Theory. Does the degree of allelopathy, induction or antagonizing
effects of nod gene by flavonols have relation with their chemical structure? Since each of these molecule
has difference in substituent and since each of these plant-signaling molecule produce differential effect on
nodulation via interactions with Rhizobium and or other bacterial targets [8], detailed knowledge on
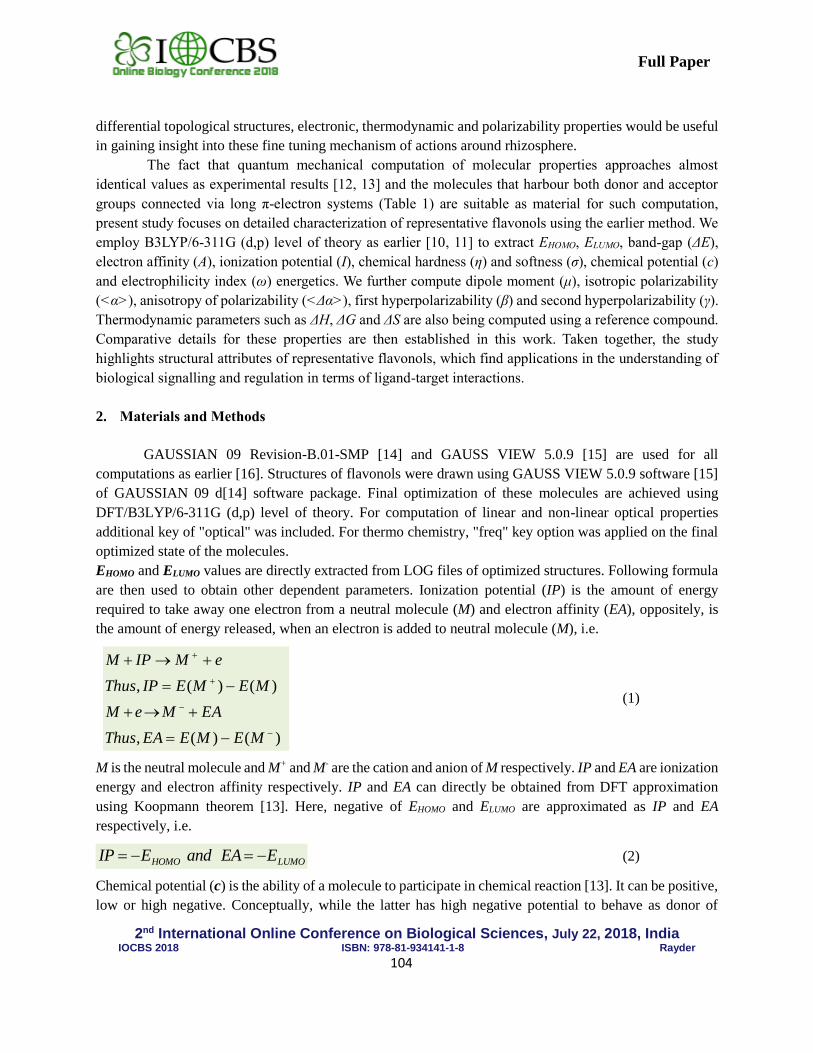
2nd International Online Conference on Biological Sciences, July 22, 2018, India
IOCBS 2018 ISBN: 978-81-934141-1-8 Rayder
104
Full Paper
differential topological structures, electronic, thermodynamic and polarizability properties would be useful
in gaining insight into these fine tuning mechanism of actions around rhizosphere.
The fact that quantum mechanical computation of molecular properties approaches almost
identical values as experimental results [12, 13] and the molecules that harbour both donor and acceptor
groups connected via long π-electron systems (Table 1) are suitable as material for such computation,
present study focuses on detailed characterization of representative flavonols using the earlier method. We
employ B3LYP/6-311G (d,p) level of theory as earlier [10, 11] to extract EHOMO, ELUMO, band-gap (ΔE),
electron affinity (A), ionization potential (I), chemical hardness (η) and softness (σ), chemical potential (c)
and electrophilicity index (ω) energetics. We further compute dipole moment (μ), isotropic polarizability
(<α>), anisotropy of polarizability (<Δα>), first hyperpolarizability (β) and second hyperpolarizability (γ).
Thermodynamic parameters such as ΔH, ΔG and ΔS are also being computed using a reference compound.
Comparative details for these properties are then established in this work. Taken together, the study
highlights structural attributes of representative flavonols, which find applications in the understanding of
biological signalling and regulation in terms of ligand-target interactions.
2. Materials and Methods
GAUSSIAN 09 Revision-B.01-SMP [14] and GAUSS VIEW 5.0.9 [15] are used for all
computations as earlier [16]. Structures of flavonols were drawn using GAUSS VIEW 5.0.9 software [15]
of GAUSSIAN 09 d[14] software package. Final optimization of these molecules are achieved using
DFT/B3LYP/6-311G (d,p) level of theory. For computation of linear and non-linear optical properties
additional key of "optical" was included. For thermo chemistry, "freq" key option was applied on the final
optimized state of the molecules.
EHOMO and ELUMO values are directly extracted from LOG files of optimized structures. Following formula
are then used to obtain other dependent parameters. Ionization potential (IP) is the amount of energy
required to take away one electron from a neutral molecule (M) and electron affinity (EA), oppositely, is
the amount of energy released, when an electron is added to neutral molecule (M), i.e.
)()(,
)()(,
−
−
+
+
−=
+→+
−=
+→+
MEMEEAThus
EAMeM
MEMEIPThus
eMIPM
(1)
M is the neutral molecule and M+ and M- are the cation and anion of M respectively. IP and EA are ionization
energy and electron affinity respectively. IP and EA can directly be obtained from DFT approximation
using Koopmann theorem [13]. Here, negative of EHOMO and ELUMO are approximated as IP and EA
respectively, i.e.
LUMOHOMO EEAandEIP −=−= (2)
Chemical potential (c) is the ability of a molecule to participate in chemical reaction [13]. It can be positive,
low or high negative. Conceptually, while the latter has high negative potential to behave as donor of
2nd International Online Conference on Biological Sciences, July 22, 2018, India
IOCBS 2018 ISBN: 978-81-934141-1-8 Rayder
105
Full Paper
electron, the former is suitable as acceptor of electron. It is one of the very important parameters for the
determination of the reactivity of a molecule [13]. It is referred to as negative of electronegativity (χ), which
is estimated as
+−=
−=
−=
2
EAIPE
N
Ec
vv
(3)
+=
2
EAIP (4)
Further, chemical hardness is another very important parametric concept that allows us to understand the
chemical reactivity of a molecule. It is the slope of the curve of chemical potential, in electronic energy (E)
vs electron number (N) plot. In other words, chemical hardness is the curvature of chemical potential curve.
Physically, it is the resistivity of a molecule against molecular deformation [13]. The values are always
positive. However, lower the value, higher the reactivity of the molecule. It and its reciprocal (chemical
softness) are computed empirically as
( )22
1
2
12
2 EAIP
N
E
N
c
v
−=
=
=
(5)
1= (6)
Global electrophilicity index (ω) has been worked out [13] using the chemical potential (c) and chemical
hardness (η) parameters.
( )
2
2c
= (7)
While dipole moment (μ) is the measure of polarizability of a molecule in its ground state, polarizability is
the intrinsic capacity of a molecule of having dipole, when it is present in weak external electric field. If a
neutral molecule is present in a weak, static electric field (of strength, F), then the total energy (E) of the
molecule can be express as a Taylors series
....!4
1
!3
1
!2
10 −−−−−= FFFFFFFFFFEEF (8)
E0 denotes the energy of the molecule in the absence of external electrical field. Energy (E0), dipole moment
(μα), polarizability (ααβ), first and second .order hyperpolarizability (βαβγ and γαβγδ respectively) denotes the
molecular properties. Polarizability, first and second rank hyperpolarizabilities are expressed as tensor
quantities, whereas subscripts single, double, etc denote first rank, second-rank tensor, etc in Cartesian
coordinate.
Now if the external field lies on any one of the three orthogonal Cartesian axes, then the components of the
induced moments will be parallel to the field. In that case, off diagonal terms of the tensor, ααβ vanishes.
Under this conditions, expected value of isotropic polarizability and dipole moments are obtained as
2nd International Online Conference on Biological Sciences, July 22, 2018, India
IOCBS 2018 ISBN: 978-81-934141-1-8 Rayder
106
Full Paper
(9)
( )3
ZZYYXX
++= (10)
In case of anisotropic orientation of the external field, the anisotropy of the polarizability (<Δα>) can be
computed as
( ) ( ) ( ) ( ) 2
1
222222
2
6
+++−+−+−= YZXYXYZZYYZZYYYYXX
(11)
Similarly first-order (βαβγ) and second-order (γαβγδ) hyperpolarizability are calculated from components of
respective tensors that are obtained from GAUSSIAN output file i.e. LOG file.
21
222
3
1ZYX ++=
(12)
( )
+++=ji
jjijijijjiiii 3
1
(13)
( )
( )
( )
2
1
2
2
2
+++
+++
++
=
ZYYZXXZZZ
YXXYZZYYY
XZZXYYXXX
(14)
5
222 ZZXXYYZZYYXXZZZZYYYYXXXX
+++++= (15)
All these optical terms were calculated using appropriate basis set that contains polarized and diffused
functions for high accuracy, in that DFT/B3LYP/6311G (d,p) was preferred [17].
3. Results
In the present study, comparative characterizations of Kaempferol (K), Quercetin (Q) and
Myricetin (M) are attempted using quantum mechanical methods. These flavonols are present in the root
or seed exudates/extracts and also in other parts of plant [6]. Apigenin, a flavone, which has similar structure
as K except the hydroxyl group at 3 position (Fig. 1), is used as the reference compound, if not mentioned
otherwise. Fig. 1 show ground state optimized structures, HOMO, LUMO orbitals and energy profiles for
these flavonols. Final optimized structures are produced after ~30 cost effective computational steps.
Although, K, Q and M have very similar structures, the ground state stability is seen to follow the order as
M>Q>K (Fig. 1). While HOMO orbitals are seen to be delocalized over C-C bonds of K (Fig. 1, D), Q (Fig.
1, E) and M (Fig. 1, F), the symmetry is much less in Q (Fig. 1, E). LUMO states (Fig. 1, G for K; H for Q
and I for M), on the other hand, are located for all these flavonols. The band gap is highest for K (i.e. 97.3
kcal mol-1), which is followed by M (96.8 kcal mol-1) and Q (87.9 kcal mol-1). Unlike K and M, Q is
stabilized by intra molecular hydrogen bond between H3 and O4 (Fig. 1. B). Multiple hydroxyl groups of
Q and M in B-ring are oriented in energetically most favorable manners (i.e. planner, uniform directionality
( )222
ZYX ++=
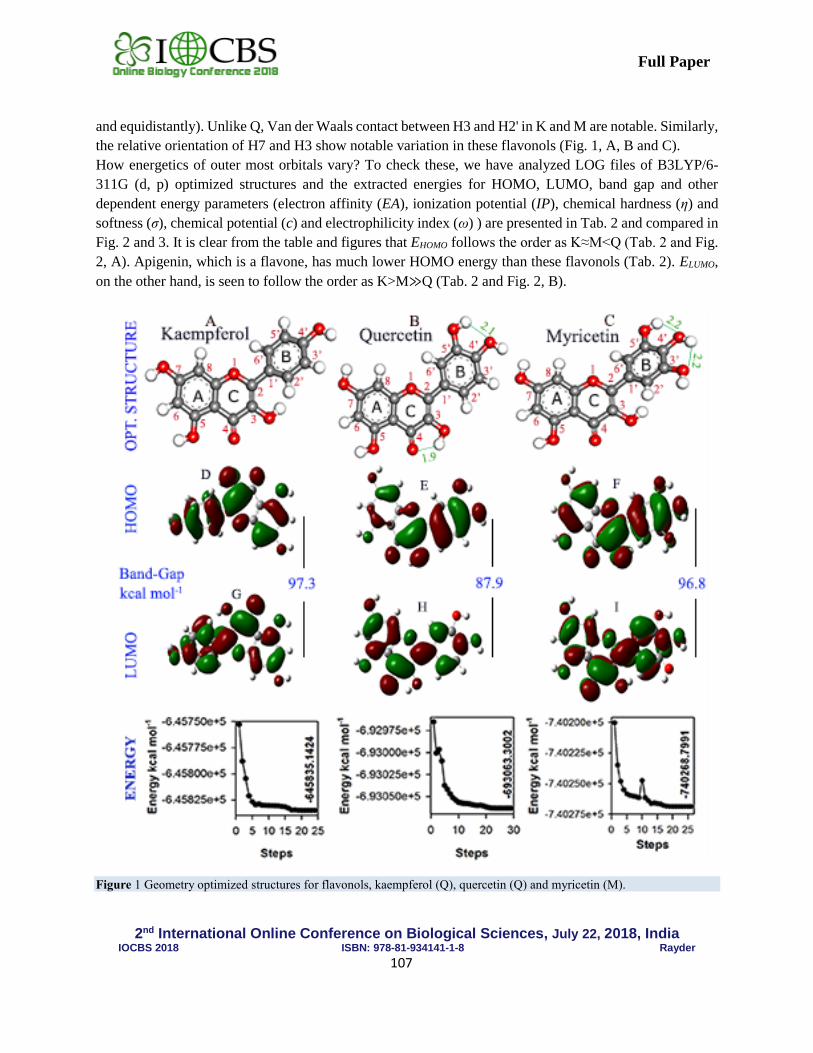
2nd International Online Conference on Biological Sciences, July 22, 2018, India
IOCBS 2018 ISBN: 978-81-934141-1-8 Rayder
107
Full Paper
and equidistantly). Unlike Q, Van der Waals contact between H3 and H2' in K and M are notable. Similarly,
the relative orientation of H7 and H3 show notable variation in these flavonols (Fig. 1, A, B and C).
How energetics of outer most orbitals vary? To check these, we have analyzed LOG files of B3LYP/6-
311G (d, p) optimized structures and the extracted energies for HOMO, LUMO, band gap and other
dependent energy parameters (electron affinity (EA), ionization potential (IP), chemical hardness (η) and
softness (σ), chemical potential (c) and electrophilicity index (ω) ) are presented in Tab. 2 and compared in
Fig. 2 and 3. It is clear from the table and figures that EHOMO follows the order as K≈M<Q (Tab. 2 and Fig.
2, A). Apigenin, which is a flavone, has much lower HOMO energy than these flavonols (Tab. 2). ELUMO,
on the other hand, is seen to follow the order as K>M≫Q (Tab. 2 and Fig. 2, B).
Figure 1 Geometry optimized structures for flavonols, kaempferol (Q), quercetin (Q) and myricetin (M).
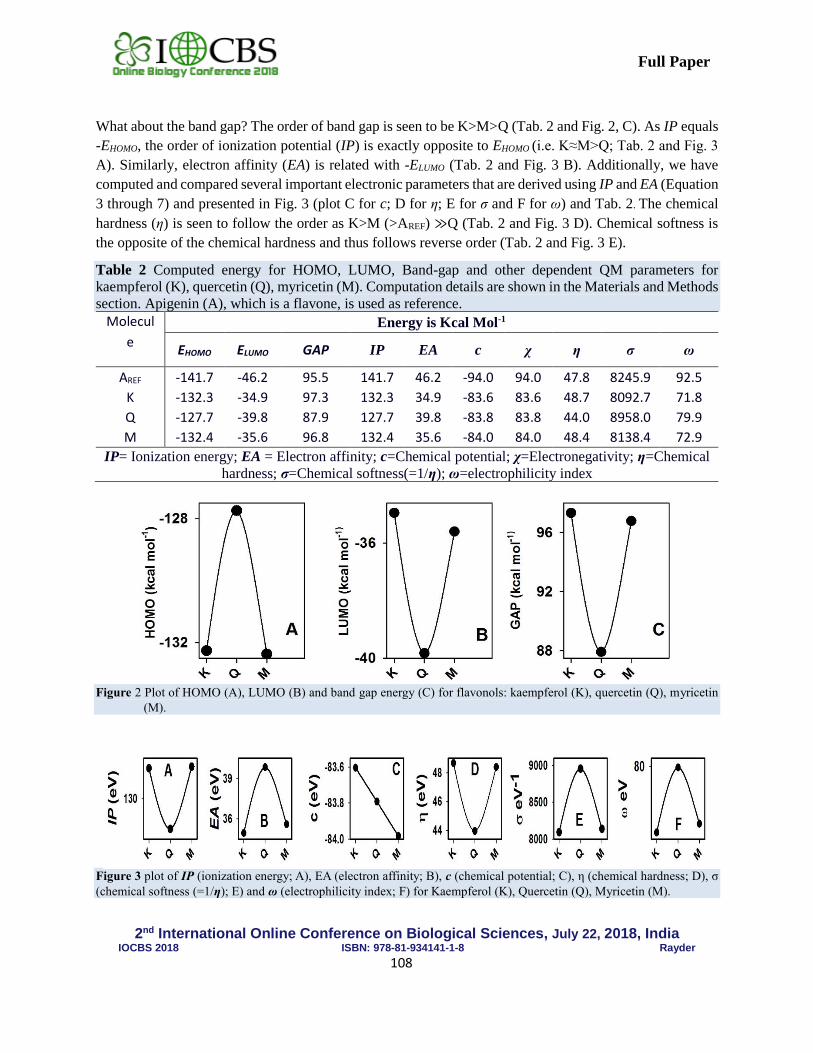
2nd International Online Conference on Biological Sciences, July 22, 2018, India
IOCBS 2018 ISBN: 978-81-934141-1-8 Rayder
108
Full Paper
What about the band gap? The order of band gap is seen to be K>M>Q (Tab. 2 and Fig. 2, C). As IP equals
-EHOMO, the order of ionization potential (IP) is exactly opposite to EHOMO (i.e. K≈M>Q; Tab. 2 and Fig. 3
A). Similarly, electron affinity (EA) is related with -ELUMO (Tab. 2 and Fig. 3 B). Additionally, we have
computed and compared several important electronic parameters that are derived using IP and EA (Equation
3 through 7) and presented in Fig. 3 (plot C for c; D for η; E for σ and F for ω) and Tab. 2. The chemical
hardness (η) is seen to follow the order as K>M (>AREF) ≫Q (Tab. 2 and Fig. 3 D). Chemical softness is
the opposite of the chemical hardness and thus follows reverse order (Tab. 2 and Fig. 3 E).
Table 2 Computed energy for HOMO, LUMO, Band-gap and other dependent QM parameters for
kaempferol (K), quercetin (Q), myricetin (M). Computation details are shown in the Materials and Methods
section. Apigenin (A), which is a flavone, is used as reference.
Molecul
e
Energy is Kcal Mol-1
EHOMO ELUMO GAP IP EA c χ η σ ω
AREF -141.7 -46.2 95.5 141.7 46.2 -94.0 94.0 47.8 8245.9 92.5
K -132.3 -34.9 97.3 132.3 34.9 -83.6 83.6 48.7 8092.7 71.8
Q -127.7 -39.8 87.9 127.7 39.8 -83.8 83.8 44.0 8958.0 79.9
M -132.4 -35.6 96.8 132.4 35.6 -84.0 84.0 48.4 8138.4 72.9
IP= Ionization energy; EA = Electron affinity; c=Chemical potential; χ=Electronegativity; η=Chemical
hardness; σ=Chemical softness(=1/η); ω=electrophilicity index
Figure 2 Plot of HOMO (A), LUMO (B) and band gap energy (C) for flavonols: kaempferol (K), quercetin (Q), myricetin
(M).
Figure 3 plot of IP (ionization energy; A), EA (electron affinity; B), c (chemical potential; C), η (chemical hardness; D), σ
(chemical softness (=1/η); E) and ω (electrophilicity index; F) for Kaempferol (K), Quercetin (Q), Myricetin (M).
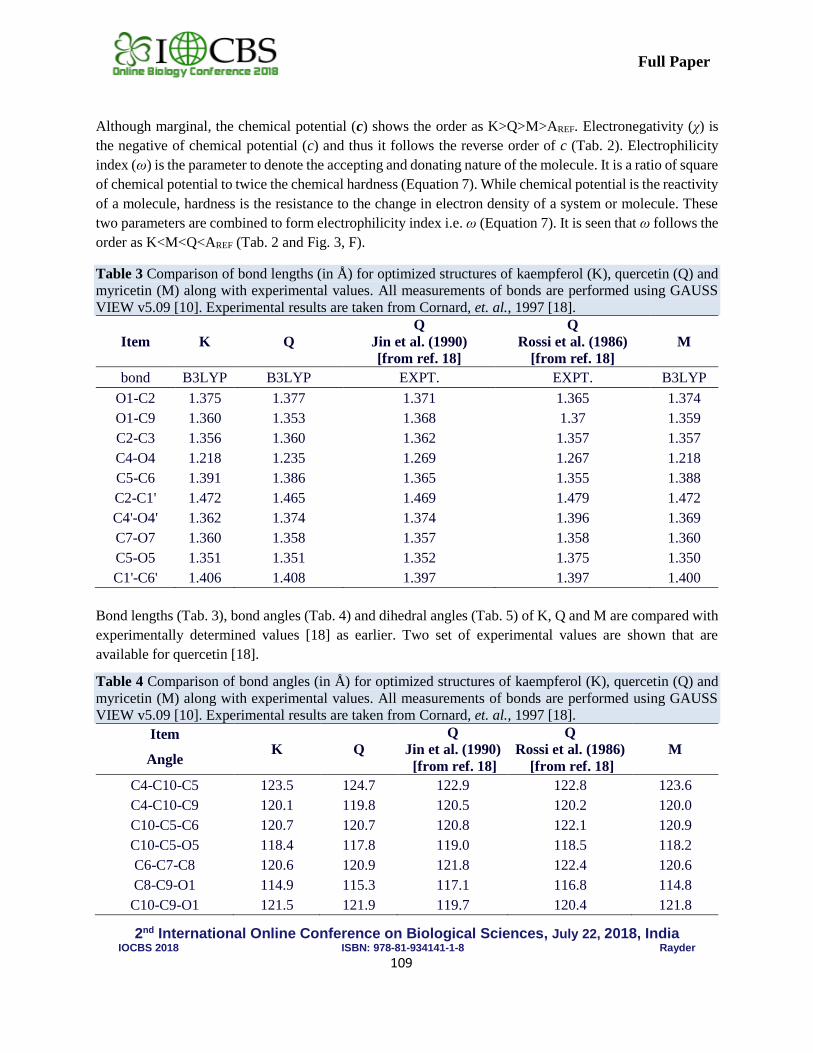
2nd International Online Conference on Biological Sciences, July 22, 2018, India
IOCBS 2018 ISBN: 978-81-934141-1-8 Rayder
109
Full Paper
Although marginal, the chemical potential (c) shows the order as K>Q>M>AREF. Electronegativity (χ) is
the negative of chemical potential (c) and thus it follows the reverse order of c (Tab. 2). Electrophilicity
index (ω) is the parameter to denote the accepting and donating nature of the molecule. It is a ratio of square
of chemical potential to twice the chemical hardness (Equation 7). While chemical potential is the reactivity
of a molecule, hardness is the resistance to the change in electron density of a system or molecule. These
two parameters are combined to form electrophilicity index i.e. ω (Equation 7). It is seen that ω follows the
order as K<M<Q<AREF (Tab. 2 and Fig. 3, F).
Table 3 Comparison of bond lengths (in Å) for optimized structures of kaempferol (K), quercetin (Q) and
myricetin (M) along with experimental values. All measurements of bonds are performed using GAUSS
VIEW v5.09 [10]. Experimental results are taken from Cornard, et. al., 1997 [18].
Item K Q
Q
Jin et al. (1990)
[from ref. 18]
Q
Rossi et al. (1986)
[from ref. 18]
M
bond B3LYP B3LYP EXPT. EXPT. B3LYP
O1-C2 1.375 1.377 1.371 1.365 1.374
O1-C9 1.360 1.353 1.368 1.37 1.359
C2-C3 1.356 1.360 1.362 1.357 1.357
C4-O4 1.218 1.235 1.269 1.267 1.218
C5-C6 1.391 1.386 1.365 1.355 1.388
C2-C1' 1.472 1.465 1.469 1.479 1.472
C4'-O4' 1.362 1.374 1.374 1.396 1.369
C7-O7 1.360 1.358 1.357 1.358 1.360
C5-O5 1.351 1.351 1.352 1.375 1.350
C1'-C6' 1.406 1.408 1.397 1.397 1.400
Bond lengths (Tab. 3), bond angles (Tab. 4) and dihedral angles (Tab. 5) of K, Q and M are compared with
experimentally determined values [18] as earlier. Two set of experimental values are shown that are
available for quercetin [18].
Table 4 Comparison of bond angles (in Å) for optimized structures of kaempferol (K), quercetin (Q) and
myricetin (M) along with experimental values. All measurements of bonds are performed using GAUSS
VIEW v5.09 [10]. Experimental results are taken from Cornard, et. al., 1997 [18].
Item K Q
Q
Jin et al. (1990)
[from ref. 18]
Q
Rossi et al. (1986)
[from ref. 18]
M Angle
C4-C10-C5 123.5 124.7 122.9 122.8 123.6
C4-C10-C9 120.1 119.8 120.5 120.2 120.0
C10-C5-C6 120.7 120.7 120.8 122.1 120.9
C10-C5-O5 118.4 117.8 119.0 118.5 118.2
C6-C7-C8 120.6 120.9 121.8 122.4 120.6
C8-C9-O1 114.9 115.3 117.1 116.8 114.8
C10-C9-O1 121.5 121.9 119.7 120.4 121.8
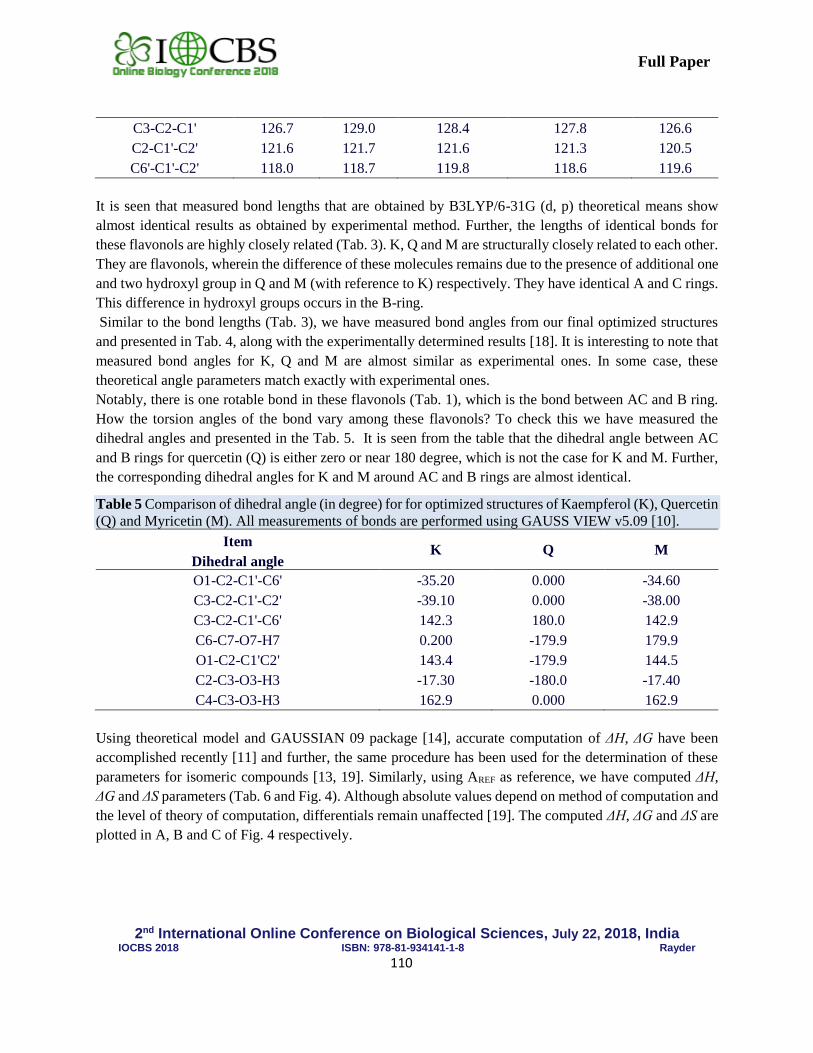
2nd International Online Conference on Biological Sciences, July 22, 2018, India
IOCBS 2018 ISBN: 978-81-934141-1-8 Rayder
110
Full Paper
C3-C2-C1' 126.7 129.0 128.4 127.8 126.6
C2-C1'-C2' 121.6 121.7 121.6 121.3 120.5
C6'-C1'-C2' 118.0 118.7 119.8 118.6 119.6
It is seen that measured bond lengths that are obtained by B3LYP/6-31G (d, p) theoretical means show
almost identical results as obtained by experimental method. Further, the lengths of identical bonds for
these flavonols are highly closely related (Tab. 3). K, Q and M are structurally closely related to each other.
They are flavonols, wherein the difference of these molecules remains due to the presence of additional one
and two hydroxyl group in Q and M (with reference to K) respectively. They have identical A and C rings.
This difference in hydroxyl groups occurs in the B-ring.
Similar to the bond lengths (Tab. 3), we have measured bond angles from our final optimized structures
and presented in Tab. 4, along with the experimentally determined results [18]. It is interesting to note that
measured bond angles for K, Q and M are almost similar as experimental ones. In some case, these
theoretical angle parameters match exactly with experimental ones.
Notably, there is one rotable bond in these flavonols (Tab. 1), which is the bond between AC and B ring.
How the torsion angles of the bond vary among these flavonols? To check this we have measured the
dihedral angles and presented in the Tab. 5. It is seen from the table that the dihedral angle between AC
and B rings for quercetin (Q) is either zero or near 180 degree, which is not the case for K and M. Further,
the corresponding dihedral angles for K and M around AC and B rings are almost identical.
Table 5 Comparison of dihedral angle (in degree) for for optimized structures of Kaempferol (K), Quercetin
(Q) and Myricetin (M). All measurements of bonds are performed using GAUSS VIEW v5.09 [10].
Item K Q M
Dihedral angle
O1-C2-C1'-C6' -35.20 0.000 -34.60
C3-C2-C1'-C2' -39.10 0.000 -38.00
C3-C2-C1'-C6' 142.3 180.0 142.9
C6-C7-O7-H7 0.200 -179.9 179.9
O1-C2-C1'C2' 143.4 -179.9 144.5
C2-C3-O3-H3 -17.30 -180.0 -17.40
C4-C3-O3-H3 162.9 0.000 162.9
Using theoretical model and GAUSSIAN 09 package [14], accurate computation of ΔH, ΔG have been
accomplished recently [11] and further, the same procedure has been used for the determination of these
parameters for isomeric compounds [13, 19]. Similarly, using AREF as reference, we have computed ΔH,
ΔG and ΔS parameters (Tab. 6 and Fig. 4). Although absolute values depend on method of computation and
the level of theory of computation, differentials remain unaffected [19]. The computed ΔH, ΔG and ΔS are
plotted in A, B and C of Fig. 4 respectively.
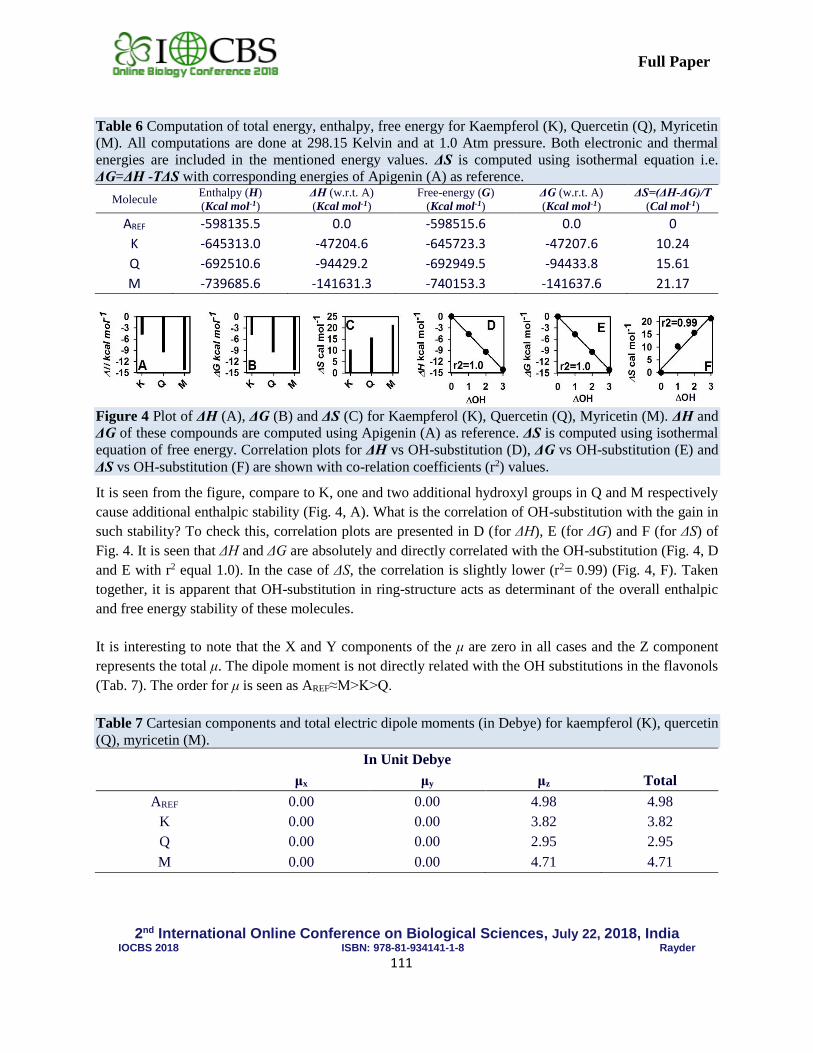
2nd International Online Conference on Biological Sciences, July 22, 2018, India
IOCBS 2018 ISBN: 978-81-934141-1-8 Rayder
111
Full Paper
Table 6 Computation of total energy, enthalpy, free energy for Kaempferol (K), Quercetin (Q), Myricetin
(M). All computations are done at 298.15 Kelvin and at 1.0 Atm pressure. Both electronic and thermal
energies are included in the mentioned energy values. ΔS is computed using isothermal equation i.e.
ΔG=ΔH -TΔS with corresponding energies of Apigenin (A) as reference.
Molecule Enthalpy (H)
(Kcal mol-1)
ΔH (w.r.t. A)
(Kcal mol-1)
Free-energy (G)
(Kcal mol-1)
ΔG (w.r.t. A)
(Kcal mol-1)
ΔS=(ΔH-ΔG)/T
(Cal mol-1) AREF -598135.5 0.0 -598515.6 0.0 0
K -645313.0 -47204.6 -645723.3 -47207.6 10.24
Q -692510.6 -94429.2 -692949.5 -94433.8 15.61
M -739685.6 -141631.3 -740153.3 -141637.6 21.17
Figure 4 Plot of ΔH (A), ΔG (B) and ΔS (C) for Kaempferol (K), Quercetin (Q), Myricetin (M). ΔH and
ΔG of these compounds are computed using Apigenin (A) as reference. ΔS is computed using isothermal
equation of free energy. Correlation plots for ΔH vs OH-substitution (D), ΔG vs OH-substitution (E) and
ΔS vs OH-substitution (F) are shown with co-relation coefficients (r2) values.
It is seen from the figure, compare to K, one and two additional hydroxyl groups in Q and M respectively
cause additional enthalpic stability (Fig. 4, A). What is the correlation of OH-substitution with the gain in
such stability? To check this, correlation plots are presented in D (for ΔH), E (for ΔG) and F (for ΔS) of
Fig. 4. It is seen that ΔH and ΔG are absolutely and directly correlated with the OH-substitution (Fig. 4, D
and E with r2 equal 1.0). In the case of ΔS, the correlation is slightly lower (r2= 0.99) (Fig. 4, F). Taken
together, it is apparent that OH-substitution in ring-structure acts as determinant of the overall enthalpic
and free energy stability of these molecules.
It is interesting to note that the X and Y components of the μ are zero in all cases and the Z component
represents the total μ. The dipole moment is not directly related with the OH substitutions in the flavonols
(Tab. 7). The order for μ is seen as AREF≈M>K>Q.
Table 7 Cartesian components and total electric dipole moments (in Debye) for kaempferol (K), quercetin
(Q), myricetin (M).
In Unit Debye μx μy μz Total
AREF 0.00 0.00 4.98 4.98
K 0.00 0.00 3.82 3.82
Q 0.00 0.00 2.95 2.95
M 0.00 0.00 4.71 4.71
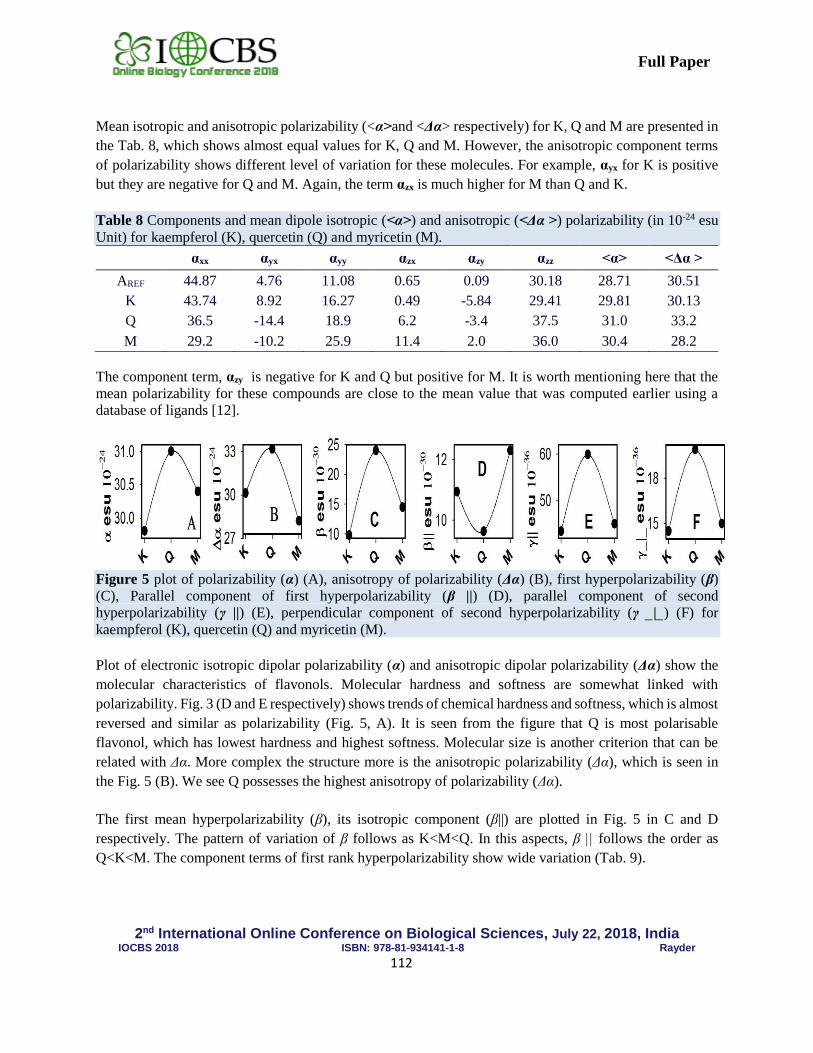
2nd International Online Conference on Biological Sciences, July 22, 2018, India
IOCBS 2018 ISBN: 978-81-934141-1-8 Rayder
112
Full Paper
Mean isotropic and anisotropic polarizability (<α>and <Δα> respectively) for K, Q and M are presented in
the Tab. 8, which shows almost equal values for K, Q and M. However, the anisotropic component terms
of polarizability shows different level of variation for these molecules. For example, αyx for K is positive
but they are negative for Q and M. Again, the term αzx is much higher for M than Q and K.
Table 8 Components and mean dipole isotropic (<α>) and anisotropic (<Δα >) polarizability (in 10-24 esu
Unit) for kaempferol (K), quercetin (Q) and myricetin (M). αxx αyx αyy αzx αzy αzz <α> <Δα >
AREF 44.87 4.76 11.08 0.65 0.09 30.18 28.71 30.51
K 43.74 8.92 16.27 0.49 -5.84 29.41 29.81 30.13
Q 36.5 -14.4 18.9 6.2 -3.4 37.5 31.0 33.2
M 29.2 -10.2 25.9 11.4 2.0 36.0 30.4 28.2
The component term, αzy is negative for K and Q but positive for M. It is worth mentioning here that the
mean polarizability for these compounds are close to the mean value that was computed earlier using a
database of ligands [12].
Figure 5 plot of polarizability (α) (A), anisotropy of polarizability (Δα) (B), first hyperpolarizability (β)
(C), Parallel component of first hyperpolarizability (β ||) (D), parallel component of second
hyperpolarizability (γ ||) (E), perpendicular component of second hyperpolarizability (γ _|_) (F) for
kaempferol (K), quercetin (Q) and myricetin (M).
Plot of electronic isotropic dipolar polarizability (α) and anisotropic dipolar polarizability (Δα) show the
molecular characteristics of flavonols. Molecular hardness and softness are somewhat linked with
polarizability. Fig. 3 (D and E respectively) shows trends of chemical hardness and softness, which is almost
reversed and similar as polarizability (Fig. 5, A). It is seen from the figure that Q is most polarisable
flavonol, which has lowest hardness and highest softness. Molecular size is another criterion that can be
related with Δα. More complex the structure more is the anisotropic polarizability (Δα), which is seen in
the Fig. 5 (B). We see Q possesses the highest anisotropy of polarizability (Δα).
The first mean hyperpolarizability (β), its isotropic component (β||) are plotted in Fig. 5 in C and D
respectively. The pattern of variation of β follows as K<M<Q. In this aspects, β || follows the order as
Q<K<M. The component terms of first rank hyperpolarizability show wide variation (Tab. 9).
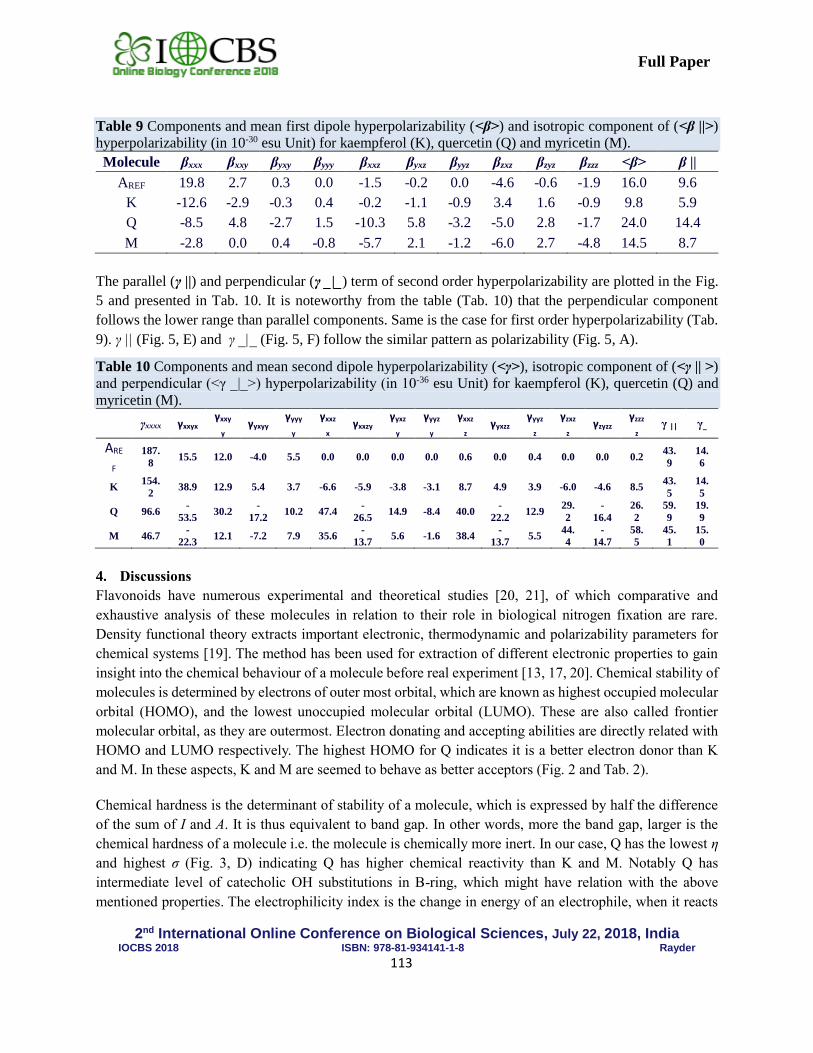
2nd International Online Conference on Biological Sciences, July 22, 2018, India
IOCBS 2018 ISBN: 978-81-934141-1-8 Rayder
113
Full Paper
Table 9 Components and mean first dipole hyperpolarizability (<β>) and isotropic component of (<β ||>)
hyperpolarizability (in 10-30 esu Unit) for kaempferol (K), quercetin (Q) and myricetin (M).
Molecule βxxx βxxy βyxy βyyy βxxz βyxz βyyz βzxz βzyz βzzz <β> β ||
AREF 19.8 2.7 0.3 0.0 -1.5 -0.2 0.0 -4.6 -0.6 -1.9 16.0 9.6
K -12.6 -2.9 -0.3 0.4 -0.2 -1.1 -0.9 3.4 1.6 -0.9 9.8 5.9
Q -8.5 4.8 -2.7 1.5 -10.3 5.8 -3.2 -5.0 2.8 -1.7 24.0 14.4
M -2.8 0.0 0.4 -0.8 -5.7 2.1 -1.2 -6.0 2.7 -4.8 14.5 8.7
The parallel (γ ||) and perpendicular (γ _|_) term of second order hyperpolarizability are plotted in the Fig.
5 and presented in Tab. 10. It is noteworthy from the table (Tab. 10) that the perpendicular component
follows the lower range than parallel components. Same is the case for first order hyperpolarizability (Tab.
9). γ || (Fig. 5, E) and γ _|_ (Fig. 5, F) follow the similar pattern as polarizability (Fig. 5, A).
Table 10 Components and mean second dipole hyperpolarizability (<γ>), isotropic component of (<γ || >)
and perpendicular (<γ _|_>) hyperpolarizability (in 10-36 esu Unit) for kaempferol (K), quercetin (Q) and
myricetin (M).
γxxxx γxxyx γxxy
y γyxyy
γyyy
y γxxz
x γxxzy
γyxz
y γyyz
y γxxz
z γyxzz
γyyz
z γzxz
z γzyzz
γzzz
z γ || γ_
ARE
F
187.
8 15.5 12.0 -4.0 5.5 0.0 0.0 0.0 0.0 0.6 0.0 0.4 0.0 0.0 0.2
43.
9
14.
6
K 154.
2 38.9 12.9 5.4 3.7 -6.6 -5.9 -3.8 -3.1 8.7 4.9 3.9 -6.0 -4.6 8.5
43.
5
14.
5
Q 96.6 -
53.5 30.2
-
17.2 10.2 47.4
-
26.5 14.9 -8.4 40.0
-
22.2 12.9
29.
2
-
16.4
26.
2
59.
9
19.
9
M 46.7 -
22.3 12.1 -7.2 7.9 35.6
-
13.7 5.6 -1.6 38.4
-
13.7 5.5
44.
4
-
14.7
58.
5
45.
1
15.
0
4. Discussions
Flavonoids have numerous experimental and theoretical studies [20, 21], of which comparative and
exhaustive analysis of these molecules in relation to their role in biological nitrogen fixation are rare.
Density functional theory extracts important electronic, thermodynamic and polarizability parameters for
chemical systems [19]. The method has been used for extraction of different electronic properties to gain
insight into the chemical behaviour of a molecule before real experiment [13, 17, 20]. Chemical stability of
molecules is determined by electrons of outer most orbital, which are known as highest occupied molecular
orbital (HOMO), and the lowest unoccupied molecular orbital (LUMO). These are also called frontier
molecular orbital, as they are outermost. Electron donating and accepting abilities are directly related with
HOMO and LUMO respectively. The highest HOMO for Q indicates it is a better electron donor than K
and M. In these aspects, K and M are seemed to behave as better acceptors (Fig. 2 and Tab. 2).
Chemical hardness is the determinant of stability of a molecule, which is expressed by half the difference
of the sum of I and A. It is thus equivalent to band gap. In other words, more the band gap, larger is the
chemical hardness of a molecule i.e. the molecule is chemically more inert. In our case, Q has the lowest η
and highest σ (Fig. 3, D) indicating Q has higher chemical reactivity than K and M. Notably Q has
intermediate level of catecholic OH substitutions in B-ring, which might have relation with the above
mentioned properties. The electrophilicity index is the change in energy of an electrophile, when it reacts
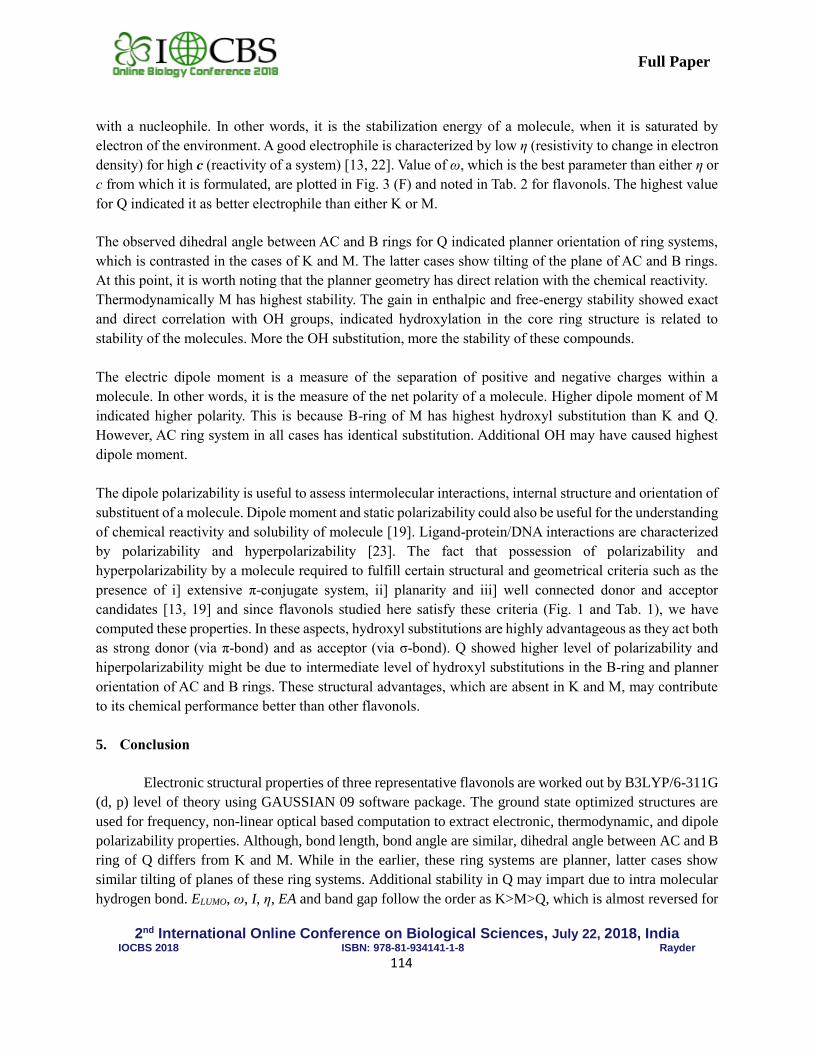
2nd International Online Conference on Biological Sciences, July 22, 2018, India
IOCBS 2018 ISBN: 978-81-934141-1-8 Rayder
114
Full Paper
with a nucleophile. In other words, it is the stabilization energy of a molecule, when it is saturated by
electron of the environment. A good electrophile is characterized by low η (resistivity to change in electron
density) for high c (reactivity of a system) [13, 22]. Value of ω, which is the best parameter than either η or
c from which it is formulated, are plotted in Fig. 3 (F) and noted in Tab. 2 for flavonols. The highest value
for Q indicated it as better electrophile than either K or M.
The observed dihedral angle between AC and B rings for Q indicated planner orientation of ring systems,
which is contrasted in the cases of K and M. The latter cases show tilting of the plane of AC and B rings.
At this point, it is worth noting that the planner geometry has direct relation with the chemical reactivity.
Thermodynamically M has highest stability. The gain in enthalpic and free-energy stability showed exact
and direct correlation with OH groups, indicated hydroxylation in the core ring structure is related to
stability of the molecules. More the OH substitution, more the stability of these compounds.
The electric dipole moment is a measure of the separation of positive and negative charges within a
molecule. In other words, it is the measure of the net polarity of a molecule. Higher dipole moment of M
indicated higher polarity. This is because B-ring of M has highest hydroxyl substitution than K and Q.
However, AC ring system in all cases has identical substitution. Additional OH may have caused highest
dipole moment.
The dipole polarizability is useful to assess intermolecular interactions, internal structure and orientation of
substituent of a molecule. Dipole moment and static polarizability could also be useful for the understanding
of chemical reactivity and solubility of molecule [19]. Ligand-protein/DNA interactions are characterized
by polarizability and hyperpolarizability [23]. The fact that possession of polarizability and
hyperpolarizability by a molecule required to fulfill certain structural and geometrical criteria such as the
presence of i] extensive π-conjugate system, ii] planarity and iii] well connected donor and acceptor
candidates [13, 19] and since flavonols studied here satisfy these criteria (Fig. 1 and Tab. 1), we have
computed these properties. In these aspects, hydroxyl substitutions are highly advantageous as they act both
as strong donor (via π-bond) and as acceptor (via σ-bond). Q showed higher level of polarizability and
hiperpolarizability might be due to intermediate level of hydroxyl substitutions in the B-ring and planner
orientation of AC and B rings. These structural advantages, which are absent in K and M, may contribute
to its chemical performance better than other flavonols.
5. Conclusion
Electronic structural properties of three representative flavonols are worked out by B3LYP/6-311G
(d, p) level of theory using GAUSSIAN 09 software package. The ground state optimized structures are
used for frequency, non-linear optical based computation to extract electronic, thermodynamic, and dipole
polarizability properties. Although, bond length, bond angle are similar, dihedral angle between AC and B
ring of Q differs from K and M. While in the earlier, these ring systems are planner, latter cases show
similar tilting of planes of these ring systems. Additional stability in Q may impart due to intra molecular
hydrogen bond. ELUMO, ω, I, η, EA and band gap follow the order as K>M>Q, which is almost reversed for
2nd International Online Conference on Biological Sciences, July 22, 2018, India
IOCBS 2018 ISBN: 978-81-934141-1-8 Rayder
115
Full Paper
σ and EHOMO. It therefore seems the orientation of rings, substituent in them and their intra molecular
stabilization act as determinant for these properties. Q possesses intra molecular hydrogen bond.
Thermodynamic stability of flavonols follow M>Q>K, which is due to additional OH substitutions in rings.
Polarizability (α), anisotropy of polarizability (Δα), β, γ|| and γ_|_ show the similar trends in that Q has the
highest with K and M have comparable lower values. The study highlights differential electronic properties
of flavonol, which seems to have relation with their chemical reactivity with other cellular targets.
Acknowledgement
Authors are thankful for the computational facility laboratory of the Department of Biotechnology, The
University of Burdwan. Sincere thanks are also due for Prof. Anirban Misra and Mr. Monaj Mazumdar,
Department of Chemistry, The North Bengal University for the Gaussian Software and critical discussions
for the work.
References
[1] M Calderon-Montano J, Burgos-Morón E, Pérez-Guerrero C, López-Lázaro M. A review on the dietary flavonoid kaempferol.
Mini reviews in medicinal chemistry. 2011 Apr 1;11(4):298-344.
[2] Gunawardena D, Govindaraghavan S, Münch G. Anti-inflammatory properties of cinnamon polyphenols and their monomeric
precursors. In Polyphenols in Human Health and Disease 2014 (pp. 409-425).
[3] Hämäläinen M, Nieminen R, Vuorela P, Heinonen M, Moilanen E. Anti-inflammatory effects of flavonoids: genistein,
kaempferol, quercetin, and daidzein inhibit STAT-1 and NF-κB activations, whereas flavone, isorhamnetin, naringenin, and
pelargonidin inhibit only NF-κB activation along with their inhibitory effect on iNOS expression and NO production in
activated macrophages. Mediators of inflammation. 2007;2007.
[4] Djordjevic MA, Redmond JW, Batley M, Rolfe BG. Clovers secrete specific phenolic compounds which either stimulate or
repress nod gene expression in Rhizobium trifolii. The EMBO journal. 1987 May 1; 6(5):1173-9.
[5] Cushnie TT, Lamb AJ. Antimicrobial activity of flavonoids. International journal of antimicrobial agents. 2005
Nov 1;26(5):343-56.
[6] Reddy PM, Rendón-Anaya M, Soto del Río MD, Khandual S. Flavonoids as signaling molecules and regulators of
root nodule development. Dyn Soil Dyn Plant. 2007;1(2):83-94.
[7] Firmin JL, Wilson KE, Rossen L, Johnston AW. Flavonoid activation of nodulation genes in Rhizobium reversed
by other compounds present in plants. Nature. 1986 Nov;324(6092):90.
[8] Mierziak J, Kostyn K, Kulma A. Flavonoids as important molecules of plant interactions with the environment.
Molecules. 2014 Oct 10;19(10):16240-65.
[9] Dénarié J, Debelle F, Rosenberg C. Signaling and host range variation in nodulation. Annual reviews in
Microbiology. 1992 Oct;46(1):497-531.
[10] Houngue MK, Doco RC, Kpotin GA, Kuevi UA, Simplice K, Wilfried K, Atohoun YG, Mensah JB. DFT study of
chemical reactivity of free radicals ABTS°+ and DPPH° by Myricetin, Quercetin and Kaempferol. World Scientific
News. 2017;90:177-88.
[11] Avi MD, García AÁ, Ureña FP. Electronic structure of kaempferol–Cu 2+ coordination compounds: a DFT, QTAIM
and NBO study in the gas phase. Theoretical Chemistry Accounts. 2015 Apr 1;134(4):52.
[12] Matuszek AM, Reynisson J. Defining Known Drug Space Using DFT. Molecular informatics. 2016 Feb 1;35(2):46-
53.
[13] Pearson RG. The electronic chemical potential and chemical hardness. Journal of Molecular Structure:
THEOCHEM. 1992 Mar 24;255:261-70.

2nd International Online Conference on Biological Sciences, July 22, 2018, India
IOCBS 2018 ISBN: 978-81-934141-1-8 Rayder
116
Full Paper
[14] Frisch MJ, Trucks GW, Schlegel HB, Scuseria GE, Robb MA, Cheeseman JR, Scalmani G, Barone V, Mennucci
B, Petersson GA, Nakatsuji H. Gaussian 09, Revision A. 02; Gaussian, Inc: Wallingford, CT, 2009. Google Scholar.
2015 Oct.
[15] Dennington RD, Keith TA, Millam JM. Gauss View 5.0, Wallingford, CT.
[16] Ansary I, Das A, Sen Gupta PS, Bandyopadhyay AK. Synthesis, molecular modeling of N-acyl benzoazetinones
and their docking simulation on fungal modeled target. Synthetic Communications. 2017 Aug 3;47(15):1375-86.
[17] Nagabalasubramanian PB, Karabacak M, Periandy S. Molecular structure, polarizability, hyperpolarizability
analysis and spectroscopic characterization of 1-(chloromethyl)-2-methylnaphthalene with experimental (FT-IR
and FT-Raman) techniques and quantum chemical calculations. Spectrochimica Acta Part A: Molecular and
Biomolecular Spectroscopy. 2012 Jan 1;85(1):43-52.
[18] Cornard JP, Merlin JC, Boudet AC, Vrielynck L. Structural study of quercetin by vibrational and electronic
spectroscopies combined with semiempirical calculations. Biospectroscopy. 1997;3(3):183-93.
[19] Salter C, Foresman JB. Naphthalene and azulene I: Semimicro bomb calorimetry and quantum mechanical
calculations. Journal of chemical education. 1998 Oct;75(10):1341.
[20] Lolli G, Cozza G, Mazzorana M, Tibaldi E, Cesaro L, Donella-Deana A, Meggio F, Venerando A, Franchin C,
Sarno S, Battistutta R. Inhibition of protein kinase CK2 by flavonoids and tyrphostins. A structural insight.
Biochemistry. 2012 Jul 25;51(31):6097-107.
[21] Middleton E, Kandaswami C, Theoharides TC. The effects of plant flavonoids on mammalian cells: implications
for inflammation, heart disease, and cancer. Pharmacological reviews. 2000 Dec 1;52(4):673-751.
[22] Eşme A, Sağdınç SG. The linear, nonlinear optical properties and quantum chemical parameters of some sudan
dyes. Balıkesir Üniversitesi Fen Bilimleri Enstitüsü Dergisi. 2016 Jun 14;16(1):47-75.
[23] Hansch C, Steinmetz WE, Leo AJ, Mekapati SB, Kurup A, Hoekman D. On the Role of Polarizability in Chemical−
Biological Interactions. Journal of chemical information and computer sciences. 2003 Jan 27;43(1):120-5.
2nd International Online Conference on Biological Sciences, July 22, 2018, India
IOCBS 2018 ISBN: 978-81-934141-1-8 Rayder
117
Full Paper
Assessing the bacterial composition of fresh water from Gobindsagar
reservoir using next generation sequencing
Archana Chauhan1*, Taruna Arora, Phuntsog Dolma1, Namita, Ahmad Ali1
1Department of Zoology, Panjab University, Sector 14, Chandigarh, 160014
*Corresponding email: [email protected]
Abstract
Background: Microbiome is an integral part of the freshwater microbiota. Continuous inputs of domestic
waste, sewage, industrial and agricultural effluents into the freshwater bodies are the leading cause for their
deterioration, which may further lead to collapsing of these ecosystems. The resident bacterial communities
of the freshwater ecosystems play a central role in many hydrological and biogeochemical cycles, thereby
providing critical ecosystem services to humankind. The current study was carried out at Gobindsagar
reservoir made on river Sutlej, Himachal Pradesh, India to examine the influence of the microflora of water.
Materials and Methods: DNA was extracted from water samples and quality checked by PCR amplifying
the 16S rRNA gene from the isolated DNA. 2× 150 bp microbiome sequencing was carried out on NGS
illumina MiSeq platform. Raw data was received in FASTQ file format. Analysis included quality check
of raw data, chimeric sequence identification and filtration, OTU identification, taxonomic assignment of
identified OTUs, normalization of OTUs and identification of core microbial population. All the above
mentioned analysis was performed using iOMICSTM work-flow.
Results: The analysis of the water quality parameters shows that the temperature, pH, turbidity, TDS,
alkalinity and hardness were found to be well within the permissible range. The high BOD value is due to
the anthropogenic activities and the microbial activity in the water.
Conclusion: The analyses clearly show the presence of phyla Firmicutes, Proteobacteria, Actinobacteria,
Bacteriodetes, Cyanobacteria, Fusobacteria and Verrumicrobia in the water sample. Phylum-based analyses
have certainly proven useful as an initial assessment of the types and abundances of bacteria that may be
present in an environment and as a way to broadly partition the drivers and functions of bacterial taxa in
their particular environments. The results of this study demonstrate that deep amplicon sequencing of the
16S rRNA marker gene using NGS methods could be a valuable tool for many applications in water quality
monitoring.
Keywords: Microbiome, Illumina sequencing, bacteria, 16S rRNA.
1. Introduction
Water is one of the most abundantly available compounds on earth. It is the principle natural resource
and a valuable national asset, which is very crucial for endurance of life on earth. Over 70% of the earth’s
surface materials consist of water in which 3% is fresh water and remaining is salt water. According to
World Water Council (2005) out of 3% fresh water, only 0.3% water is found in rivers, groundwater and
lakes and rest fresh water is locked up in glaciers and polar ice caps [41]. Among the various fresh water
2nd International Online Conference on Biological Sciences, July 22, 2018, India
IOCBS 2018 ISBN: 978-81-934141-1-8 Rayder
118
Full Paper
resources, rivers are of great importance to mankind. The earliest civilizations (for e.g. River Nile in Egypt,
Euphrates in ancient Mesopotamia and Indus in India) sprang up near the perennial river system where
continuous water supply and adequate warmth were assured. Even today most of the development has taken
place in the cities or areas located nearby the rivers. Modern civilization is dependent on water for irrigation,
industry, agriculture, commercial, aquaculture, domestic needs and increasing importance for sanitation and
disposal of waste. Therefore, quality of the fresh water plays an important role in maintaining the health of
all living organisms [30]. [11] documented that the life of aquatic ecosystem directly or indirectly depends
upon the water quality.
Due to the rapid increase of industrialization, urbanization, and population in the last few decades have
caused a dramatic increase in the demand for river water, as well as significant deteriorations in water
quality throughout the world [1] [26] [24]. The water quality is affected by human activities, organic
materials, trace elements (heavy metals), acidic atmospheric deposition and runoff, salinization, nutrients
runoff (primarily nitrogen and phosphorus), oil and grease, synthetic organic compounds, thermal pollution
and radioactivity [25][16][29][33][6].
The quality of any water is governed by various physiochemical and biological properties prevailing in
the water body and the assessment of these characteristics is vital for both long term and short analysis [43].
The interactions of both the physical and chemical properties of water play a significant role in composition,
distribution and abundance of aquatic organisms [28]. Fresh water habitats contain representatives of many
of the groups of organisms on earth. Plants, animals and microbes interact with the environment to alter
water quality and perform ecological services such as decomposition and nutrient cycling. Biodiversity of
invertebrates, microbes and fishes can be used to indicate chronic pollution problems.
2. Metagenomic Analysis
Metagenomics is a functional and sequence-based analysis of the collective microbial genomes that are
contained in an environmental sample [35][32][39][14]. By directly accessing the collective genome of co-
occurring microbes, metagenomics has the potential to give a comprehensive view of the genetic diversity,
species composition, evolution, and interactions with the environment of natural microbial communities
[17][36]. Environmental metagenomic libraries have proved to be great resources for new microbial
enzymes with potential applications in biotechnology, medicine, and industry [31]. Metagenomics enables
the study of microorganisms in their natural environment, by whole genome sequencing or Amplicon
Sequencing. Amplicon sequencing is a highly targeted approach for analyzing genetic variation in specific
genomic regions. The ultra deep sequencing of PCR products (amplicons) allows efficient variant
identification and characterization. Amplicon Sequencing of the bacterial 16S rRNA gene across multiple
species is a widely used method for phylogeny and taxonomic studies, particularly in diverse metagenomic
samples.
3. Material and Methods
Site selection and sampling
The present study was conducted on Gobindsagar reservoir on Satluj river which is a manmade
reservoir created by the Bhakra dam. It is a concrete gravity dam across the Satluj river in Bilaspur. The
dam located at the gorge near the upstream Bhakra village in Bilaspur district of Himachal Pradesh of 226m.
2nd International Online Conference on Biological Sciences, July 22, 2018, India
IOCBS 2018 ISBN: 978-81-934141-1-8 Rayder
119
Full Paper
Water samples were collected from Gobindsagar reservoir in the month of October 2015. On each site
sampling was done from 5 different points spanning different areas. The sampling points were chosen
judiciously so that they represent different parts of the reservoir i.e. bank, a little distance from bank and at
the center of the reservoir. The samples were stored in ice at 4oC for further analysis
Physiochemical analysis and filtration of water
Physiochemical analyses of water were analyzed according to the standard methods [40][3].
Physiochemical analyses like temperature, pH, electrical conductivity (EC), salinity, total dissolved solids
(TDS) and turbidity were measured electrometrically. Fixation of dissolved oxygen was made on the spot.
For the analysis of rest of the parameters and molecular analysis 6 liters of water collected as discussed
above was brought to the laboratory. It was analyzed for biological oxygen demand (BOD), total alkalinity
and total hardness. The details of analytical methods and equipments used in the study are given in the table
1. Water was filtered using the vacuum water filtration assembly (Millipore, USA).
The amplification of 16S rRNA
DNA from water samples was isolated using manual FastDNATM SPIN Kit (MP Biomedicals, USA)
according to the manufacturer’s protocol with slight modification. Although the kit is designed for use with
the FastPrep® Instruments from MP Biomedicals, but due to non-availability of this instrument in
Chandigarh we have lysed the samples by vortexing. Isolated DNA was purified using manual DNA Clean
and ConcentratorTM-5 kit (Zymo Research Corp., USA). Quantity and quality of the extracted DNA was
carried out by UV spectroscopy and agarose gel electrophoresis respectively.
The DNA samples were subjected to PCR amplification of the part of prokaryotic16SrRNA gene.
Prokaryotic 16SrRNA gene universal primers, Forward primer (27F) AGAGTTTGATCMTGGCTCAG and
Reverse primer (1492R) TACGGYTACCTTGTTACGACTT was used under the following condition 5 min
of initial denaturation at 95ºC; 35 cycles of 95ºC for 45 s, 55ºC for 30 s and 72ºC for 120 s; and the final
extension at 72ºC for 10 min.
NGS amplicon library preparation and quantitation
DNA of the water samples was pooled to increase the concentration. The pooled DNA was
quantified using Qubit fluorometer. The assay is highly selected for dsDNA and is accurate for initial sample
concentration from 100pg/µl to1000ng/µl. Illumina libraries were prepared as per the recommended
protocol for library construction (Nextera XT DNA kit, Illumina, Inc., San Diego, CA, USA). The primers
used to amplify the 16SrRNA V3-V4 region were (Forward primer TCCGTAGGTGAACCTGCGG and
Reverse Primer TCCTCCGCTTATTGTAT) with standard Illumina barcodes and adapters. The PCR
amplicon is further purified using Ampure XP beads (Beckman Coulter, USA). The barcoded libraries were
validated by Agilent DNA HS (High Sensitivity) Bioanalyzer (Agilent, USA). The Agilent high sensitivity
DNA kit for the Agilent 2100 Bioanalyzer offers improved sensitivity for checking the size and quantity of
low concentrated DNA samples. The purified library was quantified using Qubit DNA BR (Broad Range)
reagent.
2nd International Online Conference on Biological Sciences, July 22, 2018, India
IOCBS 2018 ISBN: 978-81-934141-1-8 Rayder
120
Full Paper
NGS sequencing on Illumina MiSeq platform
The amplicon library prepared was sequenced at Interproteomics, Bangalore on MiSeq platform.
2x250 bp paired end sequencing was carried out.
Statistical analysis
Raw data was received in FASTQ file format. Analysis included quality check of raw data,
Chimeric sequence identification and filtration, OTU identification, taxonomic assignment of identified
OTUs, normalization of OTUs and identification of core microbial population analysis were performed
using iOMICSTM workflow. Quality check of raw FASTQ files such as sequence quality, per sequence GC
content, duplication level were performed for all the samples with the help of FASTQC software. In
addition, information such as total number of reads, file size, percentage of A,T,G,C,N present, number of
reads with at least one N, dinucleotide percentage etc, were also extracted from raw FASTQ files for better
understanding of the sample.
In order to reduce the computational time required for the analysis, paired end reads of each sample
were joined to produce contigs based upon the overlapping nucleotides in each pair [15]. During the
processing of the raw reads the chimeric sequences were identified by similarity based cluster method using
Greengenes database [2] [http://greengeness.lbl.gov]) and were filtered out. A total of 8734 sequences are
identified as chimeras. These filtered sequences were clustered into OTUs based on >97% similarity using
‘UCLUST’ method [13]. The identified OTUs were aligned against the 16S rRNA database (Greengenes
database) of Bacteria and Archaea for taxonomic assignment.
To removes discrepancies due to low read abundance and transforms the data for uniform coverage
between the samples. ‘Cumulative Sum Scaling’ (CSS) algorithm [8][12] was used to normalize the data.
This algorithm corrects the bias in the assessment of OTU abundance and controls the variance within the
groups.
The raw sequences generated from the present study have been submitted to National Centre for
Biotechnology information (NCBI) Sequence Read Archive (SRA) database under the Bioproject ID:
PRJNA321127.
4. Results and Discussions
To determine the suitability of water, it is tested for various parameters which include the
physiochemical and the microbiological parameters. Very little work has been done on the water quality of
Gobindsagar reservoir on river Sutlej [15]. Keeping this in view, present investigations have been
undertaken to assess the water quality through physiochemical parameters and bacteriological analysis of
the Gobindsagar reservoir on river Sutlej region.
Physiochemical analysis of water:
The observed values for the analysis of physiochemical parameters (Water temperature, pH,
Electrical Conductivity, Total dissolved solids, Turbidity, Salinity, Dissolved Oxygen, Biological Oxygen
Demand, Alkalinity and Hardness) are shown in Table 2.
The results obtained were analyzed with the standards given by World Health Organization (WHO),
1992; Indian Council of Medical Research (ICMR) 1975 and Central Pollution Control Board (CPCB),
2nd International Online Conference on Biological Sciences, July 22, 2018, India
IOCBS 2018 ISBN: 978-81-934141-1-8 Rayder
121
Full Paper
1995 and discussed in brief. The results show that the water temperature of Gobindsagar reservoir is ideal
for the growth of flora and fauna, pH of water sample was recorded as 8.25 which is below the maximum
permissible limit as suggested by WHO, 1992. pH shows slightly alkaline trend these observations agree
well with recent studies of [9] while analyzing water quality of Satluj river (nangal area of Punjab). Similar
observations were observed by [4] of Arpa river. Dissolved oxygen (DO) of Gobindsagar reservoir was 7.46
mg/L which is little higher than the maximum permissible limit prescribed by WHO. This may be due to
the fact that water was collected a few days after rain. Thus the high value of DO is due to the mixing of
rain water (rich in oxygen) with Gobimdsagar water. The observation is in close agreement with the studies
of [21] on Satluj river.
The value of BOD of water sample was 4.36mg/L which is above the maximum permissible limit
prescribed by CPCB, 1995. The high BOD value may be due to the fecal contamination, microbial activity
of the pathogens etc. The observation agree with the results of [4][27][23]. The results revealed that high
value of BOD is an indicator of organic pollution/faecal contamination. Electrical conductivity of the water
sample of the study area was 194µS/cm. The results agree well with the observations of [21] who worked
on Satluj river. The results show that the water was suitable for the growth of fishes and macro invertebrates.
Total dissolved solids (TDS) of the water sample were found to be 96ppm which is below the
maximum permissible limit prescribed by CPCB. [19] and [34] also reported same results while analyzing
Mangrul dam, Maharashtra and Wanparakalpa reservoir, Nagpur respectively. It reveals that the water
pollution is well within the safe limit. Alkalinity of the water sample was 114.66mg/L which is below the
maximum permissible limit prescribed by WHO. The results are in close conformity with the [9][21]. The
total hardness was found to be high which may be due to dominance of salts of calcium and magnesium.
Metagenomic Analysis
Metagenomics describes the functional and sequence-based analysis of the collective microbial
genomes contained in an environmental sample. In the present investigation, metagenomic studies were
performed by analyzing the prokaryotic 16S ribosomal RNA gene (16S rRNA), V3-V4 region. The regions
of 16S rRNA are frequently used in phylogenetic classifications such as genus or species in diverse
microbial populations.
DNA isolation and quantification:
Water was filtered using the vacuum water filtration assembly (Millipore, USA). To isolate total
DNA 1/4th of the filter paper was used. The DNA extraction protocol was carried out in 6 replicates. Finally
the DNA from all the extractions was combined to provide a composite sample. The concentration of the
extracted DNA measured on Nano Drop spectrophotometer was found to be 52.2 ng/µl. The mean of the
ratio of absorbance values at 260nm and 280nm came out to be 1.526. Figure 2 shows the graphical
representation of the nanodrop reading. In addition to UV- spectrophotometric analysis, the quality of DNA
was also checked on agarose gel stained with ethidium bromide. Figure 1 shows a representative agarose
gel photograph on which eDNA was electrophoresed to determine its quality.
2nd International Online Conference on Biological Sciences, July 22, 2018, India
IOCBS 2018 ISBN: 978-81-934141-1-8 Rayder
122
Full Paper
The amplification of 16S rRNA
In order to confirm the quality of isolated DNA for NGS library preparation, PCR amplification of
16S rRNA gene from the isolated eDNA was carried out using the 16S rRNA gene universal primers
(Forward primer (27F) AGAGTTTGATCMTGGCTCAG and Reverse Primer (1492R)
TACGGYTACCTTGTTACGACTT). The expected amplicon size was ~1.5kb at an annealing temperature
of 55ºC. The results were viewed on an ethidium bromide stained 1.2% agarose gel. A representative picture
of the gel is shown in the figure 3. Since the quality of DNA was of good quality, it was sent for NGS library
preparation
NGS library preparation, quantitation and sequencing (MiSeq Platform)
Paired end libraries were prepared from the composite DNA as per the recommended protocol for
library construction on Illumina platform (Nextera XT DNA kit, Illumina, Inc., San Diego, CA, USA). 16S
rRNA V3-V4 region was amplified with the universal primers (Forward primer
TCCGTAGGTGAACCTGCGG and Reverse TCCTCCGCTTATTGTAT) with standard Illumina barcodes
and adapters. The amplicon so obtained were purified using Ampure XP beads to remove the unused
primers, DNA, enzymes etc.
The barcoded libraries were validated by Agilent DNA HS (High Sensitivity) Bioanalyzer (Agilent, USA).
In bioanalyzer, electrophoresis assay was performed based on gel electrophoresis principle that has been
transformed on a chip format. On chip, after gel electrophoresis data was translated into gel-like images
(bands) and electropherograms (peaks) and compared with the ladder that contains fragments of known
sizes and concentrations. A standard curve of migration time versus fragments size was plotted. From the
migration times measured for each fragment in the sample, the size was calculated. Generally, two marker
fragments were run with each of the samples bracketing the overall sizing range. The lower and upper
markers are internal standards used to align the ladder data with data from the sample wells. Figure 4 shows
bioanalyzer trace of the amplicon library. As apparent from the bioanalyzer trace the amplicon was of the
desired length ~584bp and no non-specific amplifications was seen. The purified library was again
quantified using Qubit DNA BR (Broad Range) kit. Table 3 explains Qubit values for the purified library.
The concentration of the library obtained was good enough for the further processing.
In order to obtain the high quality and full length sequence for the V3-V4 region of the 16S rRNA
gene, 2x250 bp paired end sequencing was carried out. The sequencing run was successful and the raw data
was received in FASTQ file format. These files were further processed for data analyses.
Statistical analysis/ Data analysis
Quality check of raw data was done with the help of FASTQC software. Figure 5 and 6 represents
base quality of FASTQ files. In the graph the X-axis shows the sequence length and the Y-axis shows the
phred qualities. The results revealed that the quality of read 1 and read 2 were good as they have phred
scores of more than 20.
In addition, information such as total number of reads, percentage of Adenine, Thymine, Guanine,
Cytosine and N (ambiguous base) present, number of reads with at least one N, dinucleotide percentage etc,
were also extracted from raw FASTQ files for better understanding of the sample. Table 4 and figure 7 and
8shows the total number of nucleotide content in the water sample. The percentage of total AT and GC
2nd International Online Conference on Biological Sciences, July 22, 2018, India
IOCBS 2018 ISBN: 978-81-934141-1-8 Rayder
123
Full Paper
content of the water sample was calculated using the FASTQ software. The results are shown in table 5 and
figure 9 and 10. From this result it can be further concluded that the sequence were GC rich.
Paired end reads of each sample were joined using IOMICS software to produce contigs based
upon the overlapping nucleotides in each pair to obtain complete 254bp sequence for V3-V4 region of the
16S rRNA gene. The results show that out of 1809490 sequences, 1113180 stitched sequences and 696310
could not be stitched due to lack of overlap between the sequences. The unstitched sequences were
discarded for further analysis. Table 6 gives the statistics of joined paired end reads of the sample. 7000
sequences were identified as chimeras using greengeness database and were filtered out.
Since Illumina library preparation involves PCR step, therefore there is possible for Chimera
formation. Filtering of chimeric sequences before OTU identification is an important step because it could
incorporate errors in OTU identification. 7000 sequences were identified as chimeras using greengenes
database and were filtered out. The identified OTUs were aligned against the 16S-rRNA database
(Greengenes database) of Bacteria for taxonomic classifications. To corrects the bias in the assessment of
OTU abundance and controls the variance within the groups we normalized the data using cumulative sum
scaling (CSS) algorithm
Phylum level classification:
It is observed that the phylum Protobacteria, Actinobacteria, and Firmicutes were most abundance
in the water sample. Table 7 and figure 11-12 explains the abundance of major phyla in the water sample.
The phulym Firmicutes, accounting for 23.12% was the most abundant phylum in water sample. The second
dominant phylum was Proteobacteria (17.33%).The other dominant phyla were Actinobacteria (7.42%)
followed by Bacteriodetes (1.87%), Cyanobacteria (1.6%), Fusobacteria (1.3%) and Verrumicrobia (0.6%).
These results are comparable to that of [37][38][45][46]. The results are in total agreement with [22].
Genus level classification:
The phylum Firmicutes includes the most abundant genera: Enterococcus (4.98%) followed by
Lactococcus (2.3%), Streptococcus (1.4%), Bacillus (0.95%), Geobacillus (0.6%), Anaerobacillus (0.1%),
Clostridium (0.1%) and Staphylococcus (0.1%). The phylum proteobacteria are represented by
Rhodobacter (1.1%) and Acinetobacter (0.48%). Other genera includes Propionibacterium (0.8%),
Corynebacterium (0.2%), Actinomyces (0.1%), Microbacterium (0.1%), Micrococcus (0.1%) and
Streptomyces (0.1%) of Phylum Actinobacteria are present in the sample. From phylum Bacteriodetes the
genera Candidatus (1.2%) is present. The genera related to cyanobacteria are Synechococcus (0.1%) and
Leptolyngbya (0.1%) are found to be present. The genera Fusobacterium (0.2%) and Cetobacterium (0.8%)
of phylum fusobacteria are present in the sample. The phylum Verrumicrobia is represented by the genera
Luteolibacter (1%) in the water sample of Gobindsagar reservoir. The observations agree with the recent
studies done by [7][45]. Table 8 explains abundance of this major genus in the water sample.
These results highlight that NGS amplicon Illumina sequencing using general bacterial primers not
only detect the abundant bulk populations in a community but, also detect very low populations that often
are of relevance for the microbiological quality assessment of water. The present study clearly shows the
microbiota of Gobindsagar reservoir consists of different phyla and their abundant genera which are as
follows:-
2nd International Online Conference on Biological Sciences, July 22, 2018, India
IOCBS 2018 ISBN: 978-81-934141-1-8 Rayder
124
Full Paper
i. Phylum Firmicutes: The current study clearly shows that the gram-positive and often spore
forming firmicutes are often much more dominant in the Gobindsagar reservoir. The genera within
the phylum firmicutes are represented by the figure 13. Streptococcus, Enterococcus, Bacillus is
an indication that there is some level of water contamination. This report is in total agreement that
the higher abundance of firmicutes in sample is attributed to fecal contamination [44]. The previous
study of [45] has shown that the phylum Firmicutes is the most dominant phylum in the water
quality.
ii. Phylum Proteobacteria: In the current study, Genus Acenitobacteria and Rhodobacter were found
prominent among genera. The members of class Gammaproteobacteria, (genera Acinetobacter) are
known for the source tracking of pollutants in surface waters.
iii. Phylum Actinobacteria: The phylum actinobacteria are a group of Gram-positive bacteria with a
high G+C content in their DNA. The freshwater Actinobacteria are free-living, open-water defense
specialists, with possible photo and heterotrophic energy generation life styles. The genera within
the phylum Actinobacteria are represented by the Figure 14. Morphologically, they are quite
diverse ranging from cocci to complex filaments which form a mycelium and produce specialized
reproductive structures called spores. Actinobacteria are chemoorganotrophic and play an
important role in the biodegradation and recycling of organic matter [42].
iv. Phylum Bacteriodetes: In the present study, genera Candidatus was found in the water sample of
Gobindsagar reservoir. They are among the major members of the microbiota, especially in the
gastrointestinal tract, can act as pathogens and are frequently found in soils, oceans and freshwater
[38]. Environmental Bacteroidetes are thought to be specialized in the degradation of complex
organic matter in the biosphere, especially in the form of polysaccharides and proteins [10]. As a
group, they are very versatile in the range of biopolymers they can use as carbon and energy source,
e.g., plant, algal, or animal compounds.
v. Phylum Cyanobacteria: The phylum cyanobacteria are quite small and usually unicellular, though
they often grow in colonies and obtain their energy from photosynthesis. In the current study, the
genera Synechococcus and Leptolyngbya were present in the water sample of Gobindsagar reservoir
which shows that the reservoir is well lit surface water.
vi. Phylum Fusobacteria: Fusobacteria are obligately anaerobic non-sporeforming gram-negative
bacilli. From the phylum fusobacteria, the genera Fusobacterium and Cetobacterium were present
in the water sample.
vii. Phylum Verrumicrobia: Verrrumicrobia were identified as a new division within the bacterial
domain by [18]. The phylum Verrumicrobia is represented by the genera Luteolibacter (1%) in the
water sample of Gobindsagar reservoir.
5. Conclusion
In this current study, we examined the bacterial community at Gobindsagar reservoir along the
Satluj river in bilaspur using NGS technology (Amplicon sequencing of 16S rRNA gene). We were
successful in getting in depth profile of the bacteria inhabiting Gobindsagar reservoir. The physiochemical
2nd International Online Conference on Biological Sciences, July 22, 2018, India
IOCBS 2018 ISBN: 978-81-934141-1-8 Rayder
125
Full Paper
parameters namely temperature, pH, turbidity, TDS, alkalinity and hardness were found to be well within
the range of WHO (1992), ICMR (1975) and CPCB (1995).
Bioinformatics analysis of the sequences clearly showed the presence of phylum Firmicutes,
Proteobacteria, Actinobacteria, Bacteriodetes, Cyanobacteria, Fusobacteria and Verrumicrobia in the water
sample. Phylum-based analyses have certainly proven useful as an initial assessment of the types and
abundances of bacteria that may be present in an environment and as a way to broadly partition the drivers
and functions of bacterial taxa in their particular environments.
The genera present in the water sample were Enterococcus, Lactococcus , Streptococcus, Bacillus,
Geobacillus, Anaerobacillus, Clostridium and Staphylococcus of phylum firmicutes. The genera related to
proteobacteria are Rhodobacter and Acinetobacter. From phylum bacteriodetes the genera Candidatus is
present and from the phylum fusobacteria, the genera Fusobacterium and Cetobacterium are present in the
sample.
The advancement of NGS offers exciting opportunities to better understand the relationship
between bacterial communities and anthropogenic activities in aquatic environments and may lead to
improved understanding of water quality. Next-Generation technologies to sequence DNA are significantly
faster than Sanger sequencing.
Figures and table legends
Figure 1: A representative agarose gel photograph
Figure 2: Graphical Representation of nanodrop reading
Figure 3: PCR amplicon
Figure 4: Graph showing bioanalyzer trace of electropherogram
Figure 5: Per Base Quality of FASTQ files of Water Read 1 (R1)
Figure 6: Per Base Quality of FASTQ files Water Read 2 (R2)
Figure7: Graph representing the nucleotide percentage in forward read
Figure 8: Graph representing the nucleotide percentage in reverse read
Figure 9: Graph representing the GC percentage in forward read
Figure 10: Graph representing the GC percentage in reverse read
Figure 11: Phylum based OTUs Abundance
Figure 12: Color Codes and Associated Phylum
Figure 13: Chart representing the major genera present under phylum Firmicutes
Figure 14: Chart representing the major genera present under phylum Actinobacteria
Table 1: Analytical methods and Equipments to study physiochemical parameters
Table 2: Water quality parameters of Gobindsagar reservoir (Bilaspur).
Table 3: Qubit Values for the purified sample
Table 4: Row Reads Inventory
Table 5: Dinucleotide percentage in raw reads
Table 6: Summary of Paired end reads stitching
Table 6: Major Phylum present in sample
Table 7: Major Genus present in the sample
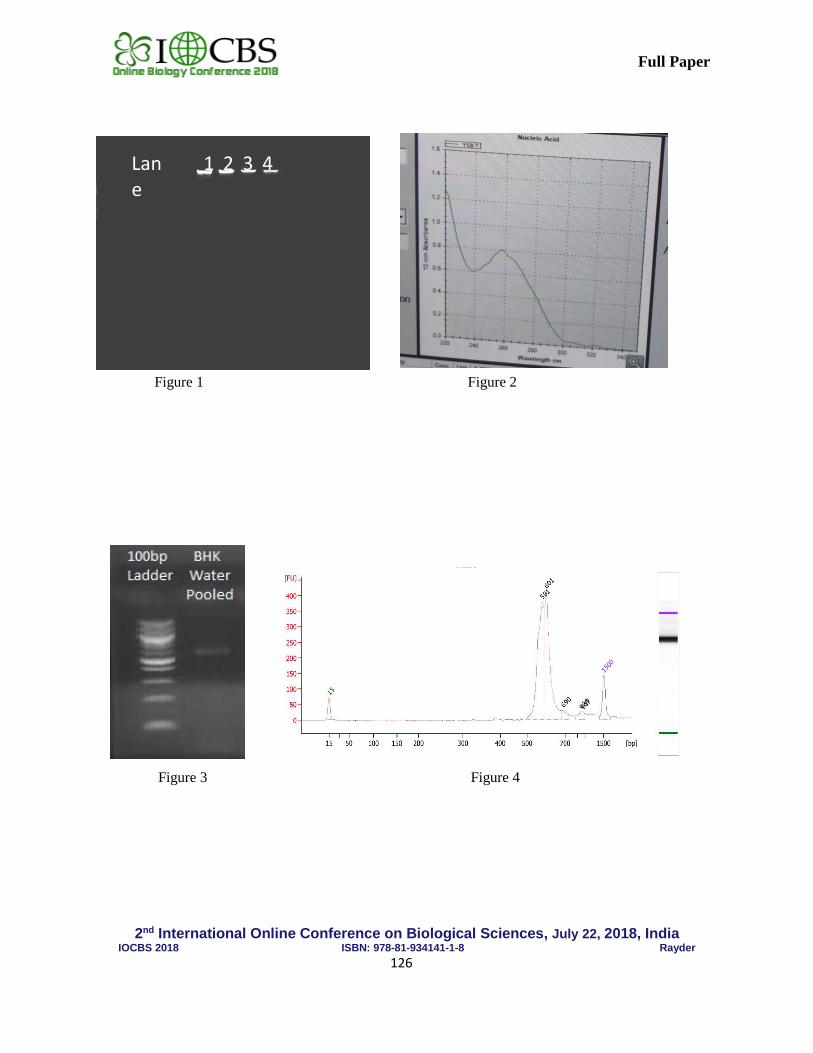
2nd International Online Conference on Biological Sciences, July 22, 2018, India
IOCBS 2018 ISBN: 978-81-934141-1-8 Rayder
126
Full Paper
Figure 1 Figure 2
Figure 3 Figure 4
Lane
1 2 3 4
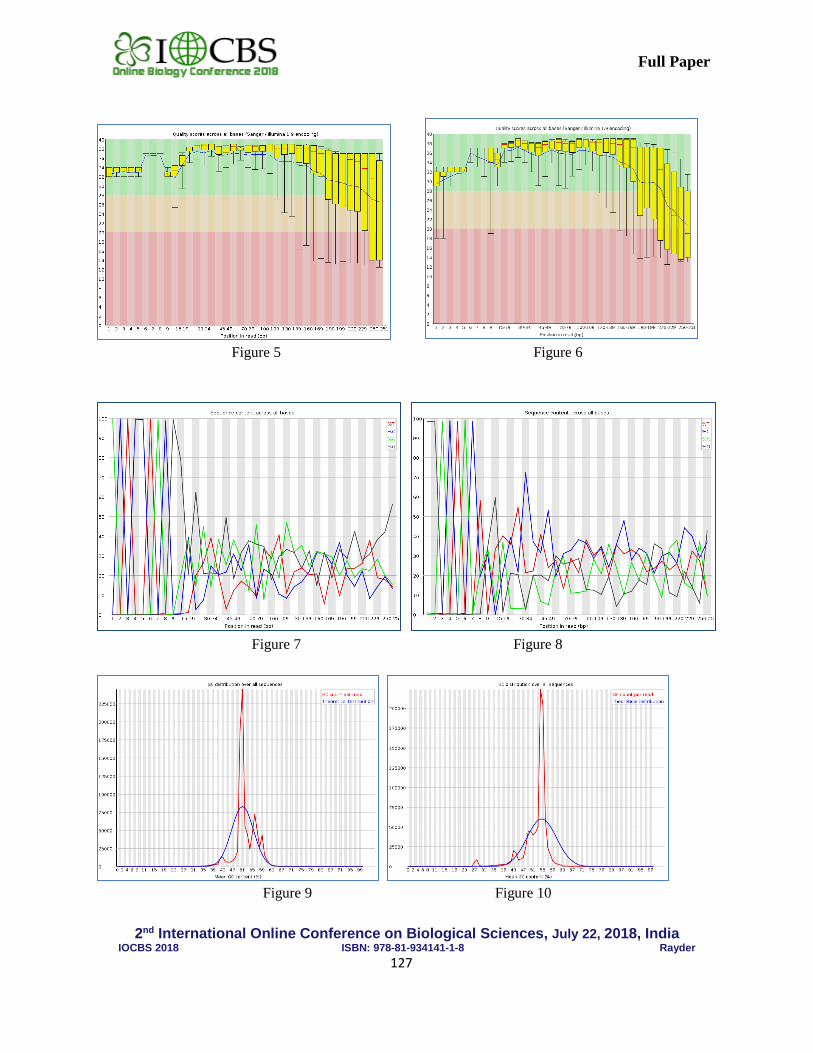
2nd International Online Conference on Biological Sciences, July 22, 2018, India
IOCBS 2018 ISBN: 978-81-934141-1-8 Rayder
127
Full Paper
Figure 5 Figure 6
Figure 7 Figure 8
Figure 9 Figure 10
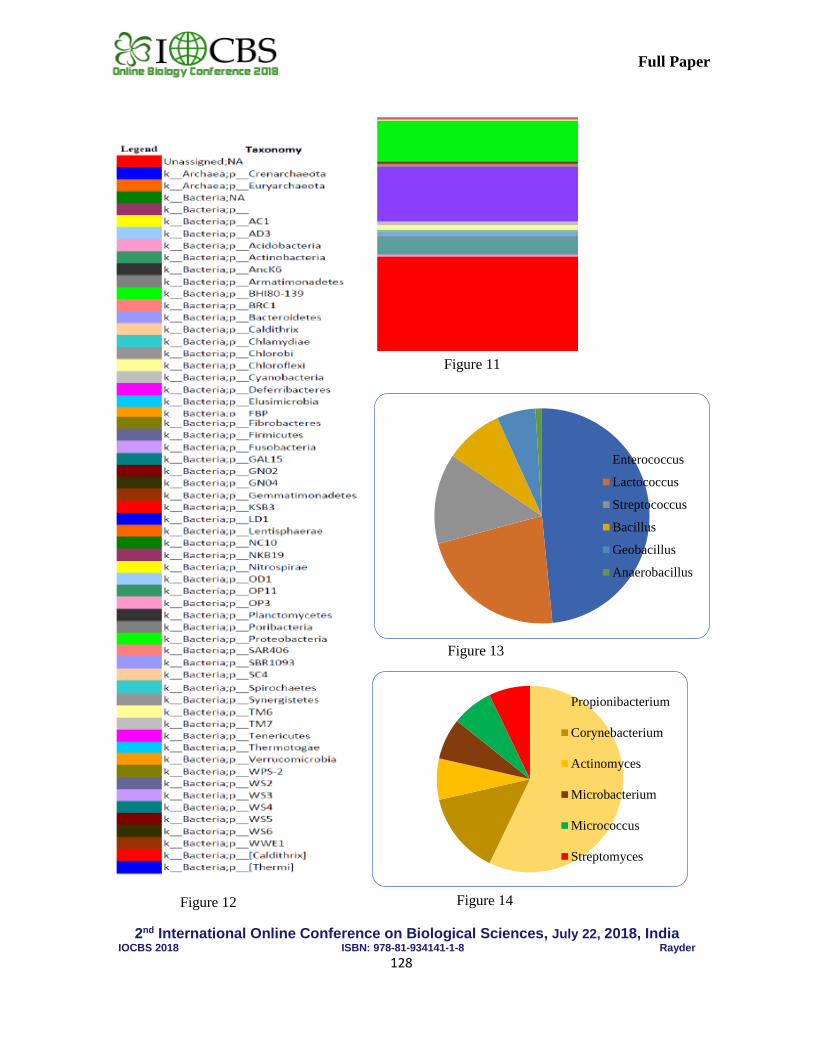
2nd International Online Conference on Biological Sciences, July 22, 2018, India
IOCBS 2018 ISBN: 978-81-934141-1-8 Rayder
128
Full Paper
Figure 11
Figure 13
Figure 12
Figure 12
Enterococcus
Lactococcus
Streptococcus
Bacillus
Geobacillus
Anaerobacillus
Figure 14
Propionibacterium
Corynebacterium
Actinomyces
Microbacterium
Micrococcus
Streptomyces
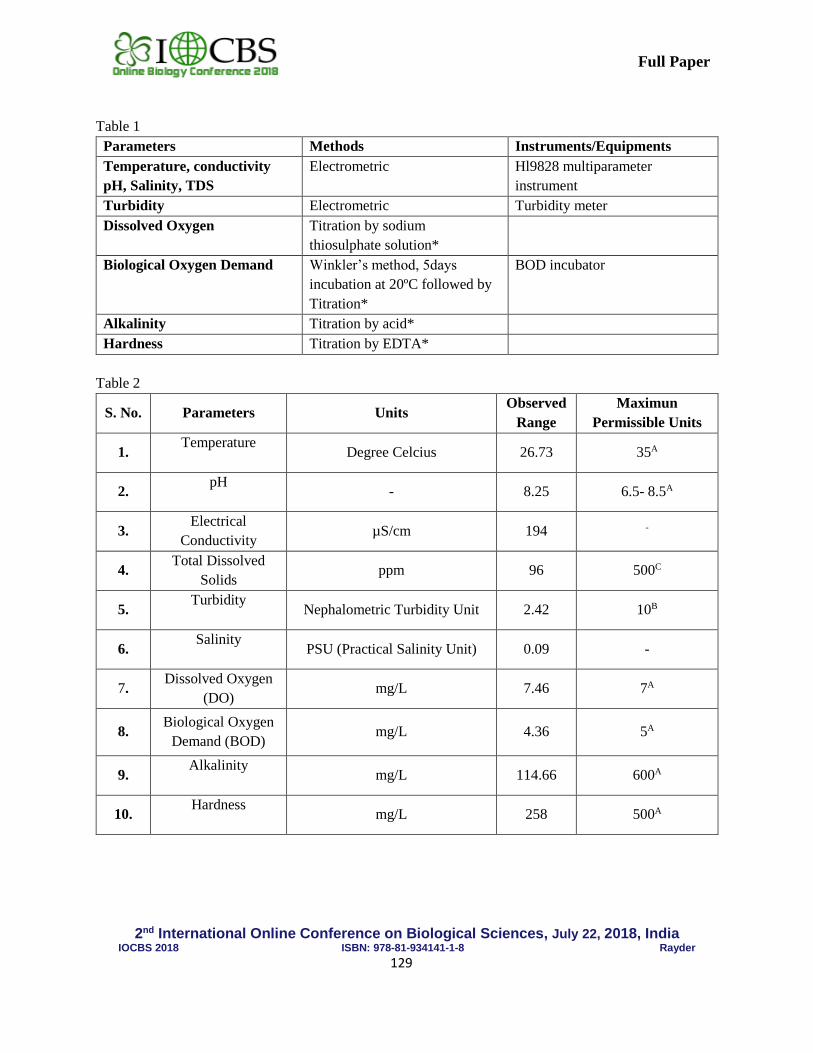
2nd International Online Conference on Biological Sciences, July 22, 2018, India
IOCBS 2018 ISBN: 978-81-934141-1-8 Rayder
129
Full Paper
Table 1
Parameters Methods Instruments/Equipments
Temperature, conductivity
pH, Salinity, TDS
Electrometric Hl9828 multiparameter
instrument
Turbidity Electrometric Turbidity meter
Dissolved Oxygen Titration by sodium
thiosulphate solution*
Biological Oxygen Demand Winkler’s method, 5days
incubation at 20ºC followed by
Titration*
BOD incubator
Alkalinity Titration by acid*
Hardness Titration by EDTA*
Table 2
S. No. Parameters Units Observed
Range
Maximun
Permissible Units
1. Temperature
Degree Celcius 26.73 35A
2. pH
- 8.25 6.5- 8.5A
3. Electrical
Conductivity µS/cm 194 -
4. Total Dissolved
Solids ppm 96 500C
5. Turbidity
Nephalometric Turbidity Unit 2.42 10B
6. Salinity
PSU (Practical Salinity Unit) 0.09 -
7. Dissolved Oxygen
(DO) mg/L 7.46 7A
8. Biological Oxygen
Demand (BOD) mg/L 4.36 5A
9. Alkalinity
mg/L 114.66 600A
10. Hardness
mg/L 258 500A
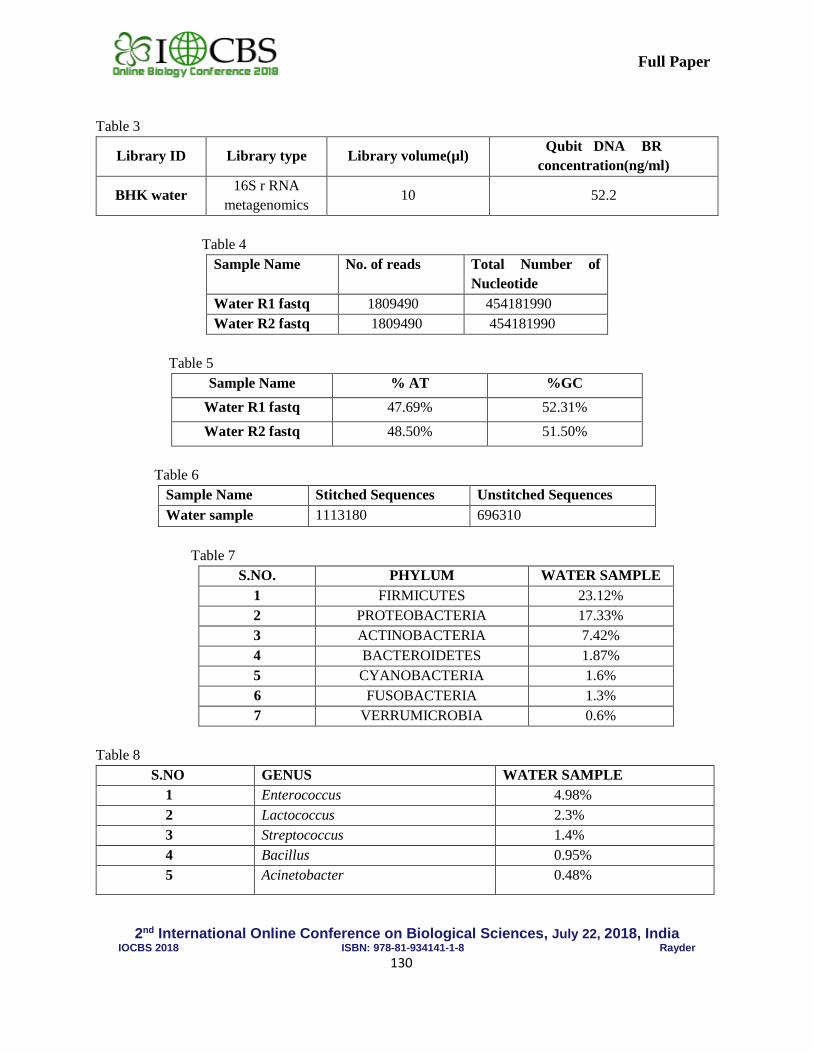
2nd International Online Conference on Biological Sciences, July 22, 2018, India
IOCBS 2018 ISBN: 978-81-934141-1-8 Rayder
130
Full Paper
Table 3
Library ID Library type Library volume(µl) Qubit DNA BR
concentration(ng/ml)
BHK water 16S r RNA
metagenomics 10 52.2
Table 4
Sample Name No. of reads Total Number of
Nucleotide
Water R1 fastq 1809490 454181990
Water R2 fastq 1809490 454181990
Table 5
Sample Name % AT %GC
Water R1 fastq 47.69% 52.31%
Water R2 fastq 48.50% 51.50%
Table 6
Sample Name Stitched Sequences Unstitched Sequences
Water sample 1113180 696310
Table 7
S.NO. PHYLUM WATER SAMPLE
1 FIRMICUTES 23.12%
2 PROTEOBACTERIA 17.33%
3 ACTINOBACTERIA 7.42%
4 BACTEROIDETES 1.87%
5 CYANOBACTERIA 1.6%
6 FUSOBACTERIA 1.3%
7 VERRUMICROBIA 0.6%
Table 8
S.NO GENUS WATER SAMPLE
1 Enterococcus 4.98%
2 Lactococcus 2.3%
3 Streptococcus 1.4%
4 Bacillus 0.95%
5 Acinetobacter 0.48%
2nd International Online Conference on Biological Sciences, July 22, 2018, India
IOCBS 2018 ISBN: 978-81-934141-1-8 Rayder
131
Full Paper
References
[1] Alam, M., & Pathak, J. K. (2010). Rapid assessment of water quality index of Ramganga River, Western
Uttar Pradesh (India) using a computer programme. Nature and Science, 8(11), 1-8.
[2] DeSantis, T. Z., Hugenholtz, P., Larsen, N., Rojas, M., Brodie, E. L., Keller, K. & Andersen, G. L. (2006).
Greengenes, a chimera-checked 16S rRNA gene database and workbench compatible with ARB. Applied
and environmental microbiology, 72(7), 5069-5072.
[3] APHA (1998). Standard methods for examination of water and wastewater, 20th Edition, American Public
Health Association, Washington D.C.
[4] Bajpai, R. (2012). Comparative analyses of physicochemical parameters of Hasdeo river barrage & Arpa
River water samples of Bilaspur region. International Journal of Scientific and Reasearch
Publications, 2(9), 2250-3153.
[5] Bartram, A. K., Lynch, M. D., Stearns, J. C., Moreno-Hagelsieb, G., & Neufeld, J. D. (2011). Generation of
multimillion-sequence 16S rRNA gene libraries from complex microbial communities by assembling
paired-end Illumina reads. Applied and environmental microbiology, 77(11), 3846-3852.
[6] Belenguer, V., Martinez-Capel, F., Masiá, A., & Picó, Y. (2014). Patterns of presence and concentration of
pesticides in fish and waters of the Júcar River (Eastern Spain). Journal of hazardous materials, 265, 271-
279.
[7] Newton, R. J., Jones, S. E., Eiler, A., McMahon, K. D., & Bertilsson, S. (2011). A guide to the natural history
of freshwater lake bacteria. Microbiology and Molecular Biology Reviews, 75(1), 14-49.
[8] Bullard, J. H., Purdom, E., Hansen, K. D., & Dudoit, S. (2010). Evaluation of statistical methods for
normalization and differential expression in mRNA-Seq experiments. BMC bioinformatics, 11(1), 94.
[9] Chauhan, B. S., & Sagar, S. K. (2013). Impact of pollutants on water quality of river Sutlej in Nangal Area
of Punjab, India. In Biological Forum–An International Journal (Vol. 5, No. 1, pp. 113-123).
[10] Church, M. J. (2008). Resource control of bacterial dynamics in the sea. Microbial Ecology of the Oceans,
Second Edition, 335-382.
[11] Contreras, J., Sarma, S., Merino-Ibarra, M. and Nandini, S. (2009). Seasonal changes in the rotifer (Rotifera)
diversity from a tropical high altitude reservoir (Valle de Bravo, Mexico). Journal of Environmental Biology.
30, 191-195.
[12] Do, Y. S., Schmidt, T. M., Zahn, J. A., Boyd, E. S., de la Mora, A., & DiSpirito, A. A. (2003). Role of
Rhodobacter sp. strain PS9, a purple non-sulfur photosynthetic bacterium isolated from an anaerobic swine
waste lagoon, in odor remediation. Applied and environmental microbiology, 69(3), 1710-1720.
[13] Edgar, R. C. (2010). Search and clustering orders of magnitude faster than BLAST. Bioinformatics, 26(19),
2460-2461.
[14] Ghazanfar, S., Azim, A., Ghazanfar, M. A., Anjum, M. I., & Begum, I. (2010). Metagenomics and its
application in soil microbial community studies: biotechnological prospects. Journal of Animal & Plant
Sciences, 6(2), 611-622.
[15] Gill, S. K., Sahota, G. P. S., Sahota, B. K., & Sahota, H. S. (1993). Physico-chemical characteristics and
phytoplankton occurrence frequency of Beas water at Shah Nehar Barrage. IJEP, 13(7), 528-532.
[16] Grey, L. (2004). Changes in water quality and macro-invertebrate communities resulting from urban storm
flows in the Provo River, Utah, USA. Hydrobiologia 518, 33-36.
[17] Handelsman, J. (2005). Metagenomics: application of genomics to uncultured
microorganisms. Microbiology and Molecular Biology Reviews, 69(1), 195-195.
[18] Hedlund, B. P., Gosink, J. J., & Staley, J. T. (1997). Verrucomicrobia div. nov., a new division of the bacteria
containing three new species of Prosthecobacter. Antonie van Leeuwenhoek, 72(1), 29-38.
2nd International Online Conference on Biological Sciences, July 22, 2018, India
IOCBS 2018 ISBN: 978-81-934141-1-8 Rayder
132
Full Paper
[19] Jawale, A. K., & Patil, S. A. (2009). Physico-chemical characteristics and Phytoplanktons abundance of
Mangrul Dam Dist-Jalgaon Maharashtra. J. Aqua. Biol, 24(1), 7-12.
[20] Jeong, J. Y., Park, H. D., Lee, K. H., Weon, H. Y., & Ka, J. O. (2011). Microbial community analysis and
identification of alternative host-specific fecal indicators in fecal and river water samples using
pyrosequencing. The Journal of Microbiology, 49(4), 585.
[21] Jindal, R., & Sharma, C. (2011). Studies on water quality of Sutlej River around Ludhiana with reference to
physicochemical parameters. Environmental monitoring and assessment, 174(1-4), 417-425.
[22] Jordaan, K., & Bezuidenhout, C. C. (2016). Bacterial community composition of an urban river in the North
West Province, South Africa, in relation to physico-chemical water quality. Environmental Science and
Pollution Research, 23(6), 5868-5880.
[23] Kumar, R., & Jha, A. K. (2015). Physico-chemical studies on Kamla River water. International Journal of
Advanced Research in Computer Science and Software Engineering, 5(5), 1411-1415.
[24] Kumar, P., Anupama, P., & Chandra, U. H. (2014). Seasonal variation in physico-chemical properties of
Kali River in Pithoragarh District of Uttarakhand, India. Journal of environmental Research and
Development, 8(3A), 600.
[25] Malmqvist, B., & Rundle, S. (2002). Threats to the running water ecosystems of the world. Environmental
conservation, 29(2), 134-153.
[26] Mandal, H.S. and Das, A. (2011). Assessment of seasonal variation in physic-chemical characteristics and
quality of Torsha river water for irrigation used in Cooch Behar and Jalpairguri districts of West Bengal,
India. Journal of Chemical and Pharmaceutical Research. 3(6), 265-270.
[27] Mandal, H.S., Das, A . and Nanda, A.K. (2012). Study of some physicochemical water quality parameters
of karola river, west Bengal-an attempt to estimate pollution status. International Journal of Environmental
Protection. 2(8):16-22.
[28] Mustapha, M. K., & Omotoso, J. S. (2005). An assessment of the physico–chemical properties of Moro
lake. African journal of applied Zoology and environmental biology, 7(1), 73-77.
[29] Nilsson, C., Reidy, C. A., Dynesius, M., & Revenga, C. (2005). Fragmentation and flow regulation of the
world's large river systems. Science, 308(5720), 405-408.
[30] Oludoro, A. O., & Aderiye, B. I. (2007). Efficacy of Moringa oleifera seed extract on the microflora of
surface and underground water. J Plant Sci, 2, 453-458.
[31] Rondon, M. R., August, P. R., Bettermann, A. D., Brady, S. F., Grossman, T. H., Liles, M. R. & Tiong, C. L.
(2000). Cloning the soil metagenome: a strategy for accessing the genetic and functional diversity of
uncultured microorganisms. Applied and environmental microbiology, 66(6), 2541-2547.
[32] Riesenfeld, C. S., Schloss, P. D., & Handelsman, J. (2004). Metagenomics: genomic analysis of microbial
communities. Annu. Rev. Genet., 38, 525-552.
[33] Sabater S, Stevenson RJ. Foreword: Global change and river ecosystems–implications for structure,
functions and ecosystem services, Hydrobiol. 2010; 657:1-2.
[34] Salve, V. B., & Hiware, C. J. (2008). Study on water quality of Wanparakalpa reservoir Nagpur, Near Parli
Vaijnath, District Beed. Marathwada region. J. Aqua. Biol, 21(2), 113-117.
[35] Schloss, P. D., & Handelsman, J. (2003). Biotechnological prospects from metagenomics. Current opinion
in biotechnology, 14(3), 303-310.
[36] Simon, C., & Daniel, R. (2011). Metagenomic analyses: past and future trends. Applied and environmental
microbiology, 77(4), 1153-1161.
[37] Staley, C., Gould, T. J., Wang, P., Phillips, J., Cotner, J. B., & Sadowsky, M. J. (2014). Bacterial community
structure is indicative of chemical inputs in the Upper Mississippi River. Frontiers in microbiology, 5, 524.
[38] Thomas, F., Hehemann, J. H., Rebuffet, E., Czjzek, M., & Michel, G. (2011). Environmental and gut
bacteroidetes: the food connection. Frontiers in microbiology, 2, 93.
2nd International Online Conference on Biological Sciences, July 22, 2018, India
IOCBS 2018 ISBN: 978-81-934141-1-8 Rayder
133
Full Paper
[39] Zeyaullah, M., Kamli, M. R., Islam, B., Atif, M., Benkhayal, F. A., Nehal, M. & Ali, A. (2009).
Metagenomics-An advanced approach for noncultivable micro-organisms. Biotechnology and Molecular
Biology Reviews, 4(3), 49-54.
[40] Trivedy, R. K., & Goel, P. K. (1984). Chemical and biological methods for water pollution studies.
Environmental publications.
[41] Udebuana, O. O., Akaluka, C. K., & Bashir, K. M. I. (2014). Assessment of Physico-Chemical Parameters
and Water Quality of Surface Water of Iguedo River, Ovia South-West Local Government, Edo
State. Assessment, 4(24).
[42] Ventura, M., Canchaya, C., Tauch, A., Chandra, G., Fitzgerald, G. F., Chater, K. F., & van Sinderen, D.
(2007). Genomics of Actinobacteria: tracing the evolutionary history of an ancient phylum. Microbiology
and molecular biology reviews, 71(3), 495-548.
[43] Wood, A. (1995). Constructed wetlands in water pollution control: fundamentals to their
understanding. Water Science and Technology, 32(3), 21-29.
[44] Wu, C. H., Sercu, B., Van De Werfhorst, L. C., Wong, J., DeSantis, T. Z., Brodie, E. L. & Andersen, G. L.
(2010). Characterization of coastal urban watershed bacterial communities leads to alternative community-
based indicators. PloS one, 5(6), e11285.
[45] Zheng, G., Yampara‐Iquise, H., Jones, J. E., & Andrew Carson, C. (2009). Development of Faecalibacterium
16S rRNA gene marker for identification of human faeces. Journal of applied microbiology, 106(2), 634-
641.
[46] Zhou, X., Ren, L., Li, Y., Zhang, M., Yu, Y., & Yu, J. (2010). The next-generation sequencing technology: a
technology review and future perspective. Science China Life Sciences, 53(1), 44-57.

[This page is intentionally left blank]
www.iocbs.org
RAYDER PUBLICATION @ 2018


![International Journal of Innovative Pharmaceutical Sciences and … · 2019-07-17 · Shodhana [Ref-Rasaratna samuchchaya] Materials- Vanga, Iron pan, Nirgundi swarasa, Haridra churna,](https://img.pdfslide.us/doc/110x75/5e60fc39b456c648ca4d8215/international-journal-of-innovative-pharmaceutical-sciences-and-2019-07-17-shodhana.jpg)