Embed Size (px)
Citation preview
3–D Model Construction Using Range and Image Data (Submitted to CVPR 2000)∗
Ioannis Stamos and Peter K. AllenDepartment of Computer Science, Columbia University, New York, NY 10027
{istamos, allen}@cs.columbia.edu
AbstractThis paper deals with the automated creation of ge-
ometric and photometric correct 3-D models of theworld. Those models can be used for virtual reality, tele–presence, digital cinematography and urban planning ap-plications. The combination of range (dense depth esti-mates) and image sensing (color information) providesdata–sets which allow us to create geometrically correct,photorealistic models of high quality.
The 3-D models are first built from range data using avolumetric set intersection method previously developedby us. Photometry can be mapped onto these modelsby registering features from both the 3–D and 2–D datasets.
Range data segmentation algorithms have been de-veloped to identify planar regions, determine linear fea-tures from planar intersections that can serve as featuresfor registration with 2-D imagery lines, and reduce theoverall complexity of the models. Results are shown forbuilding models of large buildings on our campus usingreal data acquired from multiple sensors.
1 IntroductionThe recovery and representation of 3–D geometric
and photometric information of the real world is one ofthe most challenging problems in computer vision re-search. With this work we would like to address theneed for highly realistic geometric models of the world,in particular to create models which represent outdoorurban scenes. Those models may be used in applicationssuch as virtual reality, tele-presence, digital cinematog-raphy and urban planning.
Our goal is to create an accurate geometric and pho-tometric representation of the scene by means of inte-grating range and image measurements. The geome-try of a scene is captured using range sensing technol-ogy whereas the photometry is captured by means ofcameras. We have developed a system which, given aset of unregistered depth maps and unregistered pho-tographs, produces a geometric and photometric correct3–D model representing the scene.
We are dealing with all phases of geometrically cor-rect, photorealistic 3–D model construction with a mini-∗This work was supported in part by an ONR/DARPA MURI
award ONR N00014-95-1-0601 and NSF grants CDA-96-25374and EIA-97-29844.
mum of human intervention. This includes data acquisi-tion, segmentation, volumetric modeling, viewpoint reg-istration, feature extraction and matching, and mergingof range and image data into complete models. Our fi-nal result is not just a set of discrete colored voxels ordense range points but a true geometric CAD modelwith associated image textures.
The entire modeling process can be briefly summa-rized as follows:
1. Multiple Range scans and 2-D images of the sceneare acquired.
2. Each range scan is segmented into planar regions(section 3.1)
3. 3-D linear features from each range scan are auto-matically found (section 3.2).
4. The segmented range data from each scan is regis-tered with the other scans (section 3.3).
5. Each segmented and registered scan is swept intoa solid volume, and each volume is intersected toform a complete, 3-D CAD model of the scene (sec-tion 4)
6. Linear features are found in each 2-D image usingedge detection methods (section 3.4).
7. The 3-D linear features from step 3 and the 2-Dlinear features from step 6 are matched and usedto create a fully textured, geometrically correct 3-Dmodel of the scene (sections 3.5 and 4).
Figure 1 describes the data flow of our approach. Westart with multiple, unregistered range scans and pho-tographs of a scene, with range and imagery acquiredfrom different viewpoints. In this paper, the locationsof the scans are chosen by the user, but we have alsodeveloped an automatic method described in [22] thatcan plan the appropriate Next Best View. The rangedata is then segmented into planar regions. The pla-nar segmentation serves a number of purposes. First, itsimplifies the acquired data to enable fast and efficientvolumetric set operations (union and intersection) forbuilding the 3-D models. Second, it provides a conve-nient way of identifying prominent 3-D linear features
which can be used for registration with the 2-D images.3–D linear segments are extracted at the locations wherethe planar faces intersect, and 2–D edges are extractedfrom the 2–D imagery. Those linear segments (2–D and3–D) are the features used for the registration betweendepth maps and between depth maps and 2–D imagery.Each segmented and registered depth map is then trans-formed into a partial 3–D solid model of the scene usinga volumetric sweep method previously developed by us.The next step is to merge those registered 3–D modelsinto one composite 3–D solid model of the scene. Thatcomposite model is then enhanced with 2–D imagerywhich is registered with the 3–D model by means of2–D and 3–D feature matching.
PLANAR SEGMENTATION
SOLID SWEEPS
REGISTRATIONINTERSECTION
2D LINE EXTRACTION
RANGE RANGE-IMAGEREGISTRATION
TEXTUREMAPPING
MATCHMATCH
3-D Line Sets L1, ..., Ln
Final Solid CAD Model
Final Photorealistic Solid Model
Coordinate Transformations
Position and orientation of images relative to the
Final Model
Range Images R1, ... , Rn
Planar Regions P1, ... , Pn
2-D Images I1, ..., Im
Partial Solid Models S1, ..., Sn
3D LINE EXTRACTION
2-D Line Sets f1, ... fm
Figure 1: System for building geometric and photomet-ric correct solid models.
2 Related workThe extraction of photorealistic models of outdoor
environments has received much attention recently in-cluding an international workshop [14, 29]. Notablework includes the work of Shum et al. [24], Becker [1, 2],and Debevec et al. [8]. These methods use only 2–D im-ages and require a user to guide the 3-D model creationphase. This leads to lack of scalability wrt the number ofprocessed images of the scene or to the computation ofsimplified geometric descriptions of the scene which maynot be geometrically correct. Teller [6, 18, 26, 5] usesan approach that acquires and processes a large amountof pose–annotated spherical imagery of the scene. Thisimagery is registered and then stereo methods are usedto recreate the geometry. Zisserman’s group in Oxford[11] works towards the fully automatic construction ofgraphical models of scenes when the input is a sequenceof closely spaced 2–D images (video sequence). Bothof the previous methods provide depth estimates which
depend on the texture and geometric structure of thescene and which may be quite sparse.
Our approach differs in that we use range sensing toprovide dense geometric detail which can then be reg-istered and fused with images to provide photometricdetail. It is our belief that using 2-D imagery alone (i.e.stereo methods) will only provide sparse and unreliablegeometric measures unless some underlying simple ge-ometry is assumed. A related project using both rangeand imagery is the work of the VIT group [28, 3, 9]
The broad scope of this problem requires us to userange image segmentation [4, 13], 3–D edge detection[15, 19], 3–D Model Building [7, 27, 20] and image reg-istration methods [16] as well.
3 System DescriptionIn our previous research, we have developed a method
which takes a small number of range images and builds avery accurate 3-D CAD model of an object (see [23, 21]for details). The method is an incremental one that in-terleaves a sensing operation that acquires and mergesinformation into the model with a planning phase to de-termine the next sensor position or “view”. The modelacquisition system provides facilities for range image ac-quisition, solid model construction and model merging:both mesh surface and solid representations are used tobuild a model of the range data from each view, which isthen merged with the model built from previous sensingoperations.
For each range image a solid CAD model is con-structed. This model consists of sensed and extruded(along the sensing direction) surfaces. The sensed sur-face is the boundary between the inside and the out-side (towards the sensor) of the sensed object. The ex-truded surfaces are the boundary between empty sensed3-D space and un-sensed 3-D space. The merging ofregistered depth maps is done by means of volumet-ric boolean set intersection between their correspondingpartial solid models
We have extended this method to building modelsof large outdoor structures such as buildings. We areusing a Cyrax range scanner which has centimeter levelaccuracy at distances up to 100 meters to provide denserange sampling of the scene. However, these point datasets can be extremely large (1K x 1K) and computation-ally unwieldy. The buildings being modeled, althoughgeometrically complex, are comprised of many planarregions, and for reasons of computational and modelingefficiency, these dense point sets can be abstracted intosets of planar regions. In section 4 we present our resultsof extending this method of automatically building 3-Dmodels to buildings with significant geometry. First wediscuss our segmentation methods.3.1 Planar Segmentation of Range Data
We group the 3–D points from the range scans intoclusters of neighboring points which correspond to the
same planar surface. In the Point Classification phasea plane is fit to the points vi which lie on the k × kneighborhood of every point P . The normal np of thecomputed plane corresponds to the smallest eigenvectorof the 3 by 3 matrix A = ΣNi=1((vi −m)T · (vi −m))where m is the centroid of the set of vertices vi. Thesmallest eigenvalue of the matrix A expresses the devi-ation of the points vi from the fitted plane, that is itis a measure of the quality of the fit. If the deviationis below a user specified threshold Pthresh the center ofthe neighborhood is classified as locally planar point.
A list of clusters is initialized, one cluster per locallyplanar point. The next step is to merge the initial listof clusters and to create a minimum number of clustersof maximum size. Each cluster is defined as a set of 3–Dpoints which are connected and which lie on the samealgebraic surface (plane in our case).
We have to decide if the point P and its nearestneighborsAj could lie on the same planar surface. If thisis the case the clusters where those two points belongare merged into one new cluster. Two adjacent locallyplanar points are considered to lie on the same planarsurface if their corresponding local planar patches havesimilar orientation and are close in 3D space.
n
n
1
2
r12
PP P
P
1
12
2
,
,
Figure 2: Coplanarity measure. Two planar patchesfitted around points P1 and P2 at a distance |r12|.
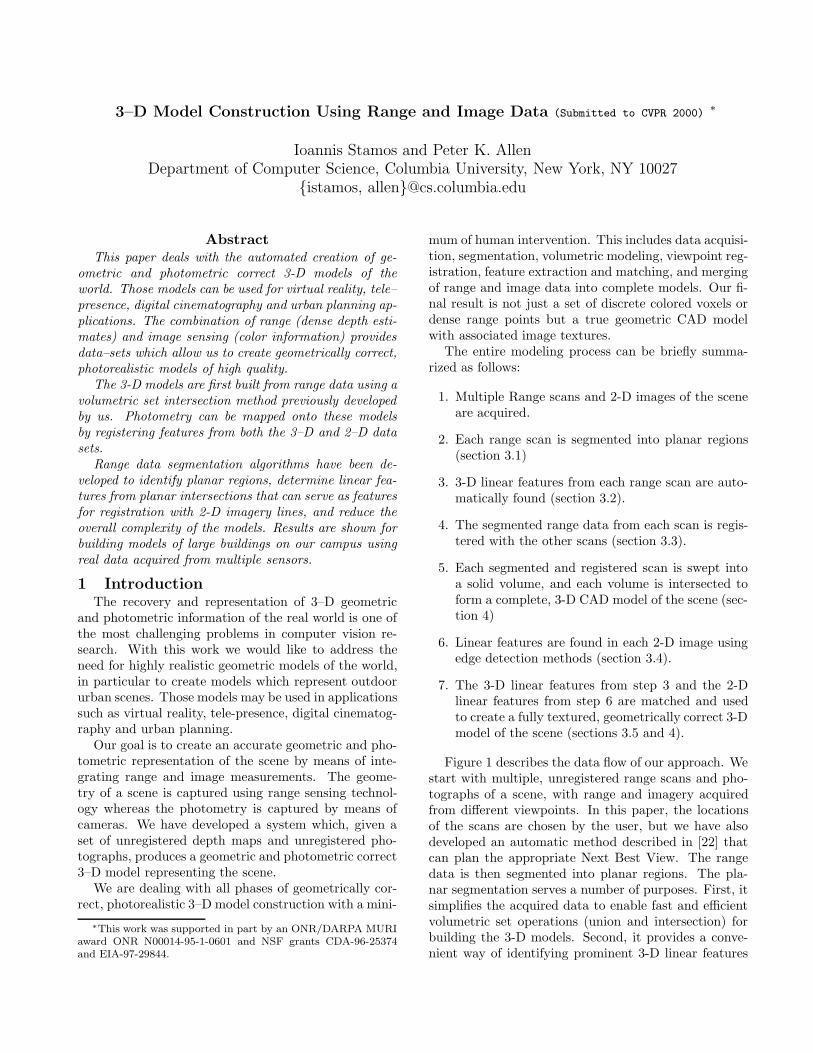
We introduce a metric of co–normality and co–planarity of two planar patches. Figure 2 displays twolocal planar patches which have been fit around thepoints P1 and P2 (Point Classification). The normalof the patches are n1 and n2 respectively. The pointsP ′i are the projections of the points Pi on the patches.The two planar patches are considered to be part of thesame planar surface if both conditions are met. Thefirst condition is that the patches have identical ori-entation (within a tolerance region), that is the angleα = cos−1(n1 · n2) is smaller than a threshold αthresh[co–normality measure]. The second condition is thatthe patches lie on the same infinite plane [co–planaritymeasure]. The distance between the two patches is de-fined as d = max(|r12 · n1|, |r12 · n2|). This distanceshould be smaller than a threshold dthresh. r12 is thedistance between the projections of P1 and P2 onto their
corresponding local planes.Finally we fit a plane on all points of the final clusters.
We also extract the outer boundary of this plane, theconvex hull of this boundary and the axis-aligned three-dimensional bounding box which encloses this boundary.These are used for fast distance computation betweenthe extracted bounded planar regions whichis describedin the next section.
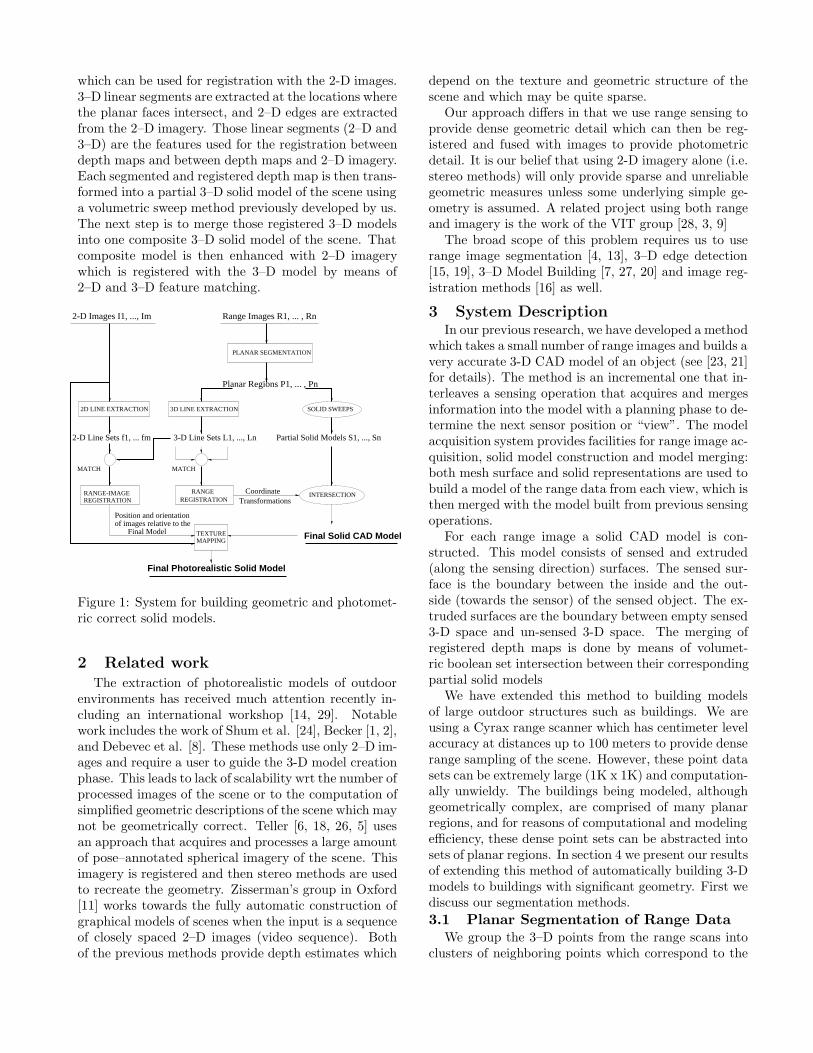
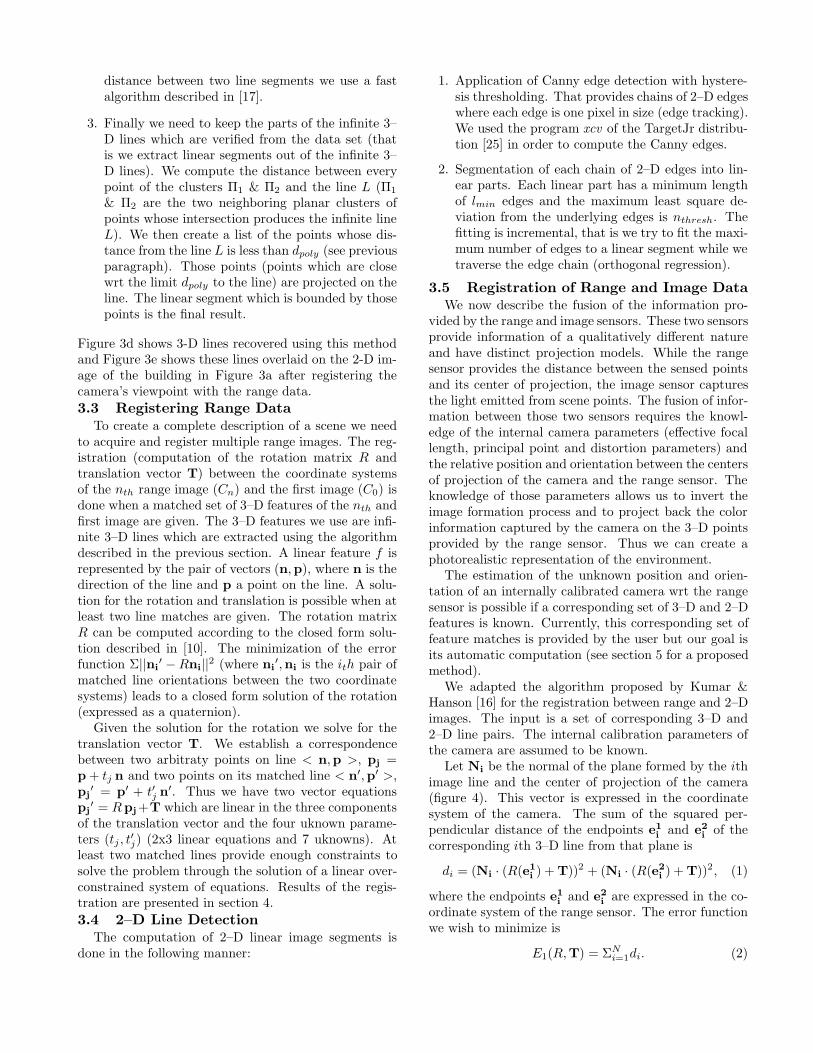
Figure 3a is a 2–D image of a building on our cam-pus. Figure 3b shows a point data set from a rangescan of this building by a Cyrax scanner from a singleview (992 by 989 points). If this data is triangulatedinto facets, it creates an extremely large, unwieldy, andunnecessarily complex description of an object that iscomposed of many tiny, contiguous planar surfaces. Ouralgorithm tries to recover and preserve this structurewhile effectively reducing the data set size and increas-ing computational efficiency. Figure 3c shows the seg-mentation of this data set into planar regions, resultingin a large data reduction - approximately 80% less trian-gular facets (reduction from 1, 005, 004 to 207, 491 rangepoints) are needed to model this data set. The param-eters used were Pthresh = 0.08, αthresh = 0.04 degreesand dthresh = 0.01 meters. The size of the neighbor-hood used to fit the initial planes was 7 by 7. Pointswhich didn’t pass the first stage of the planar segmen-tation algorithm and have been classified as non–locallyplanar are displayed as red.3.2 3–D Line Detection
The segmentation also provides a method of findingprominent linear features in the range data sets. Theintersection of the planar regions provides three dimen-sional lines which can be used both for registering multi-ple range images and matching 3-D lines with 2-D linesfrom imagery. Extraction of 3-D lines is done in threestages:
1. We compute the infinite 3–D lines at the inter-section of the extracted planar regions. We donot consider every possible pair of planar regionsbut only those whose three-dimensional boundingboxes are close wrt each other (distance thresholddbound). The computation of the distance betweentwo bounding boxes is very fast. However this mea-sure may be inaccurate. Thus we may end up withlines which are the intersection of non-neighboringplanes.
2. In order to filter out fictitious lines which are pro-duced by the intersection of non-neighboring planeswe disregard all lines whose distance from both pro-ducing polygons is larger than a threshold dpoly .The distance of the 3–D line from a convex poly-gon (both the line and the polygon lie on the sameplane) is the minimum distance of this line fromevery edge of the polygon. In order to compute the
distance between two line segments we use a fastalgorithm described in [17].
3. Finally we need to keep the parts of the infinite 3–D lines which are verified from the data set (thatis we extract linear segments out of the infinite 3–D lines). We compute the distance between everypoint of the clusters Π1 & Π2 and the line L (Π1
& Π2 are the two neighboring planar clusters ofpoints whose intersection produces the infinite lineL). We then create a list of the points whose dis-tance from the line L is less than dpoly (see previousparagraph). Those points (points which are closewrt the limit dpoly to the line) are projected on theline. The linear segment which is bounded by thosepoints is the final result.
Figure 3d shows 3-D lines recovered using this methodand Figure 3e shows these lines overlaid on the 2-D im-age of the building in Figure 3a after registering thecamera’s viewpoint with the range data.3.3 Registering Range Data
To create a complete description of a scene we needto acquire and register multiple range images. The reg-istration (computation of the rotation matrix R andtranslation vector T) between the coordinate systemsof the nth range image (Cn) and the first image (C0) isdone when a matched set of 3–D features of the nth andfirst image are given. The 3–D features we use are infi-nite 3–D lines which are extracted using the algorithmdescribed in the previous section. A linear feature f isrepresented by the pair of vectors (n,p), where n is thedirection of the line and p a point on the line. A solu-tion for the rotation and translation is possible when atleast two line matches are given. The rotation matrixR can be computed according to the closed form solu-tion described in [10]. The minimization of the errorfunction Σ||ni
′ −Rni||2 (where ni′,ni is the ith pair of
matched line orientations between the two coordinatesystems) leads to a closed form solution of the rotation(expressed as a quaternion).
Given the solution for the rotation we solve for thetranslation vector T. We establish a correspondencebetween two arbitraty points on line < n,p >, pj =p + tj n and two points on its matched line < n′,p′ >,pj′ = p′ + t′j n′. Thus we have two vector equations
pj′ = Rpj +T which are linear in the three components
of the translation vector and the four uknown parame-ters (tj , t′j) (2x3 linear equations and 7 uknowns). Atleast two matched lines provide enough constraints tosolve the problem through the solution of a linear over-constrained system of equations. Results of the regis-tration are presented in section 4.3.4 2–D Line Detection
The computation of 2–D linear image segments isdone in the following manner:
1. Application of Canny edge detection with hystere-sis thresholding. That provides chains of 2–D edgeswhere each edge is one pixel in size (edge tracking).We used the program xcv of the TargetJr distribu-tion [25] in order to compute the Canny edges.
2. Segmentation of each chain of 2–D edges into lin-ear parts. Each linear part has a minimum lengthof lmin edges and the maximum least square de-viation from the underlying edges is nthresh. Thefitting is incremental, that is we try to fit the maxi-mum number of edges to a linear segment while wetraverse the edge chain (orthogonal regression).
3.5 Registration of Range and Image DataWe now describe the fusion of the information pro-
vided by the range and image sensors. These two sensorsprovide information of a qualitatively different natureand have distinct projection models. While the rangesensor provides the distance between the sensed pointsand its center of projection, the image sensor capturesthe light emitted from scene points. The fusion of infor-mation between those two sensors requires the knowl-edge of the internal camera parameters (effective focallength, principal point and distortion parameters) andthe relative position and orientation between the centersof projection of the camera and the range sensor. Theknowledge of those parameters allows us to invert theimage formation process and to project back the colorinformation captured by the camera on the 3–D pointsprovided by the range sensor. Thus we can create aphotorealistic representation of the environment.
The estimation of the unknown position and orien-tation of an internally calibrated camera wrt the rangesensor is possible if a corresponding set of 3–D and 2–Dfeatures is known. Currently, this corresponding set offeature matches is provided by the user but our goal isits automatic computation (see section 5 for a proposedmethod).
We adapted the algorithm proposed by Kumar &Hanson [16] for the registration between range and 2–Dimages. The input is a set of corresponding 3–D and2–D line pairs. The internal calibration parameters ofthe camera are assumed to be known.
Let Ni be the normal of the plane formed by the ithimage line and the center of projection of the camera(figure 4). This vector is expressed in the coordinatesystem of the camera. The sum of the squared per-pendicular distance of the endpoints e1
i and e2i of the
corresponding ith 3–D line from that plane is
di = (Ni · (R(e1i ) + T))2 + (Ni · (R(e2
i ) + T))2, (1)
where the endpoints e1i and e2
i are expressed in the co-ordinate system of the range sensor. The error functionwe wish to minimize is
E1(R,T) = ΣNi=1di. (2)
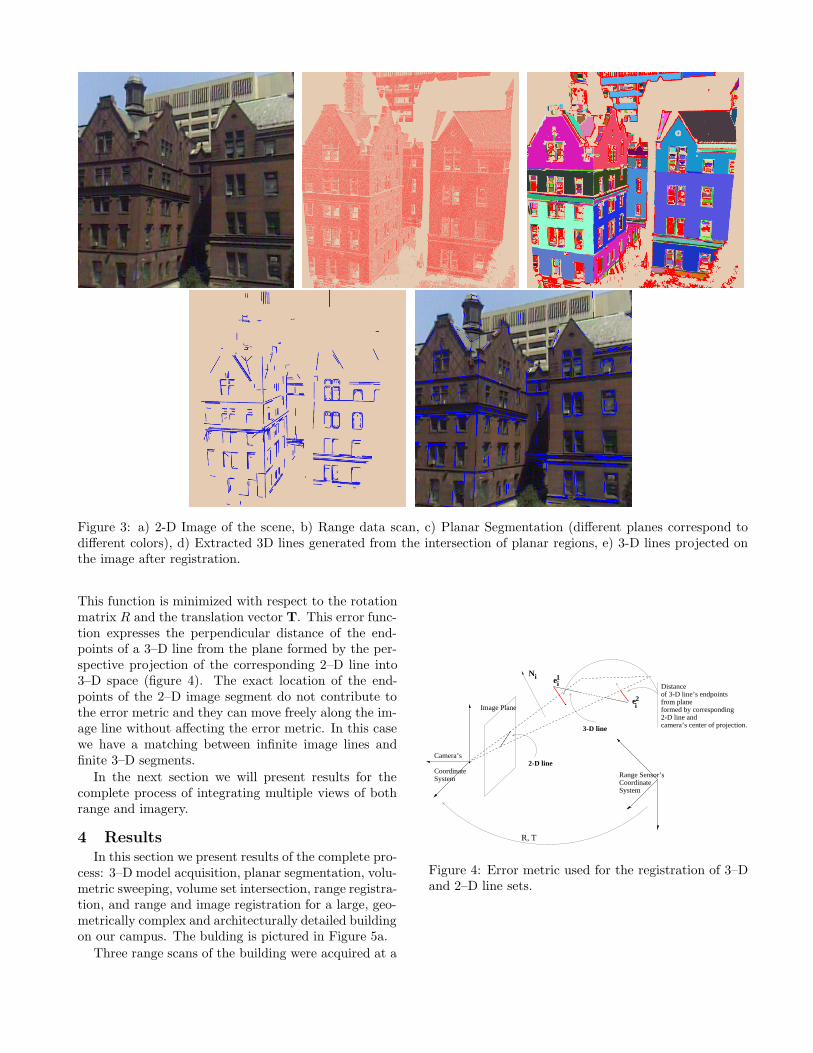
Figure 3: a) 2-D Image of the scene, b) Range data scan, c) Planar Segmentation (different planes correspond todifferent colors), d) Extracted 3D lines generated from the intersection of planar regions, e) 3-D lines projected onthe image after registration.
This function is minimized with respect to the rotationmatrix R and the translation vector T. This error func-tion expresses the perpendicular distance of the end-points of a 3–D line from the plane formed by the per-spective projection of the corresponding 2–D line into3–D space (figure 4). The exact location of the end-points of the 2–D image segment do not contribute tothe error metric and they can move freely along the im-age line without affecting the error metric. In this casewe have a matching between infinite image lines andfinite 3–D segments.
In the next section we will present results for thecomplete process of integrating multiple views of bothrange and imagery.
4 ResultsIn this section we present results of the complete pro-
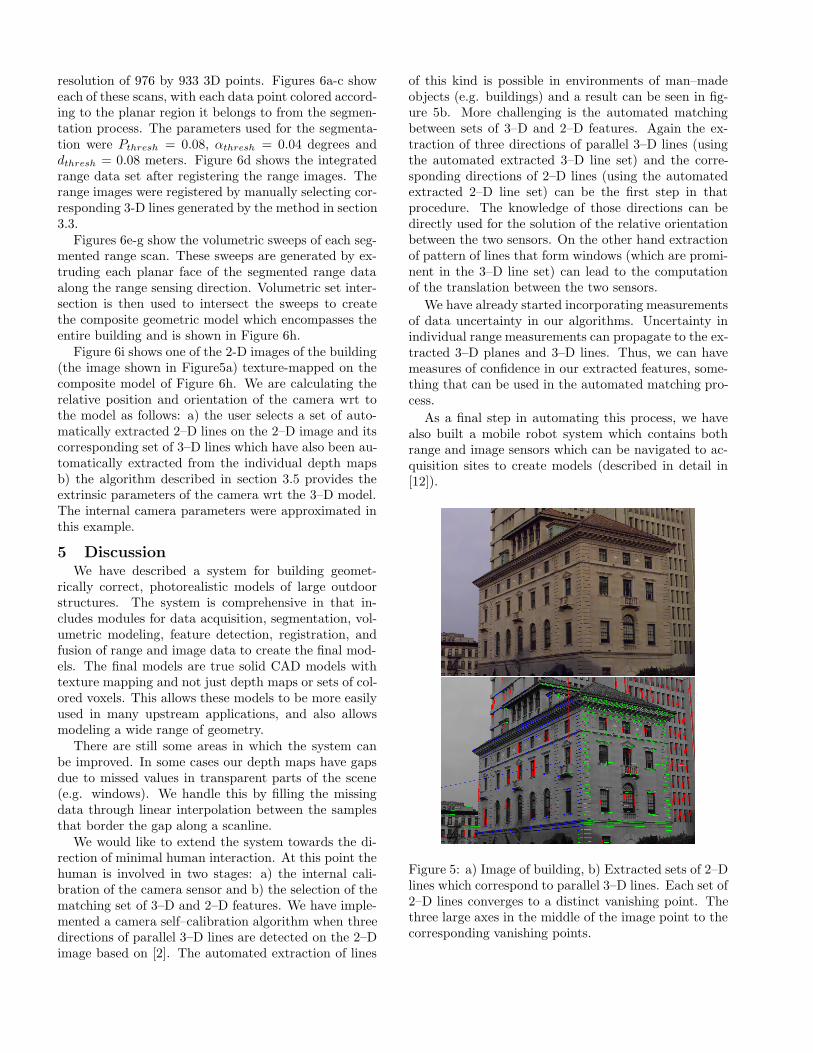
cess: 3–D model acquisition, planar segmentation, volu-metric sweeping, volume set intersection, range registra-tion, and range and image registration for a large, geo-metrically complex and architecturally detailed buildingon our campus. The bulding is pictured in Figure 5a.
Three range scans of the building were acquired at a
����
��
��������
���
���
R, T
Ne
ei
i1
2
3-D line
2-D line
i
Image Plane
Camera’s
CoordinateSystem Range Sensor’s
CoordinateSystem
Distanceof 3-D line’s endpointsfrom planeformed by corresponding2-D line and camera’s center of projection.
Figure 4: Error metric used for the registration of 3–Dand 2–D line sets.
resolution of 976 by 933 3D points. Figures 6a-c showeach of these scans, with each data point colored accord-ing to the planar region it belongs to from the segmen-tation process. The parameters used for the segmenta-tion were Pthresh = 0.08, αthresh = 0.04 degrees anddthresh = 0.08 meters. Figure 6d shows the integratedrange data set after registering the range images. Therange images were registered by manually selecting cor-responding 3-D lines generated by the method in section3.3.
Figures 6e-g show the volumetric sweeps of each seg-mented range scan. These sweeps are generated by ex-truding each planar face of the segmented range dataalong the range sensing direction. Volumetric set inter-section is then used to intersect the sweeps to createthe composite geometric model which encompasses theentire building and is shown in Figure 6h.
Figure 6i shows one of the 2-D images of the building(the image shown in Figure5a) texture-mapped on thecomposite model of Figure 6h. We are calculating therelative position and orientation of the camera wrt tothe model as follows: a) the user selects a set of auto-matically extracted 2–D lines on the 2–D image and itscorresponding set of 3–D lines which have also been au-tomatically extracted from the individual depth mapsb) the algorithm described in section 3.5 provides theextrinsic parameters of the camera wrt the 3–D model.The internal camera parameters were approximated inthis example.
5 DiscussionWe have described a system for building geomet-
rically correct, photorealistic models of large outdoorstructures. The system is comprehensive in that in-cludes modules for data acquisition, segmentation, vol-umetric modeling, feature detection, registration, andfusion of range and image data to create the final mod-els. The final models are true solid CAD models withtexture mapping and not just depth maps or sets of col-ored voxels. This allows these models to be more easilyused in many upstream applications, and also allowsmodeling a wide range of geometry.
There are still some areas in which the system canbe improved. In some cases our depth maps have gapsdue to missed values in transparent parts of the scene(e.g. windows). We handle this by filling the missingdata through linear interpolation between the samplesthat border the gap along a scanline.
We would like to extend the system towards the di-rection of minimal human interaction. At this point thehuman is involved in two stages: a) the internal cali-bration of the camera sensor and b) the selection of thematching set of 3–D and 2–D features. We have imple-mented a camera self–calibration algorithm when threedirections of parallel 3–D lines are detected on the 2–Dimage based on [2]. The automated extraction of lines
of this kind is possible in environments of man–madeobjects (e.g. buildings) and a result can be seen in fig-ure 5b. More challenging is the automated matchingbetween sets of 3–D and 2–D features. Again the ex-traction of three directions of parallel 3–D lines (usingthe automated extracted 3–D line set) and the corre-sponding directions of 2–D lines (using the automatedextracted 2–D line set) can be the first step in thatprocedure. The knowledge of those directions can bedirectly used for the solution of the relative orientationbetween the two sensors. On the other hand extractionof pattern of lines that form windows (which are promi-nent in the 3–D line set) can lead to the computationof the translation between the two sensors.
We have already started incorporating measurementsof data uncertainty in our algorithms. Uncertainty inindividual range measurements can propagate to the ex-tracted 3–D planes and 3–D lines. Thus, we can havemeasures of confidence in our extracted features, some-thing that can be used in the automated matching pro-cess.
As a final step in automating this process, we havealso built a mobile robot system which contains bothrange and image sensors which can be navigated to ac-quisition sites to create models (described in detail in[12]).
Figure 5: a) Image of building, b) Extracted sets of 2–Dlines which correspond to parallel 3–D lines. Each set of2–D lines converges to a distinct vanishing point. Thethree large axes in the middle of the image point to thecorresponding vanishing points.
AcknowledgmentsWe would like to thank Michael K. Reed for help in
generating the 3–D models.
References[1] S. Becker and V. M. J. Bove. Semi–automatic 3–D
model extraction from uncalibrated 2–D camera views.In SPIE Visual Data Exploration and Analysis II, vol-ume 2410, pages 447–461, February 1995.
[2] S. C. Becker. Vision–assisted modeling from model–based video representations. PhD thesis, MassachusettsInstitute of Technology, February 1997.
[3] J.-A. Beraldin, L. Cournoyer, M. Rioux, F. Blais, S. El-Hakim, and G. Godin. Object model creation frommultiple range images: Acquisition, calibration, modelbuilding and verification. In International Conferenceon Recent Advances in 3–D Digital Imaging and Mod-eling, pages 326–333, Ottawa, Canada, May 1997.
[4] P. J. Besl and R. C. Jain. Segmentation throughvariable–order surface fitting. IEEE Transactions onPattern Analysis and Machine Intelligence, 10(2):167–192, march 1988.
[5] S. Coorg and S. Teller. Extracting textured vertical fa-cades from contolled close-range imagery. In ComputerVision and Pattern Recognition, pages 625–632, FortCollins, Colorado, 1999.
[6] S. R. Coorg. Pose Imagery and Automated Three–Dimensional Modeling of Urban Environments. PhDthesis, MIT, September 1998.
[7] B. Curless and M. Levoy. A volumetric method forbuilding complex models from range images. In SIG-GRAPH, pages 303–312, 1996.
[8] P. E. Debevec, C. J. Taylor, and J. Malik. Modelingand rendering architecure from photographs: A hybridgeometry-based and image-based approach. In SIG-GRAPH, 1996.
[9] S. F. El-Hakim, P. Boulanger, F. Blais, and J.-A. Be-raldin. A system for indoor 3–D mapping and virtualenvironments. In Videometrics V, July 1997.
[10] O. Faugeras. Three–Dimensional Computer Vision.The MIT Press, 1996.
[11] A. W. Fitzgibbon and A. Zisserman. Automatic 3Dmodel acquisition and generation of new images fromvideo sequences. In Proceedings of European Signal Pro-cessing Conference (EUSIPCO ’98), Rhodes, Greece,pages 1261–1269, 1998.
[12] A. Gueorguiev, P. K. Allen, E. Gold, and P. Blair. De-sign, architecture and control of a mobile site modelingrobot. Submitted to IEEE International Conference onRobotics & Automation, April 2000.
[13] A. Hoover, G. Jean-Baptise, X. Jiang, et al. An exper-imental comparison of range image segmentation algo-rithms. In IEEE Transactions on Pattern Analysis andMachine Intelligence, pages 1–17, july 1996.
[14] Institute of Industrial Science(IIS), The University ofTokyo. Urban Multi–Media/3D Mapping workshop,Japan, 1999.
[15] X. Jiang and H. Bunke. Edge detection in range imagesbased on scan line approximation. Computer Vision andImage Understanding, 73(2):183–199, February 1999.
[16] R. Kumar and A. R. Hanson. Robust methods forestimating pose and a sensitivity analysis. ComputerVision Graphics and Image Processing, 60(3):313–342,November 1994.
[17] V. J. Lumelsky. On fast computation of distance be-tween line segments. Information Processing Letters,21:55–61, 1985.
[18] MIT City Scanning Project.http://graphics.lcs.mit.edu/city/city.html.
[19] O. Monga, R. Deriche, and J.-M. Rocchisani. 3D edgedetection using recursive filtering: Application to scan-ner images. Computer Vision Graphics and Image Pro-cessing, 53(1):76–87, January 1991.
[20] R. Pito and R. Bajcsy. A solution to the next bestview problem for automated cad model acquisition offree-form objects using range cameras. In SPIE Sym-posium on Intelligent Systems and Advanced Manufac-turing, Philadelphia, October 1995.
[21] M. Reed and P. K. Allen. 3-D modeling from rangeimagery. Image and Vision Computing, 17(1):99–111,February 1999.
[22] M. Reed and P. K. Allen. Constraint-based sensor plan-ning for scene modeling. In Computational Intelligencein Robotics and Automation (CIRA99), November 7-91999.
[23] M. Reed, P. K. Allen, and I. Stamos. Automated modelacquisition from range images with view planning. InComputer Vision and Pattern Recognition Conference,pages 72–77, June 16-20 1997.
[24] H.-Y. Shum, M. Han, and R. Szeliski. Interactive con-struction of 3D models from panoramic mosaic. In Com-puter Vision and Pattern Recognition, Santa Barbara,CA, June 1998.
[25] TargetJr standard software platform.http://www.esat.kuleuven.ac.be/t̃argetjr/.
[26] S. Teller, S. Coorg, and N. Master. Acquisition of alarge pose-mosaic dataset. In Computer Vision andPattern Recognition, pages 872–878, Santa Barbara,CA, June 1998.
[27] G. Turk and M. Levoy. Zippered polygon meshes fromrange images. In SIGGRAPH, 1994.
[28] Visual Information Technology Group, Canada.http://www.vit.iit.nrc.ca/VIT.html.
[29] H. Zhao and R. Shibasaki. A system for reconstructingurban 3D objects using ground–based range and CCDsensors. In Urban Multi–Media/3D Mapping workshop,Institute of Industrial Science(IIS), The University ofTokyo, 1999.
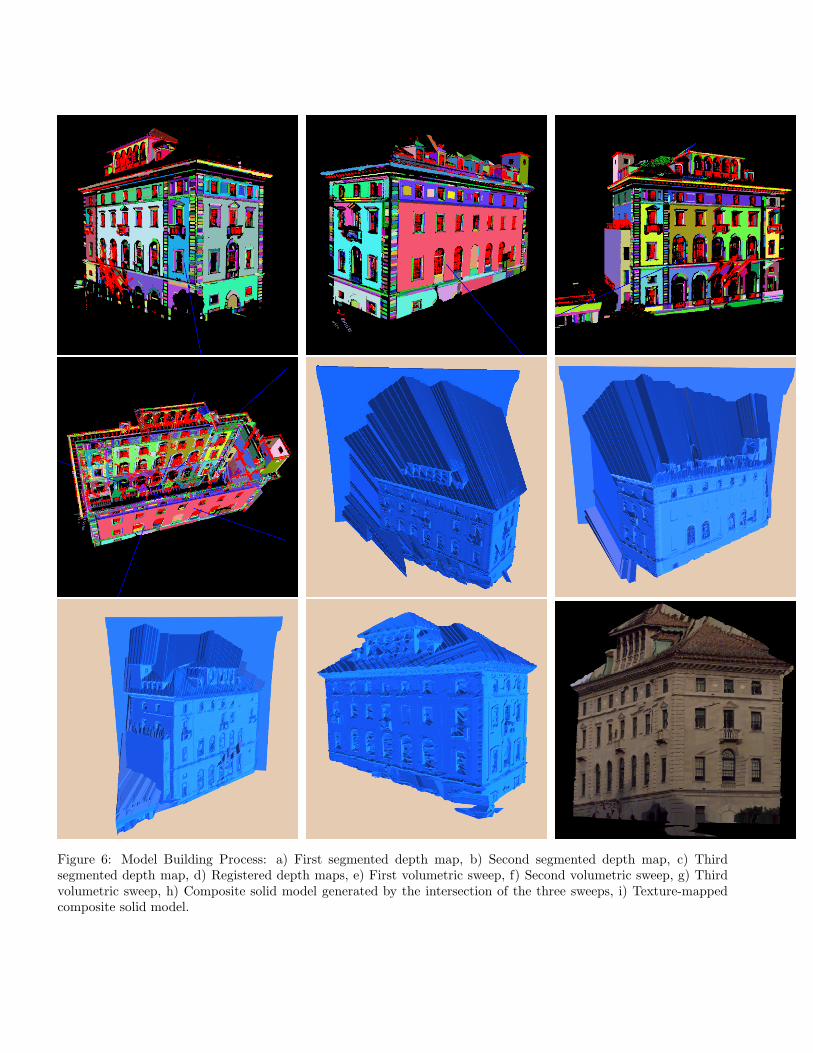
Figure 6: Model Building Process: a) First segmented depth map, b) Second segmented depth map, c) Thirdsegmented depth map, d) Registered depth maps, e) First volumetric sweep, f) Second volumetric sweep, g) Thirdvolumetric sweep, h) Composite solid model generated by the intersection of the three sweeps, i) Texture-mappedcomposite solid model.