Embed Size (px)
Citation preview
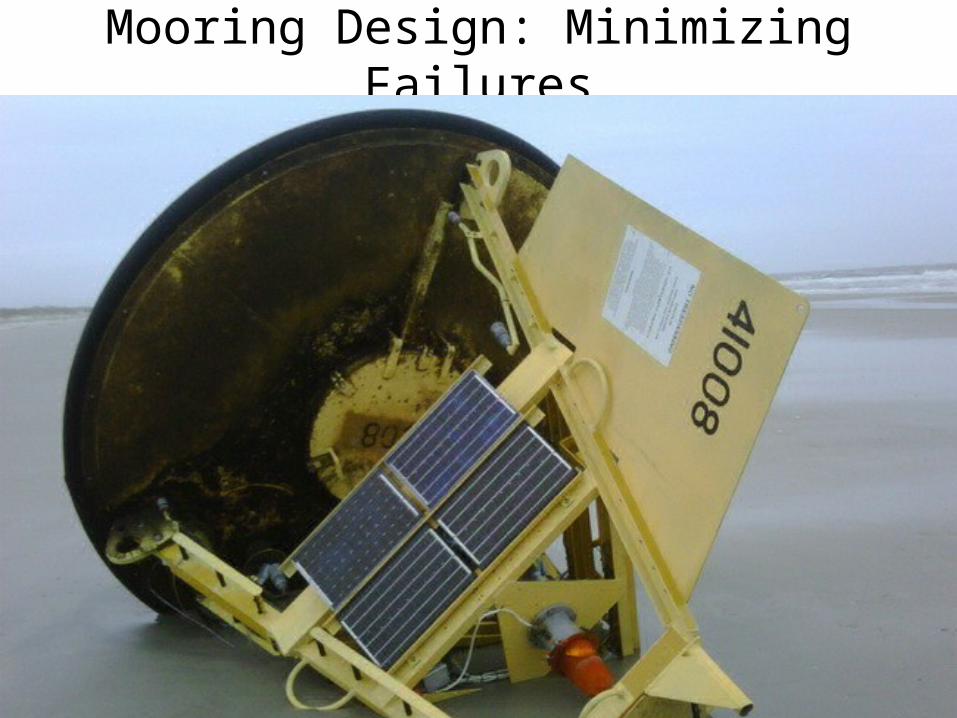
Mooring Design: Minimizing Failures
Pacific Marine Environmental Pacific Marine Environmental LaboratoryLaboratoryA leader in developing ocean observational systems to address NOAA’s mission

Overview:
Pacific Marine Environmental Pacific Marine Environmental LaboratoryLaboratoryA leader in developing ocean observational systems to address NOAA’s mission
• Scientific Mission?
• Pick a Platform Design
• Site Assessment: ‘The Big Three’
• Pick a Mooring Design
• Iterate on Mooring Design
• Mooring Modeling
• Bending
• Shock Loading
• Mooring Performance?
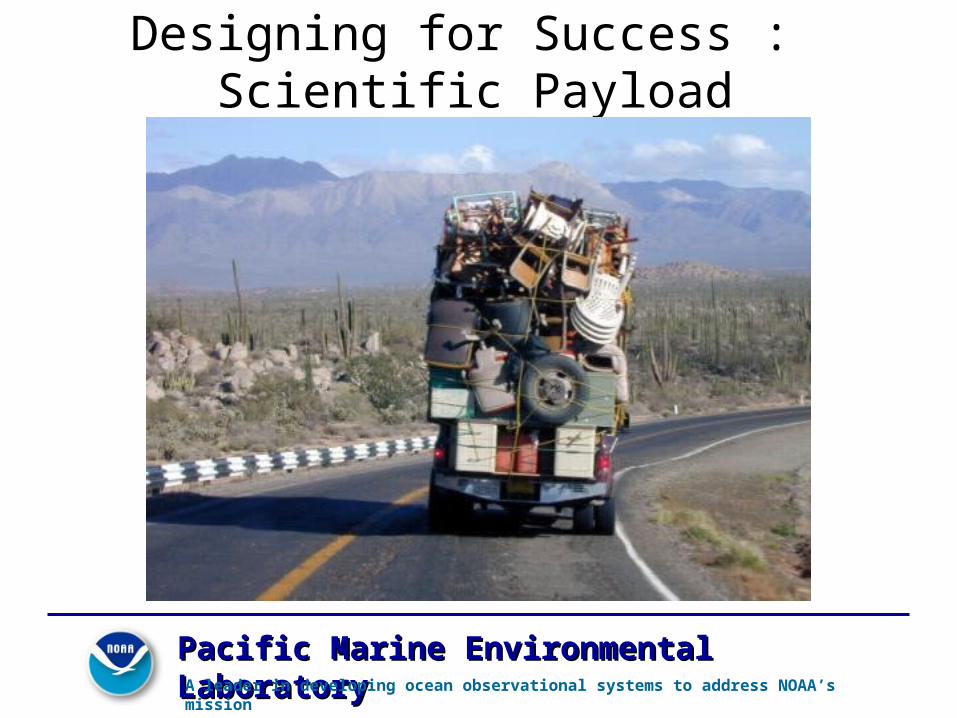
Designing for Success : Scientific Payload
Pacific Marine Environmental Pacific Marine Environmental LaboratoryLaboratoryA leader in developing ocean observational systems to address NOAA’s mission
Designing for Success : Site Assessment
Pacific Marine Environmental Pacific Marine Environmental LaboratoryLaboratoryA leader in developing ocean observational systems to address NOAA’s mission
The ‘Big’ Three:• Water Depth
• Currents
• Wave Conditions (slope)
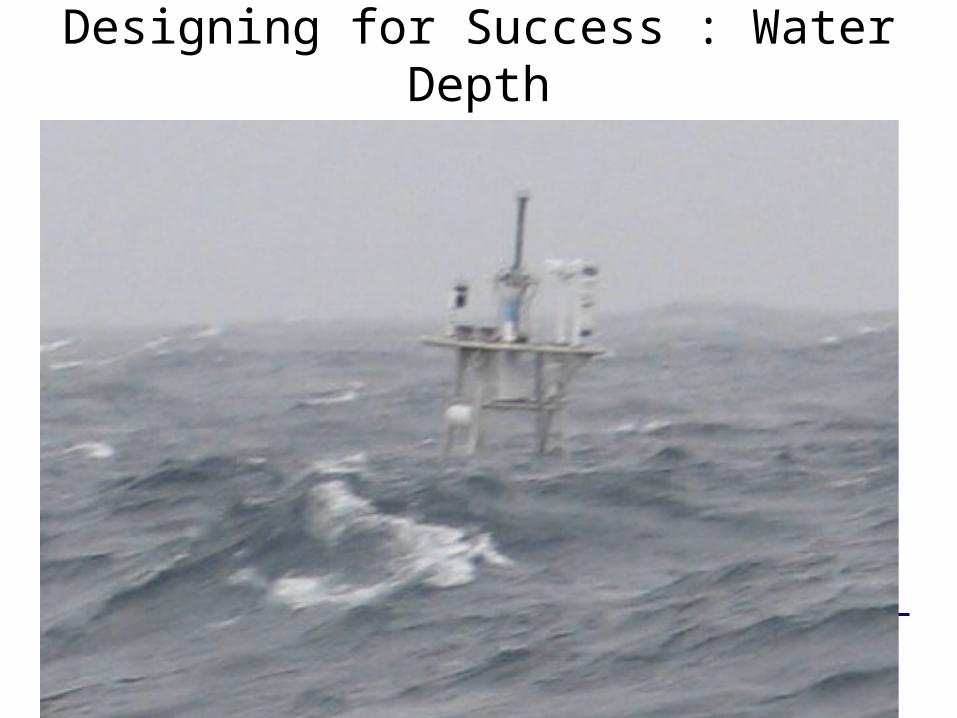
Designing for Success : Water Depth
Pacific Marine Environmental Pacific Marine Environmental LaboratoryLaboratoryA leader in developing ocean observational systems to address NOAA’s mission
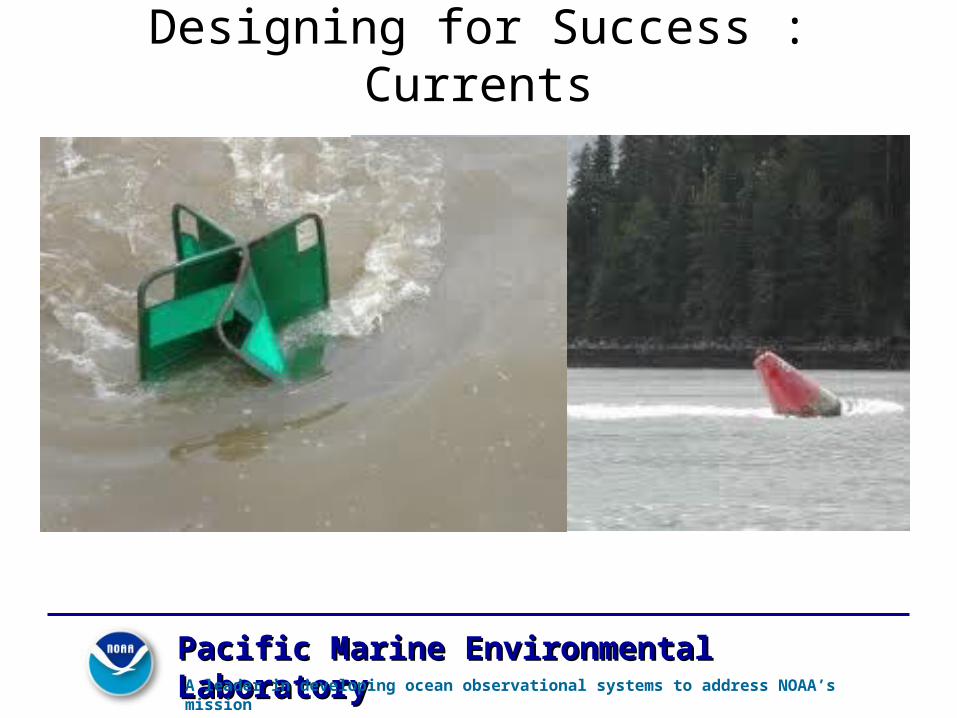
Designing for Success : Currents
Pacific Marine Environmental Pacific Marine Environmental LaboratoryLaboratoryA leader in developing ocean observational systems to address NOAA’s mission
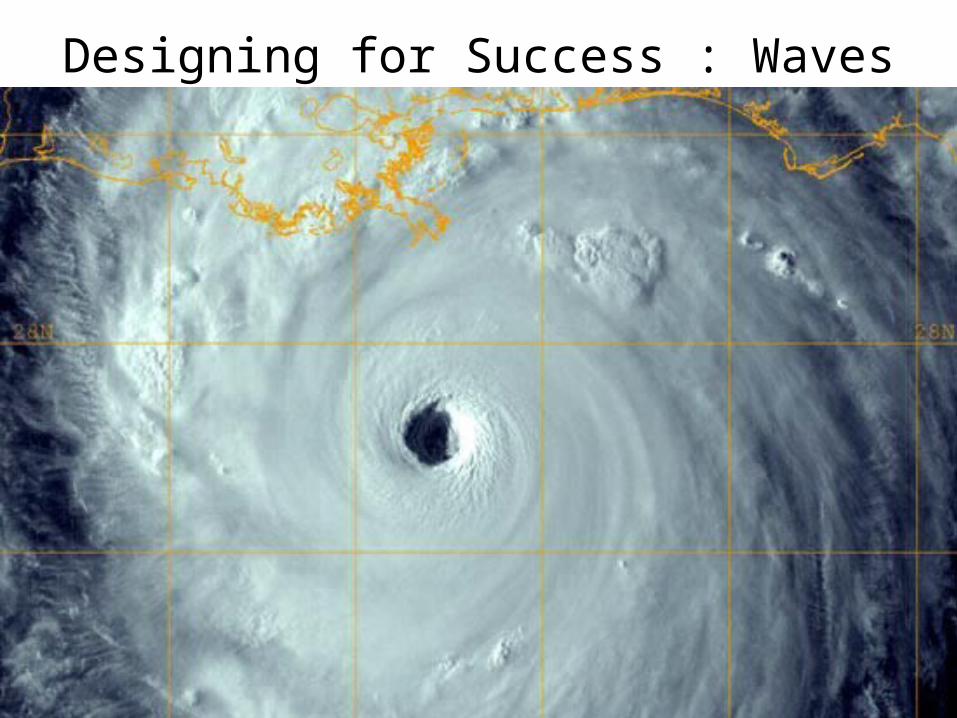
Designing for Success : Waves
Pacific Marine Environmental Pacific Marine Environmental LaboratoryLaboratoryA leader in developing ocean observational systems to address NOAA’s mission
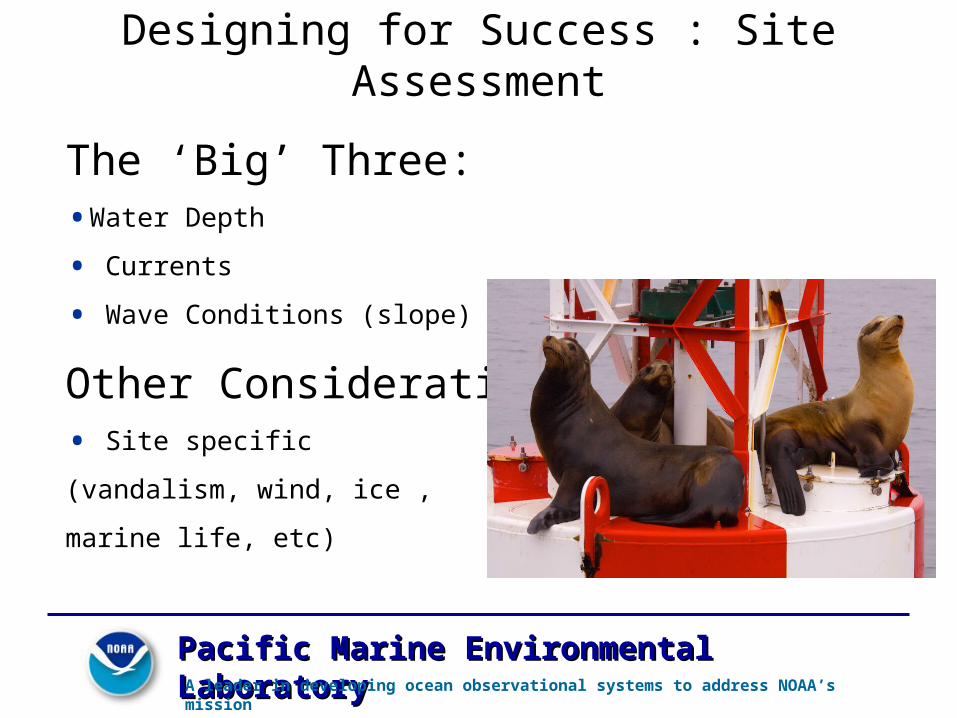
Designing for Success : Site Assessment
Pacific Marine Environmental Pacific Marine Environmental LaboratoryLaboratoryA leader in developing ocean observational systems to address NOAA’s mission
The ‘Big’ Three:•Water Depth
• Currents
• Wave Conditions (slope)
Other Considerations:• Site specific
(vandalism, wind, ice ,
marine life, etc)
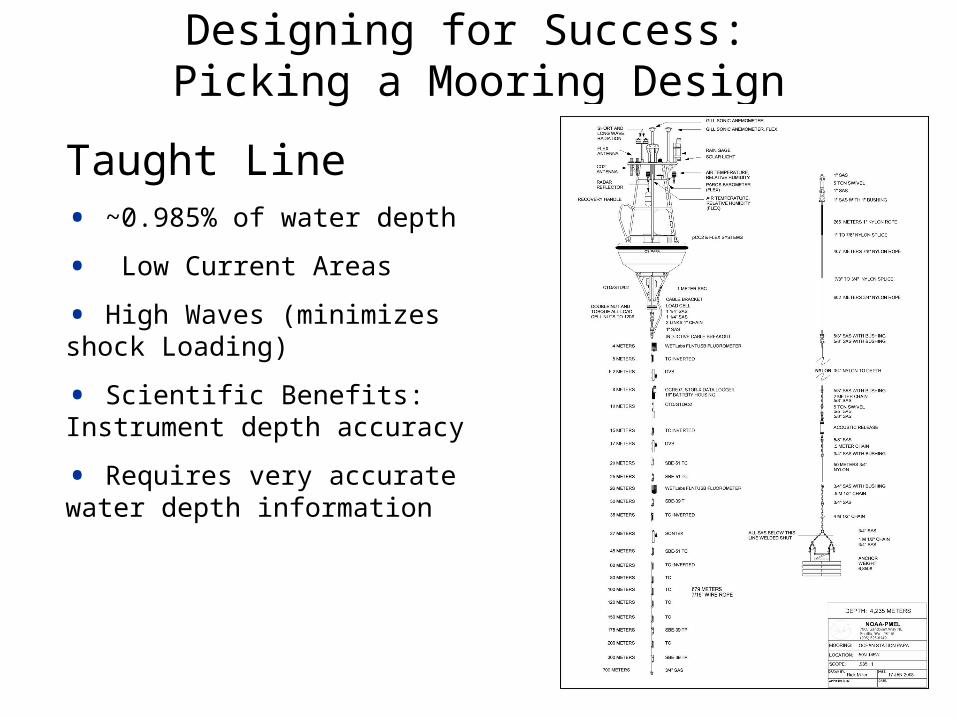
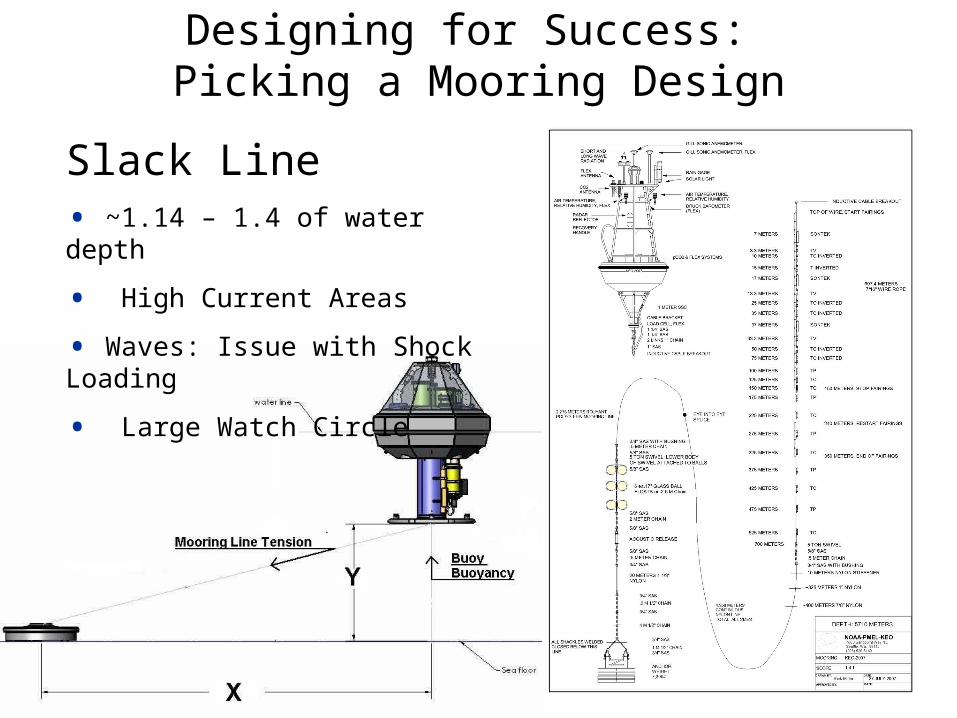
Designing for Success: Picking a Mooring Design
Taught Line• ~0.985% of water depth
• Low Current Areas
• High Waves (minimizes shock Loading)
• Scientific Benefits: Instrument depth accuracy
• Requires very accurate water depth information
Designing for Success: Picking a Mooring Design
Slack Line• ~1.14 – 1.4 of water depth
• High Current Areas
• Waves: Issue with Shock Loading
• Large Watch Circle
Designing for Success: Mooring Modeling
Pacific Marine Environmental Pacific Marine Environmental LaboratoryLaboratoryA leader in developing ocean observational systems to address NOAA’s mission
WHOI CABLE• Freeware program: www.gobatconsulting.com/Cable
• Both Static and Dynamic Outputs
• ONLY as accurate as the data you input
• Accurate to ~10% if Currents are well known.
• NOT SUPPORTED
OrcaFlex• Expensive
• Supported
•ONLY as accurate as the data you input
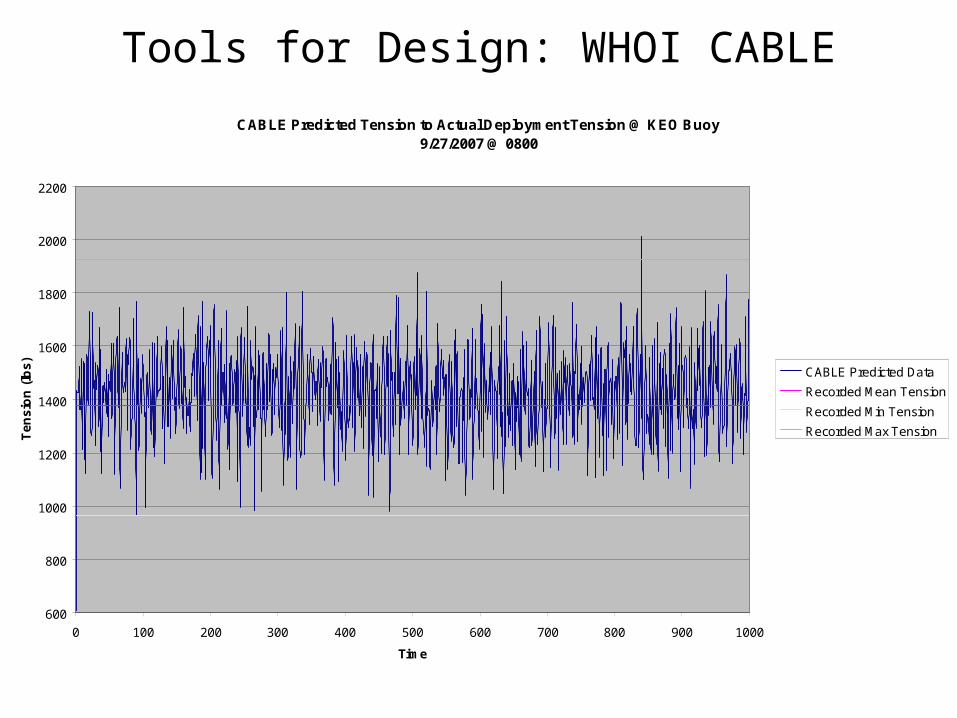
Tools for Design: WHOI CABLECABLE Predicted Tension to Actual Deployment Tension @ KEO Buoy
9/27/2007 @ 0800
600
800
1000
1200
1400
1600
1800
2000
2200
0 100 200 300 400 500 600 700 800 900 1000
Time
Tens
ion
(lbs) CABLE Predicted Data
Recorded Mean TensionRecorded Min TensionRecorded Max Tension
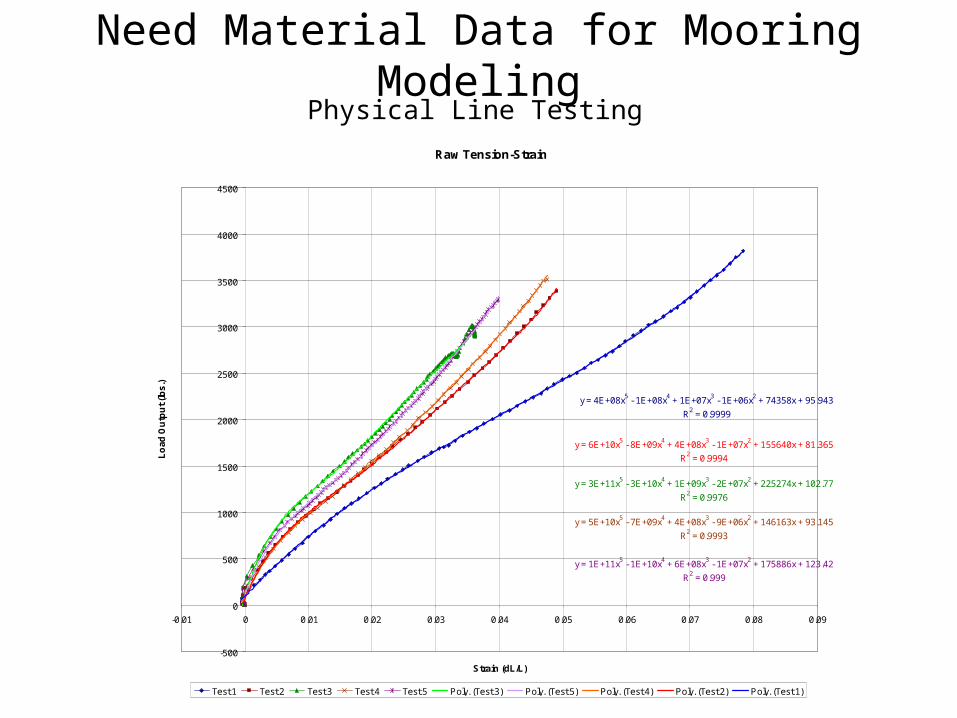
Need Material Data for Mooring ModelingPhysical Line Testing
Raw Tension-Strain
y = 3E+11x5 - 3E+10x4 + 1E+09x3 - 2E+07x2 + 225274x + 102.77R2 = 0.9976
y = 1E+11x5 - 1E+10x4 + 6E+08x3 - 1E+07x2 + 175886x + 123.42R2 = 0.999
y = 5E+10x5 - 7E+09x4 + 4E+08x3 - 9E+06x2 + 146163x + 93.145R2 = 0.9993
y = 6E+10x5 - 8E+09x4 + 4E+08x3 - 1E+07x2 + 155640x + 81.365R2 = 0.9994
y = 4E+08x5 - 1E+08x4 + 1E+07x3 - 1E+06x2 + 74358x + 95.943R2 = 0.9999
-500
0
500
1000
1500
2000
2500
3000
3500
4000
4500
-0.01 0 0.01 0.02 0.03 0.04 0.05 0.06 0.07 0.08 0.09
Strain (dL/L)
Load
Out
put (
lbs.
)
Test 1 Test 2 Test 3 Test 4 Test 5 Poly. (Test 3) Poly. (Test 5) Poly. (Test 4) Poly. (Test 2) Poly. (Test 1)
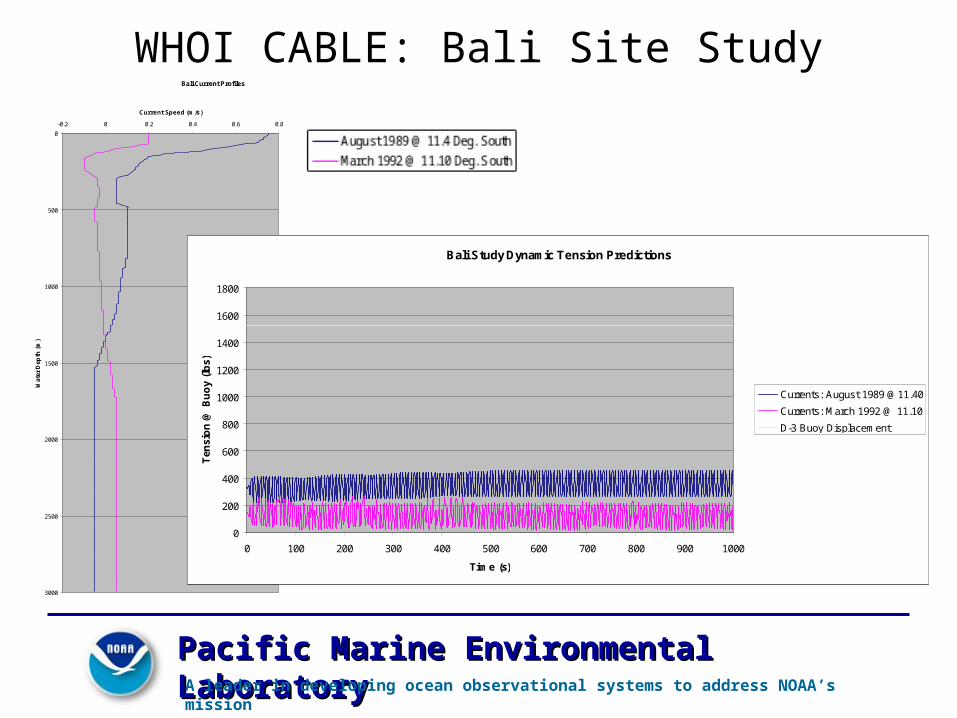
WHOI CABLE: Bali Site Study
Pacific Marine Environmental Pacific Marine Environmental LaboratoryLaboratoryA leader in developing ocean observational systems to address NOAA’s mission
Bali Current Profiles
0
500
1000
1500
2000
2500
3000
-0.2 0 0.2 0.4 0.6 0.8
Current Speed (m/s)
Wat
er D
epth
(m)
August 1989 @ 11.4 Deg. South
March 1992 @ 11.10 Deg. South
Bali Study Predicted Catenary
0
500
1000
1500
2000
2500
3000
3500
0 500 1000 1500 2000 2500 3000 3500
Horizontal Distance frm Anchor (m)
Wat
er H
eigh
t (m
)
Currents: March 1992 @11.10Currents: August [email protected] Surface
Bali Study Static Tension Predictions (D-3 Buoy Displacement: ~1525 lbs)
0
500
1000
1500
2000
2500
3000
3500
0 50 100 150 200 250 300 350
Tension @ Buoy (lbs)
Wat
er H
iegh
t (m
)
Currents: August 1989 @11.40
Currents: March 1992 @ 11.10
Bali Study Dynamic Tension Predictions
0
200
400
600
800
1000
1200
1400
1600
1800
0 100 200 300 400 500 600 700 800 900 1000
Time (s)
Tens
ion
@ B
uoy
(lbs)
Currents: August 1989 @11.40
Currents: March 1992 @ 11.10
D-3 Buoy Displacement
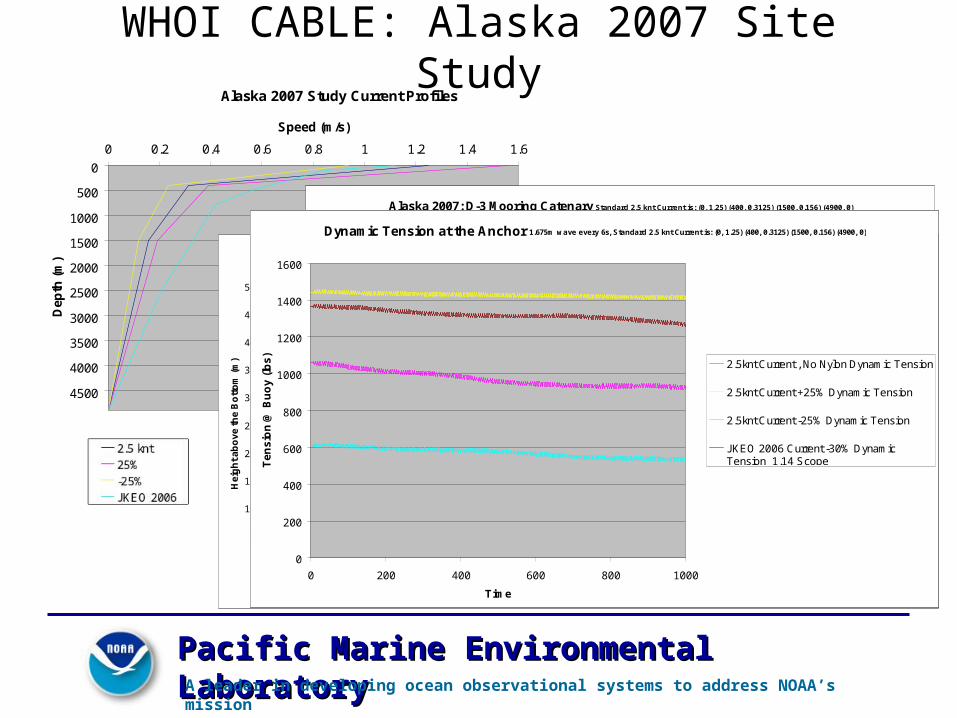
WHOI CABLE: Alaska 2007 Site Study
Pacific Marine Environmental Pacific Marine Environmental LaboratoryLaboratoryA leader in developing ocean observational systems to address NOAA’s mission
Alaska 2007 Study Current Profiles
0
500
1000
1500
2000
2500
3000
3500
4000
4500
0 0.2 0.4 0.6 0.8 1 1.2 1.4 1.6
Speed (m/s)
Dep
th (m
)
2.5 knt25%-25%JKEO 2006
Alaska 2007: D-3 Mooring Catenary Standard 2.5 knt Current is: (0, 1.25) (400, 0.3125) (1500, 0.156) (4900, 0)
0
500
1000
1500
2000
2500
3000
3500
4000
4500
5000
0 1000 2000 3000 4000 5000
Horizontal Distance From Anchor (m)
Hei
ght a
bove
the
Bot
tom
(m)
2.5 Knt Current Catenary
2.5 Knt Current, No Nylon Catenary
2.5 Knt Current + 25% Catenary
2.5 Knt Current - 25% Catenary
4900m Mean Water Depth
JKEO 2006 Current - 30% Catenary_1.14ScopeJKEO 2006 Current - 30% Catenary
Alaska 2007: Static Tension Standard 2.5 knt Current is: (0, 1.25) (400, 0.3125) (1500, 0.156) (4900, 0)
0
500
1000
1500
2000
2500
3000
3500
4000
4500
5000
0 200 400 600 800 1000 1200 1400 1600
Tension (lbs)
Hei
ght a
bove
the
Bot
tom
(m)
2.5 Knt Current Static Tension
2.5 Knt Current, No Nylon Static Tension
2.5 Knt Current + 25% Static Tension
2.5 Knt Current - 25% Static Tension
D-3 Buoy Displacement
JKEO 2006 Current - 30% Static Tension_1.14ScopeJKEO 2006 Current - 30% Static Tension
Alaska 2007: Dynamic Tension 1.675m wave every 6s, Standard 2.5 knt Current is: (0, 1.25) (400, 0.3125) (1500, 0.156) (4900, 0)
0
200
400
600
800
1000
1200
1400
1600
1800
0 200 400 600 800 1000
Time
Tens
ion
@ B
uoy
(lbs)
2.5knt Current Dynamic Tension
2.5knt Current , No Nylon Dynamic Tension
2.5knt Current +25% Dynamic Tension
2.5knt Current -25% Dynamic Tension
D-3 Buoy Displacement
JKEO 2006 Current -30% DynamicTension_1.14 ScopeJKEO 2006 Current -30% DynamicTension
Dynamic Tension at the Anchor 1.675m wave every 6s, Standard 2.5 knt Current is: (0, 1.25) (400, 0.3125) (1500, 0.156) (4900, 0)
0
200
400
600
800
1000
1200
1400
1600
0 200 400 600 800 1000
Time
Tens
ion
@ B
uoy
(lbs) 2.5knt Current , No Nylon Dynamic Tension
2.5knt Current +25% Dynamic Tension
2.5knt Current -25% Dynamic Tension
JKEO 2006 Current -30% DynamicTension_1.14 Scope
Designing for Success: Best Practices
Pacific Marine Environmental Pacific Marine Environmental LaboratoryLaboratoryA leader in developing ocean observational systems to address NOAA’s mission
• Bending regions:• Mooring Components
• Instruments near the surface
• Shock Loading
• Properly Sized Components:• 3 strand nylon: ~11% RBS
• 12-strand polyester: ~20% RBS (10% RBS for shock loading)
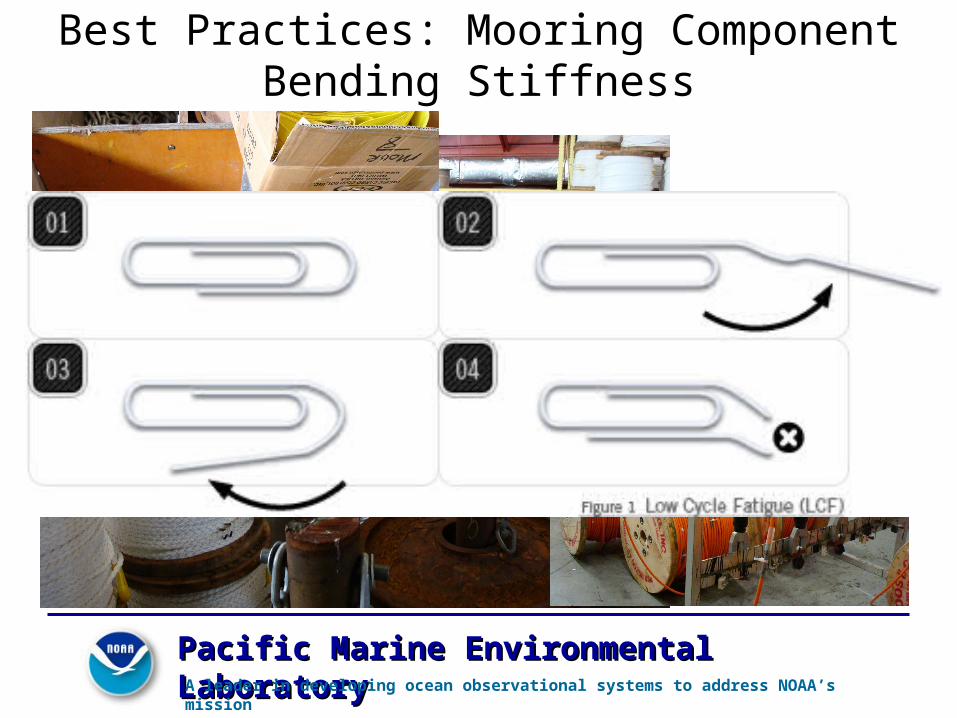
Best Practices: Mooring Component Bending Stiffness
Pacific Marine Environmental Pacific Marine Environmental LaboratoryLaboratoryA leader in developing ocean observational systems to address NOAA’s mission
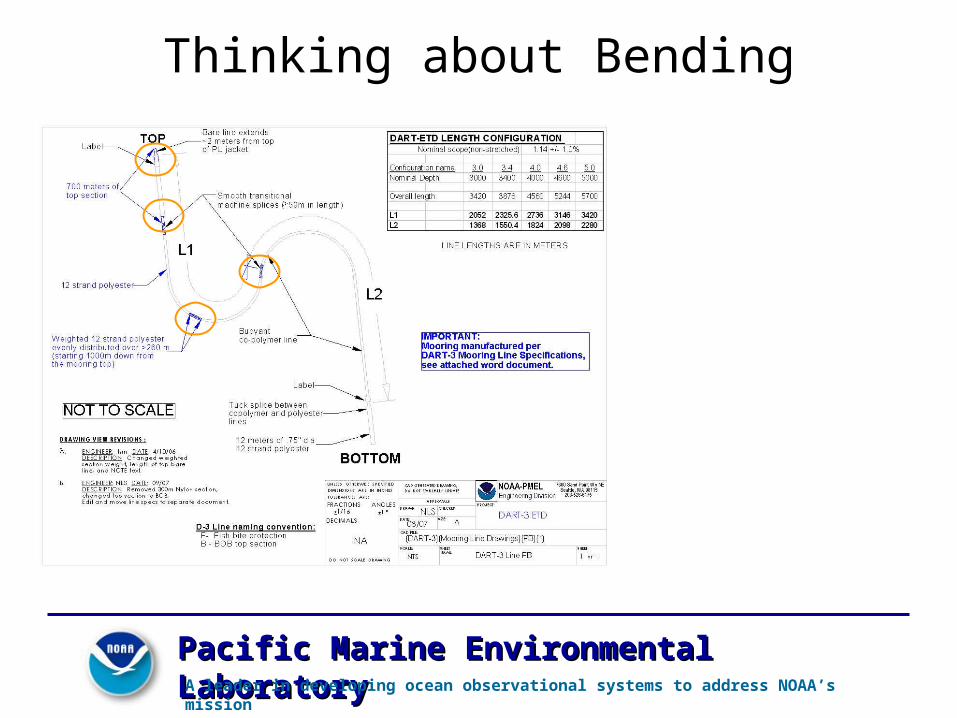
Thinking about Bending
Pacific Marine Environmental Pacific Marine Environmental LaboratoryLaboratoryA leader in developing ocean observational systems to address NOAA’s mission
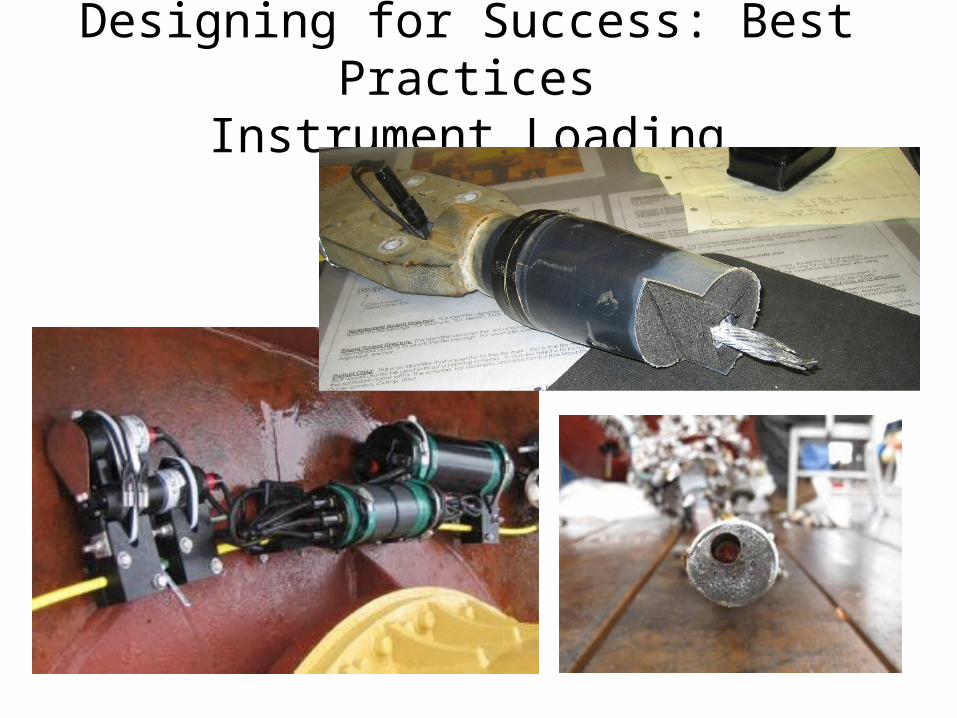
Designing for Success: Best PracticesInstrument Loading
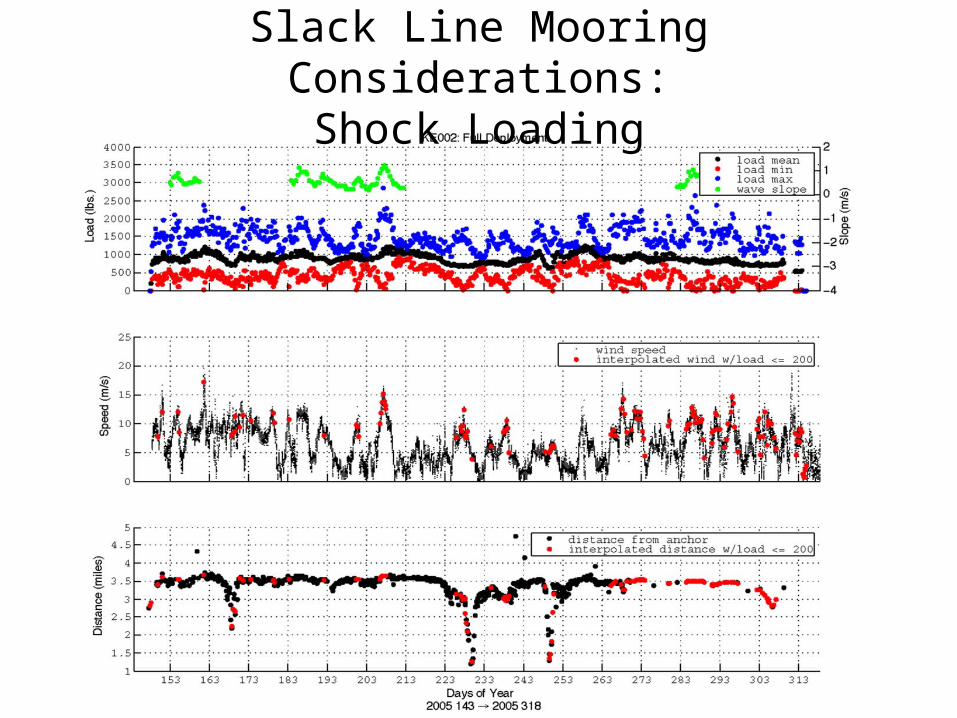
Slack Line Mooring Considerations:Shock Loading
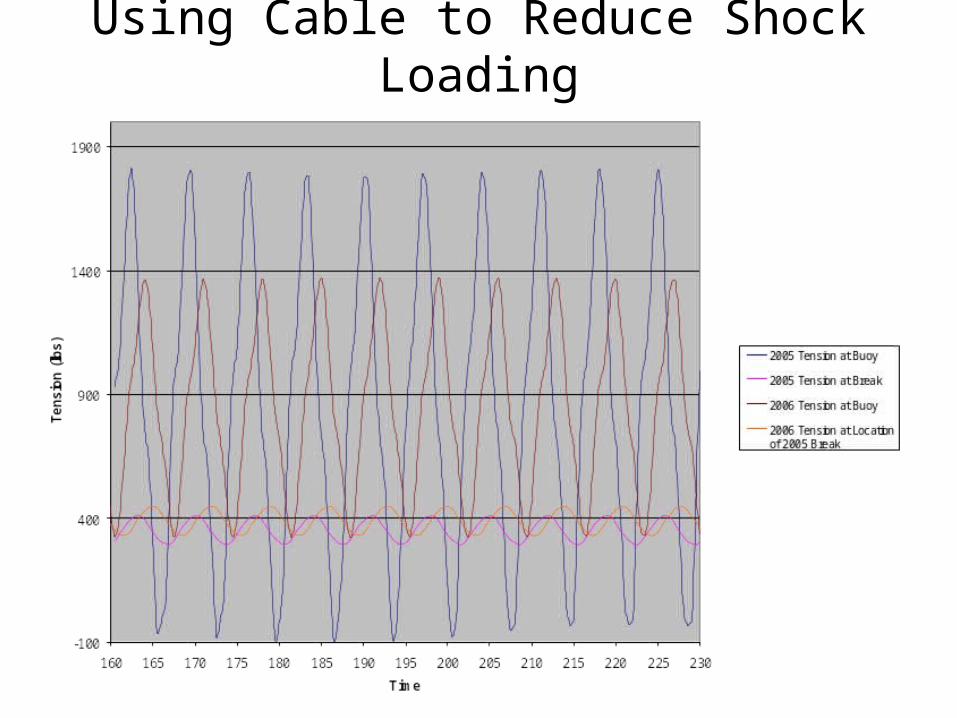
Using Cable to Reduce Shock Loading
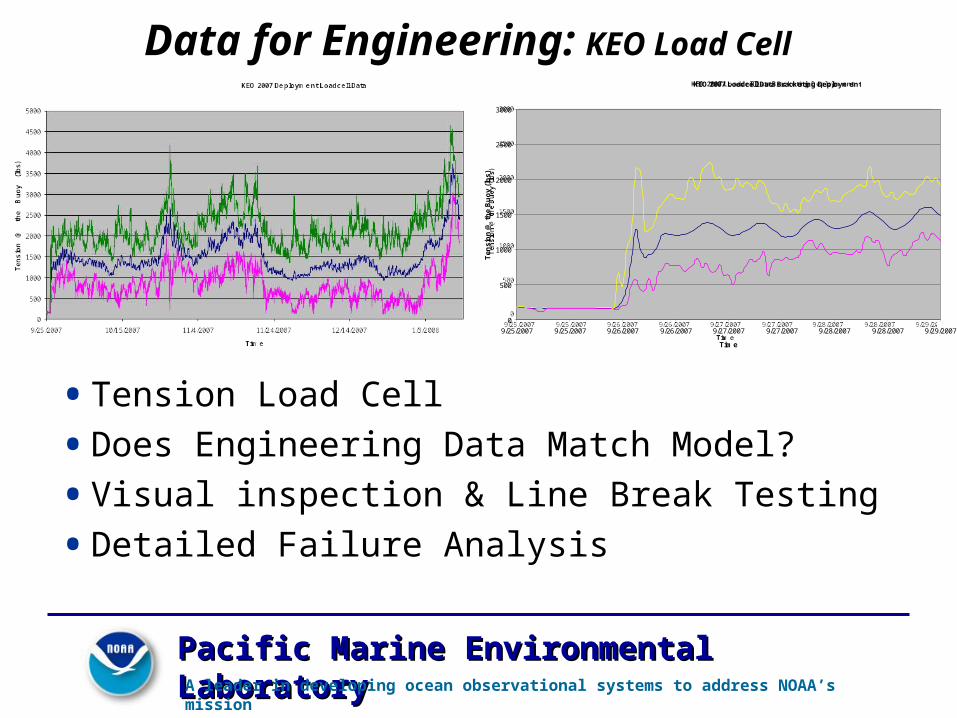
Data for Engineering: KEO Load Cell
• Tension Load Cell• Does Engineering Data Match Model?• Visual inspection & Line Break Testing• Detailed Failure Analysis
KEO 2007 Loadcell Data Bracketing Deployment
0
500
1000
1500
2000
2500
3000
9/25/2007 9/25/2007 9/26/2007 9/26/2007 9/27/2007 9/27/2007 9/28/2007 9/28/2007 9/29/2007
Time
Tens
ion
@ th
e B
uoy
(lbs)
KEO Mean Loadcell Data
KEO Mininium Loadcell Data
KEO Maximium Loadcell Data
Pacific Marine Environmental Pacific Marine Environmental LaboratoryLaboratoryA leader in developing ocean observational systems to address NOAA’s mission
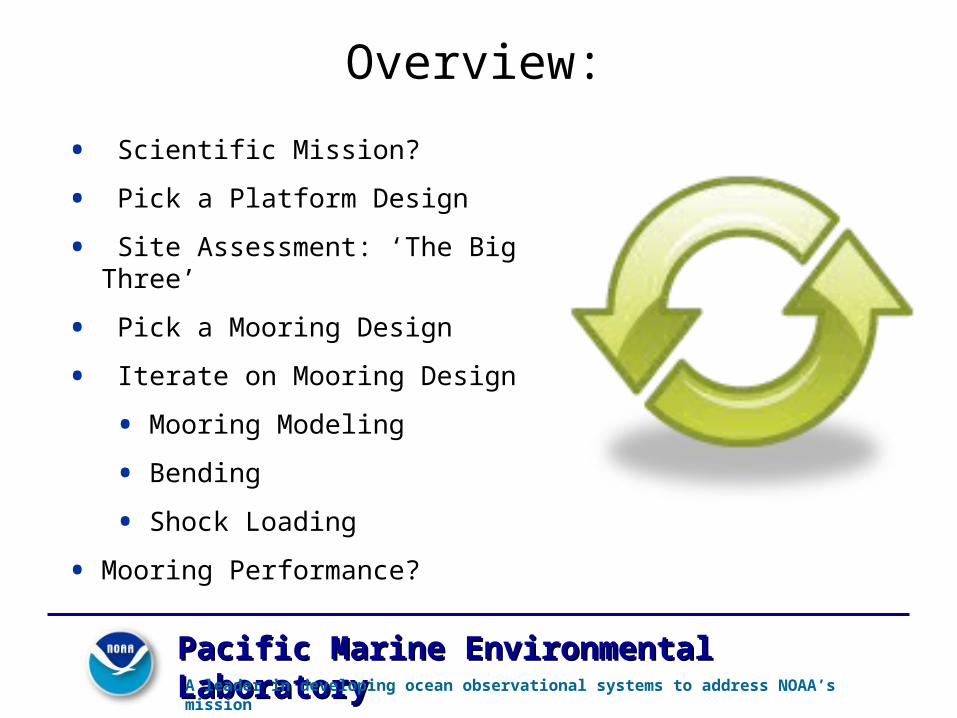
Overview:
Pacific Marine Environmental Pacific Marine Environmental LaboratoryLaboratoryA leader in developing ocean observational systems to address NOAA’s mission
• Scientific Mission?
• Pick a Platform Design
• Site Assessment: ‘The Big Three’
• Pick a Mooring Design
• Iterate on Mooring Design
• Mooring Modeling
• Bending
• Shock Loading
• Mooring Performance?
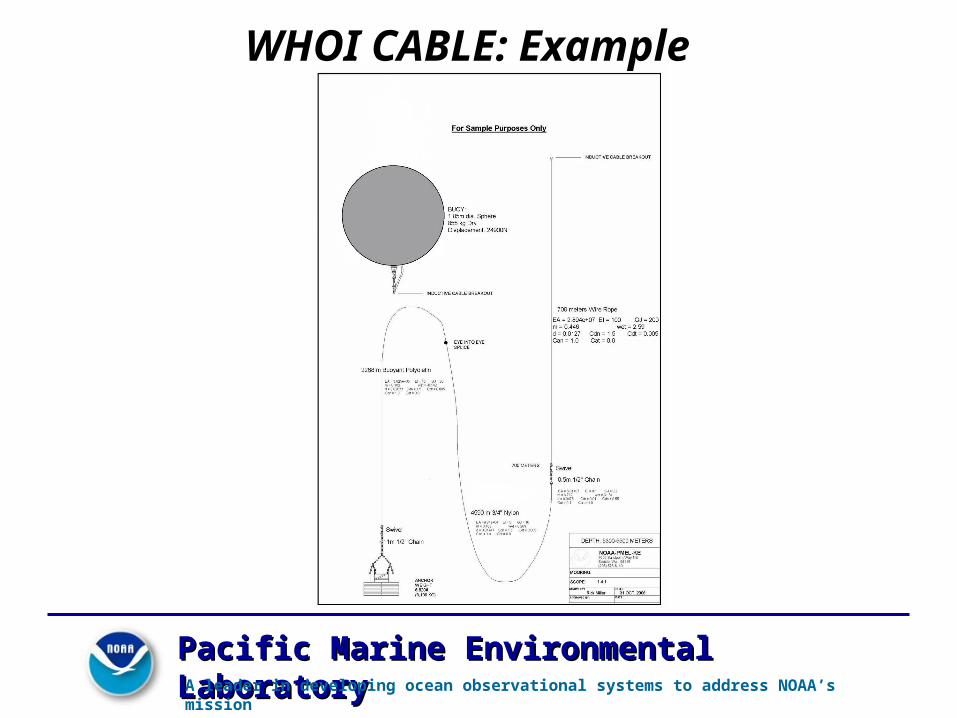
WHOI CABLE: Example
Pacific Marine Environmental Pacific Marine Environmental LaboratoryLaboratoryA leader in developing ocean observational systems to address NOAA’s mission