Embed Size (px)
Citation preview

Immunogenetics 16: 471-483, 1982 Immunogenetics
© Springer-Verlag 1982
Involvement of Mhc Loci in Immune Responses That Are Not Ir-Gene-Controlled
Matko Marusic\ Zoltan A. N agy2, Ulrich Koszinowski3, and Jan Klein2
1 Oepartment of Physiology, Faculty of Medicine, University of Zagreb, Zagreb, Yugoslavia 2 Abteilung Immungenetik, Max-Planck-Institut für Biologie, 7400 Tübingen,
Federal Republic of Germany 3 Bundesforschungsanstalt für Viruskrankheiten der Tiere, 7400 Tübingen,
Federal Republic of Germany
Abstract. Twenty-nine randomly chosen, soluble antigens, many ofthem highly complex, were used to immunize mice oftwo strains, C3H and BlO.RIII. Lymphnode cells from the immunized mice were restimulated in vitro with the priming antigens and the proliferative response of the cells was determined. Both strains were responders to 28 of 29 antigens. Eight antigens were then used to immunize' 11 congenic strains carrying different H-2 haplotypes, and the T-cell proliferative responses of these strains were determined. Again, all the strains responded to seven ofthe eight antigens. These experiments were then repeated, but this timeantibodies specific for the A (AaAß) or E (EaEß) molecules were added to the culture to block the in vitro responsiveness. In all but one of the responses, inhibition with both A-specific and E-specific antibodies was observed. The response to one antigen (Blastomyces) was exceptional in that some strains were nonresponders to this antigen. Furthermore, the response in the responder strains was blocked with A-specific, but not with E-specific, antibodies. The study demonstrates that responses to antigens not controlled by Ir genes nevertheless require participation of c1ass Ir Mhc molecules. In contrast to Ir gene-controlled responses involving either the A- or the E-molecule controlling loci (but never both), the responses not I r-controlled involve participation of both A- and E-controlling loci. The lack of Ir-gene control is probably the result of complexity of the responses to multiple determinants. There is thus no principal difference between responses controlled and those not controlled by Ir genes: both types involve the recognition of the antigen, in the context of Mhc molecules.
Abbreviations used in this paper: A, c1ass TI MHC molecule consisting of the A, and Aß chains; AOH, a1cohol dehydrogenase; APC, antigen-presenting cell; cpm; counts per minute; E, c1ass TI Mhc molecule consisting ofthe E. and Aß chains; Ir, immune response; KLH, key-hole !impet hemocyanin; Mhc, major histocompatibility complex; PBS, phosphate buffered salt solution; SO, standard deviation; SI, stimulation index; SN, supernatant of Sendai-virus preparation.
0093-7711/82/0016/0471/$ 2.60

472 M. Marusii: et al.
Introduction
When challenged with selected soluble antigens, some guinea pigs and mice mount high, and others low or no immune response in terms of antibody production in vivo (McDevitt and Sela 1965, Benacerraf and McDevitt 1972) or T-cell proliferation in vitro (Shevach et al. 1972, Schwartz and PauI1976). These differences in immune responsiveness are controlled by immune response or Ir loci mapping in the major histocompatibility complex (Mhc; McDevitt and Chinitz 1968). Evidence is accumulating to indicate that the Ir genes are in fact identical with class II Mhc genes. The strongest evidence for this identity is the finding that Ir genecontrolled proliferation of T cells can be blocked with monoclonal antibodies specific for class II Mhc molecules (Baxevanis et al. 1980, Lerner et al. 1980, Nagy et al. 1981, Nepom et al. 1981). Since the proliferating T cells recognize foreign antigens in the context of class II molecules on antigen-presenting cells (APC) - a situation analogous to that observed with cytotoxic T cells responding to cell-bound antigens (Zinkernagel and Doherty 1974) - their activation can be forstalled by coating the class II molecules of APC with antibodies (Longo and Schwartz 1981, Ishii et al. 1981). The Mhc (class II)-restricted recognition ofthe antigen by T cells on APC is the first step in a chain of interactions leading, eventually, to antibody production. Thus, the recognition by T cells of a particular combination of antigen and Mhc molecules leads to responsiveness (antibody production), whereas a failure to recognize a particular antigen-Mhc combination results in nonresponsiveness.
If the above interpretation of Ir genes is correct, all antigen-triggered, proliferative T-cell responses should be controlled by class II Mhc loci, including those responses in which Ir genes are not involved. If all combinations of a given antigen with various Mhc allomorphs (products of allelic genes) were recognized by T cells, all individuals would be responders and genetic analysis leading to the definition of Ir genes would not be possible. However, the responses would still involve Mhc molecules in the same way as the responses that are controlled by Ir genes. To test this postulate, we investigated the context of recognition in proliferative T -cell responses to 29 naturally occurring antigens. The antigens included pathogens (bacteria, viruses, fungi), metazoal parasites or their products, enzymes, hormones, and other pro teins, and thus were a representative sampie of the antigenic universe. The responses to these antigens were not known to be Ir gene-controlled, and yet, as will be demonstrated here, they did involve the recognition of class II molecules.
Materials and Methods
Mice. C3H and BIO.RIII mice were purchased, respectively, from the Zentralinstitut für Versuchstiere, Hannover, Federal Republic of Germany, and from Olac, Bicester, Great Britain; all other mice were obtained from the colony in the Max Planck Institute far Biology. Fourteen to 20-week-old female and male mice were used.
Antigens. Alcohol dehydrogenase (yeast), carbonic anhydrase (bovine erythrocytes), catalase (bovine liver), chorionic gonadotropin (human pregnancy urine), creatine phosphokinase (bovine heart), deoxyribnuc1ease I (DN-IOO, bovine pancreas), Escherichia eali (lyophilized cells of strain W), fibrinogen

Mhc and Ir Genes 473
(type I, from bovine blood), follic1e-stimulating hormone (FSH, porcine), L-glutamic dehydrogenase (bovine liver), ß-Iactoglobulin A (bovine milk), mucin (neuraminidase substrate, from bovine submaxillary glands), phosvitin (from egg vitelin), pro tein A (purified from Staphyloeoceus aureus), rennin (chymosin, from calf stornach), ribonuclease B (type Irl, from bovine pancreas), superoxide dismutase (type I, from bovine blood), thyroglobulin (porcine), trypsinogen (bovine pancreas), and xanthine oxidase (from buttermilk) were purchased from Sigma Chemical Company, SI. Louis, Missouri. Blastomyces antigen (culture filtrate), Echinococcus granulosus antigen (hydatid fluid obtained from fertile sheep cysts), and Fasciola hepatica antigen (wh ale antigen prepared from liver flukes) were obtained from Deutsche Bio-Merieux, Nürtingen, Federal Republic of Germany. Suspension of Salmonella paratyphi A-O (group A somatic antigens) was purchased from Wellcome Reagents Ltd., Beckenham, Great Britain. Diphtheria and tetanus toxoid were kindly donated by Statens Seruminstitut, Copenhagen, Denmark. When necessary, the antigens were dialyzed against phosphate buffered saline (PBS). They were dissolved in PBS (2 mg protein/ml), sterilized by )i-irradiation or filtration through 0,45 ).Im pore-size filters (Milipore), aliquoted, and stored at 20 oe.
Preparation of Sendai virus proteins. Sendai virus was grown in the allantoic cavity of 10-day-old embryonated eggs, purified by sucrose gradient centrifugation, and inactivated with ß-propiolactone (Koszinowski et aL 1977). Virus suspended in PBS (10 mg/mI) was solubilized in the detergent octyl-ß-Dglucopyranoside (Calbiochem., Giessen, Federal Republic of Germany, final concentration 50 mM) for 30 min at 20 oe. Partial separation of two glycoproteins, fusion pro tein (F) and hemagglutininneuraminidase, from other viral pro teins was achieved by centrifugation (100000 g, 30 min, 4°C). Supernatant (SN), containing mainly the viral lipids, glycoproteins, and traces ofnucleoprotein, and the pellet containing mainly the polymerase, nucleoprotein, and matrix protein, were harvested separately. The detergent was removed from the supernatant and pellet fractions by dialysis against PBS. During dialysis, a high percentage ofthe glycoproteins spontaneously reconstituted into liposomes (Hosaka and Shinizu 1972). The composition of the three fractions - complete virions, supernatant, and pellet - was determined by the SDS-polyacrylamide gel electrophoresis method of Laemmli (1970) using 5-15% gradient gels.
Monoelanal antibodies. The following antibodies were used: B17-263Rl (la.m3), B17-123R2 (la.m4), H-116-32R5 (Ia.m6), 13/4 (la.m7) (Lemke et aL 1979), 10-3.6.2 (la.mI7), 11.4.1. (determinant not yet assigned; reacts with the K molecules of H-2 haplotypes k, p, q, and r; Oi et aL 1978),17-3.3 (determinant not yet assigned; reacts with E molecules of k and r haplotypes; Ozato et aL 1980), and K25-137 (determinant not yet assigned; reacts with A molecules of b,J,j, k, q, r, and s haplotypes; N. Tada, personal communication). Ta remave any low-molecular-weight, nonspecific, inhibitory substances, the ascites fluids containing the antibodies were fractionated by ultrafiltration using XM-100 A Amicon membrane filters. The antibodies were sterilized by filtration through 0,45 ~lm pore size filters and stored at - 70 Ge.
Immunizatian. The antigens were emulsified in equal volumes of complete Freund's adjuvant (Difco, Hedinger, Stuttgart, Federal Republic of Germany), and 50 )11 volurnes were injected subcutaneously at the base ofthe tail (Corradin et aL 1977). The immunzing dose was 50 ~lg/mouse except for Blastomyces antigen (9 ~lg/mouse) and Salmonella paratyphi A-O (2.5 x 10⁸ bacteria/mouse).
T-cell proliferation assay. The standard lymph-node cell proliferation assay (Corradin et aL 1977) was used with slight modification as described previously (Baxevanis et aL 1980). The proliferative response was measured by 3H-thymidin incorporation after three days of culture. All determinations were done in triplicate, and the data were expressed in the Figures as arithmetic mean of cpm ± standard deviation and in the Tables as 6 cpm (cpm in cultures with antigen minus cpm in cultures without antigen) and stimulation index (SI, ratio of cpm in cultures with and without antigen).
Inhibition afthe response. Monoc1onal antibodies were included in the medium and present throughout the culture period. Three to fourfold dilutions of antibodies were prepared with a starting dilution of 1 :100. Percent inhibition ofthe response was calculated using theformula (A - S/A - M) x 100, in which A is cpm in cultures with antigen, S is cpm in cultures with antigen and antibody, and M is cpm in cultures without antigen and antibody.
474 M. Marusic et al.
Results
Proliferative responses of lymph-node cells from C3H mice to 29 naturally occurring antigens
Different doses of antigens were tested for their ability to induce proliferative response of lymph-node cells from immunized C3H mice (Fig. 1), and the optimal dose for each antigen was determined (arrows in Fig. 1). Most antigens elicited good responses in a concentration range from 10 to 500 )..lg/ml. Some antigens, namely Blastomyces, diphteria toxoid, E. coli, Salmonella paratyphi A-O, and Sendai virus, were toxic for cells at this concentration range, but induced proliferation at lower concentrations (from 0.1 to 5 )..lg/ml). The response to Salmonella paratyphi A-O is not shown in Fig. 1; optimal response to this antigen was obtained when 2.5 x 10⁶
bacteria were added to each weIl. All antigens were tested for their mitogenicity, that is, their ability to induce
nonspecific proliferation of nonimmune cells. Only Sendai virus, Sendai SN fraction, Echinococcus granulosus, E. coli, and Salmonella paratyphi A-O induced slight nonspecific stimulation (maximum SI = 5); all other antigens failed to stimulate nonimmune cells (SI less than 2; data not shown).
The data in Figure 1 demonstrate that an 29 tested antigens can stimulate in vitro proliferation of lymph-node cells obtained from immunized mice. This proliferation is antigen-dose dependent and specific for the immunizing antigen.
The efJect of class II-specific antibodies on the response of lymph-node cells to 27 natural antigens
To determine the involvement of dass 11 Mhc molecules in the response to the tested antigens, we attempted to block the response with monodonal dass 11-specific antibodies. To this end, we used immune lymph-node cells from C3H (H-2k
) and B10.RIII (H-2Y) mice and monodonal antibodies specific for A-molecule
determinants la.m6 and la.m17 and for E-molecule determinants la.m7 and 17-3.3; these determinants are expressed by cells of both strains. The blocking effect of antibody K25-137 was also tested in some instances, namely, those in which la.m6 and la.m17 antibodies blocked the response of BI0.RIII cells poody. Maximal inhibition ofthe response (obtained at antibody dilutions 1/100 or 1/400) is given in Table 1. With one exception, all the responses were inhibited by both A- and Especific antibodies. The extent of inhibition varied according to the H -2 haplotype of the responding mice, the specificity of the antibody used, and the immunizing antigen. Despite these variations, the data shows that both A and E molecules are involved in the proliferative responses to a comparable extent. The only exception was the Blastomyces antigen, to which BI0.RHI cens did not respond at aIl; the response of C3H cens was inhibited only with A-specific antibodies.
In determining the involvement of dass I molecules, we tested the response of both strains in the presence of a K-specific monodonal antibody 11-4.1. No significant inhibition was observed, thus indicating that the K molecule does not participate in the responses to the antigens tested (data not shown).
The antibodies were also tested for possible nonspecific inhibitory effects. An example of such a control is shown in Figure 2. Here, a response to the antigen

Mhc and Ir Genes
x
Cl (/)
+1
E
u
ALCOHOL DEHYDROGENASE
10 !A-t i
r/ 6 d.56 6.25 25 100
CHORION IC GONADOTR0'tIN
1-4 f/ 3,/ + 2 d.56 6.25 25 100
ECHINOCOCCUS GRANULOSUS
15 ! lo/!-i/ 51 + ,,0.2 0.8 3.13 12.5
FOLLICLE STIMULATINGf HORMONE!: .........
; (t !/
I Q25 50 100 200
PHOSVITIN
1.5 1/1-1 I {/ •
0.5 212.5 25 50 100
5ENDAI VIRUS
90/f- f\ sot+ 70 ~ ~.8 3.13 12.5 50
TETANUS TOXOID I 8 ' ....... 1-" /1 4 1
--'l-5 10 20 40
BLASTOMYCES CARBONIC ANHYDRAS1-i
6 2 /L i-f-i 3 • "t :,r,;! ,: '"' 0.018 0.160 ~006 0.053
CREATINE DEOXY-PHOSPHOKINA5E RIBONUCLEASE!
3 I"" 1 3
2 I/+ 2 t ...... + ..... t I t ....... 1'/ •
. d2.5 25 50 100 g6.25 12.5 25 50
E.coli FASCIOLA
• HEPATICA
51-\ 6 1-1
3 f. 4 l/' ~0.3 1.25 5\20
n/ ,,1.566.2525 100
L-GLUTAMATIC ß -LACTO-DEHYDROGENASE GLOBULINA
3 t-!/~ 2 )-1 2,/ lVI + ~12.5 25 50 100 212.52550100
PROTEIN A RENN IN
2 !_i-i 3 i-i
!/ + 2 1+
I I, ....... ! ,,0.4 1.56 6.2525 Q 0.83.13 12.5 50
SENDAI PELLET sEN DAI SN
8 'fA-i 7 fJ..i-t :1/ 5 1/
3 0.021 'oO.D70.62 5.6 50 g.0025 0.2 1.9
THYRO- TRYPSINOGEN GLOBULIN
8 t 3
" I-:r/ 2 I ..... I 41/. I,A/. 1L5 10 20 40 9:12.5 25 50 100
f.L9 Protein Iw e ((
cATALASE
4 ! ..... J-I r1
2 6.25 12.5 25 50
DIPHTHERIA
,g"i1/\ 61/ 4
d.56 6.25 25 100
FIBRINOGEN
t 3 ! t 21/ - '1 I
,,3.13 12.5 50 200
MUCIN
5 I/i,,! 4/ + 3' ,,1.56 6.25 25 100
RIBONUCLEASE-
B6 /i-!/! 4 1 2 212.5 25 50 100
SUPEROXIDE DISMUTASE ! 3 /l ....... 2 /1 •
! I 2 5 10 20 40
XANTHINE OXIDASE
3 /.1, Z!. 1't I
,~3.13 6.2512.5 25
475
Fig. 1. Proliferative lymphnode cell responses to different doses of 28 antigens (.). The cells were obtained from C3H mice immunized to a given antigen. In control cultures, proliferation was measured in the absence of antigen (0). Verticallines represent ± SD of triplicate cultures.
alcohol dehydrogenase is elicited in C3H and C57BL/6 (H-2 b) mice. The cells of
C3H mice bear determinants la.ml7 (on the A molecule), la.m7 (on the E molecule), and 11-4.1 (on the K molecule). The cells of C57BL/6 mice lack E molecules and hence do not express the la.m7 determinant; their A molecules bear the Ia.m3 but not the la.ml7 determinants. As expected, antibodies specific for the la.ml7 and la_m7 determinants did not inhibit the response of the C57BL/6 mice, and the Ia.m3-specific antibody did not influence the response of the C3H mice. Mixtures of A-specific and E-specific antibodies provide a furt her control: in C3H mice, their inhibitory effect was stronger than that of the individual A- and E-specific antibodies, but in C57BL/6 mice it did not differ from the pattern of inhibition exerted by the A-specific antibody.

476 M. Marusic et al.
Table 1. Immune response of H_2k and H_2 r cells to 27 naturally occurring antigens
Antigen Resp. Response % Inhibition of the response H-2 by antibodies specific for haplo-
type D. cpm SI A E
la.ml7 Ia.m6 Ia.m7 17-3.3
Pathogens Blastomyees k 40,379 12,33 77 65 0 0
94 1,02 Oiphtheria k 92,144 27,13 74 65 49 35 toxoid 76,761 34,95 24 12 0 8 Eehinoeoceus k 84,713 27,29 51 33 48 41 granulosus 56,991 21,24 23 21 27 30 Eseherichia k 108,019 33,23 51 46 50 43 eoli 70,310 20,02 21 (43)* 14 14 18 Faseiola k 55,190 39,87 68 52 66 45 hepatiea 69,365 17,61 52 14 30 28 Protein A k 25,851 17,86 47 74 65 22
10,602 5,16 13 (43)* 0 28 0 Salmonella k 21,565 8,47 75 78 65 44 parathyphi A-O 32,896 10,70 55 61 29 41 Sendai virus k 90,577 39,59 78 56 56 54
72,221 42,79 29 14 15 18 Tetanus toxoid k 24,110 17,77 46 64 60 50
78,626 48,77 46 28 17 28
Enzymes Alcohol k 84,729 30,70 44 21 35 24 dehydrogenase 25,181 22,36 42 6 26 18 Carbonic k 37,201 20,91 68 51 29 66 anhydrase 9,265 6,63 0 33 0 55 Catalase k 43,536 13,62 78 54 51 Not
82,207 13,77 46 31 49 52 Creatine k 36,953 15,58 69 44 86 85 phosphokinase 57,420 14,87 42 11 41 32 Oeoxyribonu- k 29,595 5,10 53 74 50 24 clease I 15,486 3,83 27 (70)* 26 41 35 L-Glutamyl k 14,615 6,18 52 61 96 72 dehydrogenase 34,241 17,18 51 17 49 17 Rennin k 58,939 10,58 72 45 52 38 (chymosin) 61,894 4,92 46 19 41 27 Ribonuclease B k 34,313 18,50 58 64 76 63
28,858 8,82 33 49 75 56 Superoxide k 38,335 30,44 75 73 64 60 dismutase 33,029 10,84 39 35 33 69 Trypsinogen k 30,364 15,61 71 85 69 56
15,782 6,88 23 60 45 57 Xanthine k 11,259 4,42 52 81 80 60 oxidase 17,524 7,50 41 45 52 52
Honnones Chorionic k ll,732 8,92 101 100 104 96 gonadotrop in 21,938 5,92 67 71 60 84 Follicle-stimula- k 11,936 5,12 66 56 92 71 ting hormone 34,716 8,65 31 0 31 28 Thyroglobulin k 82,246 30,66 57 64 40 38
12,341 7,70 39 18 48 41

Mhc and Ir Genes 477
Table 1. (Continued)
Antigen Resp. Response % Inhibition of the response H-2 by antibodies specific for haplo-
type D cpm SI A E
Ia.ml7 Ia.m6 Ia.m7 17-3.3
Others Fibrinogen k 20,807 19,50 65 71 74 76
3,101 4,86 12 55 63 65 ß-Lactoglo bu- k 24,133 6,38 53 50 83 51 lin A 23,826 8,19 17 (27)* 0 49 34 Mucin k 72,168 20,63 65 58 62 60
24,399 7,16 30 (64)* 37 58 55 Phosvitin k 26,363 4,95 99 108 113 110
28,395 9,93 9 (57)* 49 76 85
" The values in parentheses are percent inhibition with monoclonal antibody produced by hybridoma K25-137.
+ ND, not done
Fig. 2. Inhibition of proliferative lymph node-cell responses. The cells were obtained from C3H or C57BL/6 mice immunized with alcohol dehydrogenase and the cultured cells were restimulated with this same antigen. The antibodies added to cultures were specific for the A (e, anti-Ia.mI7, and ., anti-Ta.m3), the E (0, anti-Ia.m7). or the K ("') molecule. The responses indicated by the A signs were those obtained in the presence ofmixtures of A- and E-specific antibodies. The solid line indicates that the relevant antigen is expressed, and the broken line indicates that it is not expressed by the responding strain. In control cultures, proliferation was measured without antibodies, in the presence (.) or absence (0) of the antigen. Vertical bars indicate standard deviation.
-; o 6
x
0 4 <f)
+1
E 2 a. u
o 16 4 0.25 0 16 4 1 0.25
Reciprocal of serum dilution (x 10-2 )
Mhc involvement in the immune response of cells expressing different H -2 haplotypes
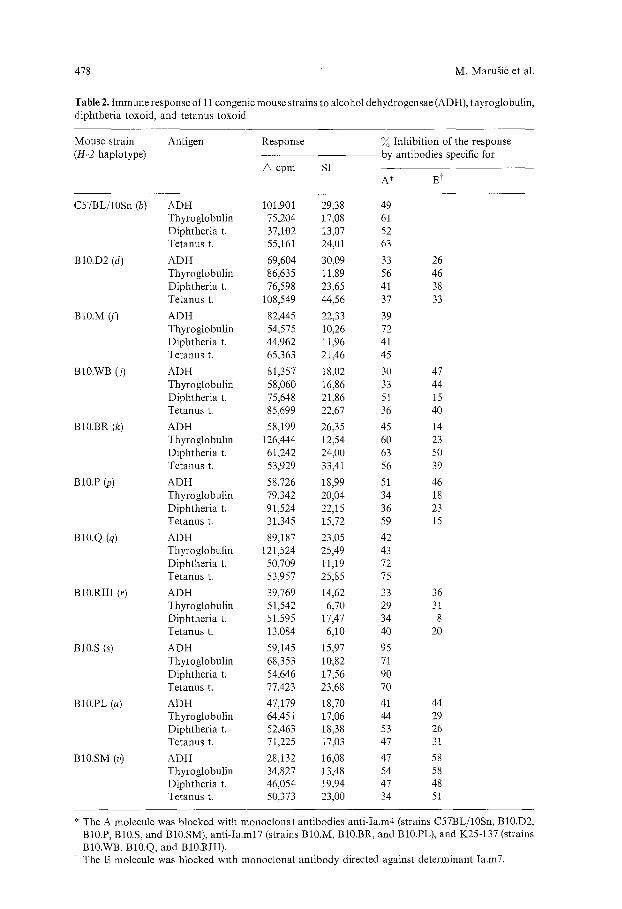
Eleven mouse strains carrying different H-2 haplotypes on the same (BIO) background were tested far their proliferative response to alcohol dehydrogenase, thyroglobulin, diphtheria toxoid, tetanus toxoid (Table 2), Sendai virus, Sendai pellet, and Sendai supernatant (Table 3). All tested mice responded weIl to all
6
4
2
478 M. Marusii; et al.
Table 2. Immune response of 11 congenic mouse strains to alcohol dehydrogensae (ADH), thyroglobulin, diphthetia toxoid, and tetanus toxoid
Mouse strain Antigen Response % Inhibition of the response (H-2 haplotype) by antibodies specific for
6 cpm SI A" Et
C57BL/lOSn (b) ADH 101,901 29,38 49 Thyroglobulin 75,204 17,08 61 Diphtheria t. 37,102 13,07 52 Tetanus t. 55,161 24,01 63
BlO.D2 (d) ADH 69,604 30,09 33 26 Thyroglobulin 86,635 11,89 56 46 Diphtheria t. 76,598 23,65 41 38 Tetanus t. 108,549 44,56 37 33
BI0.M (fJ ADH 82,445 22,33 39 Thyroglobulin 54,575 10,26 72 Diphtheria t. 44,962 11,96 41 Tetanus t. 65,363 21,46 45
BI0.wB (j) ADH 81,357 18,02 30 47 Thyroglobulin 58,060 16,86 33 44 Diphtheria t. 75,648 21,86 51 15 Tetanus t. 85,699 22,67 36 40
BI0.BR (k) ADH 58,199 26,35 45 14 Thyroglobulin 126,444 12,54 60 23 Diphtheria t. 61,242 24,00 63 50 Tetanus t. 53,929 33,41 56 39
BlO.P (P) ADH 58,726 18,99 51 46 Thyroglobulin 79,342 20,04 34 18 Diphtheria t. 91,524 22,15 36 23 Tetanus t. 31,345 15,72 59 15
BlO.Q (q) ADH 89,187 23,05 42 Thyroglobulin 121,524 25,49 43 Diphtheria t. 50,709 11,19 72 Tetanus t. 53,957 25,85 75
BI0.RIII (r) ADH 39,769 14,62 33 36 Thyroglobulin 51,542 6,70 29 31 Diphtheria t. 51,595 17,47 34 8 Tetanus t. 13,084 6,10 40 20
BI0.S (s) ADH 59,145 15,97 95 Thyroglobulin 68,353 10,82 71 Diphtheria t. 54,646 17,56 90 Tetanus t. 77,423 23,68 70
BI0.PL (u) ADH 47,179 18,70 41 44 Thyroglobulin 64,451 17,06 44 29 Diphtheria t. 52,463 18,38 53 26 Tetanus t. 71,225 17,03 47 31
BI0.SM (v) ADH 28,132 16,08 47 58 Thyroglobulin 34,827 13,48 54 58 Diphtheria t. 46,054 19,94 47 48 Tetanus t. 50,373 23,00 34 51
" The A moleeule was blocked with monoclonal antibodies anti-Ia.m4 (strains C57BL/lOSn, BI0.D2, BI0.P, BI0.S, and BI0.SM), anti-Ia.mI7 (strains BI0.M, BI0.BR, and BI0.PL), and K25-137 (strains BI0.WB, BI0.Q, and BlO.RIII) . .. The E moleeule was blocked with monoclonal antibody directed against determinant la.m7.

Mhc and Ir Genes 479
Table 3. Immune response of 11 congenic mouse strains to Sendai virus and its two components
Mouse strain Antigen Response % Inhibition of the response (H-2 haplotype) by antibodies specific far
D cpm SI A* Et
C57BL/I0Sn (b) Virus 104,906 21,64 31 Pellet 27,583 14,92 71 SN 94,220 30,00 50
BI0.o2 (d) Virus 80,709 37,36 29 30 Pellet 74,228 30,28 65 59 SN 91,305 25,45 45 37
BlO.M IJ) Virus 81,326 17,93 41 Pellet 63,964 19,35 58 SN 61,521 14,68 49
BI0.wB (j) Virus 68,951 23,15 8 5 Pellet 53,743 12,40 36 61 SN 59,748 14,27 36 51
BI0.BR (k) Virus 95,591 40,90 46 10 Pellet 76,279 29,09 64 47 SN 75,010 39,10 62 36
BI0.P (P) Virus 64,104 11,67 46 21 Pellet 26,402 16,39 73 43 SN 89,280 19,60 47 54
BI0.Q (q) Virus 74,396 21,45 32 Pellet 40,344 17,47 64 SN 94,500 26,76 57
BI0.RIII (r) Virus 33,455 12,19 5 10 Pellet 26,470 9,22 39 38 SN 33,103 12,13 5 23
BI0.S (s) Virus 72,718 27,27 34 Pellet 69,700 18,16 90 SN 76,207 23,09 64
BI0.PL (u) Virus 83,361 31,59 43 29 Pellet 66,039 18,33 60 47 SN 92,196 23,29 53 30
BI0.SM (v) Virus 48,970 23,68 19 24 Pellet 52,101 18,67 42 69 SN 58,696 24,67 40 27
*t MonocJonal antibodies were the same as in Table H.
antigens. The responses were inhibited by both the A- and E-specific antibodies, indicating that both the A and E molecules, when expressed, were equally involved in the responses. A consistent finding was a weaker inhibition of the response to Sendai virus in comparison with the inhibition of the responses to its components, a result possibly related to the larger complexity of the whole virion vis-a-vis its partially purified components (Table 3). Since BlO.RIIl mice did not respond to the

480 M. Marusic et al.
Table 4. Immune response of 11 congenic mouse strains to Blastomyses antigen
Mouse strain Response % Inhibition of tlie response (H-2 haplotype) by antibodies specific for
L, cpm SI A* E*
C57BL/I0Sn (b) 4,984 1,93 .* BI0.D2 (d) 144 1,06 BlO.M (j) 17,740 6,10 100* BI0.WB (j) 23,686 15,19 BI0.BR (k) 21,115 9,57 65* 0* BlO.P (P) -883 0,83 BI0.Q (q) 43 1,02 B 10.RIII (r) -16 0,99 BlO.S (s) 1316 1,43 BlO.PL (u) 892 1,26 BI0.SM (v) 408 1,07
* To block the A and E molecules monoclonal antibodies specific for the determinants Ia.ml7 and Ia.m7, respectively, were used.
t Not done. * . The E molecule is not expressed.
Blastomyces antigen and the response of C3H mice was restricted only by the A molecule (Table 1), we tested the response of the eleven congenic mouse strains to this antigen. Table 4 shows that except for strains carrying H-2 haplotypesj, k, andj, all other strains were nonresponders. The fact that the H-2J haplotype, which does not express the E molecule, is a responder confirms that the response is controlled by the A molecule.
Discussion
A major concern in an antibody-blocking experiment is the specificity of the inhibition which must be monitored by aseries of controls. The specificity of blocking in the experiments described in this communication is indicated by the following observations. First, irrelevant dass II-specific antibodies (i. e., antibodies against determinants not expressed by the particular APCs) had no effect on the response. Second, antibodies specific for dass I antigens were used as controls in most ofthe experiments, but they too had no effect on the response. Third, E-specific antibodies did not inhibit the response in cultures in which the APCs did not express (because of a genetic defect; see J ones et al. 1978) the E moleeule. Finally, in related experiments in which Ir-controlled responses were tested by the same antibodies as those used in the present study, there was a complete consistency of findings between the genetic mapping and the antibody blocking (Baxevanis et al. 1980, 1981, Ishii et al. 1981). We are therefore confident that our method is reliable, reproducible, and free of artifacts. In the experiments described in this communications - excepting the response to the Blastomyces antigen - all strains responded to all the antigens tested; hence none of the responses would normally be

Mhc and Ir Genes 481
classified as Ir gene-controlled. Yet, all the responses were clearly Mhc-controlled, since in all instances the response was blocked by class II-specific antibodies. There is thus no principal difference between responses controlled and not controlled by Ir genes; a seeming difference arises from some Mhc-antigen combinations failing to stimulate a response with some antigens. These nonresponding strains, however, can then be used for formal genetic analysis of the responsiveness trait.
This conclusion is supported by other studies. Dubriel et al. (1981) described clones of mouse T lymphocytes which responded by proliferation to the antigen keyhole-limpet hemocyanin (KLH) and used the E molecules as restriction elements in this recognition. Clones restricted by the A and E molecule, respectively, were described by Shigeta and Fathman (1981) in studies involving KLH as antigen and by Sprent et al. (1981) for in vivo responses to sheep red blood cells. All these antigens, like those in our study, stimulated responses that are not Ir genecontrolled and yet involve the dass II Mhc loci. Our data demonstrate the validity of these findings on a large panel of antigens and H-2 haplotypes.
The only exception in our study was the response to the Blastomyces antigen. Some of the strains tested proved to be nonresponders, and if these were used for formal genetic analysis, very likely an Ir gene would be defined controlling the response to this antigen. Since the antigens in this study were selected randomly, it is not surprising that one of them stimulates by chance an Ir gene-controlled response.
The question then arises: why do certain antigens stimulate T -cell response in all strains, whereas other antigens stimulate a similar response in only some strains? Several years ago, Benacerraf and McDevitt (1972) pointed out that in Ir genecontrolled responses the antigen is either relatively simple, as, for example, one finds with synthetic polypeptides, 01' is administered in a low dose. In both situations, the antigen confronts the responding T cells with only a few determinants. When more complex antigens 01' a higher dose of antigen are used, the Ir gene control of the response can no longer be demonstrated. Since the antigens used in the present study were deliberately chosen because of their presumed complexity, we assurne that the same explanation applies. It is likely that strains not responding to some determinants might respond to other determinants such that the overall phenotype is that of responsiveness. This interpretation is supported by our previous finding that antigens, the response to which is controlled by Ir genes, are recognized consistently in the context of one of the two dass II molecules [either A or E but never both (Baxevanis et al. 1980, Ishii et al. 1981)]. A similar conclusion can also be extrapolated from the numerous Ir gene-mapping studies (reviewed by Krco and David 1981), in which the response could be associated with either the A- or the E-molecule encoding loci but not with both. In contrast to these findings, the present study suggests that in all the strains expressing both the A and the E molecules, the response could be partially blocked by both A- and E-specific antibodies and strongly so by a mixture of these antibodies. Thus, in all tested responses (with the exception of the anti-Blastomyces response), at least two antigenic determinants were always involved, one recognized in the context ofthe A molecule and the other in the context of the E molecule. In fact, the involvement of more than two determinants is very likely. (If only two determinants had been involved, we should have chanced upon strains that were nonresponders to one or the other, or to both determinants.) We suggest, therefore, that the antigens used

482 M. Marusic et al.
here were multideterminant (and some very likely mixtures of different antigens) and, as such, stimulated mixtures of A- and E-restricted clones.
The above interpretation of nonresponsiveness could possibly explain the paradox that although the immune system is meant for protection, its repertoire is apparently full of blind spots imposing nonresponsiveness to a great number of antigens. For an individual, the presence of blind spots must be an unfavorable condition and, as such, selected against. Why does it then persist ? The answer to this question might be that for most responses the blind spots do not really matter because most natural antigens are complex and the effect of nonresponsiveness to individual antigenic determinants is lost in the general heterogeneity of the
,response. Only in some instances, when the blind spots concern certain critical determinants present on a pathogen, might the nonresponsiveness lead to astate favoring the development of a disease - perhaps of the kind one finds associated with the Mhc in the humans (Ryder et al. 1979).
The antibody blocking ofT -cell responses provides an alternative method to the genetic analysis of the immune response, Its advantage lies in the following: it is fast; it does not involve laborious, time-consuming crosses; and, most importantly, it can be used in situations where no phenotypical difference in responsiveness exists among individuals and inbred strains, i. e., situations precluding the use of formal genetic analysis.
Acknowledgments. We thank Drs. G. J. Hämmerling, D. H. Sachs, and N. Tada for sending us the hybridoma lines, Ms. Catherine Mark for growing the hybridomas and producing the ascites fluids, and Ms. Karina Masur for typing the manuscript. This work was supported in part by Grants Wa 139/10/A1.5 and Na 135/1-1 from the Deutsche Forschungsgemeinschaft.
References
Baxevanis, C.N., Wernet, D., Nagy, Z.A., Maurer, P.H., and Klein, J.: Genetic control of T-ceH proliferative responses to poly(glu4°ala 60) and poly(glu51Iys34tyr15): subregion-specific inhibition of the responses with monoc1onal Ia antibodies. Immunogenetics 11: 617-628, 1980
Baxevanis, C. N., Nagy, Z. A., and Klein, J.: A novel type ofT-T ceH interaction removes the requirement for I-B region in the H-2 complex. Proc. Natl. Acad. Sei. U.S.A. 78: 3809-3813, 1981
Benacerraf, B. and McDevitt, H. 0.: Histocompatibility-linked immune response genes. Science 175: 273-279, 1972
Corradin, G., Etlinger, H. M., and ChiHer, J. M.: Lymphocyte specificity to protein antigens. 1. Characterization ofthe antigen-induced in vitro T ceH-dependent proliferative response with lymph node ceHs from primed mice. J. Immunol. 119: 1048-1053, 1977
Dubrie1, P. C., CaiHol, D. H., and Lemonier, F. A.: KLH -specific, I -E/C-restricted clones of proliferating T lymphocytes. Immunogenetics 14: 469-479,1981
Hosaka, Y. and Shinizu, Y. K.: Artificial assembly of envelope particles of Sendai virus. 1. Assembly of hemolytic and fusion factors from envelopes solubilized by nonidet P40. Virology 49: 627-639, 1972
Ishii, N., Baxevanis, C. N., Nagy, Z. A., and Klein, J.: Responder T ceHs depleted ofaHoreactive ceHs react to antigen presented on aHogeneic macrophages from nonresponder strains. J. Exp. M ed. 154: 978-982, 1981
Jones, P. P., Murphy, D. B., and McDevitt, H. 0.: Two-gene control of the expression of murine Ia antigen. J. Exp. Med. 148: 925-933, 1978
Koszinowski, u., Getwing, M.-J., and Waterfield, M.: T-ceH cytotoxicity in the absence ofviral protein synthesis in target ceHs. Nature 267: 160-163, 1977
Krco, C. J. and David, C. S.: Genetics ofimmuneresponse: a survey. CRC Crit. Rev. Immunal. 5: 211-257, 1981
Mhc and Ir Genes 483
Laemmli, U. K.: Cleavage of structural proteins during the assembly of the head of bacteriophage T4. Nature 227: 680--685, 1970
Lemke, H., Hämmerling, G.J., and Hämmerling, U.: Fine specificity analysis with monoclonal antibodies of antigens controlled by the major histocompatibility complex and by the Qa/TL region in mice. Immunol. Rev. 47: 175-206, 1979
Lerner, E.A., Matis, 1.A., Janeway, Jr., C.A., lones, P.P., Schwartz, R.H., and Murphy, D.B.: Monoclonal antibody against an Ir gene product? J. Exp. Med. ]52: 1085-1101, 1980
Longo, D. 1. and Schwartz, R. H.: Inhibition of antigen-induced proliferation of T cells from radiationinduced bone marrow chimeras by a monoclonal antibody directed against an Ia determinant on the antigen-presenting Gell. Prac. Natl. Acad. Sei. U.s.A. 78: 514-518, 1981
McDevitt, H. O. and Chinitz, A: Genetic control ofthe antibody response: relationship between immune response and histocompatibility (H-2) type. Science ] 63: 1207-1208, 1968
McDevitt, H. O. and Sela, M.: Genetic control of the antibody response. I. Demonstration of determinant-specific differences in response to synthetic polypeptide antigens in two strains of inbred mice. J. Exp. Med. ]22: 517-531,1965
Nagy, Z.A, Baxevanis, C.N., Ishii, N., and Klein, J.: Ia antigens as restriction molecules in Ir-gene controlled T-cell proliferation. Immunol. Rev. 60: 59-83, 1981
Nepom, J. T., Benacerraf, B., and Germain, R. N.: Analysis of Ir gene function using monoclonal antibodies: independent regulation of GAT and GLPhe T cell response by I-A and I-E subregion products on a single accessory cell population. J. Immunol. 127: 31- 34, 1981
Oi, V. T., Jones, P. P., Goding, J. W., Herzenberg, 1. A., and Herzenberg, 1. A.: Properties of monoclonal antibodies to mouse Ig allotypes, H-2, and Ia antigens. Curr. Top. Microbiol. Immunol. 81: 115-129, 1978
Ozato, K., Mayer, N., and Sachs, D. H.: Hybridoma celllines secreting monoclonal antibodies to mouse H-2 and Ia antigens. J. Immunol. ]24: 533-540,1980
Ryder, 1. P., Andersen, E., and Svejgaard, A.: HLA and Disease Registry. Third Report. Munskgaard, Copenhagen. 1979
Schwartz, R. H. and Paul, W. E.: T-Iymphocyte-enriched murine peritoneal exudate cells. II. Genetic control of antigen-induced T-lymphocyte proliferation. J. Exp. Med. 143: 529-540, 1976
Shevach, E. M., Paul, W. E., and Green, I.: Histocompatibility-linked immune response gene function in guinea pigs. Specific inhibition of antigen-induced proliferation by alloantisera. J. Exp. M ed. 136: 1207-1221, 1972
Shigeta, M. and Fathman, C. G.: I-region genetic restrietions imposed upon the recognition ofKLH by murine T-cell clones. Immunogeneties 14: 415-422,1981
Sprent, J., Lerner, E. A, Bruce, J., and Symington, F. W.: Inhibition of T cell activation in vivo with mixtures of monoclonal antibodies specific for I-A and I-AlE molecules. 1. Exp. M ed. 154: 188-192, 1981
Zinkernagel, R. M. and Doherty, P. c.: Restriction of an in vitro T cell mediated cytotoxicity in lymphocytic choriomeningitis within a syngeneic or simiallogeneic system. Nature 248: 701-702, 1974
Reeeived July 27, 1982


![Review Immune mechanisms in the pathogenesis of …...(MHC) class I transgene [3]. These non-immune mechanisms have been addressed in a recent review paper [4]. New data are constantly](https://img.pdfslide.us/doc/110x75/60c104c2a7dafb7bfc6f8fb5/review-immune-mechanisms-in-the-pathogenesis-of-mhc-class-i-transgene-3.jpg)