Embed Size (px)
Citation preview


Invisible 1% 1
RUNNING HEAD: Invisible 1%
The Invisible 1%: Stepping Stones Towards College Among Military Brats
Abstract
This study examined the differences between civilian and military children in their
attainment of milestones towards college during a period of intensive military
deployment (2002 – 2004). In spite of this intensive deployment, the process of
attainment of milestones toward college among military children from grade 10th to grade
12th was remarkably similar to that of civilian children. Reasons for such notable
resilience are examined in light of funds of knowledge framework and self-determination
theory.
Alberto F. Cabrera, Ph.D.*
Alicia M. Peralta
Elizabeth R. Kurban
University of Maryland College Park
Paper under review by Armed Forces & Society June 9, 2016
*Corresponding author contact information:
Alberto F. Cabrera
Professor
3942 Campus Dr.
College Park MD 20742
(301) 405-2875

Invisible 1% 1
Introduction The process military children undergo in their attainment of milestones towards
college is a topic that has not been widely researched. What little we do know suggests
keen differences in the ways in which military children experience K-12 education in
comparison to their civilian counterparts (Bradshaw et al., 2010, Engel, Gallagher &
Lyle, 2010; Huebner & Mancini, 2005; Jeffreys et al., 1997; Lester and Flake, 2013;
Smrekar et al., 2001; Smrekar & Owens, 2003; White et al., 2011; Winerip, 2011). Some
of those differences include exposure to parent deployments and an increased likelihood
of moving (U.S. Department of Defense, N.D). Research on civilian children suggests
that exposure to such radical changes in familial and school habitus increases risks of
dropping out of high school (Berkner et al., 1997), lowers parental involvement in school
activities (Cabrera & LaNasa, 2000; Perna, 2006; Perna & Titus, 2005); and, is less
conducive to attaining critical milestones towards college (Berkner et al., 1997). Already
some studies seem to show a negative association between deployment, grades, and
academic achievement tests among military children (e.g., Huebner & Mancini, 2005;
Engel, Gallagher & Lyle, 2010).
Using data from the Educational Longitudinal Study of 2002 (ELS:02), this study
seeks to provide insight into similarities and differences in the attainment of milestones
towards college between military and civilian children. Two reasons led us to select
ELS:02 over the High School Longitudinal Study of 2009 (HSLS:09). Data collection
for ELS:02 took place in a period of time especially relevant to our study; military
deployment skyrocketed from approximately 4,000 troops in January of 2002 to over
120,000 in January of 2004 (McLean & Tse, June 22, 2011). The second reason is that
ELS:02, unlike HSLS:09, has verifiable college transcript measures on taking college
admission tests by 12th grade, ameliorating biases associated with self-reported data.
In order to examine the experiences of military children in the aftermath of 9/11,
this study focuses on addressing the following research questions:
1. To what extent the measurement component of the milestones towards college is
invariant across civilian and military children?
2. To what extent the process underscoring the attainment of milestones towards
college holds among military children?
3. Do military children exhibit similar levels of parental encouragement and support
towards college as well as attainment of milestones towards college compared to
their civilian counterparts?
Literature Review Several factors have been linked to the likelihood of preparation for and
enrollment in college among civilian children, including academic ability (Cabrera &
LaNasa, 2000, 2001; Bell, Rowan-Kenyon, Perna, 2009; Hossler et al., 2003; Perna,
2005; Roderick, Coca, & Nagaoka, 2011), parental encouragement (Cabrera & LaNasa,
2000; Arnold, Lu, & Armstrong, 2012; Green et al., 2007; Bryan, Griffin, & Henry,
2013; George-Mwangi, 2015), and socioeconomic status (Gibbons & Borders, 2010;
Grodsky & Riegle-Crumb, 2010; Engberg & Wolniak, 2010; Perry & McConney, 2010;
Wells & Lynch, 2012). Additional research on civilian children also suggests risk factors
that influence the success of students in being prepared for college and successfully
completing high school (Beckner et al., 1997).
Educational Risk Factors

Invisible 1% 2
Changes in familial home environments can have a profound influence on student
development in high school (Berker et al., 1997; Jeynes, 2008, 2012). In particular,
research on civilian children suggests that frequent exposure to moving and absence of a
parent can impact a student’s success in high school. The work of Wu, Schimmele, and
Hou (2015), in particular, emphasizes the impact of parent-level factors on academic
socialization and educational outcomes, highlighting a link between diverse family
structures and lower educational attainment. Additional research supports similar
findings: students in households with more than one parent present are more likely to
complete high school and are less likely to drop out of school (Astone & McLanahan,
1991; Ensminger & Slusarcick, 1992; McLanahan & Sandefur, 1994).
Military Children and Educational Risk Factors In the years following September 11, 2001, many military families found
themselves without their active duty service member parent for an extended period of
time, which renewed researchers’ interest in how military children were coping with
deployments socially, emotionally, psychologically, and academically. Since parental
absences coupled with high mobility are risk factors for civilian families (Berker et al.,
1997; Jeynes, 2002; Jeynes, 2008; Jeynes, 2012), this raises questions about the impact of
such conditions on military families.
There are a number of studies that show military children have somewhat a
different experience in their K-12 education. Some studies point to high parental
involvement in military families despite frequent moves. A 1997 study by the Military
Family Institute at Marywood University indicates that a large number of military
adolescents reported parental involvement in schoolwork (Shaler, Levine & Giacocfi,
1997). Results of this study were corroborated with Smerker’s et al (2001) report to
congress which theorized that military children excelled academically because the
uniformed parent would be given time to attend school related events.
Academic achievement during times of deployment has been given more attention
since 2001. Huebner and Mancini (2005) found that military adolescents reported their
grades suffered during times of deployment. However, Ender (2007) noted that
adolescents tended to show resilience during deployments, often taking on certain
responsibilities of the absent parent. Lyle, Gallagher, and Engle (2010) observed that
parental deployment had a small but deleterious effect on academic achievement tests
administered by the DoDEA schools, which seemed to correlate with the length of the
deployment. A 2011 literature review of 9 studies on the impact of deployment on
military children showed mixed results at best (White et al, 2011). Length of deployment
correlated with a decrease in academic achievement was further confirmed by Lester and
Flake’s (2013) assessment of the literature.
Military children “move six to nine times during a school career…an average of
three times more frequently than nonmilitary families” (U.S. Department of Defense,
N.D.). With such frequent moves, military adolescents report stress in school transition
and self-consciousness about gaps in their education from such transitions (Bradshaw et.
al, 2010). Bradshaw and associates (2010) observed that military adolescents had
developed coping strategies, displaying a high resilience.
It is evident that the literature on military families reveals ambiguity and
inconsistency in the understanding of the relationship between risk factors and outcomes
for students. However, given what is known about the attainment of milestones for

Invisible 1% 3
civilian families, military children exposure to changing environments, through a high
frequency in moving, coupled with experiencing a high likelihood of parental absence,
suggests that children of military families may be at risk in successfully navigating the
postsecondary education pipeline.
Conceptual Framework Building upon the literature (e.g., Cabrera & LaNasa, 2000; Flint, 1992; Hossler,
et al., 1991; Perna & Titus, 2005; Rowan, et al., 2008; Swell & Shah, 1968), the
Milestones Towards College Model (see Figure 1) posits that parental encouragement
and involvement helps pave the way for a child’s journey to postsecondary education
(Cabrera & LaNasa, 2001; Rowan, et al., 2008). In addition to providing emotional
support and encouragement (Sewell, 1968; Steinberg, et al., 1992; Tierney & Auerbach,
2005), parents’ involvement in their students’ experience in school has significant
implications for academic development and academic preparation for college (Fan &
Williams, 2010; Perna, 2005). Research also suggests that students with parents who are
involved in their education develop greater educational aspirations and plans for college
(Adelman, 1999; Stage & Hossler, 1989) and have a greater likelihood of applying for
and enrolling in college (Cabrera & LaNasa, 2000; Perna & Titus, 2005). Research
consistently emphasizes the strong relationship that exists between academic preparation
and enrollment in college (Cabrera & LaNasa, 2001; Hossler et al., 1999, 2003; Perna,
2005; Rowan et al., 2008).
[Insert Figure 1 here]
Methodology
Data Source This study relies on data from the Education Longitudinal Study of 2002
(ELS:02) to examine the process leading to the attainment of milestones towards college
among military children as they transitioned from grade 10 in 2002 to grade 12 in 2004.
Our sample is comprised of approximately of 230 and 15,0001 unweighted individuals,
which represent about 46,000 and 3.2 million children of military and civilian families,
respectively who were 10th graders in 2002. In examining the base-year and follow-up
questionnaires from 2002 and 2004, this current study focuses on the key period of
military deployment, in which significant increases in deployment occurred in our nation.
The sample of military children represents 1% of the total population of 10th
graders in 2002. Almost 60% of military children were raised in families whose median
family income fell in the $35,000 - $75,000 range and among parents with some college
education (64%). The population of military children is evenly split in terms of gender.
White middle school students make up the majority of the cohort (59%), followed by
African Americans (23%), Hispanics (4.5%) and Asian Americans (2.2%). The ethnic
diversity noted among military children is consistent with that reported by Segal and
Segal (2004).
Accounting for sampling design effects
ELS:02 follows a complex design, stratified multistage sampling strategy with
unequal probability of sample selection, to approach the population of 10th graders in
1 All unweighted sample sizes reported in this paper are rounded up or down to comply with
NCES’ data security analysis.

Invisible 1% 4
2002 (Ingels et al., 2014). We selected the panel weight F1PNLWT. This weight allowed
us to include only those 10th graders who participated in the base year (2002) and in the
follow-up (2004) when the subjects were 12th graders.
As noted by Stapleton (2013), structural modeling is prone to produce biased
point estimates and large sampling variances when using complex sample designs as
those incorporated in ELS:02. The former leads to incorrect parameter estimates, while
the latter increases the likelihood of making type 1 error (Thomas & Heck, 2001). To
address ELS:02’s complex design effect, we relied on Mplus’ pseudomaximun likelihood
estimation method (Asparouhov, 2005). Accordingly, stratification (strat_id), clustering
(psu) and the weight variable (F1PNLWT) were incorporated in all our models using the
complex design option and the variance adjusted weighted least squares estimator
(WLSMV) in Mplus 7.31 (Muthén & Muthén, 1988-2015).
Model testing In answering our three research questions, we adopted a three-step strategy as
recommended in the structural equation modeling (SEM) literature (Brown, 2015; Wang
& Wang, 2012). In the first step, we examined the extent to which the measurement
model underscoring the Milestones Toward College model held for civilian and military
children individually. Next we performed two types of invariance testing: measurement
and structural model invariance. We relied on measurement invariance tests to ascertain
whether the form or configuration of the measurement model, the loadings of each
construct, the marker indicators for each latent factor and the indicator intercepts apply to
both civilian and military children. Then, we conducted a series of invariance tests
seeking to determine whether the latent factor variances and covariances apply to the two
groups. The SEM literature deems invariance modeling as a key condition before
conducting structural equation modeling. Without it, one cannot ascertain that the
“…factors measure the same constructs in the same fashion in each group” (Brown, 2015
p. 262).
Having ascertained the extent which the measures reliably appraised the
constructs in the Milestones Towards Model for both civilian and military children, we
proceeded to answer our second research question by testing our model in both military
and civilian groups via SEM. We also estimated indirect and indirect effects in each
group. In answering our third research question, we relied on Latent Means Modeling
(LMM) to test for differences between civilian and military children on their levels of
parental encouragement and attainment of milestones. Similar to ANCOVA, the LMM
approach controls for relevant independent variables when drawing comparisons across
groups in a simultaneous manner. However, LMM has the added advantage of
incorporating measurement errors for both the independent and dependent variable
(Thompson & Green, 2006)
Considering the lack of multivariate normality in our data (see Mardia tests in
tables 1 and 2) and the presence of categorical and continuous variables, we relied on the
WLSMV estimator. WLSMV generates standard errors that are robust to non-normality
while taking into account the mixed measurement properties of the variables under
consideration (Finney & DiStefano, 2013). In judging alternative measurement and
structural invariance models, we relied on Mplus’ DIFFTEST option for testing chi-
square differences. Muthén and Muthén (1988-2015) note that the chi-square value for

Invisible 1% 5
WLSMV cannot be trusted when comparing two nested models. The chi-square
difference resulting from WLSMV does not follow a chi-square distribution.
Goodness of fit indices We relied on several robust measures of fit in judging the different CFA and SEM
models we tested. Those indices included: the Comparative Fit Index (CFI), the Tucker
Lewis index (TLI), and the Root Mean Square Error of Approximation (RMSEA). We
also report chi-square test while noting that this test is highly sensitive to sampling sizes.
In general, large sample sizes tend to be associated with significant chi-squares while the
opposite is true for small sample sizes (Brown, 2015). Both the CFI and the TLI have a
range of possible values between 0 and 1, with values closer to one signifying good fit. In
terms of RMSEA, we considered values ranging from 0 to .05 to signify good fit, while
values ranging from .08 to .10 were deemed to be a poor or mediocre fit (Byrne 2012).
We estimated 90% confidence intervals, hereby referred as CI90%, to check that RMSEA
values did not fall beyond the cut off value of .10, signifying the rejection of the model
(Brown, 2015; Byrne 2012; Wang & Wang, 2012).
Handling of missing cases We relied on Full Information Maximum Likelihood methods (FIML) to handle
missing cases. FIML is considered as a state of art technique in SEM (Brown, 2015; Cox
et al., 2014; Enders, 2013; Heck & Thomas, 2015).
Measures The measures we selected reflect predictors of milestones taking place at the 10th
grade and then the outcome measures for attainment of milestones at the 12th grade.
Milestones Toward College measures. In appraising whether the subject had
taken college admission tests by the 12th grade, we relied on an item labeled P2PSEEXM
reporting type of college admission test taken based on records provided by the College
Board and ACT. For our measure of high school grade point average for all academic
courses, we relied on a high school transcript-based indicator labeled F1RAGP. Only one
of our three indicators of attainment of milestones by 12th grade measure is self-reported:
having applied or planning to apply to a four-year institution (F1S49).
Parent Involvement measures. Cabrera and LaNasa (2000) suggest that parental
encouragement includes both motivational and behavioral dimensions. While the
motivational component of parental encouragement contributes to managing and
maintaining educational expectations, the behavioral component is more proactive and
has been found to be associated with high school students’ academic achievement
(Stewart, 2008) as well as with actual college enrollment (Perna & Titus, 2005). Our
examination of ELS:02 revealed 6 indicators of proactive elements of parental
involvement, collected when the subjects were at the 10th grade. Those include having
discussed with parents school courses (BYS86A), school activities (BYS86B), topics
studied in class (BYS86C), grades (BYS86D), preparation for ACT/SAT (BYS86F), and
going to college (BYS86G). Each of these items was measured in a Likert scale ranging
from to 1 to 3 (Never, Sometimes, Often).
Socioeconomic Status measures. Consistent with the literature (Jaeger, 2011;
White, 1982), this study accounts for socioeconomic status through the measures of
parental education and family income. The data for these variables were all collected
during the base year of collection of the longitudinal study in 2002 when students were in
10th grade.

Invisible 1% 6
Academic Ability measure. Academic ability was measured in 2002, when the
students were in 10th grade, using a composite standardized test score (BYTXCST) from
the ELS reading and mathematics cognitive tests.
Descriptive statistics, percent of missing values and Mardia tests of multivariate
analyses are reported for both military children and civilian children in tables 1 and 2.
The proportion of missing cases for military children range from 0 to 28 and the
proportions for civilian children range from 0 to 21. We handled missing cases using
Mplus’FIML.
[Insert Table 1 here]
[Insert Table 2 here]
Results Results are organized in three parts corresponding to our research questions. In
part one, we examine the extent to which the measurement of the attainment of
milestones model is invariant across military and civilian children. In part two, we report
the extent to which the process underscoring the attainment of milestones holds for
civilian and military families. In part three, we answer the question pertaining differences
in the attainment of milestones towards college between military and civilian children.
Part 1: Measurement invariance
We followed a stepwise procedure to examine the extent to which the
measurement model underscoring the milestone model applies equally to both military
and civilian populations. Accordingly, we started with testing the CFA model for each
group. Next, we conducted two sets of invariance tests. The first test examined the
invariance of the measurement component of the CFA model (e.g., loadings), while the
second test examined the invariance of the component of the CFA model (e.g., factor
variances and covariances). Within each domain, we proceeded with least restrictive
solutions to increasing restrictive solutions. At each step, the increasingly restrictive
model was evaluated using nested χ2 tests.
Table 3 reports the results of testing eight models seeking to answer research
question one. Panel 1 reports the single CFA solutions for both civilian and military
children. Panel 2 reports the results of testing 4 invariance measurement models ranging
from configural (also known as equal form) to strong measurement invariance. Panel 3
reports the tests of structural invariance ranging from latent factor invariance to both
latent factor and covariance invariance.
[Insert Table 3 here]
CFA Results. As shown in Panel 1 of Table 3, our CFA results show that our
measures are robust indicators of the three constructs underscoring the Milestones
Towards College Model for both civilian and military children. All goodness of fit
indicator values fell within acceptable ranges for civilian children (χ2 =640.6 p < 0.000;
*RMSEA = 0.028, * CI90% = [0.026, 0.030]; *CFI = 0.969, *TLI = 0.960) and military
children (*χ2 =50.0 p = 0.512; *RMSEA = 0.000, * CI90% = [0.000, 0.041]; *CFI =
1.000, *TLI = 1.004). Moreover, the pattern of factor loadings within the model across
both groups also supported its strength. In the case of civilian children, the loadings
ranged from 0.583 for family income, an indicator of SES, to 0.932 for having planned or
taken college admission tests, an indicator of Milestones. Among military children, the
range of loadings was of 0.586 for BYS86C, an indicator of parental involvement, to
0.974 for having planned or taken college admission tests, an indicator of Milestones.

Invisible 1% 7
Measurement invariance results. The configural form model served as the
baseline against which a series of hierarchal invariance models were tested. Those tests
ranged from invariance of marker item factor loadings model, weak measurement
invariance model to strong measurement invariance model. The configural model fits
data well (χ2 =545.8 p < 0.000; *RMSEA = 0.024, *CI90% = [0.022, 0.026]; *CFI =
0.997 *TLI =0.971) suggesting that the pattern of factor loadings and covariance holds
for both civilian and military children populations. The likelihood ratio test based on the
model χ2 difference between the configural model and the marker item factor loadings
model (Δχ2 = 1.4, Δ df = 3) is not statistical significant (p = 0.551) implying that father’s
education (FAED), discussing with parents school activities (BYS86B) and having
planned or taken college admission tests (TESTED) are invariant indicators of SES,
Parental Involvement and Milestones across both populations. Moreover, the invariance
of marker item factor loadings displays excellent indicators of fit (*RMSEA = 0.022,
*CI90% = [0.020, 0.024]; *CFI = 0.979 *TLI =0.974). The weak measurement model
posits that both marker and non-marker factor items are invariant across civilian and
military children. Results indicate that there is indeed metric invariance. The difference in
chi-square tests between the configural and the weak measurement model was non-
significant (Δχ2 = 7.2, Δ df = 9, p = 0.619). Moreover the weak measurement model fits
the data well (RMSEA = 0.019, *CI90% = [0.018, 0.021]; *CFI = 0.983 *TLI =0.980).
The strong measurement invariance model tests the null hypothesis that the factor
loadings as well as their intercepts with the latent construct are invariant across groups.
The likelihood ratio test based on the model χ2 difference between the strong
measurement invariance model and the configural one shows a decrease in chi-square
that is not statistically significant (Δχ2 = 18.8, Δ df = 17, p = 0.340). The strong
measurement model displays good fit indices as well (RMSEA = 0.018, *CI90% = [0.016,
0.020]; *CFI = 0.985 *TLI =0.983). Thus, the null hypothesis that factor loadings and
item intercepts are invariant across military and civilian children cannot be rejected.
Structural invariance. The strong measurement model served as the baseline
against which a series of hierarchal invariance tests regarding the structural components
of the CFA model; namely, invariance of latent factors variance, and invariance of latent
covariances and variances. The difference in chi-square tests between the latent factor
variance and the strong measurement model was not significant (Δχ2 = 1.7, Δ df = 3, p =
0.635) suggesting that the latent factors SES, Parental Involvement and Milestones
towards college have the same distribution across military and civilian children while
having invariant loadings and intercepts as well. The model itself has excellent indicators
of fit (RMSEA = 0.015, *CI90% = [0.014, 0.017]; *CFI = 0.988 *TLI =0.988), which
further supports this hypothesis. Subsequent tests reveal that not only the variances of the
latent factors do not vary across the two groups, but neither their covariances (Δχ2 = 3.4,
Δ df = 3 p = 0.635).
Taken altogether our measurement and structural invariance tests indicate that the
relationships among the latent constructs SES, Parental Involvement in School Activities
in 10th grade and Attainment of Milestones by 12th grade measured by the 12 items hold
for both across civilian and military children. Having met this condition, we report the
results of our SEM model testing and differences in latent means in the following
sections.
Part II: SEM Results

Invisible 1% 8
Attainment of milestones among civilian 12th graders. Figure 2 depicts the
structural coefficients associated to the different equations underscoring the milestone
towards college model. Hypothesized effects found significant are represented with a
straight line. Dotted lines depict hypothesized paths found non-significant. Table 4
reports the direct and indirect effects of SES and Academic Ability on attainment of
milestones towards college among civilian children. We report all paths in standardized
units.
[Insert Figure 2 here]
[Insert Table 4 here]
As indicated by CFI and the Tucker-Lewis Fit Index (TLI) values of 0.962 and
0.952, the hypothesized model displays a good fit to the data. This conclusion is further
strengthened by a REMSA of 0.030, which is far below Hu and Bentler’s (1999)
recommended threshold. Moreover, the 90% confidence interval associated to REMSA
falls in a range that Byrne (2012) characterizes as signifying a good fit (*CI90% = [0.028,
0.031]).
Overall, we found support for the hypothesized relationships among the
constructs underscoring the Milestones towards College as it applies to the civilian
population. All hypothesized paths were significant and the size of the structural path
regressions ranged from being small (Ability → Parental Involvement = 0.140) to being
moderately high (Ability → Attainment of Milestones = 0.484). The model accounted for
23.4% of the variance in Academic Ability, explained nearly 10% of the variance in
Parental Involvement in School Activities and elucidated nearly 60% of the variance in
Attainment of Milestones. Parental SES has significant and positive effects on Ability
(0.484), Parental Involvement (0.219) and Attainment of Milestones (0.2858). SES’ also
exerts indirect effects on Milestones. Those three indirect effects are exerted thru: (1)
Ability (0.218), (2) Parental Involvement (0.053*), and (3) via Ability and then thru
Parental Involvement (0.016). The total effect of SES on Attainment of Milestones is
significant and moderately large (0.575). Of the total effect SES has on Milestones half
of it is accounted by indirect effects (0.287). Academic ability exerts a direct, though
small, effect on Parental Involvement (0.140) while exerting a moderate high direct
(0.452) on this latent factor. Ability also positively moderates the effect Parental
Involvement has on attainment of Milestones towards college. However, of the total
effect Ability has on Milestones most of it is accounted by its direct effect (0.452 of
0.485). All in all, our results are quite consistent with the extant literature (Fan & Chen,
2001; Hossler & Stage, 1992; Hossler et al., 1999; Stage & Hossler, 1989; Swell & Shah,
1968).
Attainment of milestones among military 12th graders. Figure 3 reports the
regression coefficients in standardized units, while table 5 reports the direct, indirect and
total effects of the Attainment of Milestones Model among military children.
[Insert Figure 3 here]
[Insert Table 5 here]
Results from the estimation of the model for military children produced goodness
of fit indices signifying excellent fit to the data (*χ2 =62.3, df = 61, p = 0.438; *RMSEA
= 0.009, *CI90% = [0.000, 0.042]; *CFI = 0.997, *TLI = 0.996). The SEM model
accounted for almost 60% of the variance in the attainment of milestones towards
college. It also explained 10 of the observed variance in military parental involvement in

Invisible 1% 9
school activities while accounting for 17% of the variation in military children’s
academic ability.
As in the case of civilian children, military children’s attainment of milestones
towards college is affected by their parent’s socioeconomic status (0.388) and their
parental involvement in school activities (0.388) as well as by their academic ability
(0.339). Strikingly, however, military families’ involvement in their children’s school
activities is neither affected by their socioeconomic background, nor by their offspring's
academic ability (see Figure 3 and Table 5). Unlike the case of the civilian population,
SES was found to exert indirect effects on Milestones via Academic Ability only
(0.141*). SES neither mediates the relation between Ability and Attainment of
Milestones, nor does it mediate joint interaction between Academic Ability and Parental
Involvement on Milestones. Most of the total effect SES exerts on attainment of
milestones among military children is accounted by the direct SES exerts on attainment
of milestones (0.388* of 0.620*). Unlike the case of the civilian population, academic
ability was found to exert no indirect effect on the attainment of milestones among
military children. Nearly 90% of the total effect of Ability on Milestones was due to its
direct path with this outcome (0.339* out of 0.385*).
Part III: Differences in milestones towards college civilian and military families
Latent means differences (LLM). Goodness of fit indices, as a whole, are
supportive of the latent means model as a viable framework to test differences in the
attainment of milestones between civilian and military families (χ2 = 825.7, df = 71, p <
0.000; *RMSEA = 0.026, *CI90% = [0.025, 0.028]; *CFI = 0.966, *TLI = 0.956). The
LLM reveals that military children do not differ in relation to their civilian counterparts
in terms of academic ability (z = -.009, p > .05) and levels of support and encouragement
they receive from their parents (z = 0.018, p > .05). However, military children display
lower levels of attainment of milestones towards college by 12th grade (z = -0.026, p <
.05); yet, this difference in percentile points is small if not trivial. Net of measurement
error and the joint effects of latent factors in the model, a military child test score is, on
average, 1.03 percentage points below that of a civilian child.
Limitations Our study has several limitations. To begin with, the nuances associated with
living in military bases, civilian communities, overseas, or a combination of all those
arrangements is absent in our study. In addition, the diversity of school arrangements
military children experience is not captured by ELS:02. Moreover, the lack of significant
associations between SES and parental encouragement and support among military
children could also be attributed to differences in samples sizes between civilian and
military children.
Because of those reasons our study should be considered an exploratory
examination of the role that SES, family encouragement and support, as well as academic
ability play in the attainment of milestones towards college among military children. In
so doing, however, we relied on a representative national database that follows military
children in their attainment of milestones towards college in one of the most difficult
periods experienced by military families in recent memory. Moreover, our selection of
variables is guided by what the extant literature acknowledges as relevant in appraising
our constructs. Furthermore, we incorporated the transcript data provided within ELS:02,

Invisible 1% 10
giving us objective measures for college admission tests and high school grade point
average in all academic subjects.
Discussion This study examined the differences in attainment of milestones towards college
between the civilian and military children populations during the 2002-04 period of time.
To this end, we first ascertained the extent to which the measurement component of the
milestones toward college was invariant across civilian and military children. Then, we
examined whether the process underscoring the attainment of milestones towards college
held among military children, and whether military children had similar levels of parental
encouragement and support towards college, as well as attainment of milestones towards
college. Drawn from the literature on factors exposing high school students to academic
risk along with the sparse literature on military adolescents, our hypothesis was that
military children would not attain the appropriate milestones toward college upon
reaching the 12th grade in comparison to their civilian peers. Surprisingly, we found that
military children attained milestones toward college at levels comparable to their civilian
peers. However, the model showed non-significant relationships between parental
involvement and ability and parental involvement and socio-economic status for military
children, while these relationships were significant for civilian children. Those
remarkable results indicate a level of resilience in military families as the children face
parental absence due to deployments and frequent relocation during their K-12 years.
These unexpected results led us to a re-examination and revision of the attainment of
milestones framework for children of the military based on the unique military culture, as
well as such perspectives as funds of knowledge and self-determination theory.
Revising the Attainment of Milestones Framework for Military Children Given the robustness of the attainment of milestones model and the unexplained
non-significant relationships between both parental involvement/ability and parental
involvement/SES for military children, we propose revisions to the attainment of
milestones theoretical framework as it applies to children of military families. These
revisions take into account military culture, using self-determination theory (Deci, et al.,
1991) and Funds of Knowledge (González, Moll, & Amanti 2013; Kiyama, 2010). Such
perspectives offer an alternative way of thinking about the results of this study and the
attainment of milestones framework in context of military children and families.
Parental Involvement and the Concept of the “Military Family” Although the data for our study were taken during a time of sharply increased
deployments, parental involvement for children of the military did not seem to wane, as
one would have expected from what we know of the literature on at-risk children. Part of
the explanation for this surprising result could be traced back to the unique culture of the
military community. In the military community, military parents often do not parent
alone: there is a powerful set of networks tying the family to other families in their unit,
as well as with churches, and various military base and non-military affiliated groups.
The extensive services and networks military families rely upon may compensate for the
absence of a parent during deployment: in short those networks constitute unique funds
of knowledge (González et al., 2013; Kiyama, 2010) which influence the ways in which
military children and their parents make decisions about and prepare for postsecondary
educational opportunities. Moreover, those networks and services may in and of
themselves be a unique source of encouragement and support that expand, if not

Invisible 1% 11
complement, the support coming from the immediate family (George Mwangi, 2015). For
the purposes of our revised model, we would include the “Military Family” alongside
Parental Involvement acknowledging that one is, indeed, an extension of the other for
purposes of support for young people.
Student Ability, Parental Involvement, and Self-Determination Theory Our results suggest that military families encourage their children to attain
academic milestones towards college irrespective of their academic ability, a finding that
stands in sharp contrast to the one among civilian families. Self-determination theory
could assist in explaining this lack of connection between a student’s academic ability
and parental encouragement in the military context (Deci et al., 1991). Self-determination
theory posits that motivation is on a continuum, with internal factors as the strongest
source of motivation and external factors as a weaker source of motivation but salient
nonetheless (Deci et al, 1991). The internal factors are the strongest motivators precisely
because they are within an individual’s locus of control, which provides an individual
with a feeling of power to change their circumstances (Deci et al, 1991). The military
family, according to the definition discussed above, may act as a motivator for military
children, providing a sustaining source of support throughout the attainment of
milestones process. This commitment can be traced back to the military culture of
advancing careers of commissioned and noncommissioned officers via education. In the
military context, education is earned rather than bestowed, relocating the locus of control
from external influences to the individual. Operating on the philosophy that the military
is a meritocracy, the perception that hard work trumps ability empowers the military
family and the military child in their attainment of milestones. Consequently, in our
revision of the attainment of milestone framework for military children, we posit that
self-determination is a construct that can be placed side-by-side with ability in affecting
attainment of milestones towards college while having links to socioeconomic status (a
proxy for rank in the military) as well.
Socio-Economic Status, Military Family/Culture, and Self-Determination Theory The finding that military children’s socioeconomic status does not impact parental
involvement goes against what we have learned from almost five decades of research on
civilian families (Fan & Chen, 2001; Hossler & Stage, 1992; Hossler et al., 1999; Stage
& Hossler, 1989; Swell & Shah, 1968). The lack of relationship may be explained in part
by the military’s organizational culture. Military families live in a culture where
education pays in the form of increasing earnings by the attainment of a higher rank.
Educational opportunities provided by the military demystify the path to success and the
value of academics, giving the individual a sense of control over their career path and
monetary rewards. Self-determination theory, again, impacts the military child and their
families because rank is tied to education (Deci et al, 1991). The military child, as a
witness to their uniformed parents’ continuing education and moving through the ranks,
internalizes the power of degrees in relation to socio-economic status. The importance of
a bachelor’s degree in the everyday earnings and well-being of a family is also
internalized by the military parent, incentivizing their investment in their child’s
education and future. A more nuanced understanding as to why families stress education
for their children can be enhanced by the incorporation of rank in a revised framework
for the attainment of milestones for military children. Such a revised model for the
attainment of milestones among military children is depicted in Figure 4.
Invisible 1% 12
[Insert Figure 4 here]
Conclusion Between 2002 and 2004, military families experienced the beginning of a cycle of
deployments that lasted more than a decade (McLean & Tse, 2011). The absence of the
uniformed parent coupled with the increased likelihood of changing schools may suggest
military children were at high risk in their attainment of milestones towards college
during the 2002-04 period of time. Save for the lack of an effect of SES and academic
ability on parental involvement, this study reveals that the process of attainment of
milestones toward college among military children is remarkably similar to that of
civilian children. Moreover, there were no differences in academic readiness, parental
encouragement and support, nor differences in the attainment of milestones toward
college between civilian and military children.
The lack of an impact of SES along with the remarkable level of resilience
displayed by military children calls into question what we know about the applicability of
the role of SES and at risk factors from the civilian population to the military population.
Our results seem to confirm Bradshaw and associates’ (2010) findings about the
resiliency of military children by noting how military adolescents had developed coping
strategies for addressing deployment of parents and change of schools. Reasons for such
remarkable endurance among military children call for a re-examination of the attainment
of milestones towards college for this unique student population.
Invisible 1% 13
Tables
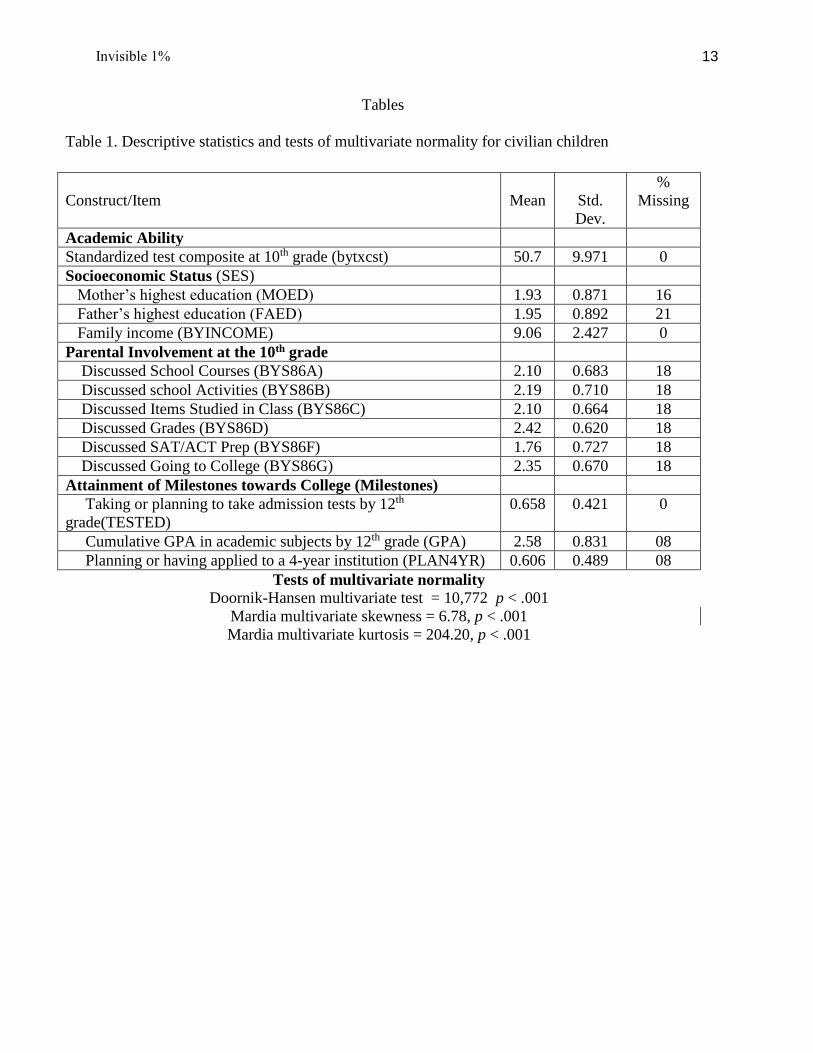
Table 1. Descriptive statistics and tests of multivariate normality for civilian children
Construct/Item
Mean
Std.
Dev.
%
Missing
Academic Ability
Standardized test composite at 10th grade (bytxcst) 50.7 9.971 0
Socioeconomic Status (SES)
Mother’s highest education (MOED) 1.93 0.871 16
Father’s highest education (FAED) 1.95 0.892 21
Family income (BYINCOME) 9.06 2.427 0
Parental Involvement at the 10th grade
Discussed School Courses (BYS86A) 2.10 0.683 18
Discussed school Activities (BYS86B) 2.19 0.710 18
Discussed Items Studied in Class (BYS86C) 2.10 0.664 18
Discussed Grades (BYS86D) 2.42 0.620 18
Discussed SAT/ACT Prep (BYS86F) 1.76 0.727 18
Discussed Going to College (BYS86G) 2.35 0.670 18
Attainment of Milestones towards College (Milestones)
Taking or planning to take admission tests by 12th
grade(TESTED)
0.658 0.421 0
Cumulative GPA in academic subjects by 12th grade (GPA) 2.58 0.831 08
Planning or having applied to a 4-year institution (PLAN4YR) 0.606 0.489 08
Tests of multivariate normality Doornik-Hansen multivariate test = 10,772 p < .001
Mardia multivariate skewness = 6.78, p < .001
Mardia multivariate kurtosis = 204.20, p < .001

Invisible 1% 14
Table 2. Descriptive statistics and tests of multivariate normality for military children
Construct/Item
Mean
Std.
Dev.
%
Missing
Academic Ability
Standardized test composite at 10th grade (bytxcst) 50.0 9.307 0
Socioeconomic Status (SES)
Mother’s highest education (MOED) 1.87 0.824 19
Father’s highest education (FAED) 2.03 0.859 28
Family income (BYINCOME) 9.11 2.114 0
Parental Involvement at the 10th grade
Discussed School Courses (BYS86A) 2.20 0.725 22
Discussed school Activities (BYS86B) 2.23 0.759 22
Discussed Items Studied in Class (BYS86C) 2.18 0.674 22
Discussed Grades (BYS86D) 2.48 0.659 22
Discussed SAT/ACT Prep (BYS86F) 1.83 0.761 23
Discussed Going to College (BYS86G) 2.42 0.638 23
Attainment of Milestones towards College (Milestones)
Taking or planning to take admission tests by 12th grade
(TESTED)
0.650 0.478 0
Cumulative GPA in academic subjects by 12th grade (GPA) 2.40 0.829 08
Planning or having applied to a 4-year institution (PLAN4YR) 0.545 0.499 11
Tests of multivariate normality Doornik-Hansen multivariate test = 181.96, p < .001
Mardia multivariate skewness = 35.66, p < .001
Mardia multivariate kurtosis = 207.19, p < .001

Invisible 1% 15
Table 3. Tests of invariance for the Milestones towards College Model
χ2 df Δχ2 Δdf p-
value
RMSEA (CI90%) CFI TLI
Single group solutions
1. Civilian 640.56 51 - - 0.000 0.028 (0.026,0.030) 0.969 0.960
2. Military 50.03 51 - - 0.512 0.000 (0.000,0.041) 1.000 1.004
Measurement invariance
3. Configural 545.84 104 - - 0.000 0.024 (0.022,0.026) 0.977 0.971
4. Invariance of marker
item factor loadings
513.68 107 2.1 3 0.551 0.022 (0.020,0.024) 0.979 0.974
5. Weak measurement
invariance
440.07 113 7.2 9 0.619 0.019 (0.018,0.021) 0.983 0.980
6. Strong measurement
invariance
418.49 121 18.8 17 0.340 0.018 (0.016,0.020) 0.985 0.983
Structural invariance
Latent factor invariance 349.63 124 1.7 3 0.635 0.015 (0.014,0.017) 0.988 0.988
Latent covariances &
variances invariance
314.68 127 3.4 6 0.755 0.014 (0.012,0.016) 0.990 0.990

Invisible 1% 16
Table 4. Direct, indirect and total effects on milestones towards college among
civilian children
From SES to Milestones
Direct
Indirect
Total
Indirect
Total SES →
Ability
SES →
Parental
Involvemen
t
SES →
Ability →
Parental
Involvement
0.285*
0.218*
0.053*
0.016*
0.287*
0.572*
From Academic Ability to Milestones
Direct
Indirect
Total
Indirect
Total Ability → Parental Involvement
0.452*
0.034*
0.034*
0.485*
Table 5. Direct, indirect and total effect on milestones towards college among
military children
From SES to Milestones
Direct
Indirect
Total
Indirect
Total SES →
Ability
SES →
Parental
Involvemen
t
SES →
Ability →
Parental
Involvement
0.388*
0.141*
0.072
0.019
0.232*
0.620*
From Academic Ability to Milestones
Direct
Indirect
Total
Indirect
Total Ability → Parental Involvement
0.339*
0.047
0.047
0.385*

Invisible 1% 17
Figures
Figure1.A ainmentofMilestonesModel
SES
Ability
Parentalinvolvementinschoolac vi es
10thgrade
A ainmentofMilestonesby
12grade

Invisible 1% 18
Figure2.A ainmentofMilestonesforCivilianChildren(standardizedresults)
SES
Ability
Parentalinvolvementinschoolac vi es
10thgrade
Children’sA ainmentofMilestonesby
12grade
R2=0.09
7
R2=
0.560
χ2(61)=862.7p<0.001RMESA=0.030;CI90%=[0.028,0.031]
CFI=0.962;TLI=0.952
0.484
0.140
0.219
0.452
0.241
R2 =0.234
0.285

Invisible 1% 19
Figure3.A ainmentofMilestonesamongChildrenoftheMilitary(standardizedresults)
SES
Ability
Parentalinvolvementinschoolac vi es
10thgrade
Children’sA ainmentofMilestonesby
12grade
R2=0.10
3
R2=
0.596
χ2(61)=62.3;p=0.438RMESA=0.009CI90%=[0.000,0.042]
CFI=0.997;MeanTLI=0.996
0.2290.415
0.149
0.339
R2 =0.172
0.3150.388
Nonsignificantpath

Invisible 1% 20
Figure4.A ainmentofMilestonesamongChildrenoftheMilitary
SES
Ability
Parentalinvolvementinschoolac vi es10thgrade
A ainmentof
Milestonesby12grade
Hypothesizedpaths
Unit&Military
CommunityInvolvement
Rank
Self-Determina on

Invisible 1% 21
References
Asparouhov, T. (2005). Sampling weights in latent variable modeling. Structural Equation Modeling, 12(3),
411-434.http://www.statmodel.com/discussion/messages/22/8170.html?1390414427
Astone, N. M., & McLanahan, S. S. (1991). Family structure, parental practices and high school completion.
American Sociological Review, 309-320.
Berkner, L., Chavez, L., & Carroll, C.D. (1997). Access to Postsecondary Education for the 1992 High
School Graduates. Washington, DC: National Center for Education Statistics.
Bradshaw, C.P., Sudhinaraset, M, Mmari, K, and Blum, R.N. (2010). School transitions among military
adolescent: A qualitative study of stressed coping. School Psychology Review, 39(1), 84-105.
Brown, A. T. (2015). Confirmatory factor analysis for applied research (2nd edition). New York: The
Guilford Press.
Byrne, B. M. (2012). Structural equation modeling with Mplus: Basic concepts, applications, and
programming. New York, NY: Routledge.
Cabrera, A. F., & La Nasa, S. M. (2001). On the path to college: Three critical tasks facing America's disadvantaged.
Research in Higher Education, 42(2), 119-149.
Cabrera, A. F. & LaNasa, S. M. (2000). Understanding the college choice of disadvantaged students. New Directions
for Institutional Research. San Francisco: Jossey-Bass.
Coleman, J. S. (1988). Social capital in the creation of human capital. American Journal of Sociology, S95-
S120.
Cox, B. E., McIntosh, K., Reason, R. D. & Terenzini, P. T. (2014). Working with missing data in higher
education research: A premier and real world example. The Review of Higher Education, 37(3), pp.
377-402.
Deci, E. L., Vallerand, R. J. , Pelletier, L. G. & Ryan, R. M. (1991). Motivation and education: The self-
determination perspective. Educational Psychologist, 26(3&4), 325-346.
Enders, C. K. (2013). Analyzing structural equation models with missing data. In G. R. Hanckock & R. O.
Muller (Eds.). Structural equation modeling: Second course (2nd edition) (pp. 493-521).
Connecticut, Greenwich: Information age publishing.
Engel, R.C., Gallagher, L.B., Lyle, D.S., (2010). Military deployments and children’s academic achievement:
Evidence for Department of Defense Education Activity Schools. Economics of Education Review,
29, 73–82
Ensminger, M. E., & Slusarcick, A. L. (1992). Paths to high school graduation or dropout: A longitudinal
study of a first-grade cohort. Sociology of Education, 95-113.

Invisible 1% 22
Fan, W., & Williams, C. M. (2010). The effects of parental involvement on students’
academic self-efficacy, engagement and intrinsic motivation. Educational Psychology, 30(1), 53-74.
Fan, X., & Chen, M. (2001). Parental involvement and students' academic achievement: A meta-analysis.
Educational Psychology Review, 13(1), 1-22.
Finney, S. J. & DiStefano, Ch. (2013). Nonnormal and categorical data in structural equation modeling. In G.
R. Hanckock & R. O. Muller (Eds.). Structural equation modeling: Second course (2nd edition) (pp.
439-493). Connecticut, Greenwich: Information age publishing.
Flint, T. A. (1992). Parental and Planning Influences on the Formation of Student College Choice Sets.
Research in Higher Education, 33(6), 689–708.
George Mwangi, Ch. A. (2015). (Re) Examining the role of family and community in college access and
choice: A metasynthesis. Review of Higher Education, 39(1), 123-15.
González, N., Moll, L. C., & Amanti, C. (Eds.). (2013). Funds of knowledge: Theorizing practices in
households, communities, and classrooms. Routledge.
Green, C. L., Walker, J. M., Hoover-Dempsey, K. V., & Sandler, H. M. (2007). Parents' motivations for
involvement in children's education: An empirical test of a theoretical model of parental involvement.
Journal of Educational Psychology, 99(3), 532.
Heck, R. H. & Thomas, S. L. (2015). An introduction to multilevel modeling techniques: MLM and SEM
approaches using Mplus (3th edition). New York, NY.: Routledge.
Hossler, D., & Stage, F. K. (1992). Family and high school experience influences on the postsecondary
educational plans of ninth-grade students. American Educational Research Journal, 29(2), 425-451.
Hossler, D., Schmit, J., & Vesper, N. (1999). Going to college: How social, economic, and educational
factors influence the decisions students make. JHU Press.
Huebner, A. J., & Mancini, J. A. (June, 2005). Adjustment among adolescents in military families when a
parent is deployed: A final report submitted to the Military Family Research Institute and the
Department of Defense Quality of Life Office. Falls Church, Virginia: Virginia Tech, Department of
Human Development.
Ingels, S.J., Pratt, D.J, Alexander, C.P., Jewell, D.M., Lauff, E. Mattox, T.L., and Wilson, D. (2014).
Education Longitudinal Study of 2002 Third Follow-up Data File Documentation (NCES 2014-364).
National Center for Education Statistics, Institute of Education Sciences, U.S. Department of
Education. Washington, DC. Retrieved September 8, 2015 from
http://nces.ed.gov/pubsearchhttp://nces.ed.gov/pubsearch

Invisible 1% 23
Jeffreys, D. J., Leitzel, J. D., Cabral, G., Gumpert, J., & Hartley, E. (1997). Military
Adolescents: Their Strengths and Vulnerabilities (No. MFI-TR-97-4). Marywood College, Scranton,
PA. Military Family Institute.
Jeynes, W. (2012). Divorce, family structure, and the academic success of children. Routledge.
Jeynes, W. H. (2008). The effects of several of the most common family structures on the academic
achievement of eighth graders. Marriage & Family Review, 30(1-2), 73-97.
Kiyama, J. M. (2010). College Aspirations and Limitations The Role of Educational Ideologies and Funds of
Knowledge in Mexican American Families. American Educational Research Journal, 47(2), 330-
356.
Lester, P., & Flake, E. (2013). How wartime military service affects children and families. The Future of
Children, 121-141.
McLean, A. & Tse, A. (June 22, 2011). American forces in Afghanistan and Iraq.
McHugh, J.M. (August 13, 2015). SUBJECT: Army Directive 2015-31 (Requirements for Noncommissioned
Officer Promotions). Retrieved March 26, 2015 from
http://www.apd.army.mil/pdffiles/ad2015_31.pdf
Muthén, L. K. & Muthén, B. O. (1988- 2015). Mplus 7.31. Los Angeles, CA: Muthén & Muthén.
New York Times (June 22, 2011). American forces in Afghanistan and Iraq. Retrieved April 24, 2015 from
http://www.nytimes.com/interactive/2011/06/22/world/asia/american-forces-in-afghanistan-and-
iraq.html?_r=0http://www.nytimes.com/interactive/2011/06/22/world/asia/american-forces-in-
afghanistan-and-iraq.html?_r=0
Perna, L. W. (2005). The key to college access: Rigorous academic preparation (pp. 113-134). In W. G.
Tierney, Z. B. Corwin & J. E. Colyar (Editors). Preparing for college: Nine elements of effective
outreach (. New York, NY.: State University of New York Press.
Perna, L. W. (2006). Studying college choice: A proposed conceptual model. In J. C. Smart (Ed.), Higher
Education: Handbook of theory and research, Vol. XXI (pp. 99-157).
Perna, L. W., & Titus, M. A. (2005). The relationship between parental involvement as social capital and
college enrollment: An examination of racial/ethnic group differences. Journal of Higher Education,
485-518.

Invisible 1% 24
Roderick, M., Coca, V., & Nagaoka, J. (2011). Potholes on the road to college high school
effects in shaping urban students’ participation in college application, four-year college enrollment,
and college match. Sociology of Education, 84(3), 178-211.
Rowan-Kenyon, H. T., Bell, A. D., & Perna, L. W. (2008). Contextual influences on parental involvement in
college going: Variations by socioeconomic class. The Journal of Higher Education, 79(5), 564-586.
Segal, D. R., & Segal, M. W. (2004). America's military population (Vol. 59, No. 4). Washington, DC:
Population Reference Bureau.
Sewell, W. H., & Shah, V. P. (1968). Social class, parental encouragement, and educational aspirations.
American Journal of Sociology, 559-572.
Smrekar, C., Gutherie, J. W., Owens, D. E., & Sims, P. G. (2001). March toward excellence: School success
and minority student achievement in Department of Defense Schools. A Report to the National
Education Goals Panel. Washington, DC: National Education Goals Panel. (ED 459 218)
Smrekar, C.E., & Owens, D.E. (2003). 'It's a way of life for us': High mobility and high achievement in
Department of Defense schools. Journal of Negro Education. 72(1), 165-177.
Stapleton, L. M. (2013). Incorporating sampling weights into single-and multilevel analyses (pp. 363-387).
In L. Rutowski, M. von Davier, & D. Rutowski (Eds.). A handbook of international large-scale
assessment. London: Chapman Hill/CRC Press
Stage, F. K., and Hossler, D. (1989). Differences in Family Influences on College Attendance Plans for Male
and Female Ninth Graders. Research in Higher Education, 1989, 30(3), 301–315.
Steinberg, L., Lamborn, S. D., Dornbusch, S. M., & Darling, N. (1992). Impact of parenting practices on
adolescent achievement: Authoritative parenting, school involvement, and encouragement to succeed.
Child Development, 63(5), 1266- 1281.
Thompson, M. S. & Green, S. B. (2006). Evaluating between-group differences in latent variable means (pp.
119-170). In G. R. Hancock and R. O. Muller (Editors). Structural Equation Modeling: A second
course. IAP-Information Age Publishing, Inc.
Tierney, W. G., & Auerbach, S. (2005). Toward developing an untapped resource: The role of families in
college preparation (pp. 29-48). In W. G. Tierney, Z. B. Corwin & J. L Colyar (Editors). Preparing
for college: Nine elements of effective outreach. New York, Albany: Suny University of New York
Press.

Invisible 1% 25
U.S. Department of Defense (N.D.). Retrieved April 16, 2015 from
http://www.defense.gov/home/features/2015/0415_militarychild/http://www.defense.gov/home/fe
atures/2015/0415_militarychild/
White, C. J., De Burgh, H. T., Fear, N. T., & Iverson, A. C. (2011). The impact of deployment to Iraq or
Afghanistan on military children: A review of the literature. International Review of Psychiatry, 23,
210–217
White, K. R. (1982). The relation between socioeconomic status and academic achievement. Psychological
Bulletin, 91(3), 461.
Winerip, M. (December 11, 2011). Military children stay a step ahead of public school students. The New
York Times. Retrieved February 5, 2012 from www.nytimes.com/2011/12/12/education/military-
children-outdo-public-school- students-on-naep-tests.html?_r=1
Wu, Z., Schimmele, C. M., & Hou, F. (2015). Family Structure, Academic Characteristics, and
Postsecondary Education. Family Relations, 64(2), 205-220.