Embed Size (px)
Citation preview

Investors’ Attention to Corporate Governance
Peter Iliev Penn State University
Jonathan Kalodimos
Oregon State University
Michelle Lowry Drexel University
November 12, 2018
Abstract: The efficacy of shareholder voting and shareholder engagement requires that shareholders devote resources toward becoming informed. We use unique data to assess the extent of governance-related research on EDGAR conducted by 89 mutual fund families and by ISS in 3,700 companies. Investors conduct substantial governance-related research, with the top 5 mutual fund families accessing proxy statements of 24% of their portfolio firms. Investors concentrate their attention on firms and shareholder meetings where the expected effects on portfolio value are greatest. For example, they devote less attention to firms with lower quality governance environments, highlighting the extent to which management entrenchment can prevent value-increasing changes. Among small investors, we find a negative relation between the level research and expected monitoring by large shareholders, consistent with their marginal benefit from devoting attention to such firms being lower. Finally, more passive investors conduct significantly less research, which is rational but potentially troubling given the increasing trend toward index investing. Across all funds, investors’ governance research is related to their investment policies.
Keywords: Corporate Governance, Governance Research, Institutional Investors, ISS JEL Classification: G30, G34
We wish to thank Ian Appel, Philip Bond, Diane Del Guercio, Alex Edmans, Todd Gormley, Tom Griffin, Jarrad Harford, David Haushalter, Mathew Gustafson, Jonathan Karpoff, Jason Kotter, Nadya Malenko, and seminar and brown bag participants at the Pennsylvania State University, Drexel University, University of California at Berkeley, and the University of Washington for their helpful comments and discussions. Peter Iliev acknowledges financial support from the Smeal Research Grant Program.

1
1. Introduction
The separation of ownership and control within public firms results in agency costs that
negatively influence firm value (Jensen and Meckling, 1976). Shareholders can limit these
agency costs by monitoring management. Importantly the manager also benefits from such
monitoring, as the expected benefits to the CEO and management team of better future
performance outweigh the loss in utility due to lower perquisite consumption. However, in the
absence of monitoring the manager is unable to credibly commit to such best practices. Despite
the advantages to multiple parties from monitoring, frictions can cause monitoring to be at a
suboptimally low level. As highlighted by Berle and Means (1932), any single shareholder
incurs all the costs of monitoring but enjoys only a small portion of the benefits.
The value of corporate governance lies in its ability to mitigate these frictions. Ideally,
shareholders elect directors who are both better informed and better incentivized to monitor
management, they vote in an informed manner on compensation plans designed to incentive
management, and they further introduce necessary governance changes via shareholder
proposals. Additionally, a larger shareholder can engage directly with management to
communicate concerns and suggestions. All these mechanisms facilitate shareholder monitoring
of the firm. However, they are only effective in positively influencing firm value if shareholders
expend the necessary resources to become informed about the important issues facing the firm,
and to subsequently make informed votes and/or to have informed discussions with management.
The objective of this paper is to provide direct evidence on the extent to which investors
expend resources becoming informed about governance-related matters. To the best of our
knowledge, we are the first to utilize a direct measure of research conducted by a large group of
key shareholders in the company, prior to the shareholder meetings where governance, director

2
representation, and compensation issues are up for a vote.
We obtain novel data from the U.S. Securities and Exchange Commission (SEC), which
allows us to measure both the number of views of each company filing from the SEC Electronic
Data Gathering, Analysis and Retrieval (EDGAR) platform and the identity of key investors
accessing these filings. For 89 large mutual fund families and 3,700 companies over seven
years, we can determine the precise times when each investor accessed each SEC filing for each
company. In addition, for three more recent calendar years within our sample, we also observe
the times when the largest proxy advisory service company, Institutional Shareholder Services
(ISS), accessed each company filing.
We build our dataset using the publicly provided EDGAR server internet search files
from the SEC Division of Economic and Risk Analysis. These log files include partially
scrambled IP addresses, which do not reveal the full IP address but which are sufficiently
detailed to enable a mapping to the IP blocks held by institutional investors.1 Our primary
measure of governance research is investors’ views of proxy statements plus any other filings
viewed by the investor on the same day they view the company proxy.2 The proxy statement is
the most important document officially filed with respect to the meeting; other filings viewed
concurrently with the proxy statement arguably provide additional timely and relevant
information (such as information about firm performance contained in a 10-K, large acquisitions
discussed in an 8-K, activist engagements reported on form 13D, or changes in insider ownership
disclosed on form 4). We count the number of requests for these filings, over a three-month
1 Several contemporaneous papers similarly rely on this approach, including for example Chen, Cohen, Gurun, Lou, and Malloy (2017) to study investment decisions, Bozanic, Hooppes, Thornock, and Williams (2017) to study the IRS, and Gibbons, Iliev, and Kalodimos (2018) to study sell-side analysis. 2 Both investors and ISS likely access further information through company websites, the media, and other news aggregators. Thus, when we refer to governance research we will be measuring the reliance on one important channel of timely information: primary firm filings in the EDGAR system

3
period leading up to the annual meeting.
Broadly speaking, our objectives are threefold. First, we seek to examine the level of
research conducted, by both investors and ISS, across different types of companies. Second, we
relate this research to the companies’ governance environment and ownership structure. Third,
we evaluate the relation between such research and investors’ voting decisions and associated
portfolio changes.
Our first set of findings highlights the amount of governance-related research conducted
by many mutual fund families. The top five families access governance-related filings of 24% of
their portfolio firms, on average. While the value of corporate governance is a matter of constant
debate, the finding that these mutual fund families are devoting substantial resources to the issue
provides indirect evidence on the extent to which they view it as a key determinant of firm value.
Investors’ attention to firms is driven by their incentive to maximize the value of their
shareholdings. Thus, their level of governance-related research should be related to their ability
to influence a firm’s governance in ways that positively affect firm value. To the extent that
worse governed firms would benefit more from improvements, investors should focus their
attention on these firms. However, it is also possible that investors determine that management
entrenchment is sufficiently severe at such firms that they have little ability to effect change and
therefore focus less attention in such firms. Across multiple tests, we find significant support for
the latter effect. Investors conduct significantly less research in dictatorship firms and in dual
class firms. Interestingly, this contrasts with patterns in ISS’s level of research, where we find
little evidence of less research in more poorly governed firms. This difference is consistent with
the contrasting incentives of these two groups. ISS is arguably more focused on highlighting
governance problems in firms, whereas investors are incentivized to focus on firms where they

4
can make value-increasing changes. Investors’ apparent conclusion that they are less able to
make value-increasing changes within those companies that would benefit the most from such
changes highlights the substantial costs of poor governance.
Also related to investors’ ability to effect change within a firm, we find that investors
focus more on firms that have recently performed more poorly, i.e., on firms where the potential
for value-increasing change is likely greater. In addition, larger investors and investors with
larger holdings in a firm conduct significantly more research. These findings are largely
consistent with prior literature, e.g., Iliev and Lowry (2015) and Malenko and Shen (2016),
though our more precise data gives us a direct confirmation of this phenomenon and a better
ability to estimate economic magnitudes. Specifically, our findings suggest that a one standard
deviation increase in fund family assets under management (AUM) is associated with 16.5%
more governance research, and a one standard deviation increase in the fraction of the firm held
is associated with 11.1% more governance research.
Perhaps not surprisingly, we find that ISS is motivated by its incentives to cater to its
clients. For example, ISS conducts significantly more research on firms with more institutional
investors. Conditional on issuing a recommendation, ISS accesses an average of 17 company
filings among the firms in the top quintile of institutional investors, but only 4 filings among the
firms in the lowest quintile. Among the firms on which it issues recommendations, ISS views
zero filings in approximately 20% of cases and these cases predominantly represent small firms
with few institutional investors. Our results suggest that the quality of ISS recommendations
likely varies across firms, a troubling finding if ISS influences vote outcomes (see, e,g., Malenko
and Shen (2016), Iliev and Lowry (2015), Cai, Garner and Walkling (2009)).
Investors’ governance-related attention to firms should also be related to the relevance of

5
this information for their portfolio decisions. An outstanding question in academic literature as
well as within regulatory circles concerns the level of monitoring by passive investors. To the
extent that firm governance influences firm performance, more active investors have stronger
incentives to research the firm’s governance environment, as it would influence their portfolio
decisions.3 Findings of Schmidt and Fahlenbrach (2017) are consistent with such effects.
Alternatively, more passive investors regularly state that they are more engaged in firms’
governance because they do not have the option to sell firms. This view is summarized in
Vanguard’s statement, “We’re going to hold your stock when you hit your quarterly earnings
target. And we’ll hold it when you don’t. We’re going to hold your stock if we like you. And if
we don’t. … That is precisely why we care so much about good governance.”4 Findings of
Appel Gormley and Keim (2016) provide empirical support for this viewpoint.
On average across all firms, our findings provide the strongest evidence for the former
view: the portion of a fund family’s AUM in index funds is significantly negatively related to
the amount of research. A one standard deviation increase in AUM in index funds is associated
with 2.7% less governance research. However, there are strong cross-sectional differences.
While all investors devote more attention to their larger holdings, this effect is particularly strong
among more passive investors. This is consistent with the disproportional effects of these firms
on performance, given the inability of these investors to divest holdings. We also find that more
passive investors are significantly more likely to focus attention on firms where change via voice
is more likely, as evidenced by more shareholder proposals or more proposals where ISS
recommends voting against management.
3 In addition, exit can itself be a powerful governance mechanism, as shown by Admati and Pfleiderer (2009), Edmans (2009), Edmans and Manso (2011), and Edmans, Fang and Zur (2013). 4 “Getting to Know You: The Case for Significant Shareholder Engagement”, June 24, 2015, F. William McNabb III, Chairman and CEO of the Vanguard Funds.

6
Finally, the expected monitoring by other investors represents an additional factor that
potentially affects investors’ attention to a firm. At the margin, if an investor perceives other
shareholders to be diligently monitoring the firm, she may conclude that the marginal benefit
from devoting time to similar monitoring activities is lower. When other investors are more
likely to uncover and communicate governance problems, all investors will benefit from any
changes (see, e.g., McCahery, Sautner and Starks, 2016). This suggests a negative relation
between an investor’s level of research and the expected monitoring by other investors, i.e., a
substitution-type effect. Alternatively, investors may have incentives to coordinate, especially
when the stakes are high. A single investor is unlikely to swing a vote and change within a firm
is more likely when multiple investors pressure for change. In this scenario, an investor’s
incentives to devote attention to the firm are an increasing function of other investors’ attention.
These effects are not mutually exclusive. It may be that complementarities exist in the
most contentious cases, for example where change requires the engagement of multiple firm
owners, while investors defer to the monitoring of others on less controversial items. We find
some support for this conclusion. Consistent with investors working together to effect change,
on average each investor’s level of research is positively related to contemporaneous research by
other investors. However, we also find evidence consistent with a substitution effect.
Controlling for contemporaneous research, investors conduct less research on firms whose other
shareholders are expected to be more engaged, as proxied by their propensity to do research in
other firms.
The contention that governance-research reflects investors’ monitoring of the firms leads
to the prediction that this research should be significantly related to voting behavior. We isolate
firm meetings where we can identify a single issue that is particularly controversial, and we

7
compare investor research in advance of these meetings to the investors’ tendencies to follow
ISS’s recommendation. We find that the extent of investors’ governance research is significantly
positively related to their tendency to disagree with ISS, which the literature uses as strong proxy
for informed voting.
In the last part of the paper, we examine the extent to which investors’ governance-
related research is related to their investment decisions. The finding that many investors devote
considerable resources toward researching governance-related matters implies that investors
perceive these matters to be important drivers of firm value. If governance-related issues are
indeed used in the fund family investment decisions, then information obtained from proxy
statements will affect investors’ buy and sell decisions. Alternatively, it might be the case that
governance-related matters are relatively unimportant, compared to financial statements and the
overall direction of the business, for example as would be summarized in annual reports on form
10-K and important current business communications on form 8-K. Results provide strong
evidence that governance-related matters influence investment decisions. Governance-specific
research has an effect that is at least as large as that of other relevant research.
Our paper contributes to several streams of literature. First, our paper contributes to the
stream of literature examining the extent in which dispersed shareholders monitor the firm and
mitigate agency costs, a question that has been at the forefront of finance since Berle and Means
(1932) and Jensen and Meckling (1976). Existing studies have examined this question by
inferring monitoring based on outcomes around salient corporate events such as mergers (e.g.,
Shleifer and Vishny, 1986; Chen, Harford, and Li, 2007) or from investor voting behavior
(Matvos and Ostrovsky, 2008; Iliev and Lowry, 2015; Cai, Garner and Walkling, 2008; Fos, Li
and Tsoutsoura, 2018). In contrast to these more indirect approaches, we measure monitoring

8
directly, by observing investors’ views of the company’s filings.
Our paper also relates to the literature on the effects of the shareholder base and the ways
in which owners can influence corporate policies. Allen, Bernardo and Welch (2001), Becker,
Ivkovic and Weisbenner (2011), and Brown, Liang and Weisbenner (2007) highlight the effects
of the shareholder base, finding that firms’ policies are related to investor preferences. We
examine the ways in which firm monitoring relates to the identity of the firm’s owners, an
important issue given the fact that monitoring underlies influences nearly all corporate policies.
Third, our paper relates to the literature on shareholder voting and activism. A relatively
large body of literature examines the ways in which hedge funds and shareholder activists
engage in monitoring, often through aggressive means such as proxy fights (Klein and Zur, 2008;
Brav, Jiang, Partnoy and Thomas, 2008; Brav, Jiang and Kim, 2010), ‘Just Vote No’ campaigns
(Del Guercio, Seery, and Woidtke, 2008), or private engagements (Becht, Franks, Mayer, and
Rossi, 2009; McCahery, Sautner and Starks, 2016). However, far less is known about the extent
of monitoring by investors such as mutual funds that do not engage in such aggressive practices.
Appel et al (2016) provide evidence that greater ownership by passive index funds causes better
governance practices by focusing on Russell Index cutoff points. We provide a broader
perspective on this issue, by looking across a wide set of investors and a wide set of companies.
2. Data
Our sample consists of all mutual fund families that we can link to IP address block(s)
accessing EDGAR in 2015. We require that the fund families have voting data for more than 100
securities. Our final sample consists of 89 fund families and the 3,700 companies that are owned
by these fund families, between 2011 and 2017.

9
When a request is made through the EDGAR interface (e.g., when a person requests a
company filing on EDGAR), the server records information about that request in the server log
files.5 This information includes the filing requested, the time and date of the request, and the IP
address of the computer that requested the filing. Following a Freedom of Information Act
(FOIA) request by the public, the SEC has made the server log files publicly available. The log
files represent detailed daily records of all requests going back to 2003. The SEC partially masks
each IP address to protect the identity of the requestors, by only providing three of the four
blocks that comprise an IP address. For example, the IP address 192.175.172.111 will be
reported as 192.175.172.dgd in the server logs available for request, where the “random” letter
part dgd refers to the true number between 0 and 255.6 The key insight that enables us to match
these partial IP addresses to investors is the fact that many large investors purchase entire blocks
of IP addresses, for example owning 192.175.172.0, 192.175.172.1, 192.175.172.2, …,
192.175.172.255. Moreover, in cases where a large investor owns a part of the block, the
probability that the EDGAR traffic comes from the other parts of the block (which are usually
non-financial business or residential properties) is minimal. Digital Elements provides a linking
file, which lists IP addresses and the organizations to which these addresses are registered. We
match these organizations to 13-F investors using the organization names that correspond to each
IP address. Using this linking file, we can determine all EDGAR views by these 89 mutual fund
families. For conciseness, we refer to these mutual fund families as investors. We describe the
process of identifying fund families in the EDGAR log files in further detail in the Appendix.
Because we are interested in governance-related research, we concentrate on EDGAR
5 Lee, Ma, and Wang (2015) have used data on these EDGAR requests to identify firm peers through investor searches, and Bauguess, Cooney, and Hanley (2014) use these data to assess investors’ aggregate interest in IPOs. 6 The three-digit character code, e.g., dgd, refers to the same numeric code throughout the sample, meaning it uniquely identifies one computer.

10
requests in a period prior to the annual meeting. Company annual proxy statements are typically
released between 40 and 50 days prior to the annual meeting, and many investors likely start
their governance research at this point. However, the substantial clustering of annual meetings in
calendar time means that an investor who strives to make informed votes on each firm across a
large portfolio faces rather severe time constraints. Faced with such constraints, an investor may
choose to do some preparatory work in advance, for example by looking at the prior year’s proxy
before the current year proxy is released. For this reason, we define our measure of investor
governance research across a window beginning 30 days prior to the release of the proxy
statement and continuing through the date of the annual meeting.
For each investor-firm pair, we first measure the number of times during this period that
each investor accessed the firm’s proxy, including the proxy statement of both the current year
and any past years. This is our narrowest measure of governance research. Our second measure
captures a broader measure of governance research. We include both proxy statements and any
other company filings that are accessed on the same day as a proxy statement. Throughout the
paper, we utilize this second measure as our main metric of governance research, and for
conciseness, we refer to this as proxy-related views.
Figure 1 provides an example of one mutual fund family’s filing views in one company.
We show Vanguard’s governance-related views of Apple filings prior to their 2015 annual
meeting, which was held on March 10, 2015. The figure plots our main measure of governance
research, views of proxy statements and of all other filings that are viewed on the same day as a
proxy statement. The figure is in event time based on calendar days, with day 0 representing the
day of the annual meeting. Consistent with the expected timing of governance research, we
observe some views of these filings in the two to three months ahead of Apple’s annual meeting,

11
for example with one request on day -78, two requests on day -60, etc. However, Vanguard’s
research is concentrated in the days closer to the annual meeting, for example with eight requests
on day -15 and five requests on day -8.
When we aggregate across all of Vanguard’s holdings, we observe a much smoother
distribution but with the same substantial spike in governance research in advance of the annual
meeting. Over days -90 through -50, governance-related research is close to zero. The bulk of
the governance-related research occurs between days -25 and 0, with multiple days on which
Vanguard viewed over 1,000 filings a day related to governance. The heaviest activity occurs on
day -7, with over 2,000 filing views. Patterns are similar for Fidelity, though the magnitude
across these two families differs substantially. While Vanguard views over 1,000 filings in many
of the days leading up to the annual meetings, Fidelity only views between 200 and 600 filings
during this period. These patterns are shown in Online Appendix Figure A1.
One potential concern with our measure of governance-related research is that it may not
be comprehensive. We discuss here three potential sources of bias and the ways in which we
address these issues. First, a mutual fund family might batch request all firm filings onto a
central drive for employees to access. To avoid such mass requests as representing research, we
filter them out (see data appendix for more details on our method of filtering out bot requests).
Further, to ensure that we do not classify such cases as representing a mutual fund family that
does zero governance research, we require the investor to look at EDGAR a minimum of 100
times and to look at a minimum of 1% of their portfolio each quarter.7 A second possibility is
that a mutual fund family might rely on a source other than EDGAR for company filings, for
example, Bloomberg. However, by the virtue of using the log files, we by definition only link
7 After imposing this filter, in 95% percent of the investor-year observations investors view at least 10% of their stable portfolio holdings. Investors look at 48% (45%) of their stable portfolio on average (median).

12
mutual fund families that use EDGAR. Moreover, our requirement that the mutual fund family
view at least 100 company filings and at least 1% of its holdings during the period leading up to
the annual meeting will filter out any mutual fund family that relies nearly exclusively on a non-
EDGAR source. Finally, a third possibility is that a mutual fund family may rely on a
combination of EDGAR and other sources. In this case, the family will be included in our
sample, but we will underestimate the extent of research they conduct. We note that this should
represent noise and thus bias us against finding predicted effects. Arguably the strongest
evidence that our measure of governance-related research captures real effects is through the
figures and tables described in the next two subsections.
3. How actively do investors and ISS research firms’ governance?
3.1 Governance-related research by investors
We begin our empirical analysis by investigating the extent of governance-related
research conducted by investors. First, this provides indirect evidence on investors’ perception
of the importance of governance to firm value. A rational investor would only expend resources
researching firms’ governance environment if she felt it significantly affected firm value.
Second, we compare the factors related to the research of investors versus ISS. Because ISS is
not a shareholder in these firms, its incentives to conduct research are arguably not exactly
aligned with investors’. Third, it is also informative to observe what types of firms have very
little governance oversight, either by investors or by ISS.
Table 1 provides details on the extent of investors’ research. The left-hand set of
columns describes the total data, i.e., the filing views of all 89 mutual fund families in all firms
that they own across seven calendar years, a total of 327,329 observations. Looking at the first

13
row, mutual fund families on average viewed 0.18 current year proxy statements per firm over
the approximately 80-day window preceding the annual meeting. This average consists of many
zeros, i.e., many cases of investors viewing zero proxy statements, combined with a small
number of cases in which investors conduct a substantial amount of research on a firm.
Subsequent columns show that approximately 10% of investor-firm pairs had at least one
request, and conditional on having at least view the mean number of views is 1.76.
The following rows indicate that investors do indeed consult both other filings and proxy
statements from prior years. Average total proxy-related views, our main measure of governance
research equals 0.81. We again observe considerable skewness; conditional on viewing at least
one filing, the average investor has 6.68 proxy-related views. In regression analyses, we use
logged versions of these variables to eliminate outliers.
The fifth row shows the broadest measure of investor research, including views of all
filings irrespective of whether the investor contemporaneously looked at a proxy statement of the
firm. While this measure likely includes a lot of more investment-related research and we do not
use it for our main tests, we include it here for descriptive purposes. On average, an investor
views 4.28 filings, with 36% of investor-firm pairs having at least one view.
The second and third sets of rows describe the firms’ annual meetings and financial
characteristics, respectively where data is again shown at the investor * firm level, a total of
327,329 observations. On average, ISS recommends to vote “For” on 92% of the items on a
firm’s agenda, there are 0.35 shareholder proposals and 9.49 management proposals. The
average firm is slightly larger and more profitable than the average publicly-traded firm. This is
consistent with the fact that institutional ownership is larger in such firms and thus our sample is
weighted toward these types of firms.

14
The fourth set of rows describes the ownership positions of these investors in these firms.
On average, ownership by the 89 mutual fund families in our sample equals 1.35%, 11 of these
investors have ownership between one and five percent and these large investors’ aggregate
ownership equals 24%. There are an average 1.76 mutual fund families with ownership greater
than 5% with aggregate ownership of 14%. The fifth set of rows describes the governance
characteristics of the firms held by investors, where the sample is restricted to the S&P1500
firms covered by RiskMetrics. These metrics are broadly similar to those reported in the prior
literature (see, e.g., Field and Lowry (2018), Jordan et al (2014), Bebchuk et al (2013)).8
Panel A of Figure 2 depicts our main measure of governance research, across this dataset.
Patterns observed here are largely similar to the patterns previously shown for subsets of the
data, i.e., research of a single mutual fund family. The magnitude of governance-related research
increases markedly as one approaches the annual meeting. The strength and consistency of these
patterns across the figures represents a strong signal regarding the quality of the data.
At first glance, one puzzling facet of these figures is a somewhat cyclical pattern. This is
driven by the fact that Figures 1 and Figure 2 are based on calendar time. Because annual
meetings tend to be on a Tuesday, Wednesday, or Thursday, there will tend to be less research
done on certain days when measured in event time. Consistent with most people following a
Monday to Friday workweek, there are relatively few requests on Saturdays and Sundays. Panel
A of Online Appendix Figure A2 shows the strong day of the week pattern.
Figure 3 provides some univariate statistics on the types of firms in which investors
concentrate their governance research. Looking first at panel A, the extent of research is
strongly positively related to firm size. Placing firms into quintiles based on market
8 The e-index is higher within our sample than in samples that end prior to 2007 due to changes in the underlying data, which were associated with mergers of data providers.

15
capitalization, investors view an average of 2.3 filings per firm within the largest market
capitalization quintile, compared to only 0.7 filings per firm within the bottom quintile. Panel B
shows the effects of firm size from a slightly different perspective. Within each investor’s
portfolio, we rank firms such that firms in quintile 5 represent those with the greatest weight in
the portfolio and firms in quintile 1 the lowest weight. Patterns are similar to those shown in
Panel A.
Finally, Panel C places firms into quintiles based on their market-adjusted returns over
the fiscal year preceding the meeting, where quintile 5 includes firms with the highest abnormal
returns. We conjecture that investors will conduct more research on firms that have performed
more poorly over the past year. Somewhat surprisingly, this univariate evidence does not show
evidence of such a pattern. We examine this prediction in more detail using regressions in the
next section of the paper, where we control for the strong effects of firm size.
3.2 Governance-related research by ISS
An additional feature of our data is that we can also identify the research of ISS over a
span of three years. Table 2 shows statistics analogous to Table 1, but centered around ISS
research instead of investors’ research. The sample consists of all publicly traded firms for
which ISS issues recommendations, between 2015 and 2017.
As expected for an informational intermediary, ISS is a much heavier user of financial
filings than its clients. ISS views proxy statements in approximately 83% of the companies in our
sample. However, a more cynical perspective is that among nearly one-fifth of companies for
which ISS issues recommendations, we observe no record of ISS accessing company
governance-related filings. Subsequent findings show that that these firms are strongly
concentrated among certain firm types.

16
For the median company-year, ISS views two current year proxies and four proxy-related
filings (including proxies from current and past years). The mean views are even larger,
suggesting that ISS does extra research about some company meetings. The following sets of
rows provide meeting and firm characteristics similar to those shown in Table 1. The overall firm
size here is smaller because this is essentially an equally weighted firm sample, while Table 1
was weighted by the families that hold a firm, and therefore weighted more towards the larger
companies. Nonetheless, the summary statistics in Table 2 are qualitatively similar to their
counterparts in Table 1.
Given that ISS distributes their recommendations to funds in advance of the vote, we
expect ISS research to be concentrated slightly earlier in event time. As shown in Panel B of
Figure 2, this is exactly what we find. ISS governance-related views begin and end slightly
earlier. Around day -50, they request approximately 500 filings a day (in event time), which
increases to nearly 1500 filings a day between day -25 and -12. There are very few requests after
day -12. As described earlier, we are only able to match ISS requests for three calendar years,
2015 through 2017. To ensure that our data quality is similar for these years, we also replicate
this figure for each individual year (not shown). The pattern is similar. Finally, as shown in
Panel B of Online Appendix Figure A2, there is also a strong day of the week effect for ISS,
which is similar to that of mutual funds.
We also find that patterns in ISS’s research are similar to those of investors, for example
concentrating more on large firms. Consistent with ISS catering to the demands of its customers,
i.e., institutions, we also find that extent of ISS research is strongly related to the number of
institutions that own firms. These patterns are shown in Appendix Figure A1.

17
4. Governance-related research by investors and ISS
4.1 Patterns in investors’ and ISS’s research
The objective of this section is to systematically investigate the firm and investor
characteristics that relate to the governance research of both institutional investors and ISS. We
examine multiple factors that potentially affect the incentives to acquire information: investors’
passive versus active investment strategies, investors’ holdings in the firm, firm size and
financial characteristics, firm governance, and the contentiousness of the items up for vote.
Table 3 shows ordinary least squares (OLS) regressions of investor research on each of
these factors. Table 4 examines the extensive and intensive measures of investors’ research, and
also contrasts investors’ research with ISS’s research. Focusing first on Table 3, the sample
represents an unbalanced panel consisting of all 89 mutual fund families in our sample and all
firms owned by each family within each calendar year, resulting in a sample of 219,954 investor-
firm-year observations with non-missing control variables. The dependent variable is our main
measure of governance research, the log of one plus investor views of both firm proxy statements
and all other firm filings accessed on the same day as a proxy, in the window that starts 30 days
before the current proxy is filed and ends at the meeting date. Regressions include industry and
calendar year fixed effects and standard errors are clustered at the company annual meeting
level. We begin by estimating regressions of governance research on one set of variables at a
time because many of the covariates might be related. For example, the percent of institutional
ownership is closely related to firm size, and activist attacks reported on form 13-D filings are
usually provoked by poor performance.9
We begin in Column 1 by focusing on investor characteristics, including investment
9 Karpoff, Malatesta and Walkling (1996) document that firms with poor performance attract governance proposals.

18
strategy, investor size, and the investor’s holdings in the firm. As discussed earlier, the effects
of investment strategy on research intensity, i.e., of active versus passive investing, can be
positive or negative. To the extent that governance factors relate to future expected performance,
we would expect more active investors to undertake more governance-related research as an
input into portfolio decisions. Alternatively, passive investors frequently argue that they are
more engaged with firms, as it is their only mechanism for increasing portfolio value. This
argument suggests that more passive investors would undertake more governance-related
research. Results support the first scenario. Mutual fund families with a greater portion of assets
under management (AUM) in index funds conduct significantly less research. A one standard
deviation increase in fraction of AUM in index funds is associated with a 2.7% decrease in the
amount of research. In today’s markets, where a greater portion of investments are moving into
passive investment strategies, this lower monitoring represents a potential cause for concern.
We also find that investors conduct significantly more research on their top 10 holdings,
and more generally that research is significantly positively related to fund family holdings. The
motivation for conducting governance-related research is to influence firm decisions in ways that
contribute to higher shareholder value, where this influence may come in the form of shareholder
votes and/or more informal lines of communication. If such influence has the potential to
increase shareholder value by a certain percent, then the fund has strong incentives to focus its
efforts on its largest positions where this percent translates into the largest dollar gain.
Larger fund families conduct more research, which as discussed by Iliev and Lowry
(2015) is consistent with economies of scale in governance research: larger fund families can
spread the costs of research over a wider asset base, and any gains in terms of higher returns are
magnified by the wider asset base.

19
Column 2 examines the ways in which research is related to firm characteristics such as
firm size and firm performance. We expect a positive relation with firm size, as large firms tend
to represent a greater portion of an investor’s portfolio and thus the benefits of governance
research are greater. We expect a negative relation with firm performance. All else equal a firm
that is underperforming the market is more likely to have some problems that need to be
addressed, for example, to be operating inefficiently. Investors have incentives to determine
whether such inefficiencies are related to agency issues, for example, suboptimal management
incentives, or whether they are beyond the control of management. The second column shows
support for both these predictions. We also find that investors tend to conduct more extensive
research in firms with higher leverage, lower market to book, lower tangibility, and higher
probability of default. These characteristics are related to both higher riskiness of the company
equity and potentially higher probability of and larger losses in default. Hence, it is natural that
investors will scrutinize these companies’ governance practices.
The third column investigates the effects of firm governance. A broad body of literature,
including for example Gompers et al (2003), Gompers et al (2010), and Bebchuk et al (2009),
argues that some governance structures give less power to shareholders, and thereby facilitate
perquisite consumption by management. To the extent that investors can improve the governance
environment of such firms and thereby increase firm value, they would have incentives to focus
their attention on these firms. However, focusing on such poorly governed firms will not be
worthwhile if management is sufficiently entrenched that change is improbable. For example,
Bhandari et al (2018) show that entrenched management is more effective at blocking
controversial shareholder proposals from annual meetings. In sum, the relation between firm
governance and investors’ governance-related attention is an empirical question.

20
As shown in Column 3, results are more consistent with investors devoting less time to
more poorly governed firms. For example, investors devote significantly less attention to
dictator firms, as measured by an E-Index of four or more. In the full regression specification
where we control for all factors, we also find that investors also devote significantly less
attention to dual class firms.
Finally, we posit that the extent of research will be greater among firms facing more
pressure, for example, firms with an agenda item on which ISS is recommending against
management, firms with a say-on-pay proposal on the agenda, firms with a 13D filing, and firms
with more shareholder proposals. The fourth column provides strong support for this prediction.
All four of these measures of controversy are significantly positive.
The fifth column includes all proxies, with the exception of the governance measures as
these are only available for a subsample, and the sixth column includes all variables. Results
across both these specifications are largely consistent with those discussed above.
As shown in Table 1, investors on average only conduct research in 13% of firm-years,
meaning the Table 3 regressions include many zeros. Moreover, it is likely that an investor first
decides whether to do research on a firm, and subsequently assesses the amount of research to
conduct. Columns 1 and 2 of Table 4 investigate the above patterns further, by estimating both
the extensive and intensive margins. Specifically, column 1 includes all observations, and the
dependent variable equals one if the investor viewed any proxy-related filings of the firm in that
year, zero otherwise. Column 2 restricts the sample to those investor-firm-years in which the
investor viewed one or more proxy-related filings, and the dependent variable equals the log of
one plus the number of such filings. Results are largely consistent using both measures:
indexers do significantly less research, and firms with lower quality governance structures are

21
significantly less researched. In addition, both the propensity to conduct research and the
amount of research conducted are positively related to an investor’s holdings, negatively related
to firm performance, and positively related to the contentiousness of the items up for vote.
Unlike investors, ISS’s incentives to conduct research are not driven by the dollar returns
on investments in these firms. Rather, ISS’s business model relies on selling its
recommendations to institutional investors, and investors with fewer resources might be even
more reliant on ISS.10 It follows that ISS research should be positively correlated with investors’
demands for research. Thus, our first prediction is that the extent of ISS research should be
positively related to the number of institutional investors in a firm. Beyond this, ISS has
incentives to focus on the same types of firms as investors. For example, each investor focuses
more on the larger firms in its portfolio, meaning that ISS likewise has added incentives to focus
on these same firms. Similar arguments hold for other factors discussed above.
Columns 3 and 4 of Table 4 show broad support for these predictions, along both the
extensive and intensive margin. A one standard deviation increase in the logarithm of one plus
the number of institutional investors is associated with a 4.2% higher probability of conducting
governance research, and conditional on some research with a 34.0% increase in the number of
filings accessed. Similar to investors, both the probability of and the extent of ISS research are
negatively related to past firm performance and positively related to firm size. In addition, like
investors, ISS conducts substantially more research on firms that have more contentious items on
their agenda, as measured by the presence of a shareholder proposal, the presence of a 13D
filing, and the presence of a say-on-pay vote.
10 In 2003 the SEC mandated that all mutual funds adopt policies and procedures ensuring that their votes are casts in the best interests of their clients. The SEC further considers the use of outside advisors like ISS as fulfilling this fiduciary duty.

22
The most notable difference between investors’ research and ISS’s research pertains to
the governance environment of the firm. While investors conduct less research on poorly
governed firms, we find no evidence of such a negative relation for ISS. Compared to investors,
ISS has less of a reason to only focus on firms for which it can make value-increasing changes.
In sum, Tables 3 and 4 provide strong evidence that both investor and ISS research are
concentrated within certain types of firms. On the one hand, these findings are generally
consistent with fundamental economics underlying governance-related research: all players
focus their efforts where the net benefits are greatest. However, they also suggest that certain
types of firms are substantially less likely to be monitored by any of these entities. This strong
clustering of research within a subset of firms raises questions about the extent of monitoring in
firms that are smaller and that have lower institutional ownership.
4.2 Indexers versus actively managed funds: contrasts in attention
Index mutual funds differ from their actively managed counterparts along one key
dimension: their ability to divest holdings. Whereas an actively managed fund might conduct
governance research to inform investment decisions, this is not a relevant factor for index funds.
Index funds’ governance research is relevant to the extent that it enables them to make ‘better’
voting decisions or to engage ‘better’ with management, where better is defined as a mechanism
that increases expected shareholder value.
These contrasting incentives generate the prediction that index funds will be particularly
likely to focus attention on firms in which there is a higher probability of effecting change
through voice. Given that shareholder voting represents a primary channel to exercise voice, we
predict that index investors’ will be particularly likely to devote more attention to firms with
contentious items up for vote. Importantly, the existence of a contentious item up for vote

23
signals two necessary criteria: the presence of governance-related concerns at the company, and
the presence of multiple investors who are advocating for change. We employ three criteria of
contentious items: a dummy for whether ISS recommends against any item at the company’s
annual meeting, the number of shareholder proposals at the company’s shareholder meeting, and
a dummy for whether the company has a 13D around the time of the annual meeting.
Voice is less likely to be an effective channel if management is overly entrenched,
making change either infeasible or so costly as to not be optimal to pursue. Following prior
literature (see, e.g., Gompers, Iishi and Metrick, 2003), we conjecture that management
entrenchment is higher among firms in which shareholders have fewer rights. We employ two
proxies: dictatorship-type firms, which we measure as an E-Index greater than or equal to four,
and dual-share class structure.
Finally, we conjecture that index funds’ inability to divest shares increases their
incentives to devote attention to their top 10 holdings. While top holdings represent a
disproportionate amount of portfolio value for any investor, more active investors can change the
composition of these top holdings to increase performance. In contrast, index funds’ only option
is to advocate for value-increasing changes among the set of firms they are forced to hold.
Panels A and B of Table 5 examine these predictions. We begin in Panel A by splitting
all mutual fund families by whether or not the fund family has greater than 50 percent of AUM
held in index funds. We then estimate panel-type regressions similar to those in Table 3, where
the dependent variable is the natural log of one plus proxy-related views, and the observational
level is the fund family’s research prior to each firm’s meeting. All independent variables used
in Table 3 are included as controls, but are not tabulated to conserve space.
Results largely support predictions. Consistent with indexers focusing more on firms

24
with more contentious items up for vote, the coefficients on ISS Recommend Against and on
#Shareholder proposals are both substantially higher in the high indexer group than in the low
indexer group.
Indexers also focus less attention on firms in which shareholders have less power, with
the coefficients on both high E-Index dummy and the dual share class dummy being substantially
lower among the high indexer group. Finally, indexers also focus more on their Top 10
holdings, again consistent with predictions.
Panel B examines the significance of these differences, in a series of regressions. We use
the full sample, the dependent variable is again the natural log of one plus proxy-related views,
and the observational level is the fund family’s research prior to each firm’s meeting. Each
column shows one regression, where the independent variable of interest is an interaction term
between high indexer and one of the above proxies. Consistent with patterns shown in Panel A,
indexers devote significantly more attention to firms in which voice is a more viable channel, as
evidenced by the significantly positive coefficients on ISS Against Average, on #Shareholder
proposals, and on 13D filing. However, the differences (suggested in Panel A) in the governance
structure of the firm are not significant at conventional levels. Finally, indexers devote
significantly more attention on their top 10 holdings.
5. Interactions between investors
Beyond the investor’s own characteristics and the characteristics of the underlying firms,
an investor may also consider the monitoring activities of other investors. All else equal, if other
investors are expected to more diligently monitor a firm, then the marginal benefits of additional
monitoring would be lower. This suggests a negative relation between an investor’s research and

25
the expected monitoring by other shareholders.
Alternatively, the fact that a single investor is unlikely to swing a vote potentially pushes
the effect in the opposite direction. As noted above, investors should rationally focus more
attention on firms in which the probability of change is greater. Matvos and Ostrovsky (2010)
conclude that peer effects exist in voting, with an investor being more likely to vote against a
director if other investors are similarly voting against that director. This suggests that an investor
may be more motivated to research a firm if other investors are similarly advocating for change,
a dynamic that would suggest a positive relation between an investor’s research and expected
monitoring by other shareholders.
Our data provides a rare opportunity to examine whether such interactions exist. Several
factors suggest that investors may be able to estimate the intensity of research by other
shareholders with some degree of precision. First, institutional investors’ votes are publicly
available, making it possible to understand their voting behavior. Related to this, one can
arguably infer institutions’ general devotion toward governance matters from a variety of other
sources, including for example participation at industry conferences, personal connections,
statements in the media, etc. Second, many institutions tend to hold large positions in firms
across time, often because they need to have a balanced well-diversified portfolio or, in the case
of mutual funds, because a portion of the assets under management is held in index funds.
Tables 6 and 7 examine the interactions between investors’ research efforts. Looking
first at Table 6, we again estimate regressions similar to those shown in Table 3, but we now
include measures of the expected research by other investors. The dependent variable is the
natural log of one plus proxy-related views, and the observational level is the fund family’s
research prior to each firm’s meeting. Columns 1 and 2 include all investors, and columns 3 and

26
4 limit the sample to the five largest mutual fund families in our sample: Blackrock, Vanguard,
Fidelity, State Street, and T. Rowe Price. Columns 5 and 6 include all mutual fund families
except these largest five. Regressions include investor, calendar year, and industry fixed effects
and standard errors are clustered at the meeting level.
The key independent variable is expected research by other investors, and we define
several measures of this. First, we calculate ‘Expected research by all other investors’ as
follows: for each investor in a firm in year t, we calculate the percent of firms in their portfolio in
which this investor conducted governance-related research in year t-1. We then calculate an
average of these percentages across current investors in a firm, weighted by each investor’s
holding in the firm in year t. This weighted average is calculated across all investors except the
investor represented by the dependent variable. Expected research by large (small) investors is
calculated analogously, with the exception that it is restricted to top 5 investors as listed above
(all investors except the top 5).
In all regressions we include the actual research by other investors. To the extent that
control variables don’t fully capture the characteristics of the items up for vote, this is likely
positively correlated to the contentiousness of the issues. In addition, it reflects any coordination
among investors’ research, i.e., the tendency of an investor to do more research if other investors
are also focused on the firm. Consistent with predictions, this is significantly positive across all
specifications.
Incremental to these coordination effects, we also find evidence of substitution effects in
investors’ monitoring. Looking first at column 1, a one standard deviation increase in expected
research by other investors is associated with a 3.3% decrease in an investor’s level of research.
Subsequent columns show that this effect is concentrated within small investors benefiting from

27
the monitoring of large investors. For example, column 4 shows that Top 5 investors’ research is
unrelated to the extent of research by either large or small investors. In contrast, column 6 shows
that non-Top 5 investors rely on the research of large investors: they conduct significantly less
expected research by the Top 5 investors is greater, yet they show no similar inclination to ‘free-
ride’ off the research of other smaller investors.
We conjecture that these effects will vary across firm-years, and Table 7 focuses on these
cross-sectional differences. The specifications follow Table 6, with coefficients on control
variables again suppressed. Results indicate that both coordination effects and substitution
effects are greater among an investor’s Top 10 holdings. Column 1 shows that the cases that an
investor generally views as most important and on which she conducts the most research are also
the cases in which coordination among investors and the contentiousness of the item up for vote
are most important. Column 2 shows that in these same cases the level of monitoring by other
investors is also most relevant.
6. The relation between governance research, voting, and investment positions
In this section, we focus on the relation between in-depth research and two ways in which
mutual funds can exert governance: voting in shareholder meetings and changing their
investment positions.
6.1 Voting behavior
First, we test if governance research is related to the actual fund family votes. Gillan and
Starks (2000) and Aggarwal, Saffi and Sturgess (2015) conclude that institutional investors as a
group generally use the voting process to affect corporate governance. We begin by presenting
descriptive evidence in Figure 4. If informed funds tend to make more independent decisions,

28
then they will be less likely to indiscriminately follow the recommendations of management or
of ISS (see, e.g., Iliev and Lowry (2015)). Following this logic, Panel A examines the relation
between governance-related research and extent of disagreement with management. We
categorize all fund family – firm years into quartiles based on the number of proxy-related filings
viewed before the firm’s annual meeting. Across all observations within each quartile, we
calculate the percent of issues for which the fund family votes against management’s
recommendation. Panel B is constructed similarly, with the exception that we focus on the
percent of issues for which the fund family votes against ISS’s recommendation.
Both panels are consistent the prediction that fund families who conduct more
governance-related research tend to vote more independently. Looking at Panel A, fund families
who view six or more filings prior to the firm’s annual meeting disagree with management on an
average 12% of cases, compared to only 9% for fund families that view zero filings. Panel B
suggests that more active researchers are also more likely to disagree with ISS a greater
percentage of the time, though the magnitude of the difference is smaller.
While this descriptive evidence is illustrative, we note that a more robust empirical
examination faces two challenges. First, most elections are non-controversial, with management
receiving substantial support on all proposals. This results in limited variation in the observed
voting behavior. In a related point, investors likely use some of the information acquired through
research for purposes of private communications with management, meaning that voting
behavior is only a partial reflection of the ways in which they seek to influence company
governance through voice. A second challenge is that our measure of governance research is at
the meeting level (rather than the agenda level) and at the fund family level (rather than the fund
level). In contrast, voting is at the agenda – fund level. Thus, even if we observe a substantial

29
amount of research before an election, we are unable to discern the precise issue that precipitated
this research.
To address both challenges, we focus on the issues up for vote that are most
controversial. Specifically, we use only agenda items where management receives between 40%
and 60% of the votes. These are the “close” votes that require extra research and they represent
the cases about which an investor most likely seeks to research.11 For each firm meeting and
each mutual fund family, we calculate the percent of funds within the family that vote against the
ISS recommendation, on these close votes. If informed funds tend to disagree more with the
advice of ISS, then we would expect our measure of investor research to be positively related to
this disagreement with ISS.
We present regression results in Table 8. The sample in these regressions includes only
the elections with close votes, and therefore is smaller than the other tables. We estimate OLS
regressions, where the dependent variable is percent fund family disagreement with ISS on these
close votes and the independent variable of interest is a measure of investor governance-related
research. We find that investor research is significantly positively related to investors’ tendency
to disagree with the ISS recommendation. This is true when we use the investors’ overall
governance-related research (in column 1) and when we focus more narrowly on investors’
research based solely on the company proxy statements (in column 2).
6.2 Investment decisions
Having established that investors’ research is related to their tendency to monitor
management via voice, we next seek to provide evidence on the relation between governance
11 Note that this approach introduces a look ahead bias in our results. However, the bias should arguably not be severe under the reasonable assumption that investors recognize which issues are likely to pass or fail with only a small margin, i.e., people know ahead of time when something will be a close vote.

30
research and investors’ investment decisions. Actively managed funds should increase their
positions if they conclude that the governance structure of the firm is stronger than they
previously believed. Conversely, they should divest positions if they are not satisfied with
management’s commitment to shareholder value. As shown by Admati and Pfleiderer (2009),
Edmans (2009), Edmans and Manso (2011), and Edmans, Fang and Zur (2013), exit can be a
powerful governance strategy. This is arguably particularly true if voice fails, where voice may
be in the form of either a shareholder vote or more informal conversations with management.
By examining the relation between different forms of research and changes in investors’
holdings, we can test if governance-related concerns influence investment decisions. The
magnitude of governance-related research represents a measure of the importance an investor
assigns to these issues.
Table 9 examines these relations. Our dependent variable is the absolute value of the
percent changes in investors’ holdings. We regress this measure of portfolio changes on the
investors’ EDGAR research. The sample is similar to that used in prior tests, an unbalanced
panel of the 89 mutual fund families * the firms in which each family holds shares in each
calendar year.12 For each annual company meeting, we measure the percent change in holdings
from the quarter immediately before to the quarter immediately following the annual meeting.
We include three measures of governance-related research. Our first measure is proxy-related
views, the measure that includes both proxy statements and all other filings accessed on the same
day as a proxy, which has been our main measure throughout the paper. Our second and third
measures are motivated by the fact that this regression focuses on investment decisions, making
12 Because we observe requests at the mutual fund family level, investors’ holdings are also aggregated to the family level. However, we note that this likely causes our results to be understated, as many mutual fund families include passive funds, which have limited ability to change holdings in response to any particular event.

31
it more important to ensure that we isolate even more narrowly governance research versus non-
governance research. For this reason, we separately consider the views of proxy statements, and
views of non-proxy filings on days when the investor did not access a proxy. The latter measure
serves as a measure of contemporaneous non-governance research.
Looking first at column 1 of Table 9, we observe a strong positive relation between
governance-related research and investors’ tendencies to change their holdings. A one standard
deviation increase in proxy-related views is associated with investors’ holdings changes being
14% greater, relative to the mean.13 Columns 2 and 3 further highlight the importance of
governance-specific research, compared to research that might be related to financial metrics.
When we focus just on views of proxy filings, the economic magnitude is slightly greater. A one
standard deviation change in this narrower definition of governance research is associated with a
15% change in holdings relative to the mean. In column 3, where we include both proxy views
and non-proxy views in one regression, the effects of the narrower definition of governance
research are similar to the effects of all other filings in aggregate. A one standard deviation
increase in proxy views is associated with a 12.2% change in holdings relative to the mean,
compared to an analogous 14.6% for non-proxy views.
It is important to note two points, with respect to this analysis. First, this regression
includes only holdings changes in the quarter immediately following the annual meeting, and
governance-related research is likely to have a smaller effect in the other three quarters of the
year. For example, in the quarter when the annual report is released, investment decisions are
likely to be more influenced by information contained in that filing and less influenced by
governance-related matters. Second, the mutual fund families within our sample include both
13 A one-standard deviation higher research is associated with an 0.05% change in holdings, which relative to the mean absolute change in holding of 0.35 represents 14%.

32
index funds and actively managed funds, and the motivation to engage in governance-related
research differs at least somewhat between these two groups. For example, Vanguard regularly
states that they have to engage in governance, because exit is not an option. Because our
holdings are measured at the family level, the economic magnitudes suggested by this regression
represent a weighted average across the actively managed funds and the passive funds, where the
latter are by definition not able to significantly change positions in response to any firm policy.
It follows that the economic magnitudes among the actively managed funds are even greater than
what is suggested by this specification.14
7. Conclusion
The value of corporate governance is a matter of continual debate. Despite a large body
of academic literature on the topic, there remains a lack of consensus on this core issue. Our
paper provides a revealed preference argument to the importance of governance research. If
investors did not perceive corporate governance to be relevant to firm value, it seems unlikely
that they would devote substantial resources to researching the governance-related policies of the
firm. Arguably even stronger evidence is the significant relation between investment decisions
and governance-related research.
Investors can influence firm policies through either voice or exit. Regardless of strategy,
the ultimate impact on firm value will be greatest if these decisions are informed based on firm
fundamentals. Our findings provide strong evidence on the extent to which investors devote
14 In untabulated robustness checks, we estimate the same set of regressions, over the post-March 2013 period and find similar results. We perform this robustness check because the Thompson 13-F files have been corrupted. The WRDS issued solution provides stable time series in the post 2013 period but still leaves some of the pre 2013 time series of holdings unstable. In our regressions using the overall sample, we drop cross sections for managers where the data exhibits inconsistencies.

33
resources to the governance-related issues. However, our findings also suggest some reason for
concern, as this governance research is quite concentrated within certain types of firms. Smaller
firms with lower institutional ownership have significantly lower levels of monitoring. This
raises questions regarding the extent of agency-related problems within such firms.

References
Aggarwal, R., Saffi, P., Sturgess. J., 2013. The role of institutional investors in voting: evidence
from the securities lending market. Review of Financial Studies 70, 2309–2346.
Allen, F., Bernardo, A., Welch, I., 2000. A Theory of Dividends Based on Tax Clienteles.
Journal of Finance 55, 2499-2536.
Admati, A., Pfleiderer, P., 2009. The “Wall Street Walk” and shareholder activism: Exit as a
form of voice. Review of Financial Studies 22, 2445–85.
Appel, I., Gormley, T., Keim, D., 2016. Passive investors, not passive owners. Journal of
Financial Economics 121, 111-141.
Bauguess, S., Cooney, J., Hanley, K., 2013. Investor Demand for Information in Newly Issued
Securities. Working Paper.
Bebchuk, L., Cohen, A., Ferrell, A., 2009. What matters in corporate governance? Review of
Financial Studies 22, 783-827.
Bebchuk, L., Cohen, A., Wang, C., 2013. Learning and the disappearing association between
governance are returns. Journal of Financial Economics 108, 323-348.
Becker, B., Ivkovic, Z., Weisbenner, S., 2011, Local Dividend Clienteles, Journal of Finance 66,
655-683.
Berle, A. and Means, G., 1932. The Modern Corporation and Private Property. Commerce
Clearing House, New York.
Bhandari, T., Iliev, P., and Kalodimos, J., 2018. Governance changes through shareholder
initiatives: the case of proxy access. Working paper.
Bozanic, Z., Hoopes, J., Thornock, J., Williams, B., 2017. IRS Attention. Journal of Accounting
Research 55, 79–114.
Brav, A., Jiang, W., Kim, H., 2010, Hedge Fund Activism: A Review. J Foundations and Trends
in Finance 4, 185-246.
Brav, A., Jiang, W., Partnoy, F., Thomas, R., 2008, Hedge fund activism, corporate governance,
and firm performance. Journal of Finance 63, 1729–1775.

Brown, J., Liang, N., Weisbenner, S., 2007. Executive financial incentives and payout policy:
firm responses to the 2003 dividend tax cut. Journal of Finance 72, 1935 – 1965.
Cai, J., Garner, J., Walkling, R., 2009. Electing directors. Journal of Finance 64, 2389-2420.
Chen, H., Cohen, L., Gurun, U., Lou, D. Malloy, C., 2017. IQ from IP: simplifying search in
portfolio choice. Working Paper.
Chen, X., Harrford, J., Li, K., 2007. Monitoring: Which institutions matter? Journal of Financial
Economics 86, 279-305.
Cvijanovic, D., Dasgupta, A., Zachariadis. K., 2016. Ties that bind: How business connections
affect mutual fund activism. Journal of Finance 71, 2933-2966.
Del Guercio, D., Seery, L., Woidtke, T., 2008. Do boards pay attention when institutional
investor activists “just vote no"? Journal of Financial Economics 90, 84-103.
Edmans, A., 2009. Blockholder trading, market efficiency, and managerial myopia. Journal of
Finance 64, 2481–513.
Edmans, A., 2014. Blockholders and corporate governance. Annual Review of Financial
Economics 6, 23 – 50.
Edmans, A., Manso, D., 2011. Governance through trading and intervention: A theory of
multiple blockholders. Review of Financial Studies 24, 2395–428.
Edmans, A., Fang, V., Zur, W., 2013. The effect of liquidity on governance. Review of
Financial Studies 26, 1443–82.
Field, L., Lowry, M., 2017. Bucking the Trend: Why do IPOs choose controversial governance
structures and why do investors let them? Working paper.
Fos, V., Li, K., Tsoutsoura, M., 2018. Do director elections matter? Review of Financial Studies
31, 1499-1531.
Gibbons, B., Iliev, P., Kalodimos, J., 2018. Analyst information acquisition via EDGAR,
Working Paper.
Gillan, S., Starks, L., 2000. Corporate governance proposals and shareholder activism: the role of
institutional investors. Journal of Financial Economics 57, 275-305.

Gompers, P., Ishii, J., Metrick, A., 2003. Corporate governance and equity prices. The Quarterly
Journal of Economics 118, 107 – 156.
Gompers, P., Ishii, J., Metrick, A., 2010. Extreme governance: An analysis of dual-class firms in
the United States. Review of Financial Studies 23, 1051-1088.
Iliev, P., Lowry, M., 2015. Are mutual funds active voters? Review of Financial Studies 28, 446
– 485.
Jensen, M., Meckling, W., 1976. Theory of the firm: managerial behavior, agency costs and
ownership structure. Journal of Financial Economics 3, 305-360.
Jordan, B., Liu, M., Wu, Q., 2014. Corporate payout policy in dual-class firms. Journal of
Corporate Finance 26, 1 – 19.
Karpoff, J., Malatesta, P., Walkling, R., 1996. Corporate governance and shareholder initiatives:
Empirical evidence. Journal of Financial Economics 42, 365-395.
Klein, A., Zur, E., 2009.Entrepreneurial shareholder activism: Hedge funds and other private
investors. Journal of Finance 64, 187–229.
Lee, C., Ma, P., Wang, C., 2015. Search based peer firms: Aggregating investor perceptions
through internet co-searches. Journal of Financial Economics 116, 410-431.
Loughran, T., McDonald, B., 2017. The use of EDGAR filings by investors. Journal of
Behavioral Finance 18, 231-248.
Malenko, N., Shen, Y., 2016. The role of proxy advisory firms: Evidence from a regression-
discontinuity design. Review of Financial Studies 29, 3394-3427.
Matvos, G., Ostrovsky, M., 2010. Heterogeneity and peer effects in mutual fund proxy voting.
Journal of Financial Economics 98, 90 – 112.
McCahery, J., Sautner, Z., Starks, L., 2016. Behind the scenes: The corporate governance
preferences of institutional investors. Journal of Finance 71, 2905-2932.
Shleifer, A., Vishny, R., 1997. A survey of corporate governance. Journal of Finance 52, 737 –
783.

Schmidt, C., Fahlenbrach, R., 2017. Do exogenous changes in passive institutional ownership
affect corporate governance and firm value? Journal of Financial Economics 124, 285 –
306.

Appendix A: Data description
Since 1996 the U.S. Securities and Exchange Commission (SEC) has made all company filings
publicly available online through the Electronic Data Gathering and Retrieval (EDGAR) database. The
EDGAR server records information about each request in the server log files. This information includes
the filing requested, the time and date of the request, and IP addresses of the computer that requested the
filing. The SEC has made the server log files created since 2003 available to the public.
In order to protect the privacy of the individuals requesting the filings, the SEC partially masks
the IP address that requested the filings. In this paper, we exploit the fact that organizations such as
mutual fund families register large blocks of IP address to map individual, partially masked IP address to
mutual fund families.
An IP address is composed of four blocks of numbers (octets), each of which ranges from 0 to
255, and this address uniquely identifies the computer. To mask the identity of the IP address of the
computer requesting a given filing, the SEC replaces the fourth octet of the IP address with three letters.
For example, the IP address 192.175.172.111 might be reported as 192.175.172.dgd in the server logs
available for request.
We use a lookup table provided by Digital Elements to identify the organization(s) that are
associated with the first three blocks of each IP address. 15 Continuing with the previous example, the
partially masked IP address 192.175.172.dgd likely belongs to Vanguard because “The Vanguard Group,
Inc.” is the registered owner of all IP addresses that begin with 192.175.172 (i.e., the registered owner of
192.175.172.0, 192.175.172.1, 192.175.172.2, …, 192.175.172.254, 192.175.172.255). We refer to the
first three octets of an IP address as an IP3 block.
To form our sample, we start with a list fund families that have more than 100 voting records in
the ISS Voting Analytics database in 2015. For each of these fund families, we use broad regular
expressions to match on the name with the organizations in the lookup table. For example, for Fidelity
Investments we constructed the regular expression (.*fidelity.*)|(.*fmr.*). We manually verify each
potential match to create a linking table between fund families and the IP3 blocks of which they are the
registered owner.
Most organizations in our sample hold 100% of an IP3 address block, as was the case for
Vanguard with the IP3 block 192.175.172. Out of the 47,133 IP3 blocks that we associate with fund
families, 95.5% are 100% owned by a single fund family. The remaining 4.5% of IP3 blocks represent
cases where an organization in our sample owns a portion of the block. In the cases where one fund
family owns a portion of an IP3 block and the remaining portion of the block is not matched to any fund
15 Digital Elements is a company specializing in analytics and geolocation of IP addresses.

family in our sample, we assign all EDGAR server activity from that IP3 block to the fund family. In the
110 (0.23%) cases where two or more fund families are registered owners of a fraction of an IP3 block we
assign the EDGAR server activity to the fund family that holds the highest fraction of that IP3 block.
Finally, there are 71 (0.15%) cases where two or more fund families are registered owners of the same
fraction of an IP3 block, and we drop these observations.
The EDGAR server logs record all activity by a user. There are several categories of activity that
we exclude. First, the recorded activity includes requests of landing pages, which represent lists of the
filings that are available for the user to examine. These requests have an extension of “-index.htm”. We
view these as uninformative measures of research and exclude them from our analysis of the server logs.
Second, we follow Drake et al. (2017) and also exclude clicks on icons (“.ico” extensions), XML filings
(“.xml” extensions), and filings that are under 500 bytes in size. Third, Loughran and McDonald (2016)
document that a considerable portion of EDGAR requests are by “robots”, which mass request filings for
processing through computer programs. We focus on “human” governance research and remove server
activity associated with robots. We classify an IP address (e.g., 192.175.172.dgd) as being a robot on a
particular day if that IP address requests more than 1,000 filings in a single day. This results in the
exclusion of 2,386 robot-day observations by 112 IP addresses that account for 140,853,527 requests. We
only exclude the EDGAR server activity from these IP address for the days that IP address is classified as
a robot. Finally, if a single IP address requests the same filing multiple times within 5 minutes we count
this as one view of the filing.
The lookup table provided by Digital Elements is a snapshot of all IP address registrations as of
April 2016. It is possible that a fund family changes its underlying technology infrastructure and in that
process changes its registration of IP3 blocks. To minimize the possibility of misattributing EDGAR
activity (or lack of EDGAR activity) to a fund family, we use the following methodology to determine a
window for which we are confident that the link is high quality. First, for each quarter we calculate the
percentage of the fund family’s stock holdings on which it conducts research via EDGAR. Starting with
the fourth quarter of 2015 we work in reverse chronological order and classify a quarter as a good link if
the fund family looks at more than 1% of its positions. We classify the link as no longer valid if two
consecutive quarters are below the 1% threshold. To fix ideas, if a fund family uses EDGAR to research
5% in Q4, 22% in Q3, 0% in Q2, and 0% in Q1 in the link would be considered terminated as of the start
of the third quarter.

Appendix B: Variable descriptions
Variable Descriptions EDGAR Activity Variables Current Proxy Views The number of times the current proxy statement was read before the annual
meeting. [Source: EDGAR Log Files] Current Proxy-related Views The number of times the current proxy statement was read before the annual
meeting plus the number of times other filings were read on days the current proxy was read. [Source: EDGAR Log Files]
Proxy Views The number of times any proxy statement was read in the window starting 30 days prior to the posting of the current proxy statement and ending at the annual meeting. [Source: EDGAR Log Files]
Proxy-related Views The number of times any proxy statement was read in the window starting 30 days prior to the posting of the current proxy statement and ending at the annual meeting plus the number of filings that were read on days that any proxy was read in that window. [Source: EDGAR Log Files]
Non Proxy-related Views The number of times any filing was read was read in the window starting 30 days prior to the posting of the current proxy statement on days that no proxy was read. [Source: EDGAR Log Files]
Total Filing Views The number of any filing was read in the window starting 30 days prior to the posting of the current proxy statement and ending at the annual meeting. [Source: EDGAR Log Files]
Weighted E[Investor Research by other Institutions] Normalized
calculated as ∑ ∗ , ∗
, standardized to mean zero,
standard deviation one transformed, where holdings are measured for the specific firm and research is measured as the average across all firms held by other institutions in the prior year, and 1/ 1
, . [Source: EDGAR Log Files, Thompson Reuters
S34/WRDS] Weighted E[Investor Research by
other Institutions] Normalized - Large
Calculated similar to Weighted E[Investor Research by other Institutions] Normalized except restricted to positions where the mutual fund family owns greater than 0.3 percent of the firm. 0.3 percent is approximately the median position size for this sample. [Source: EDGAR Log Files]
Weighted E[Investor Research by other Institutions] Normalized - Small
Calculated similar to Weighted E[Investor Research by other Institutions] Normalized except restricted to positions where the mutual fund family owns less than 0.3 percent of the firm. 0.3 percent is approximately the median position size for this sample. [Source: EDGAR Log Files]
Other Investors’ Proxy-related Views
The total of Proxy-related Views for all other mutual fund families for an annual meeting. [Source: EDGAR Log Files]
Any Research Dummy Dummy variable equal to one if the mutual fund family performed a positive amount of governance related research for an annual meeting. [Source: EDGAR Log Files]
Deep Research Dummy Dummy variable equal to one if the mutual fund family performed above the average amount of governance related research for an annual meeting. The

average amount of research is calculated as the sample wide average conditional on a positive amount of governance related research. [Source: EDGAR Log Files]
Company Variables Market Value of Equity Adjusted Share Price * Total Shares Outstanding at the close of the fiscal year
before a recommendation/forecast change. [Source: Compustat] Market to Book Adjusted Share Price * Total Shares Outstanding / (Total Assets – Total
Liabilities) at the close of the fiscal year before a recommendation/forecast change. [Source: Compustat]
Market Adjusted Returns The cumulative stock returns over the previous 12 months in excess of the value-weighted market index [Source: CRSP]
Profitability Operating Income Before Depreciation / Total Assets [Source: Compustat]
R&D / Assets Research and Development / Total Assets [Source: Compustat] Book Leverage (Long Term Debt + Debt in Current Liability) / Total Assets [Source:
Compustat]
High Default Risk Dummy variable equal to one if the firm is above the 90th percentile for risk of default. The risk of default is measured using the naïve Merton’s measure (Bharath and Shumway 2008) [Source: Compustat, CRSP].
Cash / Assets Cash and Short-Term Investments / (Total Assets – Cash and Short Term Investments) [Source: Compustat]
Tangibility Net Property, Plant, and Equipment / Total Assets [Source: Compustat]
E-index Entrenchment index ranging between 0 and 6 proposed by Bebchuk, Cohen, and Ferrell (2009) [Source: ISS Governance]
Dictator Dummy A dummy variable equal to one if the firm has an E-index of 4 or higher. [Source: ISS Governance]
Dual Class Dummy variable equal to one if the company has two share classes with unequal voting rights [Source: ISS Governance]
CEO-Chairman Duality Dummy variable equal to one if the CEO is also the chairman of the board of directors [Source: Execucomp]
CEO Turnover Dummy variable equal to one if the firm changed CEOs within 180 days prior to the annual meeting [Source: Execucomp]
Voting Variables
ISS Recommends Against (Meeting Average)
The fraction of agenda items on a proxy statement that ISS Recommends “Against” or “Withhold” [Source: ISS Voting Analytics]
Vote Against ISS The average tendency of the funds to vote against the ISS recommendation on “close” votes. Close votes are defined as agenda items up for vote that receives between 40% and 60% support for the managements’ recommendation [Source: ISS Voting Analytics]
Number of Shareholder Proposals The number of shareholder proposals on a proxy statement [Source: ISS Voting Analytics]
Number of Management Proposals
The number of management proposals on a proxy statement [Source: ISS Voting Analytics]

Say on Pay year The company holds it mandatory Say on Pay vote in that year. Say on Pay votes are held at least once every three years [Source: ISS Voting Analytics]
Ownership Variables Percent Institutional Ownership Total percent of equity held by institutional investors required to report
holdings on Form 13F. [Source: Thompson Reuters S34/WRDS] Percent Ownership by other
institutions Total percent of equity held by institutional investors required to report holdings on Form 13F, excluding the institution we study. [Source: Thompson Reuters S34/WRDS]
Fund Family Holdings The fraction of the company’s equity that a fund family owns. [Source: Thompson Reuters S34/WRDS]
Top 10 Holding An indicator if the stock is one of the 10 largest holdings of the fund family. [Source: Thompson Reuters S34/WRDS]
Fund Family TNA Mutual fund family total net assets [Source: Thompson Reuters S34/WRDS]
Fraction Total Net Assets (TNA) Index Funds
The aggregate total net assets of all index mutual funds in a fund family divided by the aggregate total net assets of all equity-focused mutual funds in the same family. [Source: CRSP Mutual Fund Database]
Has 13D Form An indicator is a Form 13D was filed over the previous 12 months. [Source: EDGAR]
Change in Holdings The absolute value of the investor’s change in holdings in firms for which it votes, from the quarter immediately preceding the annual meeting to the quarter following the meeting [Source: Thompson Reuters S34/WRDS]

Figure 1: Governance-related research of one mutual fund family in one firm
The sample focuses on the Vanguard mutual fund family’s views of proxy and proxy related filings of Apple, Inc in 2015. The figure shows Vanguard’s views of Apple’s proxy statements and of any other filings accessed by Vanguard on the same day as a proxy statement. We count the number of views of these filings, from 30 days prior to the release of the 2015 proxy statement through the 2015 annual meeting, which was held on March 10, 2015. In the figure, the day of the annual meeting represents day 0, and days -90 through -1 represent calendar days relative to this date.

Figure 2: Governance-related research by mutual fund families and ISS
The sample in Panel A consists of an unbalanced panel of firms held by 89 mutual fund families, between 2011 and 2017. For each investor-firm-year, we focus on the investor’s views of the firm’s proxy statements and of any other filings accessed by the investor on the same day as a proxy statement. In Panel B, the sample consists of all publicly traded firms for which ISS provided recommendations, between 2015 and 2017. For each firm-year, we measure ISS’s views of the firm’s proxy statements and of any other filings accessed by ISS on the same day as a proxy statement. We count the number of views of these filings, from 30 days prior to the release of the proxy statement through the annual meeting. In the figure, the day of the annual meeting represents day 0, and days -90 through -1 represent calendar days relative to this date.
Panel A: Governance-related views by mutual fund families, in event time
Panel B: Governance-related research by ISS, in event time
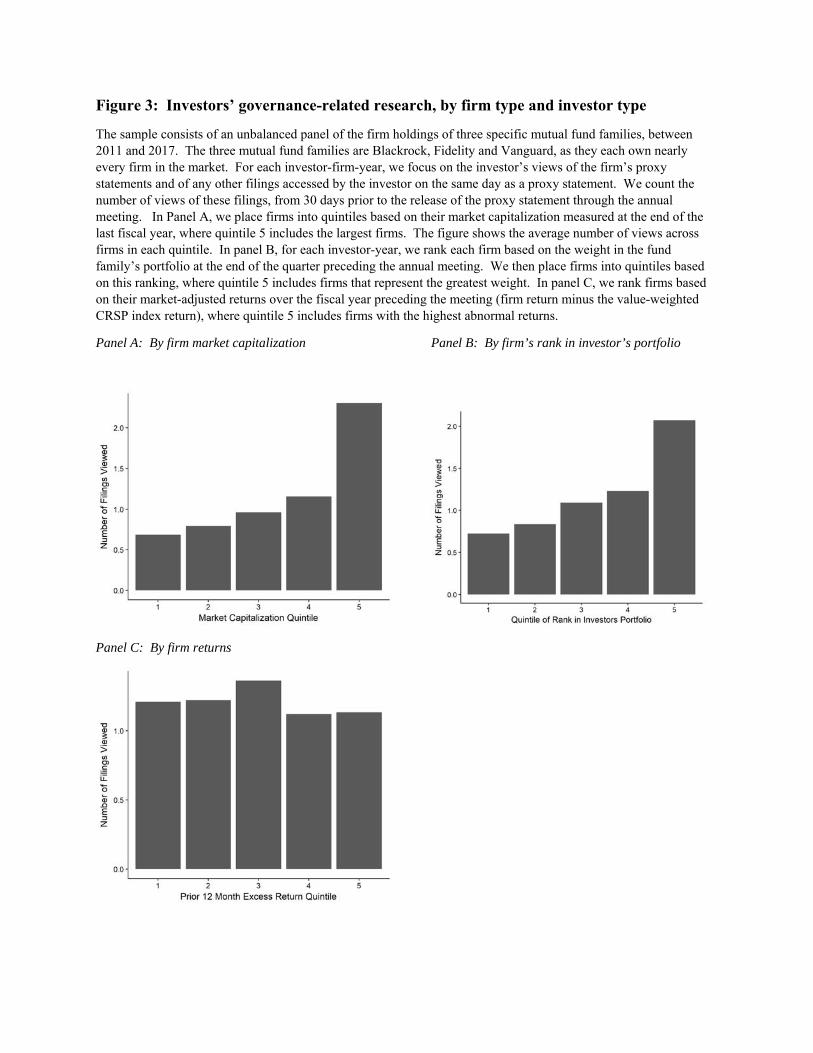
Figure 3: Investors’ governance-related research, by firm type and investor type
The sample consists of an unbalanced panel of the firm holdings of three specific mutual fund families, between 2011 and 2017. The three mutual fund families are Blackrock, Fidelity and Vanguard, as they each own nearly every firm in the market. For each investor-firm-year, we focus on the investor’s views of the firm’s proxy statements and of any other filings accessed by the investor on the same day as a proxy statement. We count the number of views of these filings, from 30 days prior to the release of the proxy statement through the annual meeting. In Panel A, we place firms into quintiles based on their market capitalization measured at the end of the last fiscal year, where quintile 5 includes the largest firms. The figure shows the average number of views across firms in each quintile. In panel B, for each investor-year, we rank each firm based on the weight in the fund family’s portfolio at the end of the quarter preceding the annual meeting. We then place firms into quintiles based on this ranking, where quintile 5 includes firms that represent the greatest weight. In panel C, we rank firms based on their market-adjusted returns over the fiscal year preceding the meeting (firm return minus the value-weighted CRSP index return), where quintile 5 includes firms with the highest abnormal returns.
Panel A: By firm market capitalization Panel B: By firm’s rank in investor’s portfolio
Panel C: By firm returns

Figure 4: Investors’ governance-related research and Voting
The sample consists of an unbalanced panel of firms held by 89 mutual fund families, between 2011 and 2017. For each investor-firm-year, we plot the percent of issues on which the fund family votes against management’s recommendation (in Panel A) or against ISS’ recommendation (in Panel B) averaged across all meetings, as a function of the number of filings viewed by the fund family before the meeting. Filings viewed include the firm’s proxy statements and of any other filings accessed by the investor on the same day as a proxy statement. We count the number of views of these filings, from 30 days prior to the release of the proxy statement through the annual meeting.
Panel A: Governance-related Research and Investor Disagreement with Management
Panel B: Governance-related Research and Investor Disagreement with ISS

Table 1: Descriptive statistics on mutual fund families’ governance-related research The sample consists of an unbalanced panel of 89 mutual fund families * firms owned by each fund, between 2011 and 2017, a total of 327,329 observations. The left-hand columns represent this full sample, and the right-hand columns limit the sample to the 33,732 investor-firm-years in which the investor accessed the firm’s current year proxy statement at least once. Within each of these samples, governance variables are only available for S&P 1500 firms, and thus the number of governance observations are smaller (220,546 in left-hand columns, and 23,988 in right-hand columns). Variable descriptions are provided in Appendix B.
Summary stats at for all observations
(327,329 obs)
Conditional on reading current meeting’s proxy
(23,988 obs)
Mean% Non-
Zero Median Std Dev Mean Median Std Dev
EDGAR Filings Views [Proxy Filing Date - 30, Meeting Date]
Current Proxy Views 0.18 10.3% 0 0.98 1.76 1 2.54
Current Proxy-related Views 0.49 10.3% 0 10.77 4.75 2 33.26
Proxy Views 0.34 12.7% 0 2.04 2.78 1 5.51
Proxy-related Views 0.81 12.7% 0 18.52 6.68 2 57.05
Total Filing Views 4.28 36.0% 0 30.99 17.80 5 89.66
Annual meeting Agenda Items ISS Recommend For (Meeting Avg) 0.92 1 0.16 0.91 1 0.17
Number of Shareholder Proposals 0.35 0 1.01 0.55 0 1.29
Number of Management Proposals 9.49 9 4.18 9.99 10 4.27
Firm financial characteristics Market Value of Equity ($ billion) 14.37 2.66 40.22 23.03 3.80 57.91
Market adj. returnt-1 0.06 0.02 0.45 0.06 0.02 0.40
Profitability 0.10 0.11 0.23 0.10 0.11 0.14
R&D / Assets 0.03 0.00 0.11 0.03 0.00 0.08
Book Leverage 0.22 0.20 0.47 0.22 0.20 0.18
Cash / Assets 0.58 0.11 0.78 0.54 0.11 3.53
Market to Book 4.37 2.36 7.53 4.37 2.35 10.25
Tangibility 0.23 0.13 0.65 0.22 0.12 0.24
Percent Institutional Ownership 0.59 0.59 0.19 0.59 0.59 0.20
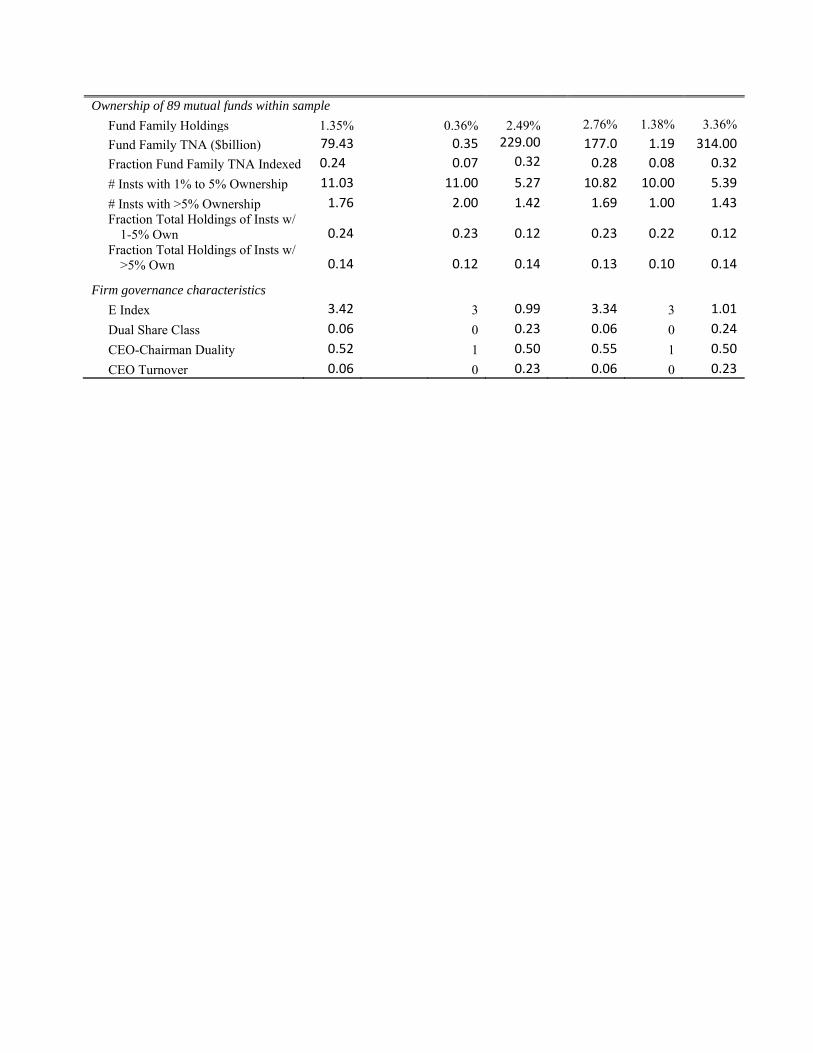
Ownership of 89 mutual funds within sample Fund Family Holdings 1.35% 0.36% 2.49% 2.76% 1.38% 3.36%
Fund Family TNA ($billion) 79.43 0.35 229.00 177.0 1.19 314.00
Fraction Fund Family TNA Indexed 0.24 0.07 0.32 0.28 0.08 0.32
# Insts with 1% to 5% Ownership 11.03 11.00 5.27 10.82 10.00 5.39
# Insts with >5% Ownership 1.76 2.00 1.42 1.69 1.00 1.43 Fraction Total Holdings of Insts w/
1-5% Own 0.24 0.23 0.12 0.23 0.22 0.12 Fraction Total Holdings of Insts w/
>5% Own 0.14 0.12 0.14 0.13 0.10 0.14
Firm governance characteristics E Index 3.42 3 0.99 3.34 3 1.01
Dual Share Class 0.06 0 0.23 0.06 0 0.24
CEO-Chairman Duality 0.52 1 0.50 0.55 1 0.50
CEO Turnover 0.06 0 0.23 0.06 0 0.23
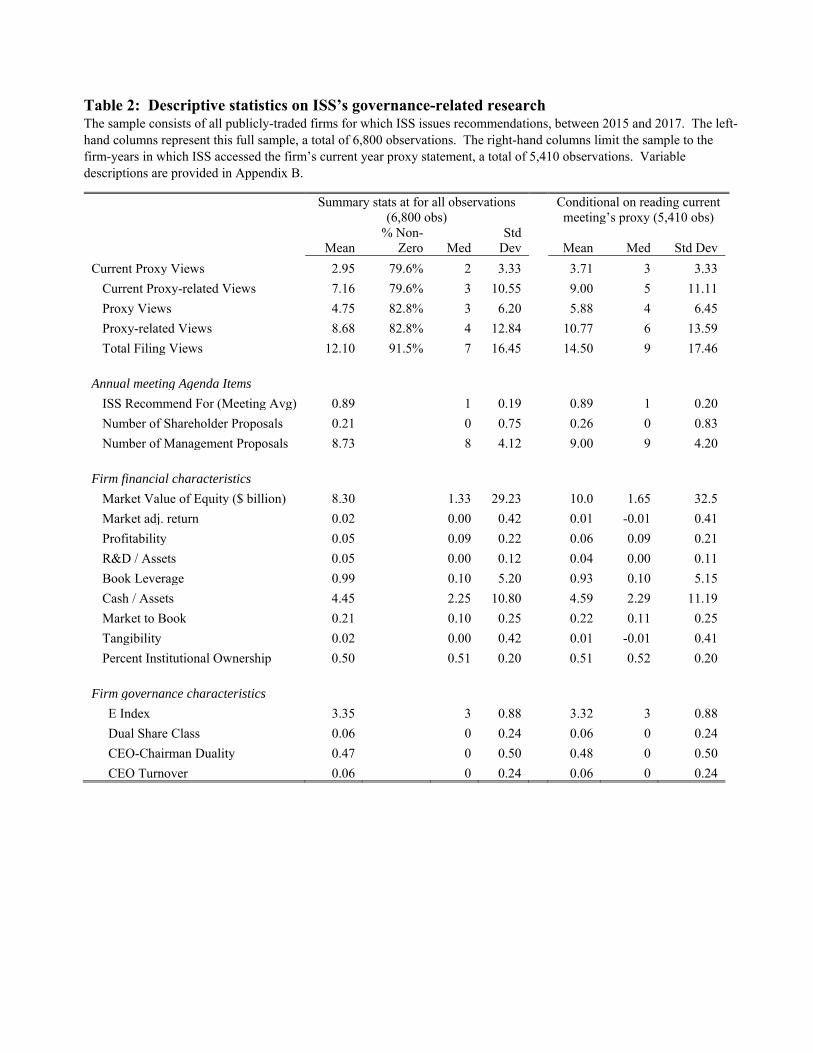
Table 2: Descriptive statistics on ISS’s governance-related research The sample consists of all publicly-traded firms for which ISS issues recommendations, between 2015 and 2017. The left-hand columns represent this full sample, a total of 6,800 observations. The right-hand columns limit the sample to the firm-years in which ISS accessed the firm’s current year proxy statement, a total of 5,410 observations. Variable descriptions are provided in Appendix B.
Summary stats at for all observations
(6,800 obs)Conditional on reading current meeting’s proxy (5,410 obs)
Mean% Non-
Zero MedStd
Dev Mean Med Std Dev
Current Proxy Views 2.95 79.6% 2 3.33 3.71 3 3.33
Current Proxy-related Views 7.16 79.6% 3 10.55 9.00 5 11.11
Proxy Views 4.75 82.8% 3 6.20 5.88 4 6.45
Proxy-related Views 8.68 82.8% 4 12.84 10.77 6 13.59
Total Filing Views 12.10 91.5% 7 16.45 14.50 9 17.46 Annual meeting Agenda Items
ISS Recommend For (Meeting Avg) 0.89 1 0.19 0.89 1 0.20
Number of Shareholder Proposals 0.21 0 0.75 0.26 0 0.83
Number of Management Proposals 8.73 8 4.12 9.00 9 4.20 Firm financial characteristics
Market Value of Equity ($ billion) 8.30 1.33 29.23 10.0 1.65 32.5
Market adj. return 0.02 0.00 0.42 0.01 -0.01 0.41
Profitability 0.05 0.09 0.22 0.06 0.09 0.21
R&D / Assets 0.05 0.00 0.12 0.04 0.00 0.11
Book Leverage 0.99 0.10 5.20 0.93 0.10 5.15
Cash / Assets 4.45 2.25 10.80 4.59 2.29 11.19
Market to Book 0.21 0.10 0.25 0.22 0.11 0.25
Tangibility 0.02 0.00 0.42 0.01 -0.01 0.41
Percent Institutional Ownership 0.50 0.51 0.20 0.51 0.52 0.20
Firm governance characteristics
E Index 3.35 3 0.88 3.32 3 0.88
Dual Share Class 0.06 0 0.24 0.06 0 0.24
CEO-Chairman Duality 0.47 0 0.50 0.48 0 0.50
CEO Turnover 0.06 0 0.24 0.06 0 0.24
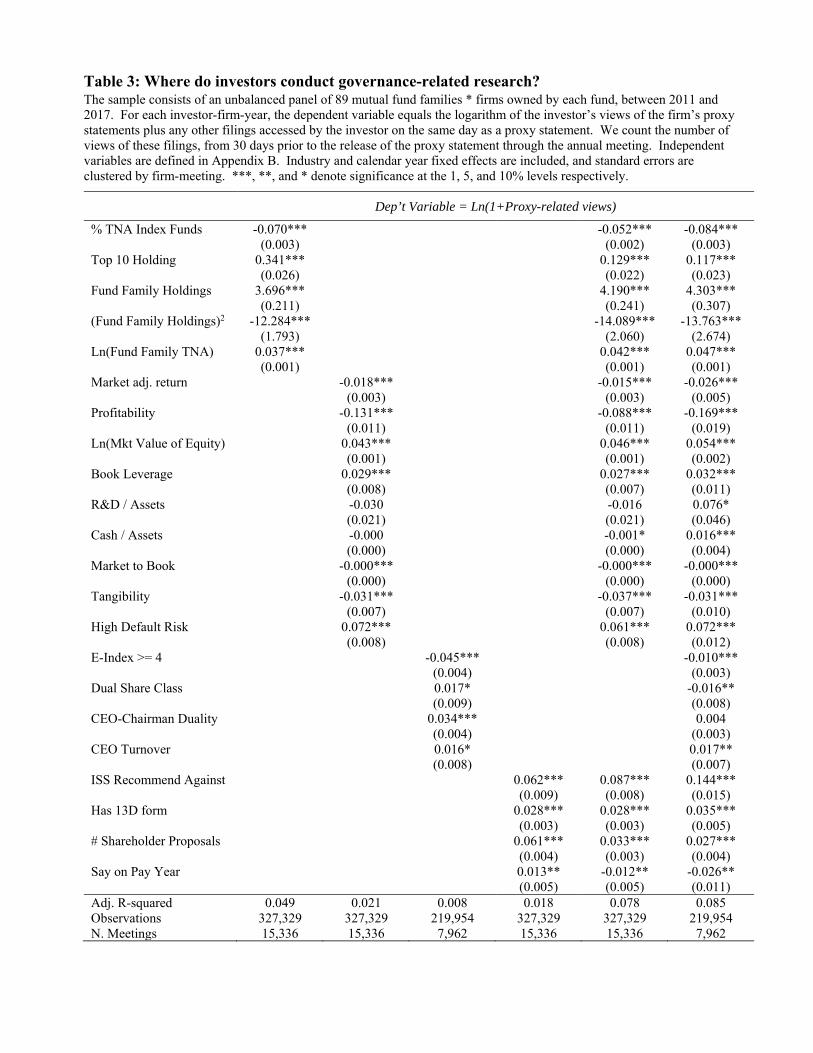
Table 3: Where do investors conduct governance-related research? The sample consists of an unbalanced panel of 89 mutual fund families * firms owned by each fund, between 2011 and 2017. For each investor-firm-year, the dependent variable equals the logarithm of the investor’s views of the firm’s proxy statements plus any other filings accessed by the investor on the same day as a proxy statement. We count the number of views of these filings, from 30 days prior to the release of the proxy statement through the annual meeting. Independent variables are defined in Appendix B. Industry and calendar year fixed effects are included, and standard errors are clustered by firm-meeting. ***, **, and * denote significance at the 1, 5, and 10% levels respectively.
Dep’t Variable = Ln(1+Proxy-related views)
% TNA Index Funds -0.070*** (0.003)
-0.052*** (0.002)
-0.084*** (0.003)
Top 10 Holding 0.341*** (0.026)
0.129*** (0.022)
0.117*** (0.023)
Fund Family Holdings 3.696*** (0.211)
4.190*** (0.241)
4.303*** (0.307)
(Fund Family Holdings)2 -12.284*** (1.793)
-14.089*** (2.060)
-13.763*** (2.674)
Ln(Fund Family TNA) 0.037*** (0.001)
0.042*** (0.001)
0.047*** (0.001)
Market adj. return
-0.018*** (0.003)
-0.015*** (0.003)
-0.026*** (0.005)
Profitability
-0.131*** (0.011)
-0.088*** (0.011)
-0.169*** (0.019)
Ln(Mkt Value of Equity)
0.043*** (0.001)
0.046*** (0.001)
0.054*** (0.002)
Book Leverage
0.029*** (0.008)
0.027*** (0.007)
0.032*** (0.011)
R&D / Assets
-0.030 (0.021)
-0.016 (0.021)
0.076* (0.046)
Cash / Assets
-0.000 (0.000)
-0.001* (0.000)
0.016*** (0.004)
Market to Book
-0.000*** (0.000)
-0.000*** (0.000)
-0.000*** (0.000)
Tangibility
-0.031*** (0.007)
-0.037*** (0.007)
-0.031*** (0.010)
High Default Risk
0.072*** (0.008)
0.061*** (0.008)
0.072*** (0.012)
E-Index >= 4
-0.045*** (0.004)
-0.010*** (0.003)
Dual Share Class
0.017* (0.009)
-0.016** (0.008)
CEO-Chairman Duality
0.034*** (0.004)
0.004 (0.003)
CEO Turnover
0.016* (0.008)
0.017** (0.007)
ISS Recommend Against
0.062*** (0.009)
0.087*** (0.008)
0.144*** (0.015)
Has 13D form
0.028*** (0.003)
0.028*** (0.003)
0.035*** (0.005)
# Shareholder Proposals
0.061*** (0.004)
0.033*** (0.003)
0.027*** (0.004)
Say on Pay Year
0.013** (0.005)
-0.012** (0.005)
-0.026** (0.011)
Adj. R-squared 0.049 0.021 0.008 0.018 0.078 0.085Observations 327,329 327,329 219,954 327,329 327,329 219,954N. Meetings 15,336 15,336 7,962 15,336 15,336 7,962

Table 4: Intensive vs Extensive margin, in research by investors and ISS The full sample, as used in column 1, consists of an unbalanced panel of 89 mutual fund families * firms owned by each fund, between 2011 and 2017. Column 1 focuses on the extensive margin, and the dependent variable equals one if the fund family conducted any research on the firm prior to the meeting. Column 2 focuses on the intensive margin, meaning the sample is limited to firm meetings for which the fund family conducted some research, and the dependent variable equals the logarithm of one plus the investor’s views of the firm’s proxy statements plus any other filings accessed by the investor on the same day as a proxy statement. Columns 3 and 4 are analogous, but focus on ISS’s research, using an unbalanced panel of all publicly traded firms for which ISS issues recommendations, between 2015 and 2017. The dependent variable in column 3 is a dummy for whether ISS conducted any research, and the dependent variable in column 4 is the logarithm of one plus ISS’s views of the firm’s proxy statements plus any other filings accessed by ISS on the same day as a proxy statement. In both cases, we count the number of views of these filings, from 30 days prior to the release of the proxy statement through the annual meeting. Independent variables are defined in Appendix B. Industry and calendar year fixed effects are included, and standard errors are clustered by firm-meeting. ***, **, and * denote significance at the 1, 5, and 10% levels respectively.
Proxy-related views by Investors Proxy-related views by ISS
Extensive Margin Intensive Margin Extensive Margin Intensive MarginFund / Institutional Ownership
% TNA Index Funds -0.038*** (0.002)
-0.386*** (0.018)
Top 10 Holding 0.038*** (0.011)
0.087** (0.037)
Fund Family Holdings 3.476*** (0.255)
-0.124 (0.324)
(Fund Family Holdings)2 -11.344*** (2.257)
1.769 (1.956)
Ln(Fund Family TNA) 0.029*** (0.001)
0.055*** (0.004)
# Institutional Investors 0.043** (0.020)
0.347*** (0.095)
Firm Performance Market adj. return -0.015***
(0.003)-0.049***
(0.017) -0.005
(0.020) -0.199***
(0.056)Profitability -0.082***
(0.010)-0.380***
(0.076) -0.159**
(0.062) -0.872***
(0.162)Ln(Mkt Value of Equity) 0.029***
(0.001)0.092*** (0.005)
0.024** (0.010)
0.075* (0.044)
Book Leverage 0.009 (0.006)
0.184*** (0.039)
0.051 (0.039)
0.390*** (0.107)
R&D / Assets 0.025 (0.025)
0.406*** (0.154)
0.242 (0.170)
0.560 (0.425)
Cash / Assets 0.009*** (0.002)
0.027* (0.015)
-0.040* (0.023)
-0.004 (0.049)
Market to Book -0.000** (0.000)
-0.001** (0.001)
0.000 (0.000)
-0.004*** (0.001)
Tangibility -0.013** (0.006)
-0.091** (0.039)
0.005 (0.037)
0.038 (0.105)
High Default Risk 0.026*** (0.007)
0.175*** (0.042)
0.053 (0.033)
0.325*** (0.103)
Firm Governance E-Index >= 4 -0.004**
(0.002)-0.027** (0.011)
-0.011 (0.012)
-0.039 (0.032)
Dual Share Class -0.008* (0.004)
-0.031 (0.027)
-0.010 (0.024)
0.025 (0.067)
CEO-Chairman Duality 0.005*** (0.002)
-0.022** (0.011)
-0.012 (0.011)
-0.009 (0.031)

CEO Turnover 0.007* (0.004)
0.056** (0.026)
0.011 (0.023)
0.092 (0.062)
Contentious Firm-Year ISS Recommend Against 0.081***
(0.007)0.213*** (0.043)
Has 13D form 0.017*** (0.002)
0.075*** (0.014)
0.026** (0.013)
0.167*** (0.041)
# Shareholder Proposals 0.013*** (0.001)
0.024*** (0.006)
0.004 (0.003)
0.136*** (0.018)
Say on Pay Year -0.007 (0.005)
-0.106*** (0.034)
-0.037* (0.022)
0.007 (0.062)
Adj. R-squared 0.094 0.089 0.057 0.285Observations 219,954 29,841 3,316 2,945N. Meetings 7,962 7,588 3,316 2,945

Table 5: The interaction between firm governance and funds’ ability to divest The sample consists of an unbalanced panel of 89 mutual fund families * firms owned by each fund, between 2011 and 2017. For each investor-firm-year, the dependent variable equals the logarithm of the investor’s views of the firm’s proxy statements plus any other filings accessed by the investor on the same day as a proxy statement. We count the number of views of these filings, from 30 days prior to the release of the proxy statement through the annual meeting. Independent variables are defined in Appendix B. Panel A splits the sample based on whether fraction of Assets Under Management (AUM) held by index funds is greater than 50 percent and estimates the same regression as Table 4, Column 2. Panel B expands on the analysis by interacting a dummy variable equal to one if the fraction of Assets Under Management held by index funds is greater than 50 percent with governance or portfolio characteristics. The full specification is the same as Table 4, Column 2 except uses an indicator for greater than 50 percent Assets Under Management instead of the continuous measure. Industry and calendar year fixed effects are included, and standard errors are clustered by firm-meeting. ***, **, and * denote significance at the 1, 5, and 10% levels respectively.
Panel A: Subsamples by Indexing intensity
Dep’t Variable = Ln(1+Proxy-related views)
< 50% AUM in
Index Funds >= 50% AUM in
Index Funds
Likelihood of effecting change
ISS Recommend Against 0.101*** (0.015)
0.305*** (0.027)
# Shareholder Proposals 0.023*** (0.003)
0.046*** (0.005)
Has 13D form 0.034*** (0.005)
0.041*** (0.008)
Management entrenchment
E-Index >= 4 -0.008** (0.003)
-0.020*** (0.005)
Dual Share Class -0.014* (0.008)
-0.025* (0.013)
Largest dollar positions
Top 10 Position Rank in Portfolio by Value
0.101*** (0.023)
0.224*** (0.061)
Controls Included Yes YesAdj. R-squared 0.073 0.144Observations 177,718 42,236N. Meetings 7,957 7,958

Panel B: Full sample with interaction terms
Dep’t Variable = Ln(1+Proxy-related views)
Interaction term = ISS Against Avg # SH Props 13D E-Index >= 4 Dual Class Top 10
High Indexer * Interaction 0.254*** (0.024)
0.018*** (0.003)
0.018** (0.007)
-0.005 (0.005)
0.020* (0.012)
0.140** (0.058)
High Indexer -0.060*** (0.003)
-0.054*** (0.003)
-0.049*** (0.003)
-0.044*** (0.004)
-0.047*** (0.003)
-0.047*** (0.003)
Interaction Term 0.091*** (0.015)
0.024*** (0.003)
0.032*** (0.005)
-0.009*** (0.003)
-0.020** (0.008)
0.100*** (0.023)
Controls Included Yes Yes Yes Yes Yes YesAdj. R-squared 0.085 0.084 0.084 0.084 0.084 0.084Observations 219,954 219,954 219,954 219,954 219,954 219,954N. Meetings 7,962 7,962 7,962 7,962 7,962 7,962

Table 6: Effects of monitoring by other investors The full sample, as used in columns 1 and 2, consists of an unbalanced panel of 89 mutual fund families * firms owned by each family, between 2011 and 2017. The sample in columns 3 and 4 is restricted to the largest five mutual fund families in our sample: Blackrock, Vanguard, Fidelity, State Street, and T. Rowe Price. The sample in columns 5 and 6 includes all mutual fund families except these largest five. For each investor-firm-year, the dependent variable equals the natural logarithm of one plus the investor’s views of the firm’s proxy statements and any other filings accessed by the investor on the same day as a proxy. We count the number of views of these filings, from 30 days prior to the release of the proxy statement through the annual meeting. Actual research by other investors represents the number of proxy-related filings accessed by other mutual fund families for the same firm meeting. In columns 1, 3 and 5, ‘E[Investor research by other investors]’ is calculated as ∑ , ∗ , , where holdings are measured for the specific firm and research is measured as the average across all firms held by other investors in the prior year. In columns 2, 4, and 6, E[research] by LARGE [SMALL] other investors is defined analogously, but where mutual fund family owns greater than (less than) 0.3 percent of the firm, which is approximately the median position size for this sample. All other independent variables are defined in Appendix B. Investor, industry, and calendar year fixed effects are included, and standard errors are clustered by firm meeting. ***, **, and * denote significance at the 1, 5, and 10% levels respectively.
Dep’t Variable = Ln(1+Proxy-related views)
All Investors Top 5 Investors Non – Top 5 Investors
E[research] by ALL other investors -0.004*** (0.001)
-0.002 (0.005)
-0.008***(0.001)
E[research] by LARGE other investors -0.004*** (0.001)
-0.001 (0.005)
-0.009***(0.001)
E[research] by SMALL other investors 0.000 (0.001)
0.004 (0.004)
-0.001 (0.001)
Actual research by other investors 0.011*** (0.000)
0.011*** (0.000)
0.028*** (0.001)
0.028*** (0.001)
0.008***(0.000)
0.008***(0.000)
Controls Included Yes Yes Yes Yes Yes YesAdj. R-squared 0.252 0.252 0.232 0.232 0.258 0.258Observations 193,497 193,497 33,113 33,113 160,384 160,384N. Meetings 6,825 6,825 6,819 6,819 6,825 6,825

Table 7: Cross-sectional variation in effects of monitoring by other investors The sample consists of an unbalanced panel of 89 mutual fund families * firms owned by each family, between 2011 and 2017. For each investor-firm-year, the dependent variable equals the natural logarithm of one plus the investor’s views of the firm’s proxy statements and any other filings accessed by the investor on the same day as a proxy. We count the number of views of these filings, from 30 days prior to the release of the proxy statement through the annual meeting. Actual research by other investors represents the number of proxy-related filings accessed by other mutual fund families for the same firm meeting. ‘E[Investor research by other institutions]’ is calculated as ∑ , ∗
, , where holdings are measured for the specific firm and research is measured as the average across all firms held by other institutions in the prior year. These measures are interacted with a dummy indicating whether the firm represents one of that investor’s Top 10 positions (in dollar value). Regressions include all other controls employed in Table 6, which are not tabulated. Investor, industry and calendar year fixed effects are also included, and standard errors are clustered by firm meeting. ***, **, and * denote significance at the 1, 5, and 10% levels respectively.
Dep’t Variable = Ln(1+Proxy-related views)
Actual research by other investors 0.011***
(0.000) 0.011***
(0.000) E[research] by other investors -0.004***
(0.001) -0.004***
(0.001) Actual research by other investors * Top 10
Holding 0.002**
(0.001)
E[research] by other investors * Top 10 Holding -0.065*** (0.019)
Top 10 Holding 0.019 (0.022)
0.071*** (.018)
Controls Included Yes Yes R-squared 0.253 0.253 Adj. R-squared 0.252 0.252 Observations 193,497 193,497 N. Meetings 6,825 6,825

Table 8: Relation between investors’ governance-related research and voting
The sample consists of an unbalanced panel of 89 mutual fund families * firms owned by each fund, between 2011 and 2017, with the additional restriction that there be at least one close vote on the meeting agenda. Close votes are defined as an agenda items up for vote that receive between 40% and 60% support for the managements’ recommendation. For each investor-firm-year, the dependent variable equals the percent of funds within the mutual fund family that voted against the ISS recommendation, on these “close” votes. For each mutual fund family, we count the number of views of filings, from 30 days prior to the release of the proxy statement through the annual meeting. Proxy-related views include the investor’s access of the firm’s proxy statements plus any other filings requested on the same day as a proxy statement. Proxy views include only views of the firm’s proxy statements. All other independent variables are defined in Appendix B. Industry and calendar year fixed effects are included, and standard errors are clustered at the meeting level. ***, **, and * denote significance at the 1, 5, and 10% levels respectively.
Dep’t Variable = Vote against ISS
Ln(1 + Proxy-related views) 0.015***
(0.004)
Ln(1 + Proxy views) 0.023*** (0.005)
Fund Family Holdings 4.824*** (0.237)
4.782*** (0.237)
(Fund Family Holdings)2 -20.008*** (1.840)
-19.875*** (1.834)
Top 10 Position Rank in Portfolio by Value 0.030** (0.015)
0.030** (0.015)
Ln(Fund Family Assets Under Mgmt) 0.024*** (0.001)
0.024*** (0.001)
Previous fiscal year market adj. return -0.008 (0.009)
-0.008 (0.009)
Profitability -0.007 (0.041)
-0.006 (0.041)
Log Market Value of Equity 0.012*** (0.003)
0.012*** (0.003)
Book Leverage -0.117*** (0.025)
-0.117*** (0.025)
R&D -0.136* (0.072)
-0.136* (0.072)
Cash to Assets -0.000 (0.001)
-0.000 (0.001)
Market to Book -0.000 (0.001)
-0.000 (0.001)
Tangibility 0.029 (0.030)
0.029 (0.030)
High Distance to Default 0.072** (0.028)
0.072** (0.028)
Has 13D form -0.023*** (0.009)
-0.023*** (0.009)
# Shareholder Proposals -0.005 (0.003)
-0.005 (0.003)
Say on Pay Year 0.060*** (0.016)
0.060*** (0.016)
R-squared 0.061 0.061Observations 35,665 35,665N. Meetings 1,347 1,347

Table 9: Relation between investors’ governance-related research and changes in holdings
The sample consists of an unbalanced panel of 89 mutual fund families * firms owned by each fund, between 2011 and 2015. For each investor-firm-year, the dependent variable equals the absolute value of the investor’s change in holdings, from the quarter immediately preceding the annual meeting to the first calendar quarter following the meeting. We count the number of views of these filings, from 30 days prior to the release of the proxy statement through the annual meeting. Proxy-related views include the investor’s views of the firm’s proxy statements plus any other filings accessed by the investor on the same day as a proxy statement. Proxy views include only views of the firm’s proxy statements, and non-proxy-related views include views of all filings other than proxy statements on days on which they do not view a proxy statement. All other independent variables are defined in Appendix B. Investor fixed effects are included, and standard errors are clustered by investor. ***, **, and * denote significance at the 1, 5, and 10% levels respectively.
Dep’t Variable = Change in Holdings
Ln(1 + Proxy Related Reads) 0.093*** (0.016)
Ln(1 + Proxy Reads) 0.140*** (0.024)
0.111*** (0.022)
Ln(1 + Non-Proxy Related Reads) 0.051*** (0.007)
Previous fiscal year market adj. return 0.011 (0.009)
0.011 (0.009)
0.012 (0.009)
Profitability 0.067** (0.033)
0.068** (0.033)
0.074** (0.033)
Log Market Value of Equity -0.002 (0.008)
-0.003 (0.008)
-0.009 (0.008)
Book Leverage -0.004 (0.015)
-0.003 (0.015)
-0.015 (0.016)
R&D 0.161*** (0.061)
0.163*** (0.061)
0.164*** (0.061)
Cash to Assets 0.003** (0.001)
0.003** (0.001)
0.003** (0.001)
Market to Book 0.000* (0.000)
0.000* (0.000)
0.000* (0.000)
Tangibility 0.021** (0.010)
0.021** (0.010)
0.023** (0.010)
High Distance to Default 0.039*** (0.013)
0.039*** (0.013)
0.030** (0.012)
Percent Institutional Ownership 0.433*** (0.055)
0.433*** (0.055)
0.427*** (0.055)
Log Fund Family Assets Under Management
0.007 (0.005)
0.007 (0.005)
0.007 (0.005)
ISS Recommend For (Meeting Average) 0.037 (0.023)
0.039* (0.023)
0.039* (0.023)
Contested Meeting 0.160 (0.108)
0.141 (0.106)
0.159 (0.106)
Has 13D form -0.015** (0.006)
-0.015** (0.006)
-0.018*** (0.007)
Number of Shareholder Proposals -0.012*** (0.005)
-0.013*** (0.005)
-0.014*** (0.005)
Say on Pay Year -0.002 (0.014)
-0.002 (0.014)
-0.000 (0.014)
Adj. R-squared 0.009 0.009 0.010 Observations 448,060 448,060 448,060

Online Appendix to “Investors’ Attention to Corporate Governance”
Figure A1: Total governance-related research of two mutual fund families
The sample in Panel A consists of event-time governance-related filings viewed Vanguard mutual fund family for firms in their portfolio, between 2011 and 2017. For each firm-year, we focus on Vanguard’s views of the firm’s proxy statements and of any other filings accessed by Vanguard on the same day as a proxy statement. We count the number of views of these filings, from 30 days prior to the release of the proxy statement through the annual meeting. In the figure, the day of each company’s annual meeting represents day 0, and days -90 through -1 represent calendar days relative to this date. Panel B is similar to Panel A, but represents views by the Fidelity mutual fund family.
Panel A: The Vanguard Group mutual fund family
Panel B: The Fidelity Investments mutual fund family

Figure A2: Governance-related research by mutual fund families in publicly traded firms
The sample in Panel A consists of an unbalanced panel of firms held by 89 mutual fund families, between 2011 and 2017. For each investor-firm-year, we focus on the investor’s views of the firm’s proxy statements and of any other filings accessed by the investor on the same day as a proxy statement. In Panel B, the sample consists of all publicly traded firms for which ISS provided recommendations, between 2015 and 2017. For each firm-year, we measure ISS’s views of the firm’s proxy statements and of any other filings accessed by ISS on the same day as a proxy statement. We count the number of views of these filings, from 30 days prior to the release of the proxy statement through the annual meeting, and the figures show the day of the week of the views.
Panel A: Investors’ governance-related views by day of the week
Panel B: ISS’s governance-related views by day of the week

Figure A3: ISS’s governance-related research by firm type.
The sample consists of an unbalanced panel of publicly-traded firms for which ISS issues recommendations, in 2015 and 2016. For each firm-year, we focus on ISSs views of the firm’s proxy statements and of any other filings accessed by ISS on the same day as a proxy statement. We count the number of views of these filings, from 30 days prior to the release of the proxy statement through the annual meeting. In Panel A, we place firms into quintiles based on their market capitalization measured at the end of the last fiscal year, where quintile 5 includes the largest firms. The figure shows the average number of views across firms in each quintile. In panel B, we rank firms into quintiles based on total institutional ownership at the end of the quarter prior to the annual meeting. In Panel C, we rank firms into quintiles based on the number of institutional investors, measured at this same point in time. In Panel D, we rank firms based on their market-adjusted returns over the fiscal year preceding the meeting (firm return minus the value-weighted CRSP index return), where quintile 5 includes firms with the highest abnormal returns.
Panel A: By firm market capitalization Panel B: By institutional ownership
Panel C: By number of institutional investors Panel D: By firm return


![IGOR MALENKO LORI HANDRAHAN LEVY, J. from a … documents... · [¶2] Lori Handrahan and Igor Malenko met in May 2005 in Macedonia, Malenko’s birthplace, and continued their relationship](https://img.pdfslide.us/doc/110x75/5b6776e37f8b9ab0128b4734/igor-malenko-lori-handrahan-levy-j-from-a-documents-2-lori-handrahan.jpg)