Embed Size (px)
Citation preview

NOVEMBER 2019
INVESTORS
PRESENTATION

LEGAL DISCLAIMER
1
The presentation is dated the day it is given. The delivery of this presentationshall not, under any circumstances, create any implication that there has been nochange in the affairs of the Company since such date. The third party informationand statistical data in this presentation have been obtained from sources theCompany believes to be reliable but in no way are warranted by the Company asto accuracy or completeness. This presentation may not contain all materialinformation concerning the Company and the information set forth in this materialis subject to change without notice.
These materials included herein that are not historical facts are forward-lookingstatements. Such forward looking statements involve a number of risks anduncertainties and are subject to change at any time. In the event such risks oruncertainties materialise, AAV’s results could be materially affected. The risks anduncertainties include, but are not limited to, risks associated with the inherentuncertainty of airline travel, seasonality issues, volatile jet fuel prices, worldterrorism, perceived safe destination for travel, Government regulation changes andapproval, including but not limited to the expected landing rights into newdestinations.
This presentation is strictly not to be distributed without the explicit consent ofCompany’s management under any circumstances.
1.2 1.83.0 3.6 4.2 5.0 5.7 6.9 8.3 10.5 12.2
14.817.2
19.8 21.6 22.5
69
1215 16
20 1922
27
3540
45
5156
62 62
2004 2005 2006 2007 2008 2009 2010 2011 2012 2013 2014 2015 2016 2017 2018 2019E
(AIRCRAFT)
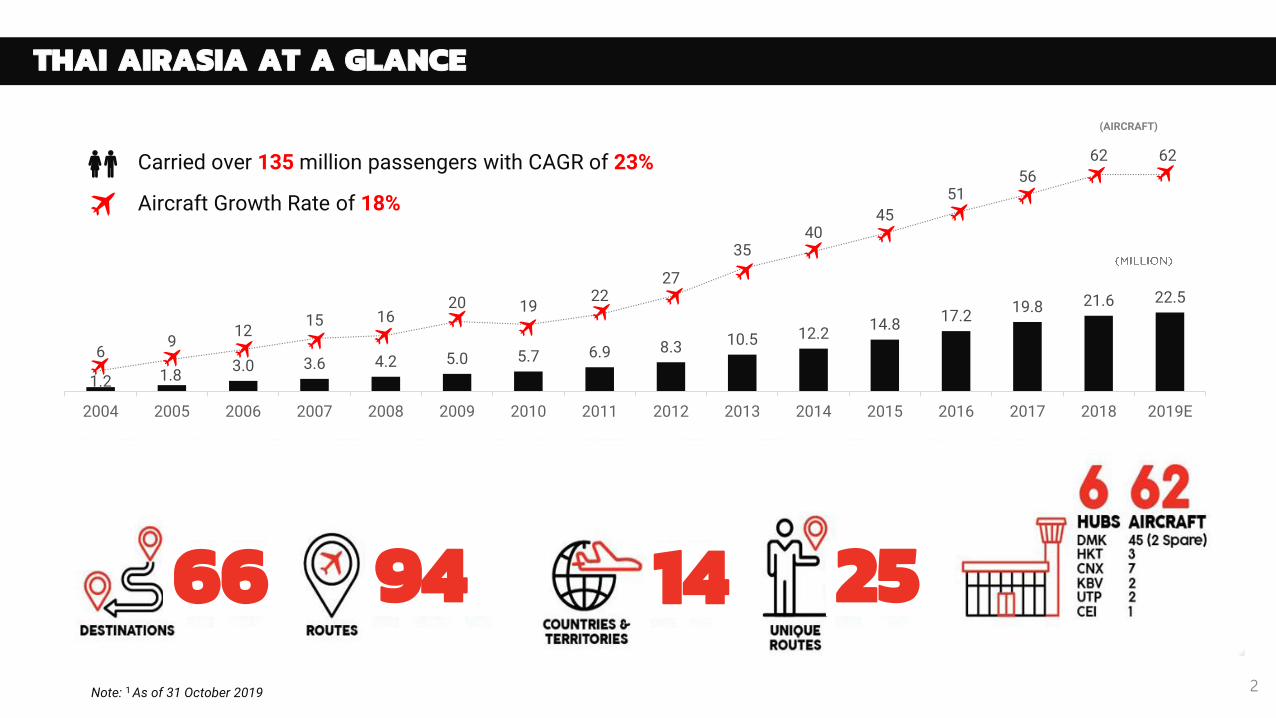
Aircraft Growth Rate of 18%
THAI AIRASIA AT A GLANCE
Note: 1 As of 31 October 2019 2
66 94
Carried over 135 million passengers with CAGR of 23%
2514
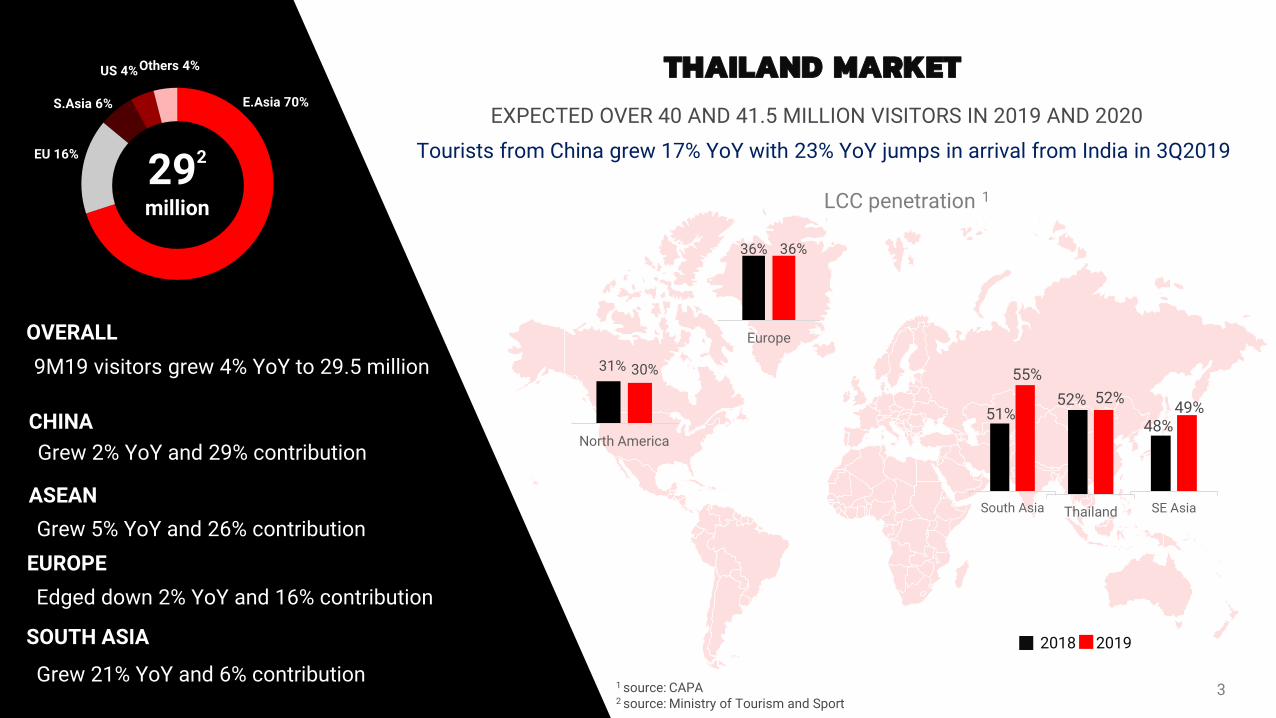
THAILAND MARKET
3
31% 30%
North America
36% 36%
Europe
51%
55%
South Asia
48%49%
SE Asia
LCC penetration 1
52% 52%
Thailand
2018 2019
CHINA
Grew 2% YoY and 29% contribution
ASEAN
Grew 5% YoY and 26% contribution
EUROPE
Edged down 2% YoY and 16% contribution
SOUTH ASIA
OVERALL
9M19 visitors grew 4% YoY to 29.5 million
E.Asia 70%
EU 16%
S.Asia 6%
US 4%Others 4%
292
million
Tourists from China grew 17% YoY with 23% YoY jumps in arrival from India in 3Q2019
Grew 21% YoY and 6% contribution
EXPECTED OVER 40 AND 41.5 MILLION VISITORS IN 2019 AND 2020
1 source: CAPA 2 source: Ministry of Tourism and Sport

ANCILLARY PERFORMANCE
ON TRACK TO ACHIEVE 2019 BT 343 PER PAX (+4%YoY)
9M19 achieved 5.7bn (+8%YoY) or Bt 339 per pax (+4%YoY) 4
5,2
37
5,6
77
FLY-THRU
• 9M19 up by 55% from additional flights among AOCs, reflected in a 59% growth in traffics
• No. Fly-Thru accounted for 6% of total pax
CHECKED BAGGAGE
• 9M19 inched up by 2% YoY, relating to an expansion in international route
IN-FLIGHT SERVICES
• Continue promoting pre-book In-flight combo set• Enhance house-brand on F&B and merchandise
SEAT SELECTION
• 9M19 up by 24% YoY, relating to an expansion in international route and dynamic pricing
• Persuasive advertising influences demand on value
pack and seat selection
OTHERS (Cargo, Tune, Fees)
• Freight revenues was 4% of ancillaries• Fee structure adjustment; processing fee• Upsell on Fly-Thru lounge access
19%
Revenues 50%
8%
8%
6%
28%
9M18 9M19
+8%YoY
Percent contribution to total ancillary revenue
Un
it :
Mill
ion

5
MARKET SHARE1 BY PAX FLOWN65%
12
23
33.2%
18.0% 16.7%
9.4%7.1%
9.9%5.7%
32.4%
18.1% 18.1%
9.3%7.3%
9.7%
4.9%
9M2019 FY2018
Note: 1 9M2019 compared to FY2018 (Source: AAV, AOT and Department of Airport)2 Capacity share as of FY2019 (source : OAG)3 As of October 31 2019
DOMESTIC MARKET
Regional Capacity2
Unique Routes3
Cities
AirAsia Nok Lion Smile Thai Bangkok Vietjet
21Transfer Routes
6
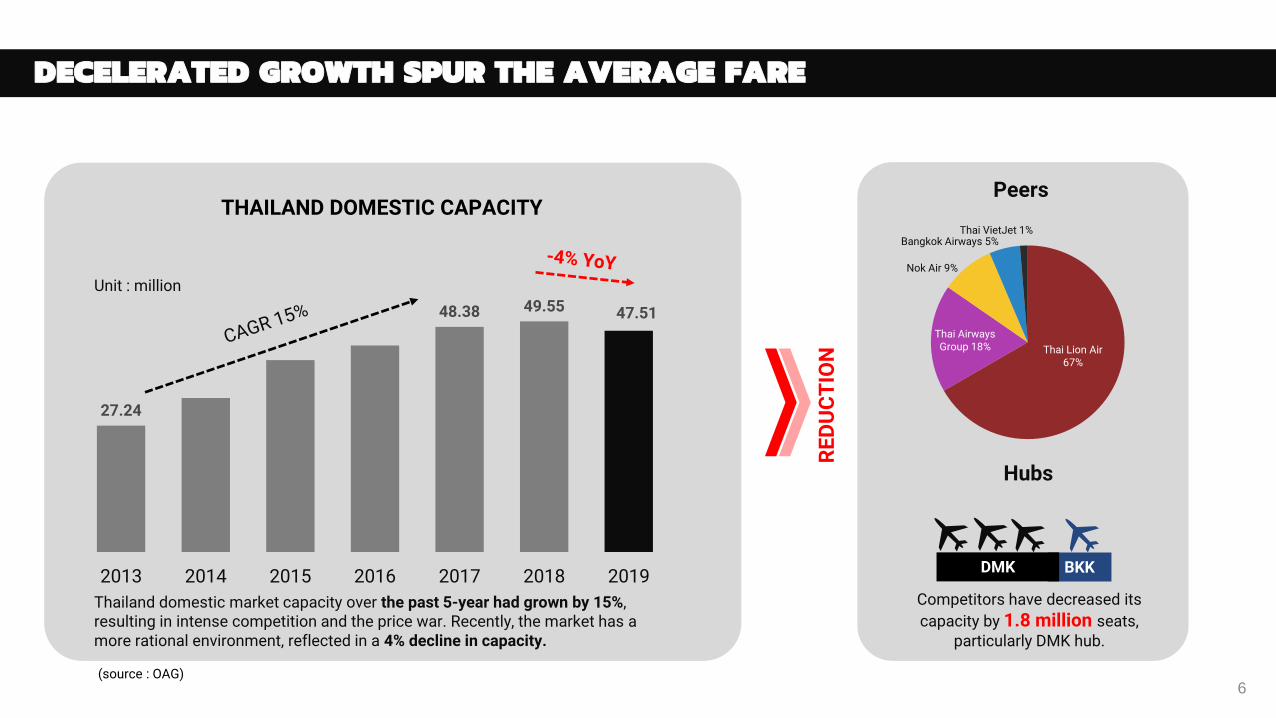
27.24
48.38 49.55 47.51
2013 2014 2015 2016 2017 2018 2019
THAILAND DOMESTIC CAPACITY
(source : OAG)
Peers
Unit : million
Thai Lion Air67%
Thai Airways Group 18%
Nok Air 9%
Bangkok Airways 5%Thai VietJet 1%
Hubs
RE
DU
CT
ION
Competitors have decreased its
capacity by 1.8 million seats, particularly DMK hub.
Thailand domestic market capacity over the past 5-year had grown by 15%,resulting in intense competition and the price war. Recently, the market has a more rational environment, reflected in a 4% decline in capacity.
BKKDMK
DECELERATED GROWTH SPUR THE AVERAGE FARE

7
16.7 18.1
6.24.4
AAV THAI NOK BA
83 8087
68
AAV THAI NOK BA
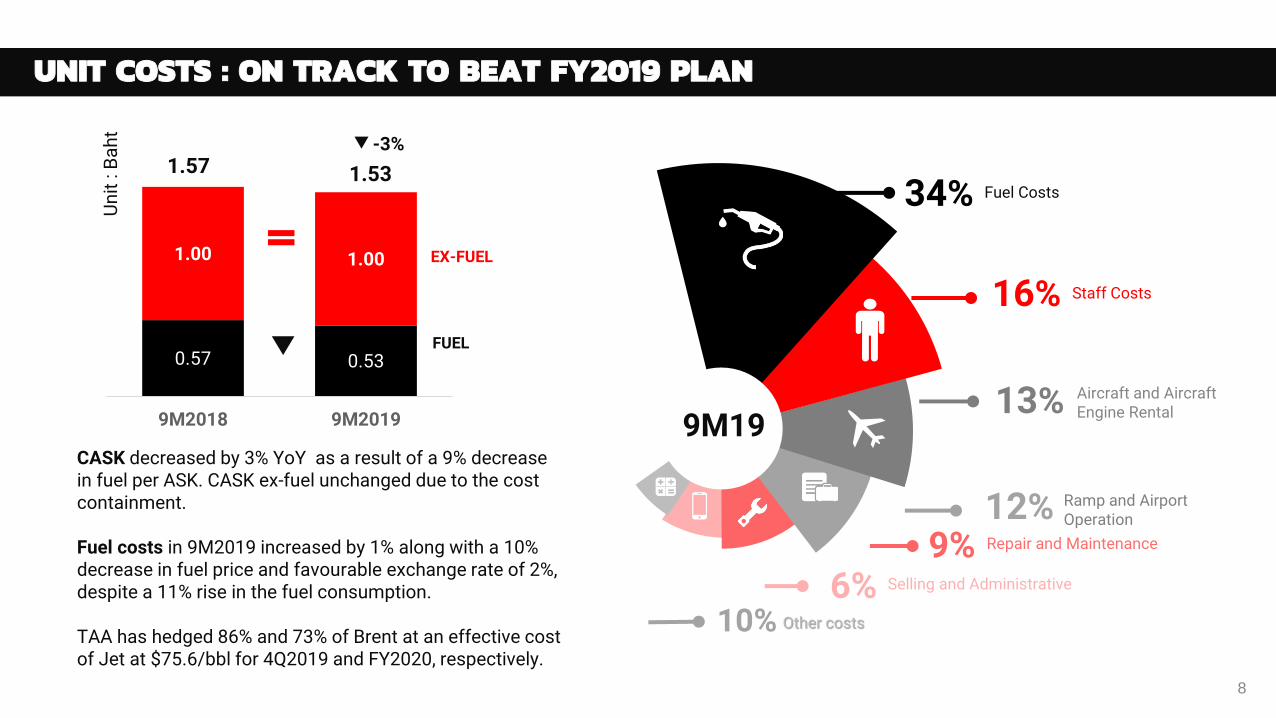
1.53
2.20 2.17
3.52
AAV THAI NOK BA
17
1210
13
AAV THAI NOK BA
Percent
HIGHEST PAX GROWTH LOWEST CASK*
HIGHEST EBITDAR MARGIN1
BahtMillion passengers
+5% -3% -8% +2% YoY * Cost excluded finance costs and tax expense
HIGHEST ASK GROWTHPercent
Source: 1 SET filing, Company data, AAV estimates based on 9M2019 Results ( NOK excluding Nokscoot)EBITDAR Margin: Earning before finance cost, income tax, depreciation and amortisation, rental / Totalsales and service
ASK Growth +10% -3% -10% -2% YoY
LISTED-AIRLINE PERFORMANCE
8
CASK decreased by 3% YoY as a result of a 9% decrease in fuel per ASK. CASK ex-fuel unchanged due to the cost containment.
Fuel costs in 9M2019 increased by 1% along with a 10% decrease in fuel price and favourable exchange rate of 2%, despite a 11% rise in the fuel consumption.
TAA has hedged 86% and 73% of Brent at an effective cost of Jet at $75.6/bbl for 4Q2019 and FY2020, respectively.
34% Fuel Costs
16% Staff Costs
13% Aircraft and Aircraft Engine Rental
9% Repair and Maintenance
12% Ramp and Airport Operation
6% Selling and Administrative
10% Other costs
9M19
UNIT COSTS : ON TRACK TO BEAT FY2019 PLAN
0.57 0.53
1.00 1.00
9M2018 9M2019
1.57 1.53
Un
it :
Ba
ht
-3%
FUEL
EX-FUEL

9
NETWORK REALLOCATION TO MAXIMISE OPERATIONAL RETURNS
* JUL 2019 – OCT 2019** WINTER SEASON*** DEC 2019 – JAN 2020
CNX – DanangDMK – Nha TrangDMK – Can ThoCEI – ShenzhenCNX – ShenzhenDMK – AhmedabadHKT – Phnom Penh
DMK – Narathiwat(7x > 11x)*
DMK – Jaipur (4x > 7x)**DMK – Nan(28x > 31x)***
DMK – Sihanoukville
DMK – VaranasiCEI – Hangzhou
ADD FREQUENCIES: NEW ROUTES:
2Q
/20
19
3Q
/20
19
4Q
/20
19
DMK – Roi EtDMK – Khon KeanDMK – ShenzhenCNX – Taipei (6x > 7x)

10
GROWTH STRATEGIES
Efficient Operation Digital Transform
• AVA• FACES
• Invest in pilot training academy and flight simulator center
• Aim to reduce cost >100 MB
Training Academy
• Green flight operation• Flight plan efficiency
Growth in ancillary to revenue each year, expected to see 25% in next 5 yrs
+1%
+10%Growth in cargo revenue each year, cooperate with TeleportDOMESTIC,
45%
CHINA, 20%
CLMV, 15%
ASEAN ex CLMV, 10%
SOUTH ASIA, 10%
+2% Growth in Fly-Thru passengerseach year
Revenues by routes in 5-year
DiversifyNetwork
CostReduction
Revenue Growth
11
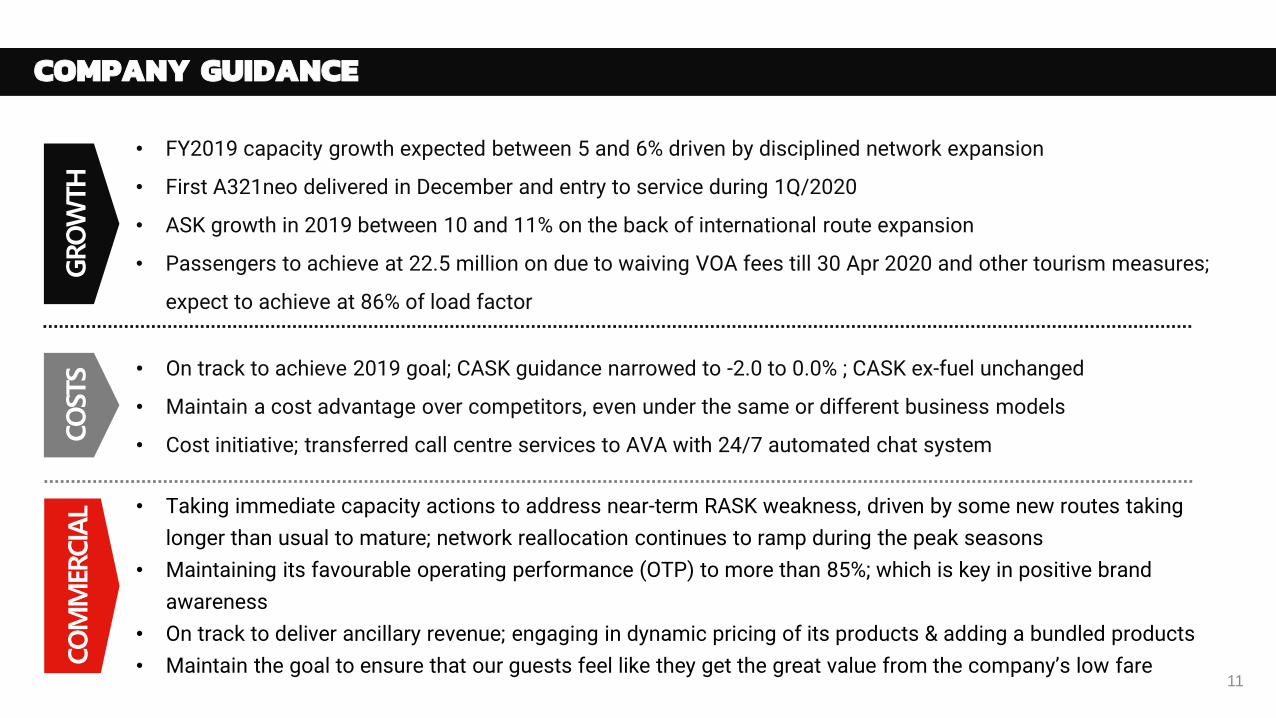
GROWTH
COSTS
COMMERCIAL
• FY2019 capacity growth expected between 5 and 6% driven by disciplined network expansion
• First A321neo delivered in December and entry to service during 1Q/2020
• ASK growth in 2019 between 10 and 11% on the back of international route expansion
• Passengers to achieve at 22.5 million on due to waiving VOA fees till 30 Apr 2020 and other tourism measures;
expect to achieve at 86% of load factor
• On track to achieve 2019 goal; CASK guidance narrowed to -2.0 to 0.0% ; CASK ex-fuel unchanged
• Maintain a cost advantage over competitors, even under the same or different business models
• Cost initiative; transferred call centre services to AVA with 24/7 automated chat system
• Taking immediate capacity actions to address near-term RASK weakness, driven by some new routes taking
longer than usual to mature; network reallocation continues to ramp during the peak seasons
• Maintaining its favourable operating performance (OTP) to more than 85%; which is key in positive brand
awareness
• On track to deliver ancillary revenue; engaging in dynamic pricing of its products & adding a bundled products
• Maintain the goal to ensure that our guests feel like they get the great value from the company’s low fare
COMPANY GUIDANCE

RELEVANT MATERIALS
https://www.aavplc.com/en/investor-relations/home
DOCUMENT LOCATION
Investor Presentation
https://www.aavplc.com/en/investor-relations/downloads/presentations-webcasts
EarningReleases
https://www.aavplc.com/en/investor-relations/updates/news
Annual Reports
https://www.aavplc.com/en/investor-relations/downloads/annual-report
Investor Kits
https://www.aavplc.com/en/investor-relations/publications-and-download/investor-kits
Operating Statistic
https://www.aavplc.com/en/investor-relations/operating-statistics
SustainabilityReport
https://www.aavplc.com/en/investor-relations/downloads/sustainability-report
Don Mueang International Airport, 3rd Fl., Central Office Building, No.3200,Vibhavadi Rangsit Road, Sanambin, Don Mueang, Bangkok 10210
www.aavplc.com [email protected] +662 5625745-6

SHAREHOLDING STRUCTURE:
13
AirAsia Group Berhad
Management & BOD
Thai AirAsia(Operating company)
Public
100%
45%
59%
55%
AirAsia Investment
Asia Aviation(Listed company)
41%
KEY MILESTONES:
Launched second hub in Phuket
2017
2017Marketing Excellence Award, TMA
Outstanding IR Award, SET
2015
2014The World Best LCC’s
OTP Flightstats
Launched Fourth hub in Krabi 2013Launched Third hub in Chiang Mai
2012AAV was listed in the SET & increase its
shareholding in TAA to 55%
Moved back to Don Mueang Airport
Owned first aircraft in our book
2010Comprised of single aircraft type the Airbus A32020092007
Moved to Suvarnabhumi Airport
Received first delivery Airbus A320
AAV was incorporated and acquired 50% of shares in TAA
2004Began services from Bangkok to Phuket, Hat Yai, Chiang Mai and Singapore with two Boeing aircraft
2016Received the first delivery
of A320neo
2018
First Thai LCC to receive AOC Re-Certification
2006
The best of Airline from the best of Thailand awards voted by Chinese tourists
Launched Fifth hub in Utapao
OUR VISION:To be the leading sustainable travel technology company in Asia providing more than just affordable flights
OUR MISSION:1. To provide the highest quality product, embracing
technology to reduce cost and enhance service2. To create jobs across the region and be the best
company to work for where dreams come true3. To care for all our stakeholders, from Allstars, guests,
business partners, investors to communities and governments
4. To create a globally recognised, sustainable ASEAN brand focused on adding value to the economy, society and environment
(as of June 2019)
BUSINESS OVERVIEW

TFRS 16 IMPACT TO LEASED ASSET
Adoption of TFRS 16 by using the Modified Approach method whereby the leases were computed based on the present value of all its future payments based on the company's borrowing rate with the impact taken to opening retained earnings.
The chart depicts that combined depreciation and interest will be less than the operating lease amounts.
1 2 3 4 5 6 7 8 9 10
Depreciation Interest Operating lease
For a new aircraft, combined depreciation and interest will be more than the operating lease amounts during the earlier portion of the lease terms before the adoption of TFRS 16.
2019 2020 2021 2022 2023 2024 2025 2026 2027 2028 2029 2030
Depreciation Interest Operating lease
14

TAA : KEY STATISTICS
3Q2019 3Q2018 Change 9M2019 9M2018 Change
Passenger carried (Million seats) 5.28 5.12 3% 16.73 16.07 4%
International passenger 2.23 1.97 13% 6.90 6.03 14%
Domestic passenger 3.05 3.15 -3% 9.82 10.04 -2%
Capacity (Million seats) 6.55 6.34 3% 19.81 18.84 5%
Load factor 81% 81% 0 ppt 84% 85% -1 ppt
RPK (Million) 5,444 4,979 9% 17,237 15,791 9%
ASK (Million) 6,766 6,167 10% 20,542 18,559 11%
No. of stages flown 36,253 35,105 3% 109,678 104,382 5%
Average stage length (km) 1,034 972 6% 1,037 985 5%
Fleet size (Aircraft) 62 60 +2 62 60 +2
Aircraft utilisation (Hours/day) 12.2 11.7 +0.5 12.4 12.0 +0.4
On time performance 88% 89% -1 ppt 86% 85% +1 ppt
Average fare (Baht) 1,457 1,418 +3% 1,469 1,499 -2%
RASK (Baht) 1.39 1.45 -4% 1.47 1.58 -7%
CASK (Baht) 1.49 1.60 -7% 1.53 1.57 -3%
CASK ex-fuel (Baht) 0.98 0.98 0% 1.00 1.00 0%
15

TAA STATEMENT OF COMPREHENSIVE INCOME
Unit: Baht million 3Q2019 3Q2018 Change 9M2019 9M2018 Change
Revenue from sales and services 9,419 8,945 5% 30,183 29,250 3%
Gain on exchange rate 0 104 ->100% 271 133 >100%
Other income 242 258 -6% 764 821 -7%
Total revenues 9,661 9,307 4% 31,219 30,203 3%
Cost of sales and services (9,350) (9,138) 2% (28,957) (26,897) 8%
Selling and administrative expenses (716) (704) 2% (2,409) (2,277) 6%
Loss on exchange (80) 0 n/a 0 0 n/a
Total expenses (10,146) (9,842) 3% (31,366) (29,174) 8%
EBIT (485) (535) 9% (147) 1,029 ->100%
Finance costs (198) (188) 5% (570) (536) 6%
Profit (loss) before income tax (683) (722) -5% (717) 493 ->100%
Income tax income (Expense) (77) 67 >100% (20) 118 ->100%
Net Profit (loss) (761) (656) 16% (737) 611 ->100%
16

TAA STATEMENT OF FINANCIAL POSITION
Unit: Baht million 3Q2019 FY2018 Change
Assets
Cash and Cash equivalents 2,476 4,037 -39%
Other current assets 3,635 2,238 +62%
Aircraft, leasehold improvements and equipment, net 25,104 26,129 -4%
Other non-current assets 6,019 5,514 +9%
Total assets 37,234 37,918 -2%
Liabilities
Deferred revenues 4,373 4,987 -12%
Borrowings from financial institutions 5,076 3,488 +46%
Debenture 4,096 4,095 0%
Finance lease liabilities 11,900 13,219 -10%
Other liabilities 4,881 4,351 +12%
Total liabilities 30,326 30,140 +1%
Share capital
Ordinary Share Capital 436 436 0%
Share Premium 2,629 2,629 0%
Retained earnings - legal reserve 44 43 0%
Retained earnings - unappropriate 3,800 4,670 -19%
Total share capital 6,908 7,778 -11%
Total liabilities and share capital 37,234 37,918 -2%17

3Q2019 3Q2018 Change 9M2019 9M018 Change
Earnings (loss) per Share (THB) (17.46) (15.05) -16% (16.92) 14.04 ->100%
Return on Total Assets -3.2% 4.0% -3.2% 4.0%
Return on Shareholders' Equity -16.1% 15.3% -16.1% 15.3%
EBITDAR Margin 13.2% 13.6% -0 ppt 17% 21% -4 ppt
EBIT Margin -5.1% -6.0% +1 ppt 4% 8% -4 ppt
Net Income Margin -8.1% -7.3% -1 ppt -2.4% 2.1% -4 ppt
Debt1 : Equity ratio (Times) 3.05 2.56 3.05 2.56
Net Debt2 : Equity ratio (Times) 2.69 2.08 2.69 2.08
Net Liabilities3 : Equity ratio (Times) 4.03 3.11 4.03 3.11
TAA : FINANCIAL SUMMARY
Note: 1 Debt = Borrowings from financial institutions + Finance lease liabilities + Debenture
2 Net Debt = (Borrowings from financial institutions + Finance lease liabilities + Debenture) - Cash and Cash Equivalents – Short-term Investments
3 Net Liabilities = Total liabilities – Cash and Cash Equivalents – Short-term Investments
Percentage Point (PPT)
18

AAV STATEMENT OF COMPREHENSIVE INCOME
Unit: Baht millionConsolidated
ChangeConsolidated
Change3Q2019 3Q2018 9M2019 9M2018
Revenue from sales and services 9,419 8,945 5% 30,183 29,250 3%
Gain on exchange rate 0 104 ->100% 271 133 >100%
Other income 242 258 -6% 765 821 -7%
Total revenues 9,661 9,307 4% 31,219 30,203 3%
Cost of sales and services (9,350) (9,138) 2% (28,957) (26,897) 8%
Selling and administrative expenses (714) (701) 2% (2,405) (2,273) 6%
Loss on exchange (80) 0 n/a 0 0 n/a
Total expenses (10,144) (9,838) 3% (31,362) (29,169) 8%
EBIT (482) (531) 9% (142) 1,034 ->100%
Finance costs (198) (188) 5% (570) (536) 6%
Profit (loss) before income tax (681) (719) 5% (712) 498 ->100%
Income tax income (Expense) (78) 66 >100% (21) 117 ->100%
Profit (loss) attributable to (759) (653) -16% (733) 615 ->100%
Equity holders of the company (417) (358) -16% (402) 340 ->100%
Non-controlling interests of the subsidiary (342) (295) -16% (332) 275 ->100%
Earnings (loss) per share (THB) (759) (653) -16% (733) 615 ->100%
19

Unit: Baht millionConsolidated
Change3Q2019 FY2018
AssetsCash and Cash equivalents 2,566 4,123 -38%
Other current assets 3,636 2,243 +62%Aircraft, leasehold improvements and equipment, net 25,160 26,185 -4%Intangible assets 1) 14,878 14,883 0%Goodwill 2) 8,825 8,825 0%Other non-current assets 6,001 5,488 +9%
Total assets 61,066 61,747 -1%Liabilities
Deferred revenues 4,373 4,987 -12%Accrued expenses 2,271 2,562 -11%Finance lease liabilities 11,900 13,219 -10%
Borrowings from financial institutions 5,076 3,488 +46%Debenture 4,096 4,095 0%
Other liabilities 5,594 4,773 +17%Total liabilities 33,310 33,124 +1%Share capital
Ordinary Share Capital 485 485 0%Share Premium 2,600 2,600 0%
Retained Earnings – Legal reserve 49 48 0%Retained Earnings – Unappropriated 16,847 17,322 -3%Non-controlling interests 7,776 8,167 -5%
Total share capital 27,756 28,623 -3%Total liabilities and share capital 61,066 61,747 -1%
AAV STATEMENT OF FINANCIAL POSITION
20

Load Factor = Represents the number of passengers carried as a proportion to capacity, which is the number of seats available for passengers.
Available Seat Kilometres (ASK) = which is the total number of seats available on all flights multiplied by the number of kilometres these seats were flown
Revenue Passenger Kilometres (RPK) = Revenue passenger kilometres, which is the number of paying passengers carried on all flights multiplied by the number of kilometresthose seats were flown
Average Fare = Calculated as Thai AirAsia' s total passenger revenues and fuel surcharge divided by total number of passengers carried
Revenue per ASK (RASK) = Calculated as Thai AirAsia's revenues divided by ASK
Cost per ASK (CASK) = Calculated as the sum of Thai AirAsia's operating costs, selling expenses and administrative expenses (but excluding finance costs) divided by ASK
Cost per ASK (CASK ex-fuel) = Calculated as the sum of Thai AirAsia's operating costs, selling expenses and administrative expenses (but excluding finance costs) less fuel costs divided by ASK
Average Stage Length (kilometres) = Represents the average number of kilometres flown per flight
Aircraft Utilisation = Represents the average block hours per day per aircraft during the relevant period. Block hours is calculated by measuring the duration between the time of departure of an aircraft and the time of arrival at its destination.
On Time Performance (%) = A flight is deemed "on time" if the actual departure time is no more than 15 minutes of the scheduled departure time.
21
GLOSSARY