Embed Size (px)
Citation preview

A Publication of the EDHEC Infrastructure Institute-Singapore
Investor Perceptions ofInfrastructure, 2017
From investment plans to price discovery
November 2017
infraSingapore Infrastructure Investment Institute
with the support of

The author would like to thank Brer Adams and the members of the Long-Term Infrastructure Investors Association for useful commentsand suggestions. Financial support from the Global Infrastructure Hub is acknowledged.This study presents the authors’ views and conclusions, which are not necessarily those of GIH.
Table of Contents
Executive Summary . . . . . . . . . . . . . . . . . . . . . . . . . . . . . 4
1 Introduction . . . . . . . . . . . . . . . . . . . . . . . . . . . . . . 10
2 Survey Respondents . . . . . . . . . . . . . . . . . . . . . . . . . . 13
3 Investment Beliefs . . . . . . . . . . . . . . . . . . . . . . . . . . . 24
4 Willingness to Invest . . . . . . . . . . . . . . . . . . . . . . . . . 51
5 Return Preferences . . . . . . . . . . . . . . . . . . . . . . . . . . . 60
6 Conclusions . . . . . . . . . . . . . . . . . . . . . . . . . . . . . . . 78
References . . . . . . . . . . . . . . . . . . . . . . . . . . . . . . . . . . 88
About Global Infrastructure Hub . . . . . . . . . . . . . . . . . . . . . 89
About EDHEC Infrastructure Institute-Singapore . . . . . . . . . . . . 91
EDHEC Infrastructure Institute Publications . . . . . . . . . . . . . . . 95

2017 Infrastructure Investor Survey - November 2017
About the Authors
Frédéric Blanc-Brude is Director of the EDHEC Infrastructure
Institute. He holds a PhD in Finance (King’s College London) and degrees
from London School of Economics, the Sorbonne, and Sciences Po Paris.
He also represents EDHEC Business School on the Advisory Board of the
Global Infrastructure Facility of the World Bank.
Tim Whittaker is an Associate Research Director at the EDHEC Infras-
tructure Institute and Head of Data Collection. He holds a Master of
Business (Financial Management) and a PhD in Finance from Griffith
University.
Jing-Li Yim is a Senior Corporate Analyst at EDHEC Infrastructure
Institute. She has prior experience in a major accounting firm analysing
financial statements of electronics and technology companies. She
holds a Bachelor of Commerce (Accounting and Finance) from the
University of Queensland and is an associate member of CPA Australia.
A Publication of the EDHEC Infrastructure Institute-Singapore 3

Executive Summary
4 A Publication of the EDHEC Infrastructure Institute-Singapore
2017 Infrastructure Investor Survey - November 2017
Executive Summary
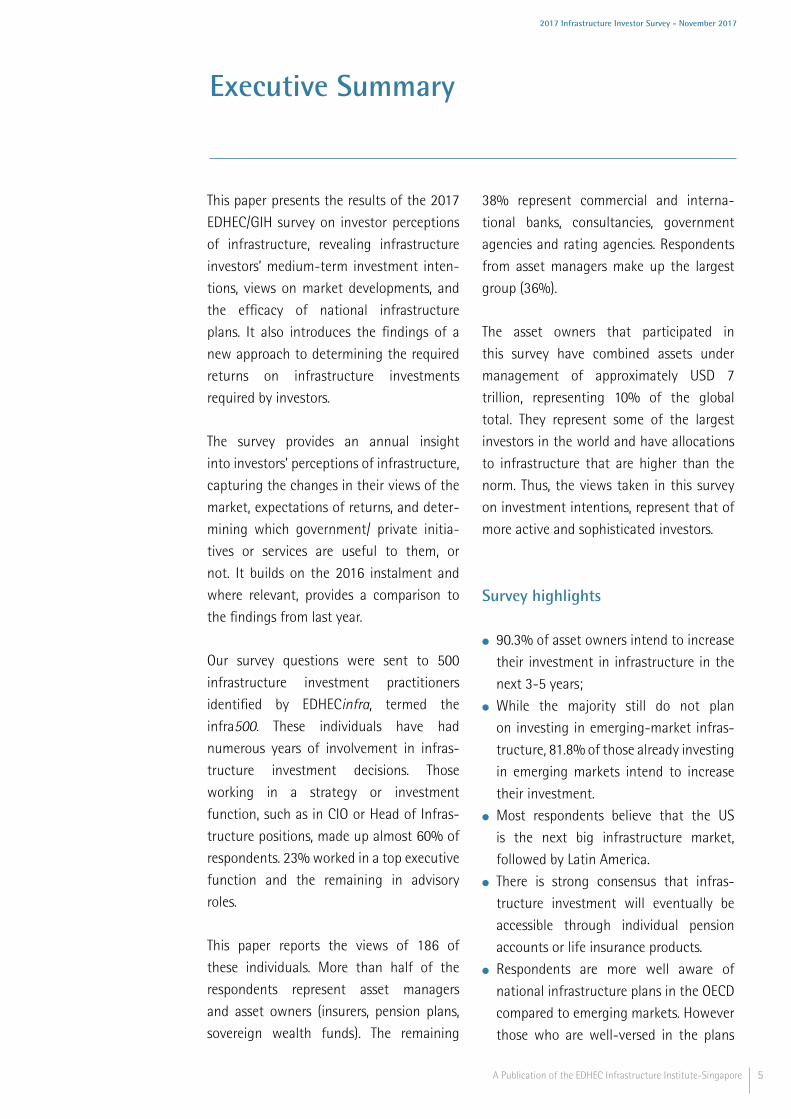
This paper presents the results of the 2017
EDHEC/GIH survey on investor perceptions
of infrastructure, revealing infrastructure
investors’ medium-term investment inten-
tions, views on market developments, and
the efficacy of national infrastructure
plans. It also introduces the findings of a
new approach to determining the required
returns on infrastructure investments
required by investors.
The survey provides an annual insight
into investors’ perceptions of infrastructure,
capturing the changes in their views of the
market, expectations of returns, and deter-
mining which government/ private initia-
tives or services are useful to them, or
not. It builds on the 2016 instalment and
where relevant, provides a comparison to
the findings from last year.
Our survey questions were sent to 500
infrastructure investment practitioners
identified by EDHECinfra, termed the
infra500. These individuals have had
numerous years of involvement in infras-
tructure investment decisions. Those
working in a strategy or investment
function, such as in CIO or Head of Infras-
tructure positions, made up almost 60% of
respondents. 23% worked in a top executive
function and the remaining in advisory
roles.
This paper reports the views of 186 of
these individuals. More than half of the
respondents represent asset managers
and asset owners (insurers, pension plans,
sovereign wealth funds). The remaining
38% represent commercial and interna-
tional banks, consultancies, government
agencies and rating agencies. Respondents
from asset managers make up the largest
group (36%).
The asset owners that participated in
this survey have combined assets under
management of approximately USD 7
trillion, representing 10% of the global
total. They represent some of the largest
investors in the world and have allocations
to infrastructure that are higher than the
norm. Thus, the views taken in this survey
on investment intentions, represent that of
more active and sophisticated investors.
Survey highlights
l 90.3% of asset owners intend to increase
their investment in infrastructure in the
next 3-5 years;
l While the majority still do not plan
on investing in emerging-market infras-
tructure, 81.8% of those already investing
in emerging markets intend to increase
their investment.
l Most respondents believe that the US
is the next big infrastructure market,
followed by Latin America.
l There is strong consensus that infras-
tructure investment will eventually be
accessible through individual pension
accounts or life insurance products.
l Respondents are more well aware of
national infrastructure plans in the OECD
compared to emerging markets. However
those who are well-versed in the plans
A Publication of the EDHEC Infrastructure Institute-Singapore 5

2017 Infrastructure Investor Survey - November 2017
Executive Summary
are more positive about the potential of
plans in emerging markets to improve
the attractiveness of infrastructure in the
country.
l The majority of respondents who have
taken part in projects supported by
project preparation facilities created by
MDBs agree that the assistance is of
value.
l Respondents believe there is value in
benchmarking operational performance.
The reporting of traffic/demand data
was identified as potentially the most
useful, followed closely by construction-
risk metrics and operational efficiency;
l When it comes to benchmarking financial
performance, respondents identified
time-weighted returns and risk-adjusted
returns as the most important. 11 - The EDHECinfra infras-tructure benchmarks fill thisparticular ”data gap” and arecurrently freely available online atedhec.infrastructure.institute.
l The lower and upper bounds on the
required return on equity for infras-
tructure investment in OECD markets
are 10% and 12%, respectively. These
results are on par with the broad market
EDHECinfra equity index;
l The mean emerging-market private
infrastructure equity premium is between
6% and 7%;
l The mean equity bid-ask spread is about
200bps in OECD infrastructure markets,
whereas in emerging markets it reaches
270bps;
l Among all the variables we tested
(geographic region, project life cycle,
business model, investor type), regulated
emerging-market infrastructure
produced the widest range of mean
required equity IRR, with 5.2% between
the lower and upper bounds 2 of mean2 - The lower bound represents themean IRR below which investorswould not agree to invest, and theupper bound represents the mean IRRabove which investors would agree toinvest
required IRR.
l For “core” and “core plus” infrastructure
PE Funds in the OECD - the most common
type of private infrastructure investment
vehicle - asset managers (the GPs) declare
requiring 12% but asset owners require
13%;
l Only a third of respondents find termi-
nology inherited from the real estate
sector such as ”core” and ”core plus”
confusing or unhelpful when used
to refer to different infrastructure
investment profiles.
l For a long-term infrastructure equity
fund, investing in greenfield and brown-
field infrastructure with no additional
leverage: Asset owners declare requiring
12% returns and asset managers between
9.6% and 12.9%;
l For a private project-debt coinvestment
platform: Investors require fixed-rate
returns in the 4.2-5% range.
l Only 10% of respondents find issues
with the approach taken by credit rating
agencies to rate infrastructure project
finance debt.
Greater expectations for nationalinfrastructure plans in emergingmarkets
1. Respondents are more well-versed in the
national infrastructure plans of OECD
countries;
2. The Juncker/EU Infrastructure
Investment Plan (2015-17) and the
UK’s National Infrastructure Delivery
Plan (2016-21) are the national infras-
6 A Publication of the EDHEC Infrastructure Institute-Singapore

2017 Infrastructure Investor Survey - November 2017
Executive Summary
tructure plans respondents are most well
aware of in the OECD - 35% and 22%
of respondents, respectively, considered
themselves to know these plans very
well;
3. Respondents were not as well aware of
national infrastructure plans in emerging
markets; Saudi Arabia’s National Trans-
formation Program (2020) and India’s
Twelfth Five-Year Plan (2012-17) were
the plans known in the greatest level of
detail; only 15% and 9% of respondents,
respectively, know these plans very well;
4. However, respondents were more
positive about the impact of the
emerging-market plans compared to the
OECD plans. The average proportion of
respondents who believe that the plan
improves the attractiveness of infras-
tructure in the country was roughly 49%
for the emerging-market plans, and 42%
for the OECD plans;
5. The plans believed to bring about the
most improvement to attractiveness
of the country’s infrastructure were
Saudi Arabia’s National Transformation
Program (2020) for emerging markets,
and Chile’s Agenda De Concesiones
(2014-20) for the OECD.
No greenfield premium demandedfor private infrastructure equityinvestments
1. We used the method of contingent
valuation which is often used to estimate
the willingness to pay or willingness to
accept a certain price or situation in
non-market goods. With private infras-
tructure, investments are largely illiquid
and investor preferences are seldom
revealed in market transactions. Thus,
asking investors to state their prefer-
ences can be a valid approach to under-
standing the formation of prices for
infrastructure assets.
2. Questions were tailored to the
respondent’s self-identified infras-
tructure expertise (debt/ equity, OECD/
emerging-market, assets/ products).
Projects/ products were described to
respondents and they were able to
indicate their willingness to invest for a
set range of IRRs.
3. Of the traditional views on risk/ return
trade-off in infrastructure investing
surrounding geographical region,
business model, and project life cycle,
the views on geographical region and
business model were confirmed by the
results i.e. investments in private infras-
tructure in emerging markets invited
a higher equity premium compared to
investments in OECD markets (between
6% and 7%), and investors demand
a premium to invest in merchant
infrastructure (about 150 bps for both
emerging market and OECD);
4. However, we did not find that investors
required a premium for greenfield
projects, over brownfield;
5. Questions juxtaposing greenfield
and brownfield investments in a single
question would naturally yield a different
required return for each project life cycle,
as the question framing implies that
the two investments must be different.
A Publication of the EDHEC Infrastructure Institute-Singapore 7

2017 Infrastructure Investor Survey - November 2017
Executive Summary
However when such question framing is
removed, as done in this year’s survey,
respondents no longer report a required
premium for greenfield investments;
6. Firstly, construction risks while a
significant consideration to investors,
may not necessarily demand risk
premia. For instance, equity investors in
project-finance transactions are mostly
protected from construction risk by a
fixed price, date-certain construction
contract, and cost overruns at the
project company level have been shown
to be close to zero on average;
7. Next, the size of construction risks and
any related premium, may not be larger
than risk premia associated with risks in
the post-construction phase of infras-
tructure projects (e.g. traffic risk or
regulatory changes);
8. Finally, construction risks are almost
entirely idiosyncratic.
Divergence in mean required returnsbetween asset owners and assetmanagers for investment products
1. The contingent valuation method
was also used to determine investors’
required returns for infrastructure
investment products;
2. We asked respondents about 4 products:
a traditional infrastructure equity fund,
a long-term infrastructure equity fund,
a coinvestment infrastructure debt
platform, and an index-tracking hybrid
infrastructure fund.
3. Respondents required the highest mean
IRR for the hybrid infrastructure fund;
4. A lower mean IRR was required by
investors for the long-term infras-
tructure equity fund compared to the
traditional infrastructure private equity
fund;
5. Additionally, for the long-term infras-
tructure equity fund, the required returns
for asset managers were found to be
significantly different from that of asset
owners, likewise between asset managers
and banks;
6. Asset managers consider that investors
in long-term infrastructure equity funds
should be happy to receive returns
between 9.6% and 12.9%, whereas asset
owners express narrower expectations of
12%;
7. The wider price bounds for asset
managers could be due to expected
fee levels, on top of differences in risk
preferences.
8. For the traditional infrastructure equity
fund and the coinvestment infras-
tructure debt platform, mean required
returns were not found to be signifi-
cantly different between the different
investor types.
8 A Publication of the EDHEC Infrastructure Institute-Singapore

1. Introduction
A Publication of the EDHEC Infrastructure Institute-Singapore 9

2017 Infrastructure Investor Survey - November 2017
1. Introduction
In this paper, we report the answers of
186 asset owners and managers, lenders,
and consultants who responded to the
2017 EDHEC/GIH Investor Survey, a set of
questions about the dynamics of the private
infrastructure investment market and the
required level of returns in infrastructure
investment.
This second iteration of the EDHEC/GIH
survey focused on a target group we call the
infra500, individuals who play a significant
role in infrastructure investment at organ-
isations ranging from large asset owners,
asset managers, commercial and interna-
tional banks, rating agencies, and major
consultancies.
Their pooled knowledge of prevalent
investment beliefs in the private infras-
tructure sector can give us a unique
perspective on an otherwise opaque and
very illiquid market segment. Hence, while
too few infrastructure transactions are
observable to create time series of market
prices, the infra500 can be a powerful proxy
of this market.
In this survey, this is exactly what
we attempt: reformulating the classic
“willingness-to-pay” contingent valuation
techniques used to evaluate goods that
never or cannot trade, we derive a
“willingness-to-invest” survey method-
ology, by which we ask our respondents to
agree or disagree with a series of bid prices
(returns) corresponding to hypothetical but
also quite familiar investment scenarios.
The rationale behind this methodology is
that if you have ever bought a USD500mn
combined-cycle gas turbine power
generator in an OECD country with a
15-year power purchase agreement using
75% senior leverage, you probably have
some idea of what equity returns are
reasonable, too low, or too good to be true
in similar transactions.
While survey respondents may not know the
exact return they would require based on
reading a short synopsis of an investment,
they should have a good sense of where
good deal bounds on value should lie.
More formally, private markets like the one
for infrastructure equity stakes are typically
incomplete markets where large bid-ask
spreads can survive for a long time (infras-
tructure projects cannot be shorted!).
In incomplete markets, investor preferences
have a direct influence on transaction prices
(i.e., the law of one price does not apply).
Hence, not all respondents have the same
view on what the reasonable bounds on
investment returns should be.
The methodology we implement in this
survey allows estimating an average bid-ask
spread and comparing it across project types
and investor types.
To our knowledge, this is the first time that
this kind of experimental research has been
implemented in the private infrastructure
investment space.
10 A Publication of the EDHEC Infrastructure Institute-Singapore

2017 Infrastructure Investor Survey - November 2017
1. Introduction
The results are very promising, and we
look forward to implementing this approach
again in the 2018 survey.
This survey was also an opportunity to
ask what investors thought of the various
national infrastructure plans that have
been announced around the world and
whether they were perceived as addressing
the procurement bottlenecks that prevent
private infrastructure markets from growing
faster, including in emerging markets.
As we do each year, we also asked infras-
tructure investors about their allocation and
investment intentions in markets around
the world and what they think about inter-
mediation and, following the release of the
EDHECinfra benchmarks, what data gaps
remain to support the growth of private
infrastructure investment.
The rest of this survey is organised thus:
Section 2 presents the respondents to the
survey by size, category, geographic origin,
and self-declared area of expertise.
We then present the survey responses in two
distinct parts.
In section 3, we review the responses to
questions relative to the evolution of the
infrastructure investment sector, including
the role of national infrastructure plans in
swaying investors toward infrastructure.
In a second part, we discuss respondents’
views on required returns in infrastructure
investment, including the level of returns
required by investors to engage in certain
types of projects and the bid-ask spread (or
price bounds) found in different types of
transactions.
Section 4 describes the methodology used
to design the questions and analyse the
responses, and section 5 presents and
discusses our findings.
Section 6 briefly summarises our findings
and concludes.
A Publication of the EDHEC Infrastructure Institute-Singapore 11

2. Survey Respondents
12 A Publication of the EDHEC Infrastructure Institute-Singapore
2017 Infrastructure Investor Survey - November 2017
2. Survey Respondents
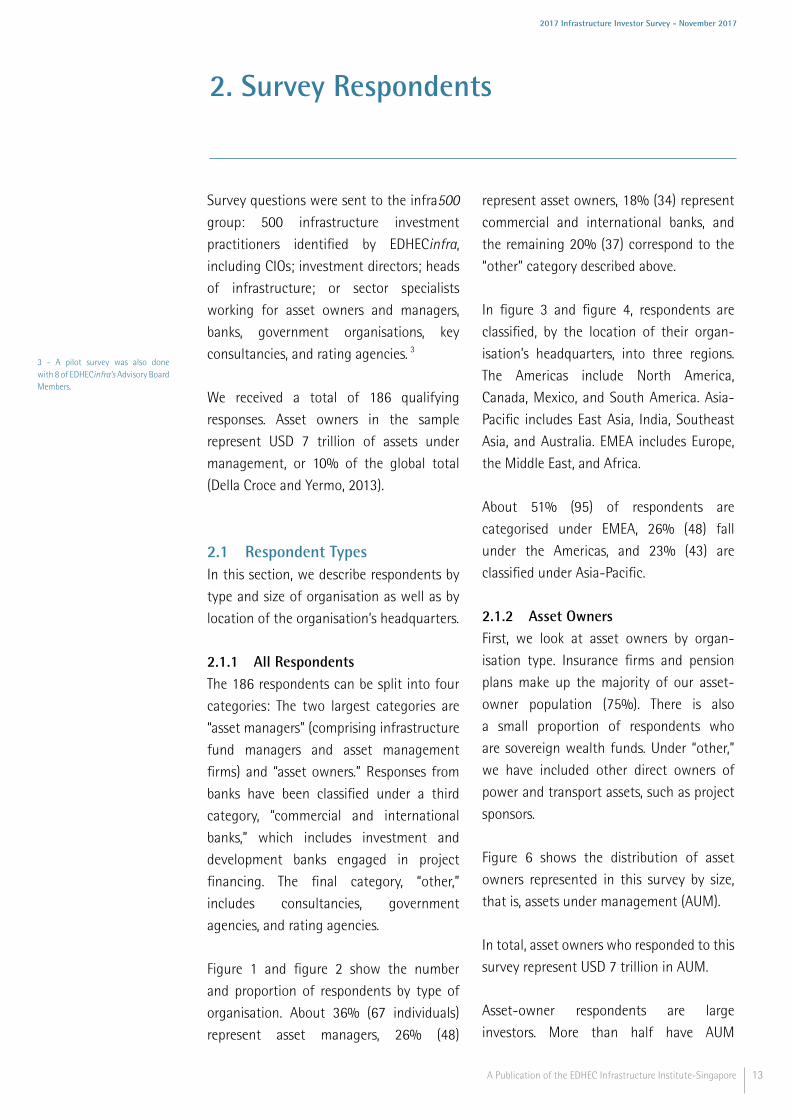
Survey questions were sent to the infra500group: 500 infrastructure investment
practitioners identified by EDHECinfra,including CIOs; investment directors; heads
of infrastructure; or sector specialists
working for asset owners and managers,
banks, government organisations, key
consultancies, and rating agencies. 33 - A pilot survey was also donewith 8 of EDHECinfra’s Advisory BoardMembers.
We received a total of 186 qualifying
responses. Asset owners in the sample
represent USD 7 trillion of assets under
management, or 10% of the global total
(Della Croce and Yermo, 2013).
2.1 Respondent TypesIn this section, we describe respondents by
type and size of organisation as well as by
location of the organisation’s headquarters.
2.1.1 All RespondentsThe 186 respondents can be split into four
categories: The two largest categories are
“asset managers” (comprising infrastructure
fund managers and asset management
firms) and “asset owners.” Responses from
banks have been classified under a third
category, “commercial and international
banks,” which includes investment and
development banks engaged in project
financing. The final category, “other,”
includes consultancies, government
agencies, and rating agencies.
Figure 1 and figure 2 show the number
and proportion of respondents by type of
organisation. About 36% (67 individuals)
represent asset managers, 26% (48)
represent asset owners, 18% (34) represent
commercial and international banks, and
the remaining 20% (37) correspond to the
“other” category described above.
In figure 3 and figure 4, respondents are
classified, by the location of their organ-
isation’s headquarters, into three regions.
The Americas include North America,
Canada, Mexico, and South America. Asia-
Pacific includes East Asia, India, Southeast
Asia, and Australia. EMEA includes Europe,
the Middle East, and Africa.
About 51% (95) of respondents are
categorised under EMEA, 26% (48) fall
under the Americas, and 23% (43) are
classified under Asia-Pacific.
2.1.2 Asset OwnersFirst, we look at asset owners by organ-
isation type. Insurance firms and pension
plans make up the majority of our asset-
owner population (75%). There is also
a small proportion of respondents who
are sovereign wealth funds. Under “other,”
we have included other direct owners of
power and transport assets, such as project
sponsors.
Figure 6 shows the distribution of asset
owners represented in this survey by size,
that is, assets under management (AUM).
In total, asset owners who responded to this
survey represent USD 7 trillion in AUM.
Asset-owner respondents are large
investors. More than half have AUM
A Publication of the EDHEC Infrastructure Institute-Singapore 13

2017 Infrastructure Investor Survey - November 2017
2. Survey Respondents
Figure 1: Number of survey respondents by organisation type
Ass
et m
anag
ers
Ass
et o
wn
ers
Oth
er
Com
mer
cial
an
d in
tern
atio
nal
ban
ks
Nu
mbe
r of
res
pon
den
ts
0
20
40
60
80
100
Figure 2: Proportion of survey respondents by organisation type
Asset managers 36%
Asset owners 26%
Commercial and international banks
18%
Other 20%
14 A Publication of the EDHEC Infrastructure Institute-Singapore

2017 Infrastructure Investor Survey - November 2017
2. Survey Respondents
Figure 3: Number of survey respondents by region
EMEA
Am
eric
as
Asi
a−Pa
cifi
c
Nu
mbe
r of
res
pon
den
ts
0
20
40
60
80
100
Figure 4: Proportion of survey respondents by region
Americas 26%
Asia−Pacific 23%
EMEA 51%
A Publication of the EDHEC Infrastructure Institute-Singapore 15

2017 Infrastructure Investor Survey - November 2017
2. Survey Respondents
Figure 5: Proportion of asset owners by organisation type
Insurers 35%
Other 17%
Pension plans 40%
Sovereign wealth funds 8%
Figure 6: Proportion of participating asset owners by assets under management (AUM)
<USD1 billion 9.1%
USD1−5 billion 4.5%
USD5−25 billion 20.5%
USD25−50 billion 13.6%
USD50−100 billion 6.8%
USD100−250 billion 20.5%
USD250−500 billion 20.5%
USD500−600 billion 2.3%
>USD600 billion 2.3%
16 A Publication of the EDHEC Infrastructure Institute-Singapore

2017 Infrastructure Investor Survey - November 2017
2. Survey Respondents
above USD 50bn. The largest group lies in
the USD 250-500bn bracket, followed by
those in the USD 5-25bn bracket and the
USD 100-250bn bracket.
Asset owners from EMEA 4 make up the4 - The categorisation of respondentsby region was detailed in section 2.1.1under the explanation for figure 3 andfigure 4
majority of respondents who declared AUM
above USD 250bn. These are mainly in
the insurance, pension fund, and sovereign
wealth fund categories.
Next, figure 7 reports asset owners’
allocation to infrastructure as a percentage
of AUM. The mean allocation was 6.03%.
The majority of the asset owners report an
allocation between 5-10% of AUM, which
is high by global standards.
2.2 Respondent PositionsNow we look at the different positions
of respondents. Those in a strategic
function (CIO, Head of Investments, Head
of Finance, CRO) make up the biggest
proportion of respondents at 37%. Those
at the top executive level (CEO, CFO,
MD, Executive director) represent 23%.
Those in an investment function (Head of
Infrastructure, Investment Director) also
represent roughly 23% of respondents.
The remaining 17% is represented by
other functions (advisory, banker, portfolio
manager).
The breakdown of respondents by organ-
isation type as well as position is shown
in table 1. Most of the respondents from
asset owners are either in the strategy
or investment function. Respondents
from asset managers, are mainly in a top
executive function or strategy function. For
respondents from banks, as well as other,
most of them are in a strategy function.
Thus, there is a good representation of
respondents in the strategy function
and investment function who are closely
involved with infrastructure investment.
2.3 Geographic, Investment, andTransaction FocusBefore answering questions on required
returns for infrastructure projects and
products, respondents were able to
customise the questions they received to
best suit their expertise.
This allows us to better understand what
individual respondents to this survey know
about.
Contingent-valuation questions were
prepared using a matrix of region, project
lifecycle, and business model categories,
as well as differentiation between debt
or equity, and investment in projects or
products.
Respondents were asked to choose which
questions they felt they had the best
investment and transaction expertise to
answer.
When identifying their geographic and
investment expertise, they were given
the option to answer questions on OECD
markets, emerging markets, or both,
A Publication of the EDHEC Infrastructure Institute-Singapore 17

2017 Infrastructure Investor Survey - November 2017
2. Survey Respondents
Figure 7: Current allocation to infrastructure as a percentage of AUM, asset owners only
0−1% 16.2%
1−2% 18.9%
2−5% 24.3%
5−10% 29.7%
10−15% 8.1%
>15% 2.7%
Figure 8: Survey respondents by position
Top
exec
uti
ve f
un
ctio
n
Stra
tegy
fu
nct
ion
Inve
stm
ent
fun
ctio
n
Oth
ers
Nu
mbe
r of
res
pon
den
ts
0
20
40
60
80
100
18 A Publication of the EDHEC Infrastructure Institute-Singapore

2017 Infrastructure Investor Survey - November 2017
2. Survey Respondents
Table 1: Number of respondents by organisation type and position
Position Asset owners Assetmanagers
Comm. andint’l banks
Other Total
Top executive function 9 23 3 8 43Strategy function 15 21 16 16 68Investment function 15 17 5 5 42Others 9 6 10 8 33Total 48 67 34 37 186
Figure 9: Proportion of asset owners by position
Top executive function 19%
Strategy function 31%
Investment function 31%
Others 19%
and either infrastructure debt or equity.
Respondents could also choose whether to
answer questions on infrastructure projects,
products, or both.
Geographies (OECD or emerging-market),
investment type (debt, equity), project
lifecycle (greenfield, brownfield), and
business model (contracted, merchant,
regulated) were equally represented in the
pool of infrastructure-project questions.
Similarly, the infrastructure-products
question pool included an equal number
of products focusing on OECD countries,
emerging markets, debt, and equity.
Figures 10, 11, and 12 show the areas
of expertise declared by respondents. The
selection represents the expertise of the
respondent and may not reflect the focus of
their organisation.
2.3.1 Geographic FocusIrrespective of their organisation type,
the majority of respondents expressed
much greater familiarity with infrastructure
investment in OECD markets (77%), with
the remainder being more familiar with
A Publication of the EDHEC Infrastructure Institute-Singapore 19

2017 Infrastructure Investor Survey - November 2017
2. Survey Respondents
Figure 10: Geographic focus by respondent type
0%
25%
50%
75%
100%
Ass
et m
anag
ers
Ass
et o
wn
ers
Com
mer
cial
an
d in
tern
atio
nal
ban
ks
Oth
er
Perc
enta
ge o
f re
spon
ses
Emerging markets OECD markets
emerging markets. Asset-owner respon-
dents expressed the least familiarity with
emerging markets.
2.3.2 Investment FocusRespondents all showed a very clear focus
on their investment expertise, all choosing
either infrastructure debt or equity as a
specialisation, and none selecting both.
The majority of respondents were more
knowledgeable about infrastructure equity
(60%) than debt.
Asset-owner respondents were the most
likely to select equity, while respondents
from commercial and international banks
selected this expertise the least. Bankers
who selected equity as their area of
expertise worked for international devel-
opment banks.
In line with last year’s results, asset-owner
respondents still express greater focus on
infrastructure equity over infrastructure
debt, compared to asset managers and,
obviously, banks.
2.3.3 Transaction FocusFinally, roughly half (46%) of respondents
declared themselves as familiar with the
return of both projects and investment
vehicles such as equity or debt funds.
Among the remaining experts, 39% were
more knowledgeable about infrastructure
projects solely, and the remaining 15%
selected infrastructure investment vehicles
as their forte.
20 A Publication of the EDHEC Infrastructure Institute-Singapore

2017 Infrastructure Investor Survey - November 2017
2. Survey Respondents
Figure 11: Investment focus by respondent type
0%
25%
50%
75%
100%
Ass
et m
anag
ers
Ass
et o
wn
ers
Com
mer
cial
an
d in
tern
atio
nal
ban
ks
Oth
er
Perc
enta
ge o
f re
spon
ses
Infrastructure debt Infrastructure equity
Figure 12: Transaction focus by respondent type
0%
25%
50%
75%
100%
Ass
et m
anag
ers
Ass
et o
wn
ers
Com
mer
cial
an
d in
tern
atio
nal
ban
ks
Oth
er
Perc
enta
ge o
f re
spon
ses
Both projects and vehicles Infrastructure projects Investment funds and vehicles
A Publication of the EDHEC Infrastructure Institute-Singapore 21

2017 Infrastructure Investor Survey - November 2017
2. Survey Respondents
2.4 ConclusionBy design, this survey captures the views
of individuals who have been involved
for numerous years with infrastructure
investment decisions of large asset owners
and managers, as well as specialised lenders,
and a few consultants / ratings agencies.
Compared to the average asset owner
(OECD, 2015), the asset owners represented
in this survey have disproportionately large
allocations to infrastructure. By focusing
on the infra500 group of respondents,
this survey achieves an even stronger bias
toward larger, more sophisticated investors
than the 2016 EDHEC/GIH survey.
With total AUM of more than USD 7 trillion,
the asset owners represented in this survey
account for roughly 10% of global assets
under management (Della Croce and Yermo,
2013). More than 50% of respondents had
AUM of more than USD 50 billion. Thus, the
largest institutional investors in the world
are disproportionately represented.
The recent history of the sector is also
visible in respondents’ self-declared areas
of expertise. Most investors and their
managers know about investing equity in
OECD infrastructure, either at the project
level or the fund level.
Next, we discuss respondents’ views on
market evolutions in section 3.
22 A Publication of the EDHEC Infrastructure Institute-Singapore

3. Investment Beliefs
A Publication of the EDHEC Infrastructure Institute-Singapore 23

2017 Infrastructure Investor Survey - November 2017
3. Investment Beliefs
In this section, we discuss our findings on
respondents� views on four areas of infras-
tructure investment: investment intentions
and market developments (section 3.1),
national infrastructure plans (section 3.2),
quality of intermediation (section 3.3), and
data gaps (section 3.4).
3.1 Market Developments3.1.1 Allocation TrendsThe following three questions discussed
pertain to asset owners only.
We first asked asset owners whether they
intended to invest more in infrastructure in
the next few years, including in emerging
markets.
We already know from the asset owners’
profile that their allocation to infrastructure
assets is comparatively high. Figure 13
shows that their medium-term investment
intentions are also rather positive.
None of the asset owners surveyed expect to
reduce their infrastructure investments over
the next three to five years.
In this group of asset owners, 90% reported
an intention to increase their investment,
while the remaining 10% intend to keep
their investment at its current level. Those
expecting to keep their infrastructure
investment unchanged are large pension
funds and sovereign wealth funds.
These results are much more positive
compared to last year’s results, where
65% of asset owners reported an expected
increase in their infrastructure investment
and 24% intended to keep their investment
unchanged. Furthermore, 1% reported
intentions to reduce their infrastructure
investment, and 2% intended to stop
investing in infrastructure entirely.
With regards to emerging-market infras-
tructure, the majority of asset owners (43%)
still do not invest in infrastructure in these
markets, and they do not intend to.
Nevertheless, 38% report currently
investing in emerging-market infras-
tructure, while 15% express an interest to
take on such investments. The remaining
5% remain undecided.
The emerging-market infrastructure
investment dynamic seems to be accel-
erating compared to our 2016 survey
results.
In 2016, only 20% reported investments in
emerging-market infrastructure. Currently,
insurance firms make up those interested
in investing in emerging-market infras-
tructure.
For asset owners currently investing
in emerging-market infrastructure, 82%
expect their allocation to increase, as shown
in figure 15. Most of the asset owners in this
group expect the increase to be moderate,
with a small proportion expecting a signif-
icant increase. The remaining 18% of asset
owners were unsure.
24 A Publication of the EDHEC Infrastructure Institute-Singapore

2017 Infrastructure Investor Survey - November 2017
3. Investment Beliefs
Figure 13: Infrastructure investment intentions for the next 3 to 5 years, asset owners only
Much more than you currently do 29.3%
Somewhat more than you currently do
61%
Keep allocation unchanged 9.8%
In the coming 3−5 years, you intend to invest in infrastructure . . .
Figure 14: Current allocation to emerging-market infrastructure, asset owners only
Yes, we already invest in emerging− market infrastructure 37.5%
No, but would like to 15%
No, and do not want to 42.5%
I don't know 5%
Do you already invest in infrastructure in emerging markets?
A Publication of the EDHEC Infrastructure Institute-Singapore 25

2017 Infrastructure Investor Survey - November 2017
3. Investment Beliefs
Figure 15: Future allocation to emerging-market infrastructure, asset owners only
Increase a lot 9.1%
Increase somewhat 72.7%
I don’t know 18.2%
Expected change in emerging−market infrastructure exposure
Last year’s results showed that 70% of
asset owners expected an increase in their
allocation and 4% expected a decrease.
The remaining questions discussed below
were asked to all respondents.
The deal flowInvestors often express concerns over the
lack of a pipeline for bankable infrastructure
projects. We asked respondents to express
their views on the future pipeline of infras-
tructure projects in OECD countries and in
emerging markets.
Most (56%) respondents do not expect
existing bottlenecks to be removed anytime
soon, and they believe that the future
infrastructure deal flow in OECD countries
will remain stable in comparison with the
past three to five years.
Those who expect it will grow make up
35% of respondents, while the remaining
9% expect it to shrink.
Asset managers make up the majority of
those who believe that the pipeline will
shrink, reflecting the difficulties experienced
by a number of asset managers in OECD
markets, where higher prices often mean
returns at or below the hurdle rate of private
infrastructure equity funds, making new
transactions more difficult to execute.
Moving to the infrastructure deal flow in
emerging markets, respondents are much
more positive, with 85% expecting the
future infrastructure pipeline to grow. A
small proportion of respondents, consisting
mainly of banks, believe it will shrink. Again,
this reflects the experience of commercial
banks involved in infrastructure project
26 A Publication of the EDHEC Infrastructure Institute-Singapore

2017 Infrastructure Investor Survey - November 2017
3. Investment Beliefs
Figure 16: Infrastructure deal flow in OECD countries
Stable 56.4%
Growing 34.5%
Shrinking 9.1%
In the OECD the future infrastructure deal flow or pipeline in comparison with the past 3−5 years is . . .
Figure 17: Infrastructure deal flow in emerging markets
Stable 9.6%
Growing 84.6% Shrinking
5.8%
In emerging markets, the future infrastructure deal flow or pipeline in comparison with the past 3−5 years is . . .
A Publication of the EDHEC Infrastructure Institute-Singapore 27

2017 Infrastructure Investor Survey - November 2017
3. Investment Beliefs
financing in emerging markets, where
prevailing loan-pricing conditions and
covenant requirements can often make
project financing commercially nonviable.
We also asked respondents which national
markets they were most-active in and which
they saw as the most promising.
The regions listed in figure 18, figure 19,
and figure 20 are defined in the previous
chapter, under the explanation for figure 3
and figure 4.
Regarding which OECD infrastructure
markets respondents considered to be the
most-active, most respondents selected
countries or regions in EMEA. Going by
country, the United States and the United
Kingdom were clear leaders. Responses
naming the United States or United
Kingdom made up the overwhelming
majority, and the remaining responses were
split across several other countries - in
order of highest selection, these countries
include Australia, France, and Canada. The
rest of the markets listed consisted mostly
of European countries.
However, for most-active infrastructure
markets in emerging markets, respondents
mainly selected countries or regions in
Asia-Pacific. By order of highest selection,
Indonesia, India, China, Mexico, and Brazil
came in as the top five. The other countries
named by respondents were mainly from
Africa and the Middle East.
Next, we consider the national or regional
markets our respondents believe will be the
“next big thing” for infrastructure investors.
The clear winner for the next big infras-
tructure market is the Americas. By country,
the United States was once again the
most-popular choice among respondents
and Latin America was the second most
selected region, behind Asia. Once again,
the number of responses selecting the
United States was significantly higher than
for any other country/region named. Other
countries named were mainly South East
Asian and Middle Eastern countries.
Thus, our respondents are very focused
on infrastructure investment in the United
States, currently and in the future.
Infrastructure as a retail productFinally, we asked about the future role of
infrastructure in retail products.
Private infrastructure investment remains
an opportunity solely accessible to institu-
tional investors. But it could be envisaged to
make private infrastructure debt and equity
products available to life insurance policy
owners or individual-account pension plan
members.
We asked respondents if they believed
that infrastructure investment –based
on its investment profile and regulatory
treatment– has the potential to become
part of retail insurance and pension
products.
28 A Publication of the EDHEC Infrastructure Institute-Singapore

2017 Infrastructure Investor Survey - November 2017
3. Investment Beliefs
Figure 18: Most-active national infrastructure markets in the OECD, by region
Americas 31.3%
Asia−Pacific 12.7%
EMEA 56%
Figure 19: Most-active national infrastructure markets in emerging markets, by region
Americas 23.9%
Asia−Pacific 52.2%
EMEA 23.9%
A Publication of the EDHEC Infrastructure Institute-Singapore 29

2017 Infrastructure Investor Survey - November 2017
3. Investment Beliefs
Figure 20: National or regional markets which will be the next big thing for infrastructure investment, by region
Americas 43.4%
Asia−Pacific 29.2%
EMEA 27.4%
Figure 21: Infrastructure products as retail insurance and pension products
Yes 85%
No 5%
I don't know 10%
Can infrastructure become a significant allocation in retail insurance and pension products?
30 A Publication of the EDHEC Infrastructure Institute-Singapore

2017 Infrastructure Investor Survey - November 2017
3. Investment Beliefs
Including a majority of respondents from
the insurance sector, 85% of respondents
believe that this is a possible development.
Offering individual members the oppor-
tunity to invest in long-term illiquid assets
at the right moment in their lifecycle
is obviously appealing, especially if such
investment choices can become part of
dynamic default options in defined contri-
bution plans.
This prospect also raises questions on at
least two fronts: first, the ability to invest
on a well-diversified basis in large pools of
infrastructure assets; second, the availability
of underlying infrastructure assets to build
such pools (without any deterioration of the
current investment profile).
Both aspects of this future are related to
the various infrastructure plans that have
been put forward by governments around
the world.
3.2 National Infrastructure PlansNational infrastructure plans have been
announced in most major economies in
the OECD and beyond. In an environment
where investors say they want to own
more infrastructure assets but also do not
think the deal flow will increase very fast,
such plans should provide a measure of
comfort for investors, since they often
promise numerous new investable infras-
tructure projects.
Hence, we asked respondents how well
they know the major national infrastructure
plans in OECD countries and emerging
markets, as well as what impact they
thought these plans would have.
The plans we queried our respondents about
are listed in table 2.
Next, we review the responses for OECD
plans, followed by emerging-market plans.
3.2.1 OECD National InfrastructurePlansNotorietyAmong the OECD national infrastructure
plans we listed, the most well-known plan
among respondents was the Juncker/EU
Infrastructure Investment Plan, where
almost 35% selected the highest level of
familiarity - very well aware.
For each of the plans more than 75% of
the respondents had at least heard of them,
signalling reasonable general awareness of
these OECD plans. The only exception was
Chile’s Agenda De Concesiones 5.5 - For Chile’s Agenda De Concesiones,a smaller proportion of respondentshad at least heard of the plan (51%).It was also the plan which respon-dents were most unfamiliar with inthe OECD, with 49% reporting thatthey had never heard of the plan.
At the same time, of the total responses for
all the OECD plans, roughly one-fifth were
”never heard of it”, and more than one-third
were either ”never heard of it” or ”I have
heard of it but not much more”. Apart from
Chile’s Agenda De Concesiones, each of the
other OECD national infrastructure plans are
known in detail to a subgroup of between
13% and 35% of respondents.
When segregating respondents by regions 6
6 - The categorisation of respondentsby region was detailed in section 2.1.1under the explanation for figure 3 andfigure 4 A Publication of the EDHEC Infrastructure Institute-Singapore 31

2017 Infrastructure Investor Survey - November 2017
3. Investment Beliefs
Table 2: National infrastructure plans in OECD countries and emerging markets
OECD Emerging marketsAustralian Infrastructure Plan 2015-30 Brazil Projeto Crescer (Growth Project) 2014-18Chile Agenda De Concesiones 2014-20 China plans for different sectors based on 13th Five-
Year Plan 2016-20Investing in Canada Plan 2016-28 India Twelfth Five-Year Plan 2012-17Juncker-EU Infrastructure Investment Plan 2015-17 Indonesia National Medium-Term Development Plan
2015-19UK National Infrastructure Delivery Plan 2016-21 Saudi Arabia National Transformation Program 2020USA Trump’s Infrastructure Plan 2017 onwards South Africa National Infrastructure Plan 2013-17
Figure 22: National infrastructure plans, OECD countries
0%
25%
50%
75%
100%
Jun
cker
/EU
Infr
astr
uct
ure
Inve
stm
ent
Plan
, 201
5−17
UK
Nat
ion
al In
fras
tru
ctu
re D
eliv
ery
Plan
, 201
6−21
Inve
stin
g in
Can
ada
Plan
, 201
6−28
Au
stra
lian
Infr
astr
uct
ure
Pla
n,
2015
−30
USA
Tru
mp'
s In
fras
tru
ctu
re P
lan
,20
17 o
nw
ards
Ch
ile A
gen
da D
e C
once
sion
es, 2
014−
20
Perc
enta
ge o
f re
spon
ses
Very well aware Somewhat, but I don't know the full details
I have heard of it but not much more
Never heard of it
How well do you know these OECD national infrastructure plans?
(the Americas, Asia-Pacific, and EMEA),
based on location of the firms’ headquarters,
we see greater familiarity among respon-
dents for plans relating to their region.
Respondents classified under the Americas
are most well aware of the Investing in
Canada Plan, with 38% of respondents from
American organisations stating that they
are very well aware of the plan. Trump’s
Infrastructure Plan (2017 onwards) and the
Juncker/EU Infrastructure Investment Plan
(2015-17) tied at second place.
Respondents under Asia-Pacific are most
well aware of the Australian Infrastructure
Plan. This and the United States’s plans were
the most well-known in the region, with
92% of respondents having at least heard
of both. None of these respondents reported
being very well aware of Chile’s Agenda De
Concesiones.
32 A Publication of the EDHEC Infrastructure Institute-Singapore

2017 Infrastructure Investor Survey - November 2017
3. Investment Beliefs
Figure 23: National infrastructure plans, OECD countries (respondents from America)
0%
25%
50%
75%
100%
Inve
stin
g in
Can
ada
Plan
, 201
6−28
Jun
cker
/EU
Infr
astr
uct
ure
Inve
stm
ent
Plan
, 201
5−17
USA
Tru
mp'
s In
fras
tru
ctu
re P
lan
,20
17 o
nw
ards
Au
stra
lian
Infr
astr
uct
ure
Pla
n,
2015
−30
UK
Nat
ion
al In
fras
tru
ctu
re D
eliv
ery
Plan
, 201
6−21
Ch
ile A
gen
da D
e C
once
sion
es, 2
014−
20
Perc
enta
ge o
f re
spon
ses
Very well aware Somewhat, but I don't know the full details
I have heard of it but not much more
Never heard of it
How well do you know these OECD national infrastructure plans? (respondents from America)
Figure 24: National infrastructure plans, OECD countries (respondents from Asia-Pacific)
0%
25%
50%
75%
100%
Au
stra
lian
Infr
astr
uct
ure
Pla
n,
2015
−30
UK
Nat
ion
al In
fras
tru
ctu
re D
eliv
ery
Plan
, 201
6−21
Inve
stin
g in
Can
ada
Plan
, 201
6−28
Jun
cker
/EU
Infr
astr
uct
ure
Inve
stm
ent
Plan
, 201
5−17
USA
Tru
mp'
s In
fras
tru
ctu
re P
lan
,20
17 o
nw
ards
Ch
ile A
gen
da D
e C
once
sion
es, 2
014−
20
Perc
enta
ge o
f re
spon
ses
Very well aware Somewhat, but I don't know the full details
I have heard of it but not much more
Never heard of it
How well do you know these OECD national infrastructure plans? (respondents from Asia−Pacific)
A Publication of the EDHEC Infrastructure Institute-Singapore 33

2017 Infrastructure Investor Survey - November 2017
3. Investment Beliefs
In EMEA, the most well-known plans were
those of the United States and the EU, with
96% of respondents having at least heard of
the plans. The plan respondents were most
aware of was the Juncker/EU Infrastructure
Investment Plan, with 58% of respondents
stating that they knew it well. The UK’s
National Infrastructure Delivery Plan came
in second at 32%.
EffectivenessWhat impact can OECD infrastructure plans
have on investment opportunities? We
asked those respondents who stated that
they knew at least something about each
OECD plan if they felt these plans would
impact investment opportunities, and in
what way.
It is encouraging to note that there is
a fair amount of support for all of the
plans. Chile’s plan had the strongest support
and more than half of the respondents
who knew the plan felt that it improved
the attractiveness of Chile’s infrastructure.
Australia’s, Canada’s and the USA’s plans
also had a positive response from close
to 50% of respondents. For the Juncker
Plan and the UK’s plan, around 30% of
respondents each were convinced that they
brought about improvement to the attrac-
tiveness of infrastructure in the countries.
However, there is a significant proportion of
respondents who do hold reservations about
the effectiveness of most of the plans, and a
small number even believe some of the plans
create more risk.
Now we look at the results by respondent
region.
For respondents classified under the
Americas, the ranking of support for each
plan is fairly similar to that in the discussion
above. The plan that received the most
positive response among this group was
again Chile’s Agenda De Concesiones.
However, the proportion of support for the
plan was almost matched by that for the
Australian Infrastructure Plan (2015-30).
Respondents from Asia-Pacific organisa-
tions are significantly less convinced. None
of the respondents felt that Chile’s Agenda
De Concesiones or the Juncker plan added
to the attractiveness of investing in infras-
tructure. A small minority felt that Trump’s
infrastructure plan would create more
unrewarded risk.
Respondents from EMEA organisations were
the most positive about the plans. Chile’s
Agenda De Concesiones had the strongest
support, with 83% of respondents stating
that the plan improves the attractiveness
of infrastructure investment, followed by
Trump’s Infrastructure Plan (2017 onwards)
and the Investing in Canada Plan (2016-28)
which both had more than 50% of positive
views each.
Plans for the EU, UK, and US, attracted more
polarised responses, with a larger but still
minority group of respondents seeing more
risk being created but not more rewards.
34 A Publication of the EDHEC Infrastructure Institute-Singapore

2017 Infrastructure Investor Survey - November 2017
3. Investment Beliefs
Figure 25: National infrastructure plans, OECD countries (respondents from EMEA)
0%
25%
50%
75%
100%
Jun
cker
/EU
Infr
astr
uct
ure
Inve
stm
ent
Plan
, 201
5−17
UK
Nat
ion
al In
fras
tru
ctu
re D
eliv
ery
Plan
, 201
6−21
USA
Tru
mp'
s In
fras
tru
ctu
re P
lan
,20
17 o
nw
ards
Inve
stin
g in
Can
ada
Plan
, 201
6−28
Au
stra
lian
Infr
astr
uct
ure
Pla
n,
2015
−30
Ch
ile A
gen
da D
e C
once
sion
es, 2
014−
20
Perc
enta
ge o
f re
spon
ses
Very well aware Somewhat, but I don't know the full details
I have heard of it but not much more
Never heard of it
How well do you know these OECD national infrastructure plans? (respondents from EMEA)
Figure 26: Potential impact of plans on investment opportunities in the country (OECD)
0%
25%
50%
75%
100%
Ch
ile A
gen
da D
e C
once
sion
es, 2
014−
20
USA
Tru
mp'
s In
fras
tru
ctu
re P
lan
,20
17 o
nw
ards
Inve
stin
g in
Can
ada
Plan
, 201
6−28
Au
stra
lian
Infr
astr
uct
ure
Pla
n,
2015
−30
Jun
cker
/EU
Infr
astr
uct
ure
Inve
stm
ent
Plan
, 201
5−17
UK
Nat
ion
al In
fras
tru
ctu
re D
eliv
ery
Plan
, 201
6−21
Perc
enta
ge o
f re
spon
ses
This plan improves the attractiveness of infrastructure in this country
This plan does not change the attractiveness of infrastructure in this country
This plan creates more risk but not more rewards
A Publication of the EDHEC Infrastructure Institute-Singapore 35

2017 Infrastructure Investor Survey - November 2017
3. Investment Beliefs
Figure 27: Potential impact of plans on investment opportunities in the country (OECD), respondents from America
0%
25%
50%
75%
100%
Ch
ile A
gen
da D
e C
once
sion
es, 2
014−
20
Au
stra
lian
Infr
astr
uct
ure
Pla
n,
2015
−30
Inve
stin
g in
Can
ada
Plan
, 201
6−28
USA
Tru
mp'
s In
fras
tru
ctu
re P
lan
,20
17 o
nw
ards
Jun
cker
/EU
Infr
astr
uct
ure
Inve
stm
ent
Plan
, 201
5−17
UK
Nat
ion
al In
fras
tru
ctu
re D
eliv
ery
Plan
, 201
6−21
Perc
enta
ge o
f re
spon
ses
This plan improves the attractiveness of infrastructure in this country
This plan does not change the attractiveness of infrastructure in this country
Figure 28: Potential impact of plans on investment opportunities in the country (OECD), respondents from Asia-Pacific
0%
25%
50%
75%
100%
Au
stra
lian
Infr
astr
uct
ure
Pla
n,
2015
−30
Inve
stin
g in
Can
ada
Plan
, 201
6−28
USA
Tru
mp'
s In
fras
tru
ctu
re P
lan
,20
17 o
nw
ards
UK
Nat
ion
al In
fras
tru
ctu
re D
eliv
ery
Plan
, 201
6−21
Ch
ile A
gen
da D
e C
once
sion
es, 2
014−
20
Jun
cker
/EU
Infr
astr
uct
ure
Inve
stm
ent
Plan
, 201
5−17
Perc
enta
ge o
f re
spon
ses
This plan improves the attractiveness of infrastructure in this country
This plan does not change the attractiveness of infrastructure in this country
This plan creates more riskbut not more rewards
36 A Publication of the EDHEC Infrastructure Institute-Singapore
2017 Infrastructure Investor Survey - November 2017
3. Investment Beliefs
Figure 29: Potential impact of plans on investment opportunities in the country (OECD), respondents from EMEA
0%
25%
50%
75%
100%
Ch
ile A
gen
da D
e C
once
sion
es, 2
014−
20
USA
Tru
mp'
s In
fras
tru
ctu
re P
lan
,20
17 o
nw
ards
Inve
stin
g in
Can
ada
Plan
, 201
6−28
Au
stra
lian
Infr
astr
uct
ure
Pla
n,
2015
−30
Jun
cker
/EU
Infr
astr
uct
ure
Inve
stm
ent
Plan
, 201
5−17
UK
Nat
ion
al In
fras
tru
ctu
re D
eliv
ery
Plan
, 201
6−21
Perc
enta
ge o
f re
spon
ses
This plan improves the attractiveness of infrastructure in this country
This plan does not change the attractiveness of infrastructure in this country
This plan creates more risk but not more rewards
Next, we turn to infrastructure plans in
emerging markets.
3.2.2 Emerging-Market NationalInfrastructure PlansNotorietyRegarding national infrastructure plans
in emerging markets, China’s plans for
different sectors based on the 13th Five-
Year Plan was the most well-known among
respondents, with 74% having at least
heard of the plan.
However, when it came to being very well
aware of plans, investors were most well
aware of Saudi Arabia’s National Trans-
formation Program (15%). The rest of
the plans had between 2% and 9% of
respondents stating that they were very
well aware of the plan. Respondents were
most unfamiliar with Brazil’s Projeto Crescer
(growth project), with almost 55% having
never heard of it.
Below, we look at the results by region.
In the Americas, the best-known plan was
China’s plans for different sectors based on
the 13th Five-Year Plan, with almost 88% of
respondents having at least heard of them.
When it came to the plan respondents knew
very well, India’s 12th Five-Year Plan ranked
the highest. Saudi Arabia and South Africa’s
plans were not very well known by any of
the respondents.
The results were very similar for respon-
dents classified under Asia-Pacific. The most
well-known plan was once again China’s
plans of different sectors based on the 13th
A Publication of the EDHEC Infrastructure Institute-Singapore 37

2017 Infrastructure Investor Survey - November 2017
3. Investment Beliefs
Figure 30: National infrastructure plans, emerging markets
0%
25%
50%
75%
100%
Sau
di A
rabi
a, N
atio
nal
Tra
nsf
orm
atio
nPr
ogra
m 2
020
Indi
a Tw
elft
h F
ive−
Year
Pla
n,
2012
−17
Indo
nes
ia N
atio
nal
Med
ium
−Te
rmD
evel
opm
ent
Plan
, 201
5−19
Ch
ina
plan
s fo
r di
ffer
ent
sect
ors
base
don
13t
h F
ive−
Year
Pla
n, 2
016−
20
Bra
zil P
roje
to C
resc
er (
Gro
wth
Pro
ject
),20
14−
18
Sou
th A
fric
a N
atio
nal
Infr
astr
uct
ure
Pl
an, 2
013−
17
Perc
enta
ge o
f re
spon
ses
Very well aware Somewhat, but I don't know the full details
I have heard of it but not much more
Never heard of it
How well do you know these emerging−market national infrastructure plans?
Figure 31: National infrastructure plans, emerging markets (respondents from America)
0%
25%
50%
75%
100%
Indi
a Tw
elft
h F
ive−
Year
Pla
n,
2012
−17
Ch
ina
plan
s fo
r di
ffer
ent
sect
ors
base
don
13t
h F
ive−
Year
Pla
n, 2
016−
20
Bra
zil P
roje
to C
resc
er (
Gro
wth
Pro
ject
),20
14−
18
Indo
nes
ia N
atio
nal
Med
ium
−Te
rmD
evel
opm
ent
Plan
, 201
5−19
Sau
di A
rabi
a, N
atio
nal
Tra
nsf
orm
atio
nPr
ogra
m 2
020
Sou
th A
fric
a N
atio
nal
Infr
astr
uct
ure
Pl
an, 2
013−
17
Perc
enta
ge o
f re
spon
ses
Very well aware Somewhat, but I don't know the full details
I have heard of it but not much more
Never heard of it
How well do you know these emerging−market national infrastructure plans? (respondents from America)
38 A Publication of the EDHEC Infrastructure Institute-Singapore

2017 Infrastructure Investor Survey - November 2017
3. Investment Beliefs
Five-Year Plan (80%), and the plan respon-
dents knew very well was India’s 12th Five-
Year Plan and Indonesia’s National Medium
Term Development Plan (20% for each). The
plan least known in this region was Brazil’s
Projeto Crescer (Growth Project).
Respondents under EMEA were most aware
of Saudi Arabia’s National Transformation
Program, with 70% having at least heard of
it. This was also the plan that respondents
were best versed in, with 26% stating that
they knew the plan very well.
It was the only region where India’s plan did
not have the highest proportion of respon-
dents knowing it very well. In fact, none of
the respondents in the region knew the plan
very well. Similar to respondents in Asia-
Pacific, the least-known plan was Brazil’s
Projeto Crescer (Growth Project).
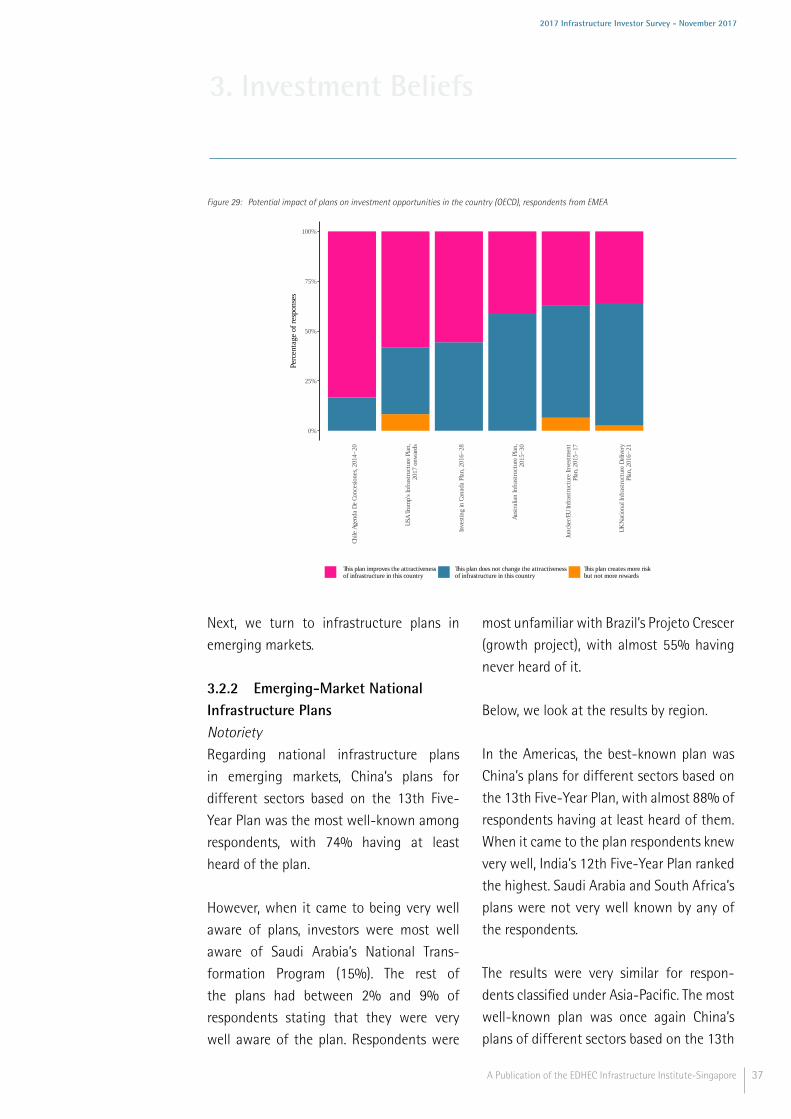
EffectivenessNext, we turn to the potential impact of
emerging markets’ national infrastructure
plans on investment opportunities in the
respective countries.
The support shown by respondents for the
plans in emerging markets is quite signif-
icant and even more so than that for the
plans in OECD countries.
The percentage of respondents who felt
that the plans improved the attractiveness
of infrastructure in the country ranged
between 42% and 64%. For Saudi Arabia’s
National Transformation Program more
than half of the respondents (64%) were
convinced about the plan’s effectiveness.
There was also significant support for
both Brazil’s and South Africa’s plans,
with 50% of respondents for each plan
stating that they felt the plans improved
the attractiveness of infrastructure in the
country.
A small percentage of the respondents felt
that the plans in India, Indonesia, Saudi
Arabia, and South Africa create more risks
but not rewards.
The results vary quite significantly when
responses are broken down by region.
Respondents classified under the Americas
were equally split on whether the plans in
China, Indonesia, and South Africa improved
the attractiveness of infrastructure in the
country. For India, Indonesia, and Saudi
Arabia’s plans, a small proportion of the
respondents believed that the plans in fact
create more risk.
Respondents in Asia-Pacific were extremely
positive about South Africa’s National
Infrastructure Plan, with 100% of respon-
dents believing in the plan’s effectiveness.
However, for India’s and Indonesia’s plans,
some respondents felt that more risk was
created. Respondents were neutral on
the plans in Brazil and China, with all
respondents agreeing that the plans neither
had a positive nor negative impact on
the attractiveness of infrastructure in the
country.
A Publication of the EDHEC Infrastructure Institute-Singapore 39

2017 Infrastructure Investor Survey - November 2017
3. Investment Beliefs
Figure 32: National infrastructure plans, emerging markets (respondents from Asia-Pacific)
0%
25%
50%
75%
100%
Indi
a Tw
elft
h F
ive−
Year
Pla
n,
2012
−17
Indo
nes
ia N
atio
nal
Med
ium
−Te
rmD
evel
opm
ent
Plan
, 201
5−19
Sau
di A
rabi
a, N
atio
nal
Tra
nsf
orm
atio
nPr
ogra
m 2
020
Ch
ina
plan
s fo
r di
ffer
ent
sect
ors
base
don
13t
h F
ive−
Year
Pla
n, 2
016−
20
Sou
th A
fric
a N
atio
nal
Infr
astr
uct
ure
Pl
an, 2
013−
17
Bra
zil P
roje
to C
resc
er (
Gro
wth
Pro
ject
),20
14−
18
Perc
enta
ge o
f re
spon
ses
Very well aware Somewhat, but I don't know the full details
I have heard of it but not much more
Never heard of it
How well do you know these emerging−market national infrastructure plans? (respondents from Asia−Pacific)
Figure 33: National infrastructure plans, emerging markets (respondents from EMEA)
0%
25%
50%
75%
100%
Sau
di A
rabi
a, N
atio
nal
Tra
nsf
orm
atio
nPr
ogra
m 2
020
Ch
ina
plan
s fo
r di
ffer
ent
sect
ors
base
don
13t
h F
ive−
Year
Pla
n, 2
016−
20
Indo
nes
ia N
atio
nal
Med
ium
−Te
rmD
evel
opm
ent
Plan
, 201
5−19
Sou
th A
fric
a N
atio
nal
Infr
astr
uct
ure
Pl
an, 2
013−
17
Indi
a Tw
elft
h F
ive−
Year
Pla
n,
2012
−17
Bra
zil P
roje
to C
resc
er (
Gro
wth
Pro
ject
),20
14−
18
Perc
enta
ge o
f re
spon
ses
Very well aware Somewhat, but I don't know the full details
I have heard of it but not much more
Never heard of it
How well do you know these emerging−market national infrastructure plans? (respondents from EMEA)
40 A Publication of the EDHEC Infrastructure Institute-Singapore

2017 Infrastructure Investor Survey - November 2017
3. Investment Beliefs
Figure 34: Potential impact of plans on investment opportunities in the country (emerging markets)
0%
25%
50%
75%
100%
Sau
di A
rabi
a, N
atio
nal
Tra
nsf
orm
atio
nPr
ogra
m 2
020
Bra
zil P
roje
to C
resc
er (
Gro
wth
Pro
ject
),20
14−
18
Sou
th A
fric
a N
atio
nal
Infr
astr
uct
ure
Pl
an, 2
013−
17
Ch
ina
plan
s fo
r di
ffer
ent
sect
ors
base
don
13t
h F
ive−
Year
Pla
n, 2
016−
20
Indo
nes
ia N
atio
nal
Med
ium
−Te
rmD
evel
opm
ent
Plan
, 201
5−19
Indi
a Tw
elft
h F
ive−
Year
Pla
n,
2012
−17
Perc
enta
ge o
f re
spon
ses
This plan improves the attractiveness of infrastructure in this country
This plan does not change the attractiveness of infrastructure in this country
This plan creates more risk but not more rewards
Figure 35: Potential impact of plans on investment opportunities in the country (emerging markets), respondents from America
0%
25%
50%
75%
100%
Ch
ina
plan
s fo
r di
ffer
ent
sect
ors
base
don
13t
h F
ive−
Year
Pla
n, 2
016−
20
Indo
nes
ia N
atio
nal
Med
ium
−Te
rmD
evel
opm
ent
Plan
, 201
5−19
Sou
th A
fric
a N
atio
nal
Infr
astr
uct
ure
Pl
an, 2
013−
17
Bra
zil P
roje
to C
resc
er (
Gro
wth
Pro
ject
),20
14−
18
Indi
a Tw
elft
h F
ive−
Year
Pla
n,
2012
−17
Sau
di A
rabi
a, N
atio
nal
Tra
nsf
orm
atio
nPr
ogra
m 2
020
Perc
enta
ge o
f re
spon
ses
This plan improves the attractiveness of infrastructure in this country
This plan does not change the attractiveness of infrastructure in this country
This plan creates more risk but not more rewards
A Publication of the EDHEC Infrastructure Institute-Singapore 41

2017 Infrastructure Investor Survey - November 2017
3. Investment Beliefs
Figure 36: Potential impact of plans on investment opportunities in the country (emerging markets), respondents from Asia-Pacific
0%
25%
50%
75%
100%
Sou
th A
fric
a N
atio
nal
Infr
astr
uct
ure
Pl
an, 2
013−
17
Sau
di A
rabi
a, N
atio
nal
Tra
nsf
orm
atio
nPr
ogra
m 2
020
Indo
nes
ia N
atio
nal
Med
ium
−Te
rmD
evel
opm
ent
Plan
, 201
5−19
Indi
a Tw
elft
h F
ive−
Year
Pla
n,
2012
−17
Bra
zil P
roje
to C
resc
er (
Gro
wth
Pro
ject
),20
14−
18
Ch
ina
plan
s fo
r di
ffer
ent
sect
ors
base
don
13t
h F
ive−
Year
Pla
n, 2
016−
20
Perc
enta
ge o
f re
spon
ses
This plan improves the attractiveness of infrastructure in this country
This plan does not change the attractiveness of infrastructure in this country
This plan creates more risk but not more rewards
Lastly, respondents under EMEA were once
again the most positive about the plans.
Brazil’s Projeto Crescer and Saudi Arabia’s
National Transformation Program had the
most positive response, with 75% and 80%
of respondents, respectively, stating that the
plan is beneficial to the attractiveness of
infrastructure in the country.
In conclusion, national infrastructure plans
currently do not seem to be a main focus
of most respondents when it comes to
infrastructure investment. The proportion
of respondents who are very well aware
of the plans make up the minority. This
is especially so when it comes to plans in
emerging markets. However, when respon-
dents are familiar with the plans they do
show notable support for them, with most
of the plans having close to or at least half
of the respondents stating that it improves
the attractiveness of infrastructure in the
country. In this aspect, respondents showed
greater confidence in the plans of emerging
markets, as opposed to those in OECD
countries.
Thus, noting the support shown among
respondents aware of the plans, there
is significant potential in governments
creating greater awareness of their national
infrastructure plans.
3.3 Quality of IntermediationIn this section, we review the answers to
three simple questions that touch on the
quality of intermediaries for infrastructure
investors, especially asset owners.
42 A Publication of the EDHEC Infrastructure Institute-Singapore

2017 Infrastructure Investor Survey - November 2017
3. Investment Beliefs
Figure 37: Potential impact of plans on investment opportunities in the country (emerging markets), respondents from EMEA
0%
25%
50%
75%
100%
Sau
di A
rabi
a, N
atio
nal
Tra
nsf
orm
atio
nPr
ogra
m 2
020
Bra
zil P
roje
to C
resc
er (
Gro
wth
Pro
ject
),20
14−
18
Ch
ina
plan
s fo
r di
ffer
ent
sect
ors
base
don
13t
h F
ive−
Year
Pla
n, 2
016−
20
Indi
a Tw
elft
h F
ive−
Year
Pla
n,
2012
−17
Indo
nes
ia N
atio
nal
Med
ium
−Te
rmD
evel
opm
ent
Plan
, 201
5−19
Sou
th A
fric
a N
atio
nal
Infr
astr
uct
ure
Pl
an, 2
013−
17
Perc
enta
ge o
f re
spon
ses
This plan improves the attractiveness of infrastructure in this country
This plan does not change the attractiveness of infrastructure in this country
This plan creates more risk but not more rewards
We asked about the role of so-called
preparation facilities created by multilateral
development banks (MDBs) to help public-
private partnerships (PPPs) take place in
emerging markets. We also asked about
confidence in credit rating agencies and also
in the kind of terminology used to denote
private investment categories.
3.3.1 PPP Preparation FacilitiesBecause multilateral development banks
regard project preparation as critical to
increasing the pipeline of infrastructure
projects in emerging markets, it is useful to
see how beneficial the assistance provided
by these project preparation facilities (PPFs)
has been.
The majority of respondents had not partic-
ipated in a project supported by a multi-
lateral development bank PPF.
Of those who had, more than half felt
that the MDB/PPF added considerable value,
citing risk mitigation as a major reason why.
Additionally, respondents felt that these
intermediaries help to fill gaps where the
governments do not have an organised
project-preparation structure in place.
Respondents who felt these intermediaries
were not as helpful raised concerns such as
a greater need to tailor the assistance to the
local context and the limitation of MDB’s
leverage to the central government level.
Focusing on respondents who selected
emerging markets as their geographic focus,
A Publication of the EDHEC Infrastructure Institute-Singapore 43

2017 Infrastructure Investor Survey - November 2017
3. Investment Beliefs
Figure 38: Quality of assistance in MDB/PPF supported projects
No, I haven't 61.9%
Yes, the MDB/PPF added considerable value 23.8%
Yes, but the MDB/PPF was of limited help 14.3%
Have you participated in a project supported by a multilateral development bank project preparation facility?
If so, what is your opinion on the quality of assistance provided?
the majority felt that it was valuable to
have assistance from theMDB/PPF in project
preparation.
3.3.2 RatingsRespondents’ views on rating agencies’
approach to rating infrastructure project
finance debt was very consensual.
The approach of these agencies is not
only relevant to individual issues but also
to the creation of the next generation
of infrastructure-project-debt-structured
products, akin to CDO (collateralised debt
obligation) structures, which will require a
robust understanding of credit risk within
a portfolio of private debt on the part of
rating agencies.
We asked whether respondents believed
in the assessment criteria used by rating
agencies and for views on the overall relia-
bility of these ratings.
The majority of respondents were
comfortable with the approach taken
by rating agencies in rating infrastructure-
project-finance debt.
However, respondents reflected concerns
on the limitations of rating methodologies’
comprehensiveness. For instance, there is
a stronger focus on rating infrastructure
projects in the OECD, which would limit
usefulness when evaluating pooled infras-
tructure assets.
3.3.3 Core or Core Plus?Finally, when it comes to defining infras-
tructure, certain terminologies can be more
effective than others when reflecting the
risk-and-return profile of assets.
44 A Publication of the EDHEC Infrastructure Institute-Singapore

2017 Infrastructure Investor Survey - November 2017
3. Investment Beliefs
Figure 39: Infrastructure project finance ratings
Yes 70%
No 10%
I don't know 20%
Are you comfortable with ratings agencies' approach to rating infrastructure project finance?
Figure 40: Infrastructure terminology
0%
25%
50%
75%
100%
Ass
et m
anag
ers
Ass
et o
wn
ers
Com
mer
cial
an
d in
tern
atio
nal
ban
ks
Oth
er
Perc
enta
ge o
f re
spon
ses
I don't mind It is confusing It is not helpful
Usefulness of describing infrastructure as ''core'' or ''core plus'' over sectors or business models
A Publication of the EDHEC Infrastructure Institute-Singapore 45

2017 Infrastructure Investor Survey - November 2017
3. Investment Beliefs
We asked about the use of “core” and
“core plus” as standard labels attached
by managers to infrastructure assets or
investment strategies. Such terms can be a
cause for concern on at least two counts:
1. They do not help with the integration
of infrastructure investments at the
total-portfolio level since they are not
standardised financial metrics like the
Sharpe ratio; and
2. They have often been directly translated
from the real estate universe, and infras-
tructure does not share the economic
characteristics of real estate. It is not a
store of value, and investors often do not
own the tangible infrastructure, instead
their asset is a long-term contract with
the public sector (see Blanc-Brude, 2013,
for a detailed discussion).
Moreover, there is no universally agreed-
upon definition of what “core infras-
tructure” is. It is easy to argue that the
use of such terms contributes to increasing
the information asymmetry between asset
owners and their managers.
Still, about 70% of respondents “do not
mind” such terms, while roughly 15%
think they are not helpful and another
15% consider these terms to be actively
“confusing.”
Perhaps surprisingly, these proportions are
constant among asset owners and asset
managers.
Only banks reported greater dissatisfaction
with the terms, with more than 60% of
respondents in this group finding this choice
of terminology confusing.
3.4 Data GapsA last set of general questions focused on
identifying improvements to infrastructure-
investment metrics.
3.4.1 Operational DataJust under half (46%) of respondents believe
that the lack of operational, firm-level data
can be a limiting factor for new investment
in infrastructure.
However, 28% do not, while the remaining
respondents are undecided.
Asset owners and banks were most inclined
to find that there is a lack of operational,
firm-level data, a sentiment shared by more
than 50% of each of those groups. This
is consistent with the information needs
of long-term direct investors who intend
to keep assets for extended periods and
therefore value operational data at the
onset. Banks also need operational data to
make lending decisions, which are often
based on detailed financial models of the
borrower.
Conversely, less than half of infrastructure
asset managers felt that a lack of detailed
operational performance was a pressure on
new investments taking place.
46 A Publication of the EDHEC Infrastructure Institute-Singapore

2017 Infrastructure Investor Survey - November 2017
3. Investment Beliefs
Figure 41: Operational, firm-level data
0%
25%
50%
75%
100%
Ass
et m
anag
ers
Ass
et o
wn
ers
Com
mer
cial
an
d in
tern
atio
nal
ban
ks
Oth
er
Perc
enta
ge o
f re
spon
ses
I don’t know No Yes
Does a lack of operational, firm−level data limit new investment in infrastructure?
Still, a majority of respondents (84%)
agree that benchmarking operational
performance, on top of financial perfor-
mance, would add value for infrastructure
investors.
Next, we asked about which types of opera-
tional data would be most useful to infras-
tructure investors in increased availability.
The responses reported in figure 43 show
that most respondents would like to see
better data in all areas.
Traffic/demand data comes first by a small
margin. Indeed, traffic risk is a well-
documented source of failure in infras-
tructure projects. But construction risk,
operating efficiency, or the cause and
consequences of material events are equally
high on the list of topics that could be better
documented.
3.4.2 Financial Performance DataFinally, with regard to financial perfor-
mance, respondents were asked to choose
which financial-performance metrics are
most needed for supporting the growth of
the infrastructure asset class.
Here, responses are less balanced. Respon-
dents selected time-weighted returns as the
most important metric, followed by risk-
adjusted returns (Sharpe ratio), and money-
weighted returns. Extreme risk metrics such
as value-at-risk or maximum drawdown
also ranked high on the list.
Several respondents also indicated their
need for better benchmarking of returns
beyond individual project performance.
A Publication of the EDHEC Infrastructure Institute-Singapore 47

2017 Infrastructure Investor Survey - November 2017
3. Investment Beliefs
Figure 42: Value of benchmarking operational performance
0%
25%
50%
75%
100%
Ass
et m
anag
ers
Ass
et o
wn
ers
Com
mer
cial
an
d in
tern
atio
nal
ban
ks
Oth
er
Perc
enta
ge o
f re
spon
ses
I don't knowNo, financial performance reporting is alreadysufficient for most investors
Yes, it would add value
Would benchmarking operational performance as well as financial performance add value for infrastructure investors?
Figure 43: Operational data availability
Traffic/ demand data in different markets 23%
Operating efficiency in different industrial sectors
16%
Expected and realised unit
construction and operating costs
19%
Productive efficiency (output measures) 19%
Data on ''material'' events (accidents, failures, contract negotiation, refinancings, etc.) 20%
Other 4%
Most useful improvements to operational data availability
48 A Publication of the EDHEC Infrastructure Institute-Singapore

2017 Infrastructure Investor Survey - November 2017
3. Investment Beliefs
Figure 44: Financial performance metrics
Time−weighted returns 29%Money−weighted returns
17%
Sharpe ratio(risk−adjusted
performance) 20%
Value at risk 13%
Sortino ratio 2%
Maximum drawdown 10%
Factor attribution (Fama−French, etc) 5%
Other 4%
Financial performance metrics most needed to support the growth of the infrastructure asset class
Other general data gaps identified by
respondents include data on the role and
performance of public authorities in infras-
tructure projects. Data related to environ-
mental and social governance (ESG) was
also an important consideration for some
respondents.
In conclusion, several improvements can be
made to information availability on infras-
tructure investment and to promote infras-
tructure investment.
The majority of respondents believe that
operational, firm-level data should be
provided to encourage investment in
infrastructure. Respondents would like
to see better data in most dimensions of
operational data.
In terms of financial metrics, the demand
for proper metrics identified in the 2016
EDHEC/GIH survey remains, with a focus on
producing time-weighted and risk-adjusted
return measures.
This last data gap is now being filled with
the launch of the EDHECinfra infrastructure
equity and debt benchmarks which include
all the relevant metrics of risk and financial
performance mentioned by the respondents
to this survey.
A Publication of the EDHEC Infrastructure Institute-Singapore 49

4. Willingness to Invest
50 A Publication of the EDHEC Infrastructure Institute-Singapore

2017 Infrastructure Investor Survey - November 2017
4. Willingness to Invest
In this section, we provide a brief formali-
sation of the notion of contingent valuation
(CV), specifically examining willingness toinvest (WTI), that is, the decision for a repre-
sentative investor i to agree to invest in a
new asset at an expected rate of return of
r∗.
This framework motivates our choice to
design this survey to elicit responses about
the level of investment returns required by
investors of different kinds to agree to invest
in infrastructure companies or products.
Very few examples of empirical WTI studies
exist. Aguilar (2009) and Aguilar and Cai
(2010) use ordinal utility models to examine
investors’ WTI. Aguilar (2009) examined
what characteristics impact on the WTI in
wood-based energy products in the United
States. While Aguilar and Cai (2010) examine
the characteristics that impact on the
investment in different types of renewable
energy. Neither studies examine the impact
of returns on WTI or how the characteristics
of the assets impact the return demanded
by investors.
To our knowledge, this is the first study
which applies this approach to private
equity and debt investments.
In what follows, we briefly describe the
standard CV willingness-to-pay (WTP)
framework (4.1) and its extension to
capture investors’ willingness to invest
(4.2). We then describe the survey design
and methodology used to interpret the
responses (4.3).
4.1 Stated Preferences andWillingness to PayWhen investors buy and sell assets at a
given price, their decision to invest can be
said to “reveal” their preferences about the
risk/return trade-off of a given investment.
When assets are highly illiquid and seldom
traded, as is the case of private infras-
tructure equity, investors’ preferences are
not revealed often enough to build time
series of asset prices. However, we can
rely on an alternative framework, aimed at
eliciting “stated preferences” from investors.
Until now, this approach has been used
to estimate the willingness to pay or
willingness to accept a certain price
or situation when no market exists to
document individual preferences.
Typical examples have included cases of
environmental degradation in which a loss
of value had to be estimated by a court,
or public policy decisions with respect to
common goods such as the preservation of
public parks or water bodies.
The CV willingness-to-pay methodology
was first used in the 1950s to value
outdoor recreation facilities. But it was only
in the 1970s and 1980s that contingent
valuation started to be widely accepted as
a methodology to value nonmarket goods
(see Bateman and Willis, 1999, for a review).
The Exxon Valdez disaster was instrumental
in publicising and improving the method-
ology for the valuation of nonmarket goods.
A Publication of the EDHEC Infrastructure Institute-Singapore 51

2017 Infrastructure Investor Survey - November 2017
4. Willingness to Invest
In their report on the disaster, Carson et al.
(1992) were able to estimate the noneco-
nomic use costs of the disaster by employing
CV analysis WTP methodology.
WTP asks a respondent how much they are
willing to forgo in order for a nonmarket
good to be provided. After the Carson et al.
(1992) report, issues were raised in the
appropriateness of CVmethodology to value
nonmarket goods. In the United States, CV
methods were used to assess damages, and
it was important to establish that they were
appropriate.
The National Oceanic and Atmosphere
Administration (NOAA) then famously
commissioned a report from Nobel
Laureates Kenneth Arrow and Robert
Solow. The Arrow et al. (1993) report
validated the methodology and produced
a set of guidelines to implement it. This
qualified support of the CV methodology
has resulted in a multitude of applications
of the CV methodology. Carson (2012)
identifies thousands of CV studies in over
130 different countries.
4.1.1 Economic Theory of ContingentValuationCV methods start with the assumption that
all economic agents have a utility function
that includes their preferences for market
goods, X and nonmarket goods, Q.
This can be represented by a utility function
given as U = f(X, Q), where X and Q are
vectors of market and nonmarket goods,
respectively.
Income, y, is allocated to the purchase of
market goods, with the agent maximising
their utility for a given price vector, p, andlevel of nonmarket goods, Q.
The choice of X that maximises U is a
function of prices, income, and desired level
of Q, otherwise described as X(p, Q, y).
Hence, themaximum utility available for the
given level of prices, income, and level of Qdemand is written:
U(p, Q, y) = f[X(p, Q, y), Q]
otherwise defined as the indirect utility
function.
If the agent desires a higher level of the
nonmarket good Q1 ≥ Q0, then the
following equation must hold:
U(p, Q0, y) = U(p, Q1, y−WTP)
WTP is thus themaximum level of income an
agent is willing to forgo to ensure that the
level of Q demanded of the nonmarket good
remains at least as high as Q0.(see Carson
and Willis, 1999, for a detailed discussion
of the economic underpinnings of WTP
models.)
In other words, WTP is the amount an
economic agent is willing to forgo to
maintain their current level of utility.
We now extend this proposition to an
investment framework.
52 A Publication of the EDHEC Infrastructure Institute-Singapore

2017 Infrastructure Investor Survey - November 2017
4. Willingness to Invest
4.2 Willingness to InvestWhile infrastructure investments are not,
strictly speaking, nonmarket goods, they can
be said to be very illiquid. Deal lead times
are long, transaction costs are high, and at
any point in time, few assets are available to
invest in.
As a result, since investor preferences are
seldom revealed in market transactions,
asking investors to state their preferences
can be a valid approach to understanding
the formation of prices for infrastructure
assets.
In particular, since private infrastructure
markets can be said to be “incomplete,”
there typically exists a range of prices that
apply to a single infrastructure investment,
depending on investor preferences. In other
words, in highly illiquid private markets, the
law of one price does not apply, and the
bid-ask spread can remain significant at all
points in time.
WTP methods apply to absent markets: bydefinition there is no trading of nonmarket
goods. Their application to incomplete
markets, however, is straightforward, and
if trading is very infrequent as is the case
for infrastructure, they are equally powerful
there.
Like the economic agents considered by
Arrow et al. (1993), investors are expected
utility maximisers and should be solely
concerned with the risk-adjusted level of
their portfolio returns, that is, the excess
return (above the risk-free rate) per unit of
risk taken (Sharpe, 1964).
Say an investor has a time-invariant utility
function U, and wealth at time t of Wt. At
the beginning of the period (denoted by t =0), expected utility from the consumption
of the investor’s wealth at the end of the
period (t = 1) is written U = U(W1).
This wealth is invested, so W1 = W0(1 +
Rp) with Rp representing the return on the
investor’s portfolio over the period.
Hence, investor utility is a function of initial
wealth W0 and Rp, or U = U(W0, Rp).
The investor’s willingness to invest in a
new asset returning r∗ can be captured by
comparing the return of Rpwith that of Rp∗,the portfolio of the investor including the
new asset, written:
Rp∗ = Rp+ a(r∗ − Rp)
where a is the weight in percentage (the
proportion of wealth) invested in the new
asset. 77 - The new portfolio return is writtenRp∗ = (1 − a)Rp + ar∗ . Sincethe weights add up to 1, we can easilywrite Rp∗ = Rp+ a(r∗ − Rp). For the investor to wish to invest in the
new asset at the price P, its marginal contri-
bution must be a nonnegative change in
utility. The indifference condition is:
U(W0, Rp) = U(W0 − P0, Rp∗)
where P0 is the maximum price of the new
asset at the beginning of the period. If we
define
r∗ =P1 − P0P0
A Publication of the EDHEC Infrastructure Institute-Singapore 53

2017 Infrastructure Investor Survey - November 2017
4. Willingness to Invest
we also have
P0 =P1r∗
− 1 = wti(r∗)
with wti(.), the investor’s willingness-to-
invest function, increasing in r∗.
Replacing the condition to accept a new
investment, we have
U(W0, Rp) = U(W0 − wti(r∗), Rp∗)
where r∗ is the minimum return acceptable
to agree to invest in the new asset, given
investor risk preferences.
Indeed, while investors always prefer a
higher utility, they are also risk averse, that
is, taking more risk reduces utility by some
factor.
For a given level of Rp the investor always
prefers a lower value of Sp, the portfolio risk
measure. Sp is written:
Sp = {σp+2a(ρ−σp)+a2(v1−2ρ+σr∗)}12
where σp and σr∗ are the risk measures of
the initial portfolio and the new asset and ρis the correlation measure.
The marginal risk contribution of the new
asset to the portfolio, which will determine
the WTI, is determined by its correlation ρwith the portfolio return and the riskiness
of the new asset itself, σr∗ .
Hence, given investor risk (and other)
preferences, the marginal contribution
of the new asset can be estimated by
bidding successive price / expected-return
levels until the condition defined above is
satisfied.
4.3 Survey Design andMethodologyIn this section, we describe the opera-
tionalisation of the simple theoretical
framework highlighted above. We address
two important aspects of the methodology,
the integration of preference uncertainty
in the question design and the statistical
estimation of the results from the survey
responses.
4.3.1 Uncertainty about ValueThe conditions for an investor to agree to
investing in a new asset described above
imply that she knows exactly what the
characteristics of her portfolio are, as well as
those of the new asset, and thus can answer
the question “would you agree to invest at
the rate of return X?” without hesitation.
In practice, this is unlikely to be the
case. In particular, when describing private
infrastructure investment opportunities in
the context of a CVM survey, we cannot
provide respondents with metrics such as
the investment’s Sharpe ratio or its corre-
lation with the initial portfolio.
Instead, we describe a realistic but generic
private investment opportunity in infras-
tructure. Questions follow a matrix of key
characteristics such as the type of business
model, lifecycle stage, and geography
that we wish to control for, as well as
certain static parameters like company size
and leverage; the rest of the question is
generated randomly from a bank of project
or product descriptions, including the
investment country and sector.
54 A Publication of the EDHEC Infrastructure Institute-Singapore

2017 Infrastructure Investor Survey - November 2017
4. Willingness to Invest
Thus, we remove potential respondent
biases toward certain countries or sectors
that might systematically impact responses.
For instance, Spanish toll roads experienced
a wave of bankruptcies in recent years
and this would be likely to bias responses
if the OECD/equity/merchant infrastructure
question is always a Spain question.
As a result, each question is about an
investment proposal which can be too
generic to answer with certainty (“Would
you invest? yes or no”) at various levels of
r∗.
Instead, respondents are presented with an
investment proposal which is designed to
trigger what you might call “risk reflexes”
in seasoned infrastructure investors; for
instance:
“Say that you are offered the
opportunity to invest in a 25
km sewer tunnel in the UK. The
construction is expected to take
up to 8 years and will cost an
estimated GBP 4.2 billion. Debt
financing consists of a GBP 700
million, 35 year loan.”
or
“Say that you are offered the
opportunity to invest in a wireless
network asset in Nicaragua that
has been operating for 16 years.
The government stake in the asset
was sold to a private party 3
years ago. About a year later,
the private party acquired almost
all of the remaining share from
other private investors, eventually
holding a 99.03% stake in the
company . . .
Would you be willing to invest
equity in this project at the
average expected nominal return
(IRR) of . . .”
Given the nature of the question asked,
most respondents would want to know
more information before actually investing
and would be uncertain about their precise,
actual required rate of return.
Nevertheless, they should also be able to
give reasonable return bounds given their
investment experience, preferences, and the
question being asked.
The premise behind our question design is
that the average investor (with the average
risk aversion) will be able to recognise a
good deal (or bad one) when they see one.
4.3.2 Question DesignQuestions askedwere tailored to the respon-
dents’ self-identified expertise or interests.
As discussed in section 2, before the infras-
tructure questions were provided, respon-
dents were asked to identify their interest
in infrastructure markets, either debt or
equity, emerging markets or OECD, and
A Publication of the EDHEC Infrastructure Institute-Singapore 55

2017 Infrastructure Investor Survey - November 2017
4. Willingness to Invest
Figure 45: Example question format
either infrastructure assets or infrastructure
products.
The general form of the questions provided
is displayed below in figure 45. The scenario
provided a brief description of the project
with a brief summary of important risk
information regarding country, revenue risk,
capital structure, and currency of returns.
Willingness to invest is expressed in terms
of internal rate of return (IRR) since it
remains a standard manner of presenting an
investment proposition to an investor in the
private asset space.
The question format allowed the respondent
to select their preference for investing in the
project for a given internal rate of return
(IRR). A broad IRR range was intentionally
set to ensure it encompassed all required
possibilities.
These preferences ranged from “definitely
no” to “definitely yes” with three other
options that allowed the respondent to
express uncertainty at a given IRR. 88 - The responses collected are ordinalin nature. However, we need cardinalvalues to identify the WTI in highlyilliquid private infrastructure assets.Welsh and Bishop (1993) show thatcardinal contingent-valuation prefer-ences can be obtained from ordinalpreferences if a two-stage “refer-endum approach” is adopted. First,respondents are asked to select adollar value that theywould bewillingto pay for a nonmarket good. Then,respondents are asked to providetheir certainty level for the dollarvalue they chose for the nonmarketgood.Welsh and Poe (1998).
This method is referred to as the multiple
bounded discrete choice (MBDC) question
format, borrowing from both payment-card
and discrete-choice contingent-valuation
approaches, both of which are widely recog-
nised and mature methodologies employed
in stated preference valuations (Welsh and
Poe, 1998).
Hence, MBDC allows deriving cardinal utility
measures from ordinal preferences, that is,
a range of values that a respondent would
be willing to pay for a certain nonmarket or
illiquid good.
4.3.3 Response CodingThe zone where an investor reveals their
willingness to invest is found at the point
where they switch from being unwilling to
being willing to invest.
For a given investment opportunity, for
investor i, XiL is the lower bound of r∗ below
which the investor would not agree to
invest.
XiU is the upper bound of r∗ from which
the investor would agree to invest. We can
assume that wtii lies between [XiL, XiU].
56 A Publication of the EDHEC Infrastructure Institute-Singapore

2017 Infrastructure Investor Survey - November 2017
4. Willingness to Invest
Next, employing different switching
intervals for the response choices allows
controlling for levels of uncertainty and
deriving valuation bounds.
The upper bound represents the IRR level at
which an investor would be in agreement to
buy the new asset.
We code it as responses “probably yes” and
“definitely yes.” All other responses at the
quoted IRRs for that investment can be
taken to indicate that the investor is notsure he is willing to invest.
The lower bound represents the IRR below
which investors are not willing to buy the
new asset and have answered “probably
no” and “definitely no” for a given IRR. All
other responses at quoted IRRs for that
respondent can be considered to indicate
she might be willing to invest.
Thus, the bounds we derive have a direct
interpretation as the bid and ask prices
prevalent in a given market at the time of
the survey, that is, these are the “good deal
bounds” described in the theory of asset
pricing in incomplete markets.
4.3.4 Probabilities EstimationFollowing Welsh and Poe (1998), the log-
likelihood function of allowing for the
determination of the switching boundary is
written:
ln(L) =n∑i=1
ln[F(XiU; β)− F(XiL; β)] (4.1)
where L is the log-likelihood and F(XiU; β)−F(XiL; β) is the probability that the WTI
falls between a range of an upper bound,
F(XiU; β), and a lower bound, F(XiL; β).
To estimate the WTI, a logit regression is
conducted on the data using the following
form: 9
9 - A logit regression uses categoricaldata as the dependent variable. Forthis analysis 0 or 1 is employedas the dependent variable indicatingwhether or not an IRR was selected.
Indicator = αi + β0,iX+ β1,iY (4.2)
where Indicator is a binary-choice variable
taking the value 0 for “no” or 1 for “yes,”
when the respondent is willing to accept a
given level of IRR; X is the quoted IRR that
the respondent chose; Y is matrix of control
variables for respondent types.
Once the logit regression results have been
obtained, regression coefficients give us two
outputs.
The first is the mean WTI, given by the
formula:
WTI =−Xβ′ + α
β0(4.3)
where −Xβ′ is the sum of the average
value of the observed control variables in
the sample multiplied by their regression
coefficients, and β0 is the regression coeffi-
cient for the IRR variable in the regression.
α, in this case is the intercept of the logit
regression. 1010 - To develop confidence intervalsfor the mean WTI, we apply theKrinsky and Robb (1986a) and Krinskyand Robb (1986b) bootstrappingapproach.
To estimate the WTI for specific target
groups, we replace the average value of the
A Publication of the EDHEC Infrastructure Institute-Singapore 57

2017 Infrastructure Investor Survey - November 2017
4. Willingness to Invest
observed control variable with that of the
value for the specific target group’s variable.
For instance when estimating the WTI for
a greenfield asset, we replace the average
of all the greenfield indicator dummies with
that of one to estimate the WTI.
The second output from the regression
allows inferring the probability of observing
a positive willingness to invest among the
sample of respondents at different levels of
expected returns. The predicted probability
of investment is given by:
Pr(Invest)X = 1 − 11 + exp−(α+β0X+β1Y)
(4.4)
where α, β0 and β1 are the regression
intercept, coefficient on the IRR, and coeffi-
cients for the control variables, and X and Yare defined as above.
In the next section of this paper, we present
both the mean WTI and probability of
investment occurring at set levels of IRRs.
Regression coefficients are provided in the
Appendix.
58 A Publication of the EDHEC Infrastructure Institute-Singapore

5. Return Preferences
A Publication of the EDHEC Infrastructure Institute-Singapore 59

2017 Infrastructure Investor Survey - November 2017
5. Return Preferences
In this chapter, we present the results of
the contingent valuation questions about
the level of returns required by different
investors for different types of infras-
tructure investment.
We report the bounds defined in
section 4.3.3: a lower bound of r∗, below
which investors would not agree to invest
(prices are too high); and an upper bound
of r∗, from which the investor would agreeto invest (prices are “good deals”).
The results presented here focus on the
willingness to invest of the different
groups of survey respondents in OECD and
emerging-market project equity, across
business models and the project lifecycle
(5.1); as well as in different kinds of debt
and equity investment products (5.2).
5.1 Willingness to Invest inInfrastructure Project EquityWe first report the WTI results for infras-
tructure equity in either OECD or emerging
markets, as shown in tables 3 and 4.
On average, in OECD markets the mean
lower and upper bounds for the required
private infrastructure equity IRR are 10.6%
and 12.4%.
The similar range of required returns in
emerging markets is a low IRR bound of
16.9% and a high bound of 19.6% before
investors are willing to invest in private
infrastructure equity.
As these are statistical estimates, they are
themselves uncertain. The 95% confidence
interval of each mean bound value suggests
a maximum required-return range of 9.9%
to 13.7% for OECD infrastructure, and of
15.7% to 22.4% in emerging markets.
As discussed in the previous chapter, this
range can be interpreted as the bid-ask
spread that applies to these assets in a
highly illiquid and incomplete market where
investor preferences determine required
returns as much as market forces.
In the OECD, the private infrastructure
equity bid-ask spread is less than 200 basis
points, whereas in emerging markets it is
closer to 270 basis points.
Investors thus report a broad-market
emerging-market equity premium (over
OECD infrastructure equity) in the 6-7%
range, which is significant.
Finally, we note that required returns for
OECD private equity are very much in line
with the realised returns of the EDHECinfraprivate broad market European infras-
tructure index for 2016. 1111 - Freely available online atedhec.infrastructure.institute.
While each set of results was obtained
using completely different and independent
methodologies, the mean broad market
equity return estimated from stated prefer-
ences (the survey) matches the one derived
from revealed preferences (the EDHECinfraindex).
60 A Publication of the EDHEC Infrastructure Institute-Singapore

2017 Infrastructure Investor Survey - November 2017
5. Return Preferences
Figure 46: Proportion of respondents willing to invest at the required IRR, OECD infrastructure.
25%
50%
75%
100%
0% 10% 20% 30% 40%Required IRR
Pro
port
ion o
f re
sponden
ts
Upper bound Lower bound
Figure 47: Proportion of respondents willing to invest at the required IRR, emerging-market infrastructure.
25%
50%
75%
100%
0% 10% 20% 30% 40%Required IRR
Pro
port
ion o
f re
sponden
ts
Upper bound Lower bound
A Publication of the EDHEC Infrastructure Institute-Singapore 61

2017 Infrastructure Investor Survey - November 2017
5. Return Preferences
Table 3: This table presents the mean and 95% confidence intervals for the IRR demanded by equity investors for an investment in OECDinfrastructure.
Lower UpperMean WTI 10.6% 12.4%95% CI 9.9% - 11.4% 11% - 13.7%
Table 4: This table presents the mean and 95% confidence intervals for the IRR demanded by equity investors for an investment inemerging-market infrastructure.
Lower UpperMean WTI 16.9% 19.6%95% CI 15.7% - 18.2% 16.9% - 22.4%
As discussed in section 4.3.4, the raw
willingness-to-pay data allows computing
a series of probabilities to invest for each
proposed IRR level.
Figures 46 and 47 show upper and lower
limits of the probability that a survey
respondent is willing to invest at a given IRR
in OECD or emerging-market infrastructure
equity, respectively. The data for the results
shown in figures 46 and 47 and others below
can be found in the appendix.
The bounds we find are typical of the
persistent bid-ask spread phenomenon
discussed earlier. At very low levels of
return, most market participants agree that
they would not invest, irrespective of their
nature or preferences or of the details of
the transactions.
At the other end of the return spectrum, the
immensemajority of respondents agree that
they would invest in infrastructure equity
beyond a certain return threshold (e.g., in
the OECD, beyond 30% return, 100% of
respondents are willing to invest equity in
any of the different categories of infras-
tructure firms that were included in the
survey).
In between, differences in investor prefer-
ences create a bid-ask spread which varies in
size. As we will see in the rest of the paper,
sometimes this bid-ask spread can be very
narrow.
We now turn to examining whether the
individual characteristics of infrastructure
assets affect the IRR demanded by investors.
We examine the impact of the project
lifecycle, business model, and investor type.
To ensure our results are not biased, we only
use respondents that answered all of the
same “family” of questions.
5.1.1 Project Life CycleTo test for a project-lifecycle effect, respon-
dents were asked about identical scenarios
in terms of business model and geography,
with the only variation being whether
the investment proposed was greenfield or
brownfield. We defined greenfield assets as
entirely new assets and brownfield assets as
existing assets.
It is usually believed that the green-
field stage of infrastructure projects carries
higher risks and therefore higher risk premia.
A number of surveys, such as Blanc-Brude
62 A Publication of the EDHEC Infrastructure Institute-Singapore

2017 Infrastructure Investor Survey - November 2017
5. Return Preferences
et al. (2016), thus ask a question reflecting
this a priori belief and juxtaposing the two
options in the same question, for example,
“What is the range of expected returns in
a/ Greenfield infrastructure and b/ Brown-
field infrastructure?” Respondents typically
answer that they expect greenfield risk
premia.
However, this a priori should be qualified
for several reasons. First, while construction
risks are nontrivial in infrastructure projects,
they do not necessarily impact investors
requiring risk premia. For instance, equity
investors in project-finance transactions are
mostly protected from construction risk
by a fixed price, date-certain construction
contract, and cost overruns at the project-
company level that have been shown
to be close to zero on average (see
Blanc-Brude and Makovsek, 2014, for an
empirical analysis using ex ante and ex post
construction costs).
Second, the size of construction risks and
any related premium, may not be larger
than risk premia associated with risks in the
postconstruction phase of infrastructure
projects, such as traffic risk or regulatory
changes.
A review of the literature on the sources
of failure of infrastructure projects (Blanc-
Brude, 2013) or of the determinants credit
spreads in project debt (Blanc-Brude
and Ismail, 2013) confirms the view that
construction risks are not the main cause
of failure nor the driver of the cost of debt
in projects.
Finally, and perhaps most fundamentally,
construction risks are almost entirely
idiosyncratic. As such, they are unlikely to
be driving the risk pricing of the average
investor, since they can, in principle, be
diversified away.
Thus, from a portfolio perspective, it can
be argued that the construction risks
associated with the greenfield phase of
infrastructure investments are only one
source of idiosyncratic volatility among
others, which does not tend to affect
equity investors (at least in project finance).
Neither is it the largest source of investment
risk for investors.
Looking at the survey results, the average
willingness to invest in greenfield (GF)
or brownfield (BF) infrastructure equity is
shown in tables 5 and 6.
Survey respondents report continuing to be
willing to invest between 10.5% and 12.4%
with no noticeable greenfield premium. The
regression results in table 15 in the appendix
confirm that the greenfield variable has no
statistically significant explanatory power.
In emerging markets, this average return
is still between 16.9% and 19.8% with,
again, no discernible premium for greenfield
investments.
Figures 48 and 49 demonstrate the lack
of difference between greenfield and other
infrastructure investments. The lines either
overlay each other or the difference is very
small.
A Publication of the EDHEC Infrastructure Institute-Singapore 63

2017 Infrastructure Investor Survey - November 2017
5. Return Preferences
Figure 48: Proportion of respondents willing to invest at the required IRR, OECD, greenfield or other infrastructure.
25%
50%
75%
100%
0% 10% 20% 30% 40%Required IRR
Pro
port
ion o
f re
sponden
ts
Upper all Lower all Upper GF Lower GF
Figure 49: Proportion of respondents willing to invest at the required IRR, emerging markets, greenfield, or other infrastructure.
25%
50%
75%
100%
0% 10% 20% 30% 40%Required IRR
Pro
port
ion o
f re
sponden
ts
Upper all Lower all Upper GF Lower GF
64 A Publication of the EDHEC Infrastructure Institute-Singapore

2017 Infrastructure Investor Survey - November 2017
5. Return Preferences
Table 5: This table presents the average IRR demanded by investors for an investment in greenfield or brownfield OECD infrastructure equity.
Lower all Upper all GF lower GF upper BF lower BF upperMean WTI 10.6% 12.3% 10.8% 12.3% 10.5% 12.4%95% CI 9.9% - 11.4% 11% - 13.7% 9.7% - 11.8% 10.4% -
14.2%9.5% - 11.6% 10.4% -
14.3%GF denotes greenfield, BF denotes brownfield.
Table 6: This table presents the average IRR demanded by investors for an investment in greenfield or brownfield emerging-market infrastructureequity.
Lower all Upper all GF lower GF upper BF lower BF upperMean WTI 16.9% 19.6% 16.9% 19.8% 16.9% 19.4%95% CI 15.7% -
18.2%16.8% -22.4%
15.3% -18.6%
15.9% -23.8%
15.2% -18.8%
15.5% -23.3%
GF denotes greenfield, BF denotes brownfield.
This result will surprise many readers, since it
contradicts the a priori view that greenfield
infrastructure investment should always
carry an additional risk premium.
However, for the reasons highlighted above,
we believe that this is a correct represen-
tation of investors’ actual risk preferences.
Construction risk is project specific, and it
is not necessarily large compared to other
factors impacting the overall business risk of
the firm, such as demand risk.
Why then do respondents to the standard
“greenfield vs. brownfield” question give
a positive value to a supposed greenfield
premium, including in the 2016 EDHEC/GIH
survey?
First, it is not typically the case that such
surveys test for the statistical significance of
any reported difference between greenfield
and brownfield investment. Our 2016 survey
was guilty of the same flaw.
Most importantly, the answer can be found
in the field of behavioural sciences: question
framing. In other words, by asking respon-
dents to give two expected return rates for
two types of infrastructure investments, the
question implies that theymust be different.
Indeed, the notion that construction risks
are high is widespread among infrastructure
practitioners and justifies the framing.
In this survey, instead of juxtaposing the
idea of greenfield and brownfield invest-
ments in a single question and asking
respondents to confirm the a priori belief
that is reinforced by the structure of the
question itself (why ask otherwise?), we ask
respondents to express their views about
detailed investment propositions, including
whether or not they are greenfield projects,
and to express their price preferences
on an investment-by-investment basis,
randomising most of the rest of the text in
the question.
We derive the bounds within which
investors value infrastructure projects,
greenfield or not, and find that whatever
greenfield risk premia some investors may
require (or not), remains within the price
bounds for all possible investments.
A Publication of the EDHEC Infrastructure Institute-Singapore 65

2017 Infrastructure Investor Survey - November 2017
5. Return Preferences
As argued above, from a theoretical
perspective, and relying on peer-reviewed
empirical research, the null hypothesis
should be that the construction-risk
premium is, on average, zero. Our survey
results confirm that this hypothesis cannot,
so far, be rejected.
We next examine the effect the infras-
tructure project’s business model has on the
returns demanded by investors.
5.1.2 Business ModelsThe idea that infrastructure investments
should be categorised by business models
and not by industrial sectors was first put
forward in Blanc-Brude (2014).
The argument draws from simple finance
theory: business models can be expected to
correspond to systematic sources of risk in
infrastructure investments whereas indus-
trial sectors cannot.
This view has since become widely adopted
by investors and prudential regulators (see
for instance EIOPA, 2016).
Simply put, infrastructure firms can derive a
contracted, merchant, or regulated income
stream, and their size, financial structure,
debt covenants, and in fine their business-
risk profile can be expected to reflect this.
In the 2016 EDHEC/GIH survey, respon-
dents reported a higher rate of return
for merchant infrastructure over both
contracted and regulated infrastructure.
Likewise, this question suffered from a
degree of framing driven by the a priori
belief that business models carry different
levels of systematic business risk.
This a priori, however, is supported by
finance theory.
We also find support for this conclusion in
this survey: the range of IRRs demanded
by investors to make them willing to invest
in merchant infrastructure is significantly
higher than for contracted or regulated
infrastructure.
Tables 7 and 8 show the mean values of the
lower and upper IRR bounds for the three
business models for OECD and emerging-
market infrastructure, respectively.
Investors demand a premium of about
150 basis points to invest in merchant
infrastructure in both emerging market
and the OECD. This is consistent with our
2016 survey results in which respondents
reported a very small, possibly insignificant
difference in expected returns between
OECD and emerging-market merchant
infrastructure.
Figures 50 and 51 illustrate these results
and show that at each required IRR level
there is a lower probability that any respon-
dents would be willing to invest in merchant
infrastructure rather than all other infras-
tructure types.
5.1.3 Investor TypeNext, we examine the expected returns
required by different types of investors for
66 A Publication of the EDHEC Infrastructure Institute-Singapore

2017 Infrastructure Investor Survey - November 2017
5. Return Preferences
Figure 50: Proportion of respondents willing to invest at the required IRR, OECD, merchant or other infrastructure.
0%
25%
50%
75%
100%
0% 10% 20% 30% 40%Required IRR
Pro
port
ion o
f re
sponden
ts
Upper all Lower all Upper mer Lower mer
Figure 51: Proportion of respondents willing to invest at the required IRR, emerging markets, merchant or other infrastructure.
25%
50%
75%
100%
0% 10% 20% 30% 40%Required IRR
Pro
port
ion o
f re
sponden
ts
Upper all Lower all Upper mer Lower mer
A Publication of the EDHEC Infrastructure Institute-Singapore 67
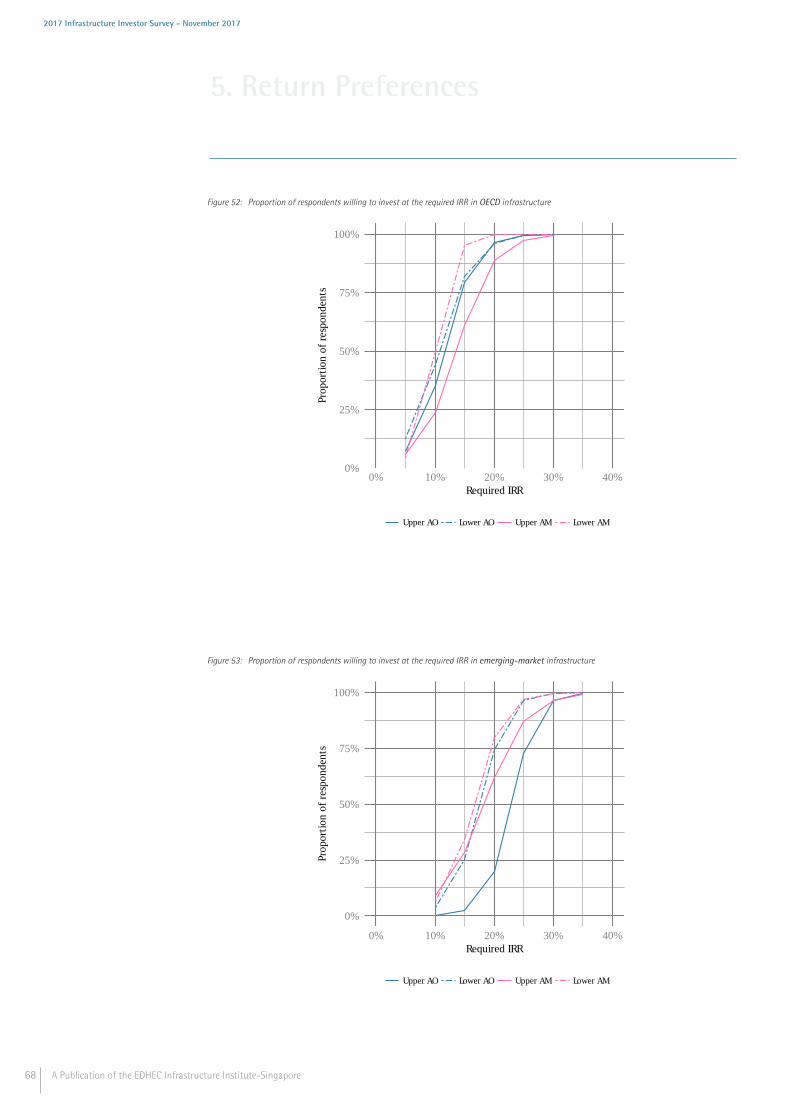
2017 Infrastructure Investor Survey - November 2017
5. Return Preferences
Figure 52: Proportion of respondents willing to invest at the required IRR in OECD infrastructure
0%
25%
50%
75%
100%
0% 10% 20% 30% 40%Required IRR
Pro
port
ion o
f re
sponden
ts
Upper AO Lower AO Upper AM Lower AM
Figure 53: Proportion of respondents willing to invest at the required IRR in emerging-market infrastructure
0%
25%
50%
75%
100%
0% 10% 20% 30% 40%Required IRR
Pro
port
ion o
f re
sponden
ts
Upper AO Lower AO Upper AM Lower AM
68 A Publication of the EDHEC Infrastructure Institute-Singapore

2017 Infrastructure Investor Survey - November 2017
5. Return Preferences
Table 7: This table presents the average IRR demanded by investors for an investment in OECD infrastructure equity by business model.
Lower all Upper all Conlower
Conupper
Merlower
Merupper
Reglower
Regupper
Mean WTI 10.7% 12.4% 10.3% 12.3% 12.2% 13.8% 11.4% 12.6%95% CI 10.1% -
11.3%11.2% -13.6%
9.3% -11.4%
10.3% -14.4%
10.9% -13.4%
11.5% -16.1%
9.5% -13.3%
9% -16%
Con denotes contracted infrastructure; Mer is merchant infrastructure; and Reg is regulated infrastructure.
Table 8: This table presents the average IRR demanded by investors for an investment in emerging-market infrastructure equity by business model.
Lower all Upper all Conlower
Conupper
Merlower
Merupper
Reglower
Regupper
Mean WTI 16.9% 19.7% 16% 17.5% 18.2% 21.3% 18.7% 23.9%95% CI 15.8% -
18.1%17.1% -22.2%
14% -18.1%
13.3% -21.8%
16% -20.4%
16.4% -26.2%
15.2% -22.2%
16.2% -31.6%
Con denotes contracted infrastructure; Mer is merchant infrastructure; and Reg is regulated infrastructure.
Table 9: Average required equity IRR in OECD infrastructure, by investor type
Lower all Upper all AO lower AO upper AMlower
AMupper
Otherlower
Otherupper
Mean WTI 10.7% 12.3% 10.7% 11.5% 10% 13.6% 10.4% 11.7%95% CI 9.9% -
11.4%11.1% -13.6%
7.3% -14.1%
10.3% -12.8%
8.8% -11.3%
11.6% -15.6%
9.3% -11.6%
9.8% -13.6%
AO is asset owners; AM is asset managers; and Other denotes all other respondents.
Table 10: Average required equity IRR in emerging-market infrastructure, by investor type
Lower all Upper all AO lower AO upper AMlower
AMupper
Otherlower
Otherupper
Mean WTI 16.9% 19.5% 17.5% 22.9% 16% 18.7% 16.7% 18.3%95% CI 15.8% -
18.1%17.2% -21.9%
15.2% -19.8%
18.5% -27.4%
14.4% -17.6%
15.7% -21.8%
10.3% -23.1%
16% -20.7%
AO is asset owners; AM is asset managers; and Other denotes all other respondents.
private infrastructure equity in OECD and
emerging markets.
In both geographies, we find a statisti-
cally significant difference between the IRR
required by asset owners and that required
by asset managers (See tables 23 and 25 in
the appendix).
Table 9 shows the mean Equity IRR bounds
demanded by asset owners and managers
for OECD infrastructure. Asset owners
price bounds are rather tight and between
10.75% and 11.5%, whereas bounds
reported by asset managers, between
9.65% and 14%, are much broader and
completely include asset owners’ return
preferences.
Figure 52 illustrates this point even better at
different levels of required return: the bid-
ask spread of the asset-owner category is
in fact rather narrow and only significant
at the lower end of the return spectrum,
where asset owners are equally likely to
invest at differing levels of expected returns.
For instance, there is one chance in three
(33% probability) that asset owners would
be willing to invest between 8% and 10%
IRR.
A Publication of the EDHEC Infrastructure Institute-Singapore 69

2017 Infrastructure Investor Survey - November 2017
5. Return Preferences
The bid-ask spread reported by asset
managers is however much wider, and
explains most of the observed range of
prices shown in figure 46. As the likelihood
of investment increases, so does the bid-ask
spread: at a 75% chance that an asset
manager would agree to invest in OECD
infrastructure equity, the required return
can vary between roughly 12.5% and
17.5%, a 500-basis-point difference.
At the same probability of agreeing to
invest, asset owners almost unanimously
require a 14% return.
This difference could be the result of several
nonexclusive effects, including:
1. Asset managers are infrastructure
specialists and have better information
about the riskiness of the different
investments proposed, hence they are
more granular in their answers;
2. Individual asset managers correspond to
a heterogenous group of strategies, from
investing in low-risk contracted solar
power, to high-risk merchant toll roads,
whereas asset owners would be exposed
to all these strategies simultaneously and
require broad market returns.
For emerging markets, the picture of asset
owners and managers is very different, as
shown in table 10. The mean IRR demanded
by asset owners is between 17.5% and
22.9%, while asset managers require returns
between 16% and 18.7%.
As shown in figure 53, the degree of
consensus and the likelihood of an
investment decision are very different than
for OECD infrastructure.
Asset owners have a wide range of views
on required returns in emerging- market
infrastructure, and even at the 75% positive
investment-decision probability, the bid-ask
spread again exceeds 500 basis points.
Asset managers exhibit a narrower, perhaps
more accurate view of required equity
returns in emerging-market infrastructure.
They are happy to invest at a lower average
level of returns.
Asset owners required emerging-market
premium (over OECD infrastructure equity)
range between 7% and 11.5%, whereas
asset managers are content with a premium
of 5-6%.
Such differences in stated preferences of
required returns in emerging-market infras-
tructure suggest that asset managers are
able to intermediate such investment for
only a fraction of asset owners: those
requiring equity returns in line with what
asset managers deem achievable. Alterna-
tively, asset managers will have to take
higher risks to meet the return requirements
of asset owners.
This finding also illuminates the fact that
while many asset owners declare wanting to
invest in emerging-market infrastructure,
much fewer actually already do. The
discrepancy between what asset managers
70 A Publication of the EDHEC Infrastructure Institute-Singapore

2017 Infrastructure Investor Survey - November 2017
5. Return Preferences
report to be achievable and what asset
owners require may partly explain the slow
pace with which institutional investors have
entered emerging-market infrastructure.
5.2 Willingness to Invest inInfrastructure Investment ProductsFinally, survey respondents had the option
to answer CVM questions about infras-
tructure investment “products,” as opposed
to single investment projects. A product
can simply be a private equity fund or a
coinvestment facility, structured product,
etc.
In what follows, we report answers for
product types that already exist: a classic
infrastructure private equity fund, (5.2) a
long-term infrastructure equity fund, (5.2)
and a private debt coinvestment platform;
(5.2) we also describe the responses to a
product that does not yet exist: a hybrid
index-tracking infrastructure fund (5.2).
A traditional infrastructure equity fundThe question proposed becoming a limited
investment partner (LP) in a closed-ended
private equity fund that would target
“brownfield ’core’ and ’core+’ infrastructure
in the OECD.”
The fundwould have a 10-year life and three
transactions were expected to require 50%
of the invested capital.
The general partner would charge a 1.5%
management fee, with 20% cost of carry
over a 7% hurdle rate.
The general partner was also able to leverage
the fund for the investments.
This kind of fund is the most common
and widely available type of infrastructure
investment vehicle available to asset owners
who do not wish to invest directly. It is also
a type of product that 80% of respondents
to the 2016 EDHEC/GIH survey declared to
be “obsolete and not adding value.”
This kind of fund is in fact so well known
to investors that there is a great degree
of consensus among respondents about
required returns: we find that all investors,
on average, would be willing to invest if the
promised IRR was between 12.2% and 13%.
The regression analysis, reported in the
appendix in table 27, shows that no investor
is statistically significantly different from
another within this sample. There is no
significant bid-ask spread: all respondents
agree about their willingness to invest for
a given level of required return.
Hence, the mean required IRR reported in
table 11 is 12.2%, with asset owners (here
the LPs) requiring 13% on average, whereas
asset managers (the GPs) are happy to invest
an average return of slightly less than 12%.
This is also evident from figure 54.
A long-term infrastructure equity fundLong-term infrastructure equity funds
contrast significantly with the traditional
private equity style infrastructure funds
described above.
A Publication of the EDHEC Infrastructure Institute-Singapore 71

2017 Infrastructure Investor Survey - November 2017
5. Return Preferences
Figure 54: Proportion of respondents willing to invest at the required IRR into a traditional infrastructure equity fund
0%
25%
50%
75%
100%
10% 15% 20% 25% 30%Required IRR
Pro
port
ion o
f re
sponden
ts
Upper bound Upper bound AM
AO is asset owners and AM denotes asset managers.
Figure 55: Proportion of respondents willing to invest at the required IRR into a long-term infrastructure equity fund
0%
25%
50%
75%
100%
0% 10% 20% 30%Required IRR
Pro
port
ion o
f re
sponden
ts
Upper AO Lower AO Upper AM Lower AM
72 A Publication of the EDHEC Infrastructure Institute-Singapore

2017 Infrastructure Investor Survey - November 2017
5. Return Preferences
Table 11: Average required equity IRR for a traditional infrastructure equity fund, by investor type
All AO AM OtherMean WTI 12.2% 13% 11.7% 11.8%95% CI 10.8% - 13.7% 10.8% - 15.2% 9.1% - 14.2% 9.1% - 14.5%
Table 12: Average required equity IRR for a long-term infrastructure equity fund, by investor type
Lower all Upper all AO lower AO upper AMlower
AMupper
Otherlower
Otherupper
Mean WTI 10.3% 12.6% 11.9% 12.5% 9.6% 12.9% 9.5% 12.4%95% CI 9.3% -
11.3%10.8% -14.4%
10% -13.9%
9.1% -15.8%
8% -11.4%
9.6% -16.2%
7.8% -11.3%
9.8% -15%
The question posed to respondents asked
what IRR they would require to be willing
to invest in an infrastructure fund that had
a 25-year life and an investment mandate
for both greenfield and brownfield infras-
tructure.
The underlying infrastructure projects
would all be “contracted” with only 30%
of the invested capital being allocated to
greenfield infrastructure and no fund-level
leverage.
Investors would be locked in for the life
of the fund, but the fund manager would
focus on providing regular payouts to the
investors.
For this type of product investment, respon-
dents do have a range of views and demand
a lower mean required IRR than for a
infrastructure private equity fund, between
12.3% and 12.6%.
Regression results also show that there is
a statistically significant difference between
respondents from both banks and asset
managers on the one hand and asset owners
on the other (see table 29 in the appendix).
Table 12 and figure 55 shows that, as
was the case above when comparing these
two investor types, the preference bounds
expressed by asset owners are themselves
bounded by those expressed by asset
managers.
Asset managers consider that investors
in long-term infrastructure equity funds
should be happy to receive returns between
9.6% and 12.9%, whereas asset owners
express narrower expectations with a
midpoint at 12%.
As expressed above, the wider price bounds
of asset managers could be the result
differences in risk preferences but also in
expected fee levels.
A coinvestment infrastructure debtplatformInfrastructure debt coinvestment, alongside
originating banks or debt funds, is becoming
more mainstream as an infrastructure
investment alternative.
With this question, respondents were asked
what yield to maturity (YTM) they would
demand if they were to coinvest in a
A Publication of the EDHEC Infrastructure Institute-Singapore 73

2017 Infrastructure Investor Survey - November 2017
5. Return Preferences
Table 13: Average required YTM for an investment in a debt coinvestment platform, by investor type
Lower all Upper all AO lower AO upper AMlower
AMupper
Otherlower
Otherupper
Mean WTI 4.51% 5.08% 4.2% 5.5% 4.66% 5% 4.5% 5%95% CI 4.2% -
4.8%4.1% -6.17%
3.7% -4.9%
NA -12%
4.11% -5.09%
5% - 5% 3.99% -5.03%
5% - 5%
Figure 56: Proportion of respondents willing to invest at the required YTM in a debt coinvestment platform
0%
25%
50%
75%
100%
0% 2% 4% 6% 8%Required IRR
Pro
port
ion o
f re
sponden
ts
Upper AO Lower AO Upper AM Lower AM
portfolio of project-finance loans alongside
a commercial bank.
The bank would originate and structure the
loans and would act as a servicing agent.
The investor would receive a fixed-rate
tranche of the debt with a tenor between
12 and 18 years.
The debt would be unrated, and the under-
lying projects would be 50% contracted and
50% merchant globally.
Respondents reported a required YTM
between 4.4% and 5.2%.
We observe no significant difference
between asset owners and managers
or banks (see regression table 31 in the
appendix).
Table 13 shows the mean required return for
all groups examined.
Figure 56 indicates that investors are willing
to coinvest at a YTM between 4% and 6%.
At 6%, 100% of the respondents would
coinvest. This is a clear indication that
in this low-interest-rate environment,
investors are looking at alternatives to
obtain yield.
74 A Publication of the EDHEC Infrastructure Institute-Singapore

2017 Infrastructure Investor Survey - November 2017
5. Return Preferences
Table 14: Average required IRR for an index-tracking hybrid infrastructure fund, by investor type
Lower all Upper all AO lower AO upper AMlower
AMupper
Otherlower
Otherupper
Mean WTI 12.4% 13% 12.5% 15.9% 10.9% 14.1% 13.1% 11.2%95% CI 5.5% -
20.3%8.4% -18%
NA -27.5%
6.9% -25.5%
NA -23.9%
5.3% -23.6%
3.3% -25%
5.3% -18.4%
Figure 57: Proportion of respondents willing to invest at the required IRR in an index-tracking hybrid infrastructure fund
0%
25%
50%
75%
100%
0% 10% 20% 30%Required IRR
Pro
port
ion o
f re
sponden
ts
Upper AO Lower AO Upper AM Lower AM
An index-tracking hybrid infrastructurefundThe final infrastructure investment product
we consider is a novel type of infrastructure
fund.
Respondents were asked what IRR they
would require to invest in a unit trust that
invests in both listed and unlisted infras-
tructure assets.
The fund’s objective would be to optimise
investor liquidity while minimising the
tracking error with an EDHEC emerging-
market private infrastructure equity index.
The listed infrastructure portion of the
portfolio would aim to replicate some of the
investment factors estimated in the unlisted
infrastructure portfolio.
Investors would be able to redeem their
investment, but there were gates and
liquidity fees.
Survey respondents would demand a mean
IRR between 12.4% and 13.0% to invest in
this fund, as shown in table 14.
Given the innovation inherent in this fund,
as it provides both liquidity and exposure to
infrastructure, it is interesting to observe no
statistically significant difference between
A Publication of the EDHEC Infrastructure Institute-Singapore 75

2017 Infrastructure Investor Survey - November 2017
5. Return Preferences
asset managers, asset owners and banks in
the mean WTI. Only “other” respondents
have a different expectation of an appro-
priate IRR for this investment (see table 33
in the appendix). “Other” respondents would
require an IRR between 12.76% to 14.9%.
Figure 57 shows that the vast majority of
investors would choose to invest in this
hypothetical fund if offered a 20% return.
This is higher than both types of equity
funds described above at the same level of
probability, which can be surprising since
this product would offer more liquidity and
propose to track a documented index with a
track record.
However, the fact that this type of product
has never been bought or sold before by
survey respondents (it is the only truly
nonmarket good we consider) suggest that
respondents may have a less intuitive idea
of what this product actually is.
76 A Publication of the EDHEC Infrastructure Institute-Singapore

6. Conclusions
A Publication of the EDHEC Infrastructure Institute-Singapore 77

2017 Infrastructure Investor Survey - November 2017
6. Conclusions
In this paper, we have reported the results
of the 2017 EDHEC/GIH survey of infras-
tructure investors’ investment beliefs and
return preferences.
Survey questions were answered by 186
asset owners and managers, commercial
and international banks, consultants, rating
agencies, and public-sector figures among
our list of infra500 leaders.
The asset owners among them represent
some of the largest investors in the world
and have allocations to infrastructure
investment largely above the norm. Hence,
this survey represents the views of the more
sophisticated and active part of the insti-
tutional space. Together, the asset owners
who took this survey represent more than
USD7 trillion assets under management
(i.e., 10% of global AUMs).
The survey had two main components:
first, it covered investment intentions,
market developments, and the role of
national infrastructure plans for infras-
tructure investors; second, it implemented
for the first time a contingent valuation
approach to documenting investors’ return
expectations and their range (the bid-ask
spread).
6.1 Market DevelopmentsKey findings
1. Most investors plan to increase their
investment in infrastructure. However,
this is likely to be focused on infras-
tructure in OECD markets as a significant
proportion of asset owners still do not
plan on investing in emerging-market
infrastructure;
2. Nevertheless, the number of investors
who want to invest in emerging-market
infrastructure is increasing, and among
those who do invest already, most want
to increase their allocation.
3. Respondents think that the infras-
tructure deal flow in emerging markets
is likely to grow at a much faster pace
than in OECD countries, where it is
mostly expected not to grow;
4. Still, most respondents agree that the
next big thing is the US market, followed
by Latin America.
5. There is also widespread agreement that
infrastructure investment will eventually
find its place among retail products
accessible though individual pension
accounts or life insurance products.
6.2 National Infrastructure PlansKey findings
1. Currently, the majority of respondents
do not focus greatly on national infras-
tructure plans (NIPs), with the majority
knowing little about them;
2. Respondents are more familiar with NIPs
in their region, but they are also more
critical of them as a result;
3. In the OECD, the Juncker plan, and
the UK plan come first and second as
NIPs that respondents were better aware
of. However, these were also the plans
with the least proportion of respondents
78 A Publication of the EDHEC Infrastructure Institute-Singapore

2017 Infrastructure Investor Survey - November 2017
6. Conclusions
stating that they improved the attrac-
tiveness of infrastructure investment in
the country;
4. In emerging markets, respondents are
more confident in the potential of NIPS
to make a positive impact on the attrac-
tiveness of infrastructure investment in
these countries;
5. Overall, the support shown among
respondents who know the plans well is
close to or at least 50% for more than
half of the plans.
6.3 Quality of IntermediationKey findings
1. As most respondents’ geographic
expertise lies in OECD countries, rather
than emerging markets, the majority
of respondents have not taken part in
projects supported by one of the project
preparation facilities created by MDBs.
However, when they had, the experience
had been mostly positive;
2. The majority of respondents did not
think that terminology inherited from
the real estate sector, such as “core”
and “core plus, ” often used by asset
managers to refer to different infras-
tructure investment profiles, was partic-
ularly problematic. One-third of respon-
dents did however find these terms to be
unhelpful or even confusing;
3. A majority of respondents also did not
see any problemwith the approach taken
by credit rating agencies to rate infras-
tructure project finance debt. 10% were
“not comfortable” with these methods.
6.4 BenchmarkingKey findings
1. Most respondents believe that better
operational, firm-level data would
support infrastructure investment;
2. They also agree that there is value
in benchmarking operational perfor-
mance, identifying the reporting of
traffic/demand data in different markets
as potentially the most useful, closely
followed by construction-risk metrics
and operational efficiency;
3. With respect to benchmarking financial
performance, respondents identified
time-weighted and risk-adjusted returns
as the most important to them.
On this last point, we note that the publi-
cation of the EDHECinfra infrastructure
benchmarks fills this particular “data
gap.” These broad market infrastructure
indices allow investors to understand the
risk-adjusted performance of the private
infrastructure investment debt and equity
markets.
6.5 Required ReturnsKey findings: infrastructure projects
1. The lower and upper infrastructure
equity return bounds in OECD markets
are on par with the broad market
EDHECinfra equity index, between 10%
and 12% annual returns. These results
are obtained using completely different
and independent methodologies and
A Publication of the EDHEC Infrastructure Institute-Singapore 79

2017 Infrastructure Investor Survey - November 2017
6. Conclusions
provide a powerful validation of the
approach taken in both studies;
2. The mean emerging-market (EM)
private infrastructure equity premium
is between 6% and 7%. However, asset
owners require higher EM premia, from
7% to 11% above OECD required returns,
whereas asset managers’ required EM
premium is in the 5-6% range.
3. The mean equity bid-ask spread is about
200bps in OECD infrastructure markets,
whereas it reaches 270bps in emerging
markets;
4. The average greenfield premium is zero:
neither asset owners nor asset managers
declare requiring higher returns for
greenfield projects, in OECD and EM alike.
We argue that is correct: construction
risk is idiosyncratic and not necessarily
very high for equity investors relative
to other sources of systematic risk. As
a result, it is not priced. We argue that
previous survey results that report a
greenfield premium suffer from a classic
“framing” problem and only reinforce an
a priori misconception;
5. Merchant projects carry a systematic
return premium of approximately 150
basis points, both in OECD and EM
markets;
6. In OECD private infrastructure equity
markets, asset owners’ returns bounds
are themselves bounded by the returns
required by asset managers. There is a
greater degree of consensus on expected
returns between asset owners than
between managers. We argue that this
could be the result of information
asymmetries between the two groups,
but it could also be the result of a more
structural difference, by which asset
managers tend to be single-strategy
investors whereas asset owners rely on
multiple managers and require better
diversified broad-market returns.
Key findings: infrastructure products
1. “Core” and “core plus” infrastructure PE
Funds in the OECD: the most common
type of private infrastructure investment
vehicle benefits from a greater consensus
among investor groups. We could not
detect a meaningful bid-ask spread
among respondents and only report a
single expected rate of return. Asset
managers (the GPs) declare requiring
12% (ci: 9.1-14.2%) mean returns to
agree to investing in such a fund, but
asset owners, perhaps mindful of fee
levels, require 13% (ci: 10.8-15.2%) on
average to agree to investing in such
structures;
2. A long-term infrastructure equity fund,
investing in greenfield and brown-
field infrastructure with no additional
leverage: this products requires lower
returns to be agreeable to investors.
Asset owners require 12% and asset
managers between 9.6% and 12.9%.
Once again, asset owners’ return bounds
are themselves bounded by asset
managers’ bounds.
3. A private project-debt coinvestment
platform: with debt products, investors’
pricing habits are different and pricing is
much tighter. Investors require fixed-rate
returns in the 4.2-5% range.
80 A Publication of the EDHEC Infrastructure Institute-Singapore
2017 Infrastructure Investor Survey - November 2017
6. Conclusions
4. A novel type of fund that would combine
private infrastructure equity with listed-
factor exposures to maximise a certain
investment profile while providing
limited liquidity and would track a broad
market private infrastructure index
would need to return between 12.5%
and 15.9% to attract asset owners, and
between 10.9% and 14.1% to get a
positive investment decision from asset
managers surveyed.
A Publication of the EDHEC Infrastructure Institute-Singapore 81

7. Appendix
82 A Publication of the EDHEC Infrastructure Institute-Singapore

2017 Infrastructure Investor Survey - November 2017
7. Appendix
Table 15: Coefficients from the willingness-to-invest regression for OECD greenfield assets
Lower UpperIntercept 4.5117 *** 3.286 ***std error 0.6086 0.5934IRR -42.8072 *** -26.5189 ***std error 5.4772 4.3957Greenfield 0.0906 -0.0169std error 0.3091 0.3471
*** significant at the 1% level, ** significant at the 5% level, * significant at the 10% level
Table 16: Probability of willingness to invest for OECD infrastructure assets for stated IRRs
IRR Lower all Upper all Upper GF Lower GF0.05 0.12346 0.08538 0.1253 0.078570.1 0.34657 0.44251 0.35041 0.420280.15 0.66637 0.87095 0.67011 0.860410.2 0.88265 0.98287 0.88439 0.981280.25 0.9659 0.99795 0.96645 0.997760.3 0.99071 0.99976 0.99087 0.99974
Table 17: Coefficients from the willingness-to-invest regression for emerging-market greenfield assets
Lower UpperIntercept 5.8695 *** 3.5659 ***std error 1.0586 0.9503IRR -34.6423 *** -18.4335 ***std error 6.0558 4.6303Greenfield -0.0063 0.0833std error 0.4044 0.456
*** significant at the 1% level, ** significant at the 5% level, * significant at the 10% level
Table 18: Probability of willingness to invest for EM infrastructure assets for stated IRRs
IRR Lower all Upper all Upper GF Lower GF0.1 0.15154 0.08277 0.14114 0.083250.15 0.30984 0.33779 0.29231 0.33920.2 0.53016 0.74249 0.50936 0.74370.25 0.73933 0.94219 0.72295 0.942530.3 0.87698 0.98926 0.8677 0.989330.35 0.94714 0.99808 0.94281 0.9981
Table 19: Coefficients from the willingness-to-invest regression for OECD assets by business model
Lower UpperIntercept 5.2831 *** 3.8445 ***std error 0.7038 0.6874IRR -51.0619 *** -31.2508 ***std error 6.3266 5.0355Merchant 1.1179 *** 0.6693std error 0.4251 0.4606Utility -0.576 -0.5816std error 0.3902 0.4437
*** significant at the 1% level, ** significant at the 5% level, * significant at the 10% level
Table 20: Probability of willingness to invest for OECD infrastructure assets for stated IRRs by business model
IRR Lower all Upper all Upper mer Lower mer0.05 0.09263 0.06122 0.04967 0.020880.1 0.32752 0.45588 0.1996 0.215040.15 0.69912 0.91499 0.54333 0.778730.2 0.91726 0.99282 0.85022 0.978360.25 0.98144 0.99944 0.96439 0.998280.3 0.99605 0.99996 0.99232 0.99987
A Publication of the EDHEC Infrastructure Institute-Singapore 83

2017 Infrastructure Investor Survey - November 2017
7. Appendix
Table 21: Coefficients from the willingness-to-invest regression for emerging-market assets by business model
Lower UpperIntercept 5.8323 *** 3.5589 ***std error 1.0627 0.9514IRR -36.4145 *** -20.3368 ***std error 6.3398 4.9627Merchant 0.7018 0.5084std error 0.5158 0.5715Utility 0.2941 0.7929std error 0.5025 0.5986
*** significant at the 1% level, ** significant at the 5% level, * significant at the 10% level
Table 22: Probability of willingness to invest for EM infrastructure assets for stated IRRs by business model
IRR Lower all Upper all Upper mer Lower mer0.1 0.17869 0.10058 0.11571 0.052520.15 0.37556 0.40852 0.26564 0.255040.2 0.62444 0.81009 0.5 0.678920.25 0.82131 0.96343 0.73436 0.928880.3 0.92704 0.99389 0.88429 0.987750.35 0.97232 0.99901 0.95481 0.998
Table 23: Coefficients from the willingness-to-invest regression for OECD assets by investor type
Lower UpperIntercept 6.4784 *** 5.0954 ***std error 1.1912 1.2987IRR 1.1912 *** 1.2987 ***std error 6.4036 5.3229Merchant -0.5497 5.3229 *std error 0.5057 0.5852Utility 0.2807 -1.3963std error 0.5844 0.8426
*** significant at the 1% level, ** significant at the 5% level, * significant at the 10% level
Table 24: Probability of willingness to invest for OECD infrastructure assets for stated IRRs by investor type
IRR Upper AO Lower AO Upper AM Lower AM0.05 0.07224 0.12436 0.05981 0.047060.1 0.35429 0.44306 0.23944 0.498110.15 0.79451 0.81671 0.60908 0.952260.2 0.9646 0.96148 0.88521 0.997510.25 0.99482 0.9929 0.97447 0.999880.3 0.99926 0.99872 0.99473 0.99999
Table 25: Coefficients from the willingness-to-invest regression for emerging-market assets by investor type
Lower UpperIntercept 6.4784 *** 5.0954 ***std error 1.1912 1.2987IRR -37.0192 *** -22.2286 ***std error 6.4036 5.3229Other -0.5497 -0.9358std error 0.5057 0.5852AM 0.2807 -1.3963 *std error 0.5844 0.8426
*** significant at the 1% level, ** significant at the 5% level, * significant at the 10% level
84 A Publication of the EDHEC Infrastructure Institute-Singapore

2017 Infrastructure Investor Survey - November 2017
7. Appendix
Table 26: Probability of willingness to invest for EM infrastructure assets for stated IRRs by investor type
IRR Upper AO Lower AO Upper AM Lower AM0.1 0.00225 0.03765 0.08939 0.06410.15 0.02321 0.25344 0.2853 0.342280.2 0.20036 0.74656 0.61879 0.798150.25 0.72543 0.96235 0.86843 0.967790.3 0.96535 0.99551 0.96408 0.995640.35 0.99661 0.99948 0.99092 0.99942
Table 27: Coefficients from the willingness-to-invest regression for a traditional infrastructure fund by investor type
Lower UpperIntercept 56.1685 6.7439 ***std error 7310.4215 1.7828IRR -438.3035 -51.7479 ***std error 56234.0112 13.1961Other -1.587 -0.7197std error 1.205 0.7919AM 0.3001 -0.6444std error 0.9458 0.8143
*** significant at the 1% level, ** significant at the 5% level, * significant at the 10% level
Table 28: Probability of willingness to invest in a traditional infrastructure fund by investor type
IRR Upper bound Lower lower0.08 0.06887 00.13 0.49582 0.692310.18 0.92895 10.23 0.99428 10.28 0.99957 10.33 0.99997 1
Table 29: Coefficients from the willingness-to-invest regression for a long-duration infrastructure fund by investor type
Lower UpperIntercept 5.506 *** 3.9562 ***std error 1.1039 1.0268IRR -46.2268 *** -31.6498 ***std error 8.5897 7.2211Other -1.0457 * 0.1383std error 0.6026 0.6856AM -1.0883 * -0.045std error 0.6138 0.6205
*** significant at the 1% level, ** significant at the 5% level, * significant at the 10% level
Table 30: Probability of willingness to invest in a long-duration infrastructure fund by investor type
IRR Upper AO Lower AO Upper AM Lower AM0.05 0.0852 0.03937 0.07502 0.104420.1 0.3119 0.29248 0.28301 0.540490.15 0.6881 0.80659 0.65766 0.922270.2 0.9148 0.97678 0.90338 0.991720.25 0.98122 0.99765 0.9785 0.999170.3 0.99608 0.99977 0.99551 0.99992
A Publication of the EDHEC Infrastructure Institute-Singapore 85

2017 Infrastructure Investor Survey - November 2017
7. Appendix
Table 31: Coefficients from the willingness-to-invest regression for a Coinvestment infrastructure-debt fund by investor type
Lower UpperIntercept 18.6593 *** 212.7781std error 5.4403 53135.2987IRR -441.9054 *** -3868.6934std error 130.232 962128.7803Other 1.955 -18.2449std error 1.6381 6803.2783AM 1.2264 -17.734std error 1.5287 6803.2783
*** significant at the 1% level, ** significant at the 5% level, * significant at the 10% level
Table 32: Probability of willingness to invest in a Co-investment infrastructure-debt fund by investor type
IRR Upper AO Lower AO Upper AM Lower AM0.03 0 0.00449 0 0.000640.04 0 0.27227 0 0.05030.05 0 0.96881 0.25 0.814720.06 1 0.99961 1 0.997270.07 1 1 1 0.999970.08 1 1 1 1
Table 33: Coefficients from the willingness-to-invest regression for an Innovative Infrastructure Fund–Dynamic Index Tracking by investor type
Lower UpperIntercept 3.0741 * 5.634 **std error 1.7163 2.6327IRR -24.5924 ** -35.4688 **std error 11.5209 15.4567Other -0.4013 -0.6274std error 1.2971 1.3567AM 0.1458 -1.6605std error 1.1615 1.4035
*** significant at the 1% level, ** significant at the 5% level, * significant at the 10% level
Table 34: Probability of willingness to invest in an Innovative Infrastructure Fund–Dynamic Index Tracking by investor type
IRR Upper AO Lower AO Upper AM Lower AM0.05 0.02062 0.13653 0.03794 0.191070.1 0.11036 0.35096 0.1885 0.446830.15 0.42222 0.64904 0.57778 0.734220.2 0.8115 0.86347 0.88964 0.904280.25 0.96206 0.95581 0.97938 0.969980.3 0.99335 0.98666 0.99644 0.99103
86 A Publication of the EDHEC Infrastructure Institute-Singapore

References
A Publication of the EDHEC Infrastructure Institute-Singapore 87

2017 Infrastructure Investor Survey - November 2017
References
l Aguilar, F. X. (2009). Investment preferences for wood-based energy initiatives in the
us. Energy Policy 37(6), 2292–2299.
l Aguilar, F. X. and Z. Cai (2010). Exploratory analysis of prospects for renewable energy
private investment in the us. Energy Economics 32(6), 1245–1252.
l Arrow, K., R. Solow, P. R. Portney, E. E. Leamer, R. Radner, and H. Schuman (1993). Report
of the noaa panel on contingent valuation. Federal register 58(10), 4601–4614.
l Bateman, I. J. and K. Willis (1999). Introduction and overview. In I. J. Bateman and
K. G. Willis (Eds.), Valuing Environmental Preferences, Chapter 1, pp. 1–14. New York:
Oxford University Press.
l Blanc-Brude, F. (2013). Towards efficient benchmarks for infrastructure equity invest-
ments. EDHEC-Risk Institute Publications, 88.
l Blanc-Brude, F. (2014, June). Benchmarking Long-Term Investment in Infrastructure.
EDHEC-Risk Institute Position Paper .
l Blanc-Brude, F., G. Chen, and T. Whittaker (2016, Forthcoming). Towards better
products for infrastructure investors? a survey of the perceptions and expectations of
institutional investors in infrastructure. EDHEC Infrastructure Institute Publications.
l Blanc-Brude, F. and O. R. H. Ismail (2013). Who is afraid of Construction Risk? Portfolio
Construction with Infrastructure Debt. EDHEC-Risk Institute Publications, 128.
l Blanc-Brude, F. and D. Makovsek (2014). How much construction risk do sponsors take
in project finance? EDHEC-Risk Institute Publications.
l Carson, R. T., F. N. and K. Willis (1999). The theory and measurement of passive-use
value. In I. J. Bateman and K. G. Willis (Eds.), Valuing Environmental Preferences,Chapter 4, pp. 97–130. New York: Oxford University Press.
l Carson, R. T. (2012). Contingent valuation: A practical alternative when prices aren’t
available. The Journal of Economic Perspectives 26(4), 27–42.
l Carson, R. T., R. C. Mitchell, W. M. Hanemann, R. J. Kopp, S. Presser, P. A. Ruud, et al.
(1992). A contingent valuation study of lost passive use values resulting from the
exxon valdez oil spill. Technical report, University Library of Munich, Germany.
l Della Croce, R. and J. Yermo (2013). Institutional investors and infrastructure financing.
OECD Working Papers on Finance, Insurance and Private Pensions (36), 37.
88 A Publication of the EDHEC Infrastructure Institute-Singapore

2017 Infrastructure Investor Survey - November 2017
References
l EIOPA (2016, Forthcoming, June). Final advice on infrastructure corporates to the
european commission. Technical report, European Insurance and Occupational
Pension Authority, Frankfurt, Germany.
l Krinsky, I. and A. L. Robb (1986a). On approximating the statistical properties of elastic-
ities. The Review of Economics and Statistics, 715–719.
l Krinsky, I. and A. L. Robb (1986b). On approximating the statistical properties of elastic-
ities: A correction. The Review of Economics and Statistics, 189–90.
l OECD (2015, January). Fostering investment in infrastructure, lessons learned from
oecd investment policy reviews. Technical report, OECD, Organisation for Economic
Co-operation and Development.
l Sharpe, W. F. (1964). Capital asset prices: A theory of market equilibrium under condi-
tions of risk. The journal of finance 19(3), 425–442.
l Welsh, M. and R. Bishop (1993). Multiple bounded discrete choice models. In
J. Bergstrom (Ed.), Benefits & Costs Transfer in Natural Resource Planning, Chapter 2,pp. 331–352. University of Georgia: Western Regional Research Publication.
l Welsh, M. P. and G. L. Poe (1998). Elicitation effects in contingent valuation: compar-
isons to a multiple bounded discrete choice approach. Journal of environmentaleconomics and management 36(2), 170–185.
A Publication of the EDHEC Infrastructure Institute-Singapore 89

About Global Infrastructure Hub
90 A Publication of the EDHEC Infrastructure Institute-Singapore

2017 Infrastructure Investor Survey - November 2017
About Global Infrastructure Hub
In November 2014, G20 leaders agreed toa “Global Infrastructure Initiative” to liftquality public and private infrastructureinvestment, including the establishment ofthe Global Infrastructure Hub (the GI Hub).
The Global Infrastructure Hub has a G20mandate to grow the global pipeline ofquality, bankable infrastructure projects.
By facilitating knowledge sharing,highlighting reform opportunities, andconnecting the public and private sectors,its goal is to increase the flow andquality of private and public infrastructureinvestment opportunities in G20 andnon-G20 countries.
With an expected global infrastructuredeficit widely estimated at up to USD20trillion to 2030, it is clear that this gap needsto be addressed.
The GI Hub works to address data gaps,lower barriers to investment, increase theavailability of investment-ready projects,and improve project and policy environ-ments for infrastructure.
The GI Hub provides independent dataand analysis of the addressable oppor-tunities for investment, the specificblockages to infrastructure development,and tools and insights to help overcomethem. Our resources are informed by theprivate, public, and multilateral sectors andvalidated by independent bodies and GIHub experts. We zero in on the knowledge,improvements, and innovations that willreally make a difference.
The GI Hub’s resources include datamapping, a tool to assess country-levelinfrastructure environments, a knowledgeplatform, and project-pipeline and leadingpractices. These resources make it easierfor government procurement professionalsto understand how reforms can help themattract finance and deliver infrastructure,connect to international peers for adviceand support, access best-practice tools, aswell as showcase their projects to privateinvestors.
We believe that targeted reforms to adoptbest practices in project development andprocurement will transform infrastructureoutcomes: more bankable projects, moreproductive economies, and more liveablecommunities for investors, governments,and communities.
http://globalinfrastructurehub.org
A Publication of the EDHEC Infrastructure Institute-Singapore 91

About EDHEC InfrastructureInstitute-Singapore
92 A Publication of the EDHEC Infrastructure Institute-Singapore

2017 Infrastructure Investor Survey - November 2017
About EDHEC InfrastructureInstitute-Singapore
OriginsEDHECinfra addresses theprofound knowledge gap
faced by infrastructureinvestors by collecting
and standardising privateinvestment and cash-flow
data and runningstate-of-the-art asset
pricing and risk models tocreate the performance
benchmarks that areneeded for asset
allocation, prudentialregulation, and the design
of new infrastructureinvestment solutions.
In 2012, EDHEC-Risk Institute createda thematic research program on infras-tructure investment and established twoResearch Chairs dedicated to long-terminvestment in infrastructure equity anddebt, respectively, with the active supportof the private sector.
Since then, infrastructure investmentresearch at EDHEC has led to more than20 academic publications and as manytrade press articles, a book on infrastructureasset valuation, more than 30 industry andacademic presentations, more than 200mentions in the press, and the creationof an executive course on infrastructureinvestment and benchmarking.
A testament to the quality of its contri-butions to this debate, EDHECinfra’sresearch team has been regularly invited tocontribute to high-level fora on the subject,including G20 meetings.
Likewise, active contributions were made tothe regulatory debate, in particular directlysupporting the adaptation of the Solvency-II framework to long-term investments ininfrastructure.
This work has contributed to growing thelimited stock of investment knowledge inthe infrastructure space.
A Profound Knowledge GapInstitutional investors have set their sightson private investment in infrastructureequity and debt as a potential avenuetoward better diversification, improvedliability-hedging, and reduced drawdownrisk.
Capturing these benefits, however, requiresanswering some difficult questions:
1. Risk-adjusted performance measuresare needed to inform strategic assetallocation decisions and monitorperformance;
2. Duration- and inflation-hedgingproperties are required to understandthe liability-friendliness ofinfrastructure assets;
3. Extreme risk measures are in demandfrom prudential regulators, amongothers.
Today none of these metrics is documentedin a robust manner, if at all, for investorsin privately held infrastructure equity ordebt. This has left investors frustrated byan apparent lack of adequate investmentsolutions in infrastructure. At the sametime, policy-makers have begun calling fora widespread effort to channel long-termsavings into capital projects that couldsupport long-term growth.
To fill this knowledge gap, EDHEC haslaunched a new research platform,EDHECinfra, to collect, standardise, andproduce investment performance data forinfrastructure equity and debt investors.
Mission StatementOur objective is the creation of a globalrepository of financial knowledge andinvestment benchmarks about infras-tructure equity and debt investment, with afocus on delivering useful applied researchin finance for investors in infrastructure.
We aim to deliver the best availableestimates of financial performance and risksof reference portfolios of privately heldinfrastructure investments and to provide
A Publication of the EDHEC Infrastructure Institute-Singapore 93

2017 Infrastructure Investor Survey - November 2017
About EDHEC InfrastructureInstitute-Singapore
investors with valuable insights about theirstrategic asset allocation choices in infras-tructure, as well as to support the adequatecalibration of the relevant prudential frame-works.
We are developing unparalleled access tothe financial data of infrastructure projectsand firms, especially private data that iseither unavailable to market participantsor cumbersome and difficult to collect andaggregate.
We also bring advanced asset pricingand risk-measurement technology designedto answer investors’ information needsabout long-term investment in privatelyheld infrastructure, from asset allocationto prudential regulation and performanceattribution and monitoring.
What We DoThe EDHECinfra team is focused on threekey tasks:
1. Data collection and analysis: wecollect, clean, and analyse the privateinfrastructure investment data of theproject’s data contributors as well asfrom other sources, and input it intoEDHECinfra’s unique database of infras-tructure equity and debt investmentsand cash flows. We also develop datacollection and reporting standards thatcan be used to make data collectionmore efficient and more transparentlyreported. This database already covers15 years of data and hundreds of invest-ments and, as such, is already the largestdedicated database of infrastructureinvestment information available.
2. Cash- flow and discount-rate models:Using this extensive and growing
database, we implement and continueto develop the technology developedat EDHEC-Risk Institute to model thecash flow and discount-rate dynamicsof private infrastructure equity and debtinvestments and derive a series of riskand performance measures that canactually help answer the questions thatmatter for investors.
3. Building reference portfolios ofinfrastructure investments: Usingthe performance results from our assetpricing and risk models, we can reportthe portfolio-level performance ofgroups of infrastructure equity or debtinvestments using categorisations (e.g.,greenfield vs. brownfield) that are mostrelevant for investment decisions.
Partners of EDHECinfra
Monetary Authority of SingaporeIn October 2015, Deputy Prime Ministerof Singapore Tharman Shanmugaratnamannounced officially at the World BankInfrastructure Summit that EDHEC wouldwork in Singapore to create “usable bench-marks for infrastructure investors.”
The Monetary Authority of Singaporeis supporting the work of the EDHECSingapore Infrastructure InvestmentInstitute (EDHECinfra) with a five-yearresearch development grant.
Sponsored Research ChairsSince 2012, private-sector sponsors havebeen supporting research on infrastructureinvestment at EDHEC with several ResearchChairs that are now under the EDHEC Infras-tructure Investment Institute:
94 A Publication of the EDHEC Infrastructure Institute-Singapore

2017 Infrastructure Investor Survey - November 2017
About EDHEC InfrastructureInstitute-Singapore
1. The EDHEC/NATIXIS Research Chair onthe Investment and Governance Charac-teristics of Infrastructure Debt Instru-ments, 2012-2015
2. The EDHEC/Meridiam/Campbell-LutyensResearch Chair on Infrastructure EquityInvestment Management and Bench-marking, 2013-2016
3. The EDHEC/NATIXIS Research Chairon Infrastructure Debt Benchmarking,2015-2018
4. The EDHEC / Long-Term InfrastructureInvestor Association Research Chair onInfrastructure Equity Benchmarking,2016-2019
5. The EDHEC/Global Infrastructure HubSurvey of Infrastructure Investors’Perceptions and Expectations, 2016
Partner OrganisationsAs well as our Research Chair Sponsors,numerous organisations have alreadyrecognised the value of this project andhave joined or are committed to joining thedata collection effort. They include:
l The Global Infrastructure Hub;l The European Investment Bank;l The World Bank Group;l The European Bank for Reconstruction
and Development;l The members of the Long-Term Infras-
tructure Investor Association;l Over 20 other North American, European,
and Australasian investors and infras-tructure managers.
EDHECinfra is also :
l A member of the Advisory Council ofthe World Bank’s Global InfrastructureFacility
l An honorary member of the Long-termInfrastructure Investor Association
A Publication of the EDHEC Infrastructure Institute-Singapore 95

EDHEC Infrastructure InstitutePublications
96 A Publication of the EDHEC Infrastructure Institute-Singapore

2017 Infrastructure Investor Survey - November 2017
EDHEC Infrastructure InstitutePublications
EDHEC Publications
l Blanc-Brude, F., A. Chreng, M. Hasan, Q. Wang, and T. Whittaker. “Private Infras-tructure Equity Indices: Benchmarking European Private Infrastructure Equity2000-2016” (June 2017).
l Blanc-Brude, F., A. Chreng, M. Hasan, Q. Wang, and T. Whittaker. “Private Infras-tructure Debt Indices: Benchmarking European Private Infrastructure Debt 2000-2016” (June 2017).
l Blanc-Brude, F., G. Chen, and T. Whittaker. “Towards Better InfrastructureInvestment Products: A Survey of Investors’ Perceptions and Expectations fromInvesting in Infrastructure” (July 2016).
l Blanc-Brude, F., T. Whittaker, and S. Wilde. “Searching for a Listed InfrastructureAsset Class: Mean-Variance Spanning Tests of 22 Listed Infrastructure Proxies”(June 2016).
l Blanc-Brude, F., T. Whittaker, andM. Hasan. “Cash Flow Dynamics of Private Infras-tructure Debt” (March 2016).
l Blanc-Brude, F., T. Whittaker, and M. Hasan. “Revenues and Dividend Payouts inPrivately-Held Infrastructure Investments” (March 2016).
l Blanc-Brude, F., and M. Hasan. “The Valuation of Privately-Held InfrastructureEquity Investments” (January 2015).
l Blanc-Brude, F., and D. Makovsek. “HowMuch Construction Risk Do Sponsors Takein Project Finance?” (August 2014).
l Blanc-Brude, F., M. Hasan, and O. R .H. Ismail. “Performance and Valuation ofPrivate Infrastructure Debt” (July 2014).
l Blanc-Brude, F. “Benchmarking Long-Term Investment in Infrastructure” (June2014).
l Blanc-Brude, F., and O. R. H. Ismail. “Who Is Afraid Of Construction Risk?” (March2013).
l Blanc-Brude, F. “Towards Efficient Benchmarks for Infrastructure Equity Invest-ments” (January 2013).
l Blanc-Brude, F. “Pension Fund Investment in Social Infrastructure” (February2012).
A Publication of the EDHEC Infrastructure Institute-Singapore 97

2017 Infrastructure Investor Survey - November 2017
EDHEC Infrastructure InstitutePublications
Peer-Reviewed Publications
l Hasan, M., and F. Blanc-Brude. “You Can Work It Out! Valuation and Recoveryof Private Debt with a Renegotiable Default Threshold.” Journal of Fixed Income,26(4), 2017, pp. 113-127.
l Blanc-Brude, F., S. Wilde, and T. Witthaker. “Looking for an Infrastructure AssetClass: Definition and Mean-Variance Spanning of Listed Infrastructure EquityProxies.” Financial Market & Portfolio Management, 31, 2017, pp. 137-179.
l Blanc-Brude, F., and M. Hasan. “A Structural Model of Credit Risk for Illiquid Debt.”Journal of Fixed Income, 26(1), 2016, pp. 6-19
l Blanc-Brude, F., M. Hasan, and T. Witthaker. “Benchmarking Infrastructure ProjectFinance–Objectives, Roadmap and Recent Progress.” Journal of Alternative Invest-ments, 19(2), 2016, pp. 7-18
l Bianchi, R., M. Drew, E. Roca, and T. Whittaker. “Risk Factors in Australian BondReturns,” Accounting & Finance, 2015.
l Blanc-Brude, F. “Long-Term Investment in Infrastructure and the Demand forBenchmarks.” JASSA: The Finsia Journal of Applied Finance, 3, pp. 57-65, 2014.
l Blanc-Brude, F. “ Risk Transfer, Self-Selection and Ex Post Efficiency in PublicProcurement: An Example from UK Primary and Secondary School ConstructionContracts.” Revue d’Economie Industrielle, 141(1st Quarter), pp. 149-180, 2013.
l Blanc-Brude, F., H. Goldsmith, and T. Valila. “A Comparison of ConstructionContract Prices for Traditionally Procured Roads and Public-Private Partnerships.”Review of Industrial Organization, 35(1-2), pp. 19-40, 2009
l Blanc-Brude, F., H. Goldsmith, and T. Valila. “Public-Private Partnerships in Europe:An Update.” EIB Economic & Financial Reports, 2007.
l Blanc-Brude, F., and R. Strange. “How Banks Price Loans to Public-Private Partner-ships: Evidence from the European Markets.” Journal of Applied CorporateFinance, 19(4), pp. 94-106, 2007.
l Blanc-Brude, F., H. Goldsmith, and T. Valila. “Ex Ante Construction Costs in theEuropean Road Sector: A Comparison of Public-Private Partnerships and Tradi-tional Public Procurement.” EIB Economic & Financial Reports, vol. 2006/1, 2006.
Books
98 A Publication of the EDHEC Infrastructure Institute-Singapore

2017 Infrastructure Investor Survey - November 2017
EDHEC Infrastructure InstitutePublications
l Blanc-Brude, F., and M. Hasan. Valuation and Financial Performance of Privately-Held Infrastructure Investments. London: PEI Media, 2015.
A Publication of the EDHEC Infrastructure Institute-Singapore 99

For more information, please contact:Karen Sequeira on +65 6438 0030or e-mail: [email protected]
EDHEC Infrastructure Institute-SingaporeEDHEC Business School Asia-PacificOne George Street - #15-02Singapore 049145Tel.: +65 6438 0030
edhec.infrastructure.institute