Embed Size (px)
Citation preview

INVESTOR UPDATE SECOND QUARTER 2016

Disclaimer
This presentation contains forward-looking statements that reflect management’scurrent views with respect to certain future events and potential financial performance. Although SpareBank 1 SR-Bank believes that the expectations reflected in such forward-looking statements are reasonable, no assurance can be given that such expectations will prove to have been correct. Accordingly, results could differ materially from those set out in the forward-looking statements as a result of various factors.
Important factors that may cause such a difference for SpareBank 1 SR-Bank include, but are not limited to: (i) the macroeconomic development, (ii) change in the competitive climate, (iii) change in the regulatory environment and other government actions and (iv) change in interest rate and foreign exchange rate levels.
This presentation does not imply that SpareBank 1 SR-Bank has undertaken to revise these forward-looking statements, beyond what is required by applicable law or applicable stock exchange regulations if and when circumstances arise that will lead to changes compared to the date when these statements were provided.
2

Agenda
3
Presentation of SpareBank 1 SR-Bank ASA
Financials
Appendix
Solvency and liquidity position
Introduction to SpareBank 1 SR-Bank ASA

Second largest Norwegian bank
Market cap: NOK 10.5 Billion
Total assets: NOK 196.8 Billion
Total lending: NOK 183.4 Billion
Total deposits: NOK 89.6 Billion
No. of branches: 49
Employees: 1.182
SR-Bank at a glance
4
Bjergsted Terrasse 1Postboks 2504066 Stavanger
Tlf: +47 915 02002www.sr-bank.no
Norway’s largest regional bank
Market share: about 40% in Rogaland
No. of retail customer: 275 000
No. of corporate customer: 13 830
Full service bank
Mobile bank
1839: The first bank that today forms part of SpareBank 1
SR-Bank is established.
1976: 24 savings banks merge to form Sparebanken
Rogaland.
1994: SR-Bank (Sparebanken Rogaland) lists its primary
capital certificates on the Oslo Stock Exchange.
1996: SR-Bank is one of the founders of SpareBank 1, an
alliance.
2012: SpareBank 1 SR-Bank converted from a savings bank
to a public limited company (“limited liability savings bank”).
Arne AustreidCEO
Headquarter: Stavanger

5
A unique situation with a continuing budget surplus…
Economic Indicators (%) 2010 2011 2012 2013 2014 2015 2016P
GDP growth - mainland 1.7 2.6 3.4 2.0 2.3 1.0 0.8
Household consumption growth 3.8 2.6 3.0 2.1 1.7 2.0 1.5
Investment growth – mainland* -4.5 6.3 4.5 4.7 1.3 0.0 3.5
Investment growth oil & gas -9.5 11.3 14.6 18.0 -2.9 -15 -14
Inflation rate, CPI 2.5 1.2 0.8 2.1 2.0 2.1 3.3
3 month NIBOR rate / avg. mortgage rate 2.5/3.4 2.9/3.6 2.2/3.9 1.8/4.0 1.7/3.9 1.3/3.2 0.7/2.4
Household savings ratio 5.8 7.8 8.6 9 8.8 9.1 8.9
Unemployment rate 3.6 3.3 3.2 3.5 3.5 4.4 4.6
HH sector disp. real inc. growth 2.7 4.6 3.2 3.2 2.9 2.7 1.1
Current Account Surplus / GDP 11.9 13.5 14.3 10.6 9.7 8.7 7.0
Gov Budget Surplus / GDP 7 10 10 8 10 10 6
Sovereign Wealth Fund / GDP 121 120 131 157 204 238 228
Sources: Statistics Norway, NBIM, Norwegian Ministry of Finance as of March 2016, Investor presentation april 2016 from SpareBank 1 Boligkreditt AS
* Business, residential housing and public sector investments

One of Norway’s most prosperous regions
6
-4000
-3000
-2000
-1000
0
1000
2000
3000
4000
Eko
fisk
Joh
an S
verd
rup
Tro
ll
Eld
fisk
Sno
rre
Val
hal
l
Stat
fjo
rd
Hei
dru
n
Gu
llfak
s
Ose
be
rg
Ose
be
rg s
ør
Gra
ne
Gu
llfak
s sø
rMB
OE
Produced reserves
Producible reserves
Estimated reserve - Highcase
Estimated reserve - Lowcase
The third largest discovery ever on the NCS was made 140 km from our headquarter in 2011
“Johan Sverdrup” compared to existingoil fields on the Norwegian
continental shelf.
The region accounts for circa 25% of Norwegian GDP Planned infrastructure project total 100-150BNOK
…and activity is expected to continue at high levels
Source: Oljedirektoratet, Statistics Norway, Norges Bank, Stavanger Aftenblad, Statens Vegvesen, SR-Markets
GDP per capita, EUR
Above 50,000
43,750 – 50,000
37,500 – 43,750
Below 37,500
• Better infrastructure in the cities
Stavanger and Bergen
• Better connections between cities and
sparsely
populated areas
• Better connections between regions in
Rogaland,
Hordaland and Agder
• Norway’s largest export region
• Unemployment rate on national average
SR-Bank’s market area
0
50
100
150
200
250
2010 2011 2012 2013 2014 2015 2016 (E)2017 (E)2018 (E)2019 (E)
BN
OK
Investments on NCS
Statistics Norway (SSB) Norway's central bank (Norges Bank)

Rogaland1
Population 516.000
Market share 6%
Year of establishment 2006
Market strategy Entry/growth
Unemployment rate 3.6%*
Population 470.000
Market share 36%
Year of establishment 1839
Market strategy Market leader
Unemployment rate 4.6%*
Population 298.000
Market share 8%
Year of establishment 2002
Market strategy Growth
Unemployment rate 4.0%*
Hordaland2
Agder3
The leading financial group in the southwest of Norway
Source: Nav, SSB and SpareBank 1 SR-Bank* Figures as at 31.07.2016
2
1
3
7

The SpareBank 1 Alliance – strong benefits in economies of scale
8
Founded in 1996 based on efficiency and local market focus Geographic overview
Pu
rpo
seC
orn
erst
on
es
Ensure the independence and regional foothold of the individual member banks by maximizing their:- Competitiveness - Profitability - Capital strength
Efficiency Local Market Focus
Increase efficiency compared to competitors by:
- Economies of scale- Mutually increasing
critical core competencies
- Sharing development investments
Each bank continues to maintain its link with its local community by:
- Keeping its own name and legal identity
- Taking advantage of its proximity to the local market
ALLIANCE PROGRAMME SEPARATE LEGAL IDENTITIES
COMMON SUPERBRAND

SRBANK’s activities
Holding company for the SpareBank 1 - Alliance
BN Bank ASA
(23.5%)
SpareBank 1 Boligkreditt AS
(16,7%)
SpareBank 1 Næringskreditt AS
(26,8%)
Commercial bank located in Oslo and Trondheim
Covered bond company (mortgages)
Covered bond company (commercial real estate)
SpareBank 1 Gruppen AS
(19.5%)
Retail Market
Number of man-years : 460
Capital Markets
Number of man-years : 30
Corporate Market
Number of man-years : 158
Number of man-years : 200
Key areas:• Leading real estate broker
Fully owned companies
Divisions of SpareBank 1 SR-Bank ASA
Partly owned companies
Number of man-years : 13
Key areas:• Asset management
Number of man-years : 32
Key areas:• Leasing
Administration & Support
Number of man-years : 209
SpareBank 1 Kredittkort
(18,1%)
Credit card company located in Trondheim
Number of man-years : 79
Key areas:• Accounting• Advisory
9
Number of man-years : 1
Key areas:• Covered Bond Funding
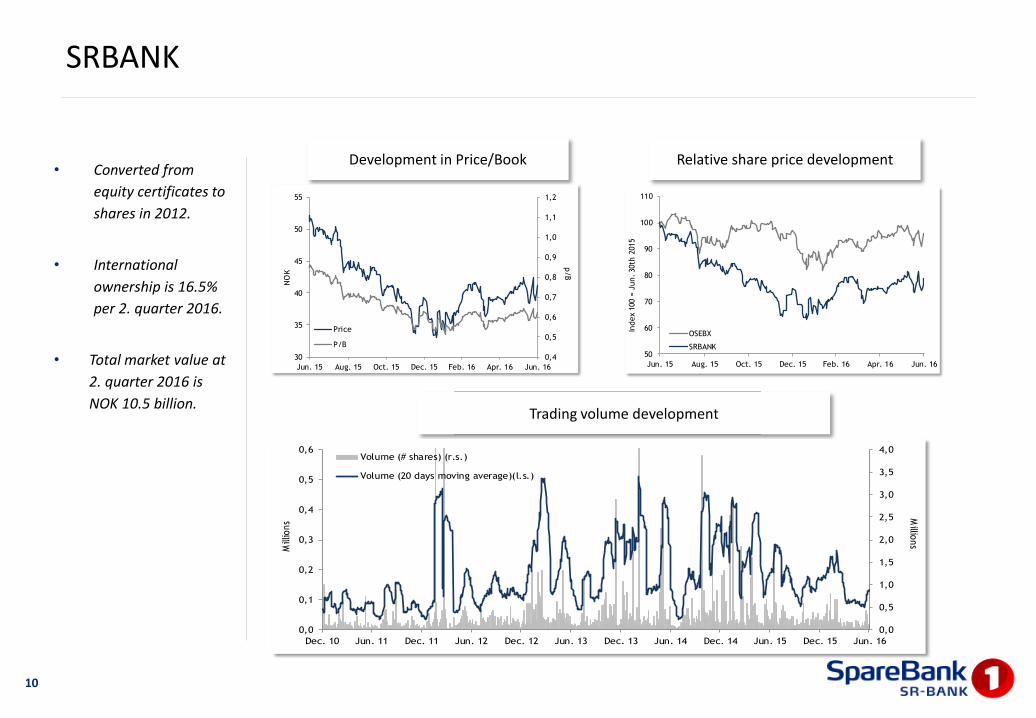
SRBANK
• Converted from
equity certificates to
shares in 2012.
• International
ownership is 16.5%
per 2. quarter 2016.
• Total market value at
2. quarter 2016 is
NOK 10.5 billion.
10
Development in Price/Book Relative share price development
Trading volume development
0,4
0,5
0,6
0,7
0,8
0,9
1,0
1,1
1,2
30
35
40
45
50
55
Jun. 15 Aug. 15 Oct. 15 Dec. 15 Feb. 16 Apr. 16 Jun. 16
p/B
NO
K
Price
P/B
50
60
70
80
90
100
110
Jun. 15 Aug. 15 Oct. 15 Dec. 15 Feb. 16 Apr. 16 Jun. 16
Index 1
00 =
Jun. 30th
2015
OSEBX
SRBANK
0,0
0,5
1,0
1,5
2,0
2,5
3,0
3,5
4,0
0,0
0,1
0,2
0,3
0,4
0,5
0,6
Dec. 10 Jun. 11 Dec. 11 Jun. 12 Dec. 12 Jun. 13 Dec. 13 Jun. 14 Dec. 14 Jun. 15 Dec. 15 Jun. 16
Millio
ns
Mill
ions
Volume (# shares) (r.s.)
Volume (20 days moving average)(l.s.)

20 largest shareholders as at June 2016
• Ownership interests:
• From Rogaland, Agder-counties and
Hordaland: 50.0%
• International: 16.5%
• 10 largest: 55.4%
• 20 largest: 62.4%
• Number of shareholders: 9 820 (10 070)
• Employees owning: 1,9%
11
Investor Number Stake
Sparebankstiftelsen SR-Bank 72.419.305 28,3%
Gjensidige Forsikring ASA 26.808.416 10,5%
Vpf Nordea Norge Verdi 7.982.657 3,1%
State Street Bank and Trust Co, U.S.A. Nominee 7.494.726 2,9%
SpareBank 1-stiftinga Kvinnherad 6.226.583 2,4%
Wimoh Invest AS 5.761.169 2,3%
Odin Norge 5.381.793 2,1%
Pareto Aksje Norge 3.536.161 1,4%
Danske Invest Norske Instit. II 3.448.585 1,3%
Clipper AS 2.565.000 1,0%
State Street Bank and Trust Co, U.S.A. Nominee 2.436.539 1,0%
State Street Bank and Trust Co, U.S.A. Nominee 2.067.767 0,8%
Danske Invest Norske Aksjer Inst. 1.820.694 0,7%
The Bank of New York Mellon, U.S.A. Nominee 1.792.683 0,7%
KAS Bank NV, Nederland Nominee 1.762.160 0,7%
Westco 1.658.537 0,6%
Pareto AS 1.640.867 0,6%
Vpf Nordea Avkastning 1.630.410 0,6%
State Street Bank and Trust Co, U.S.A. Nominee 1.587.649 0,6%
Vpf Nordea Kapital 1.528.050 0,6%
Top 5 120.931.687 47,3%
Top 10 141.624.395 55,4%
Top 20 159.549.751 62,4%

Agenda
12
Introduction to SpareBank 1 SR-Bank ASA
Financials
Appendix
Solvency and liquidity position
Financials

Pre-tax profit for the quarter is NOK 486 million compared to NOK 552 million last year
- Return on equity after tax 9.4%
Pre-tax profit year-to-date is NOK 973 million compared to NOK 1.180 million last year
- Return on equity after tax 9.3%
Impairment losses on loans is NOK 455 million compared to 132 million last year
- 0.50% of gross lending including covered bond companies as at 30 June 2016
- Collective impairment loss year-to-date is NOK 93 million and NOK 194 million last 12 months
12 months lending growth of 1.1%
- Risk-weighted assets (RWA) is decreased by 0.5% the last 12 months
12 months deposits growth of -1.3%
Growth in costs of -5.6% over the last 12 months
- Low costs growth influenced by the changed pension scheme and low bonus provisions, as well as the effect of
other cost-reducing measures
- Normalised costs growth is -5.0%
Common equity tier 1 capital ratio increased to 13.5% from 12.3% last year
Good underlying operations, but weaker result due to increased losses
13

Key figures – quarterly development
14
Return on equity CET 1 capital ratio
Cost/income ratio Earnings per share (NOK)
12,3% 12,2%13,3% 13,4% 13,5%
Q2 15 Q3 15 Q4 15 Q1 16 Q2 16
47,3%
42,3%
35,5%
43,6%
39,4%
Q2 15 Q3 15 Q4 15 Q1 16 Q2 16
1,69
1,47
1,73
1,51
1,59
Q2 15 Q3 15 Q4 15 Q1 16 Q2 16
10,8%9,3%
10,6%
9,0% 9,4%
Q2 15 Q3 15 Q4 15 Q1 16 Q2 16

Key figures
15
30.06 30.0616 15 Q2 16 Q1 16 Q4 15 Q3 15 Q2 15
Return on equity after tax (%) 9,3 11,7 9,4 9,0 10,6 9,3 10,8
Net interest margin (%) 1,47 1,44 1,48 1,44 1,40 1,39 1,44
Impairment losses on loans and guarantees in % of gross loans 0,58 0,18 0,78 0,39 0,50 0,25 0,12
-incl. covered bond companies 0,50 0,15 0,66 0,33 0,42 0,21 0,10
Non-performing and other problem commitments in % of gross loans 1,34 0,75 1,34 1,10 0,90 0,68 0,75
-incl. covered bond companies 1,15 0,62 1,15 0,92 0,76 0,56 0,62
Cost to income ratio 41,3 44,8 39,4 43,6 35,5 42,3 47,3
Annual growth in loans to customers, gross incl. covered bond companies (%)
1,1 7,6 1,1 2,9 5,4 7,4 7,6
Annual growth in deposits from customers (%) -1,3 11,1 -1,3 1,2 9,8 9,5 11,1
Total assets (BNOK) 196,8 181,9 196,8 194,8 192,0 191,5 181,9
Portfolio of loans in covered bond companies (BNOK) 26,7 31,2 26,7 28,8 28,7 31,0 31,2
Risk weighted assets (BNOK) 119,7 120,4 119,7 118,5 119,1 122,4 120,4
Liquidity Coverage Ratio (LCR) (%) 173 111 173 130 128 164 111
Earnings per share (NOK) 3,10 3,63 1,59 1,51 1,73 1,47 1,69
Book value per share (NOK) 67,16 62,56 67,16 67,68 66,14 64,02 62,56
Number of shares issued (million) 255,8 255,8 255,8 255,8 255,8 255,8 255,8
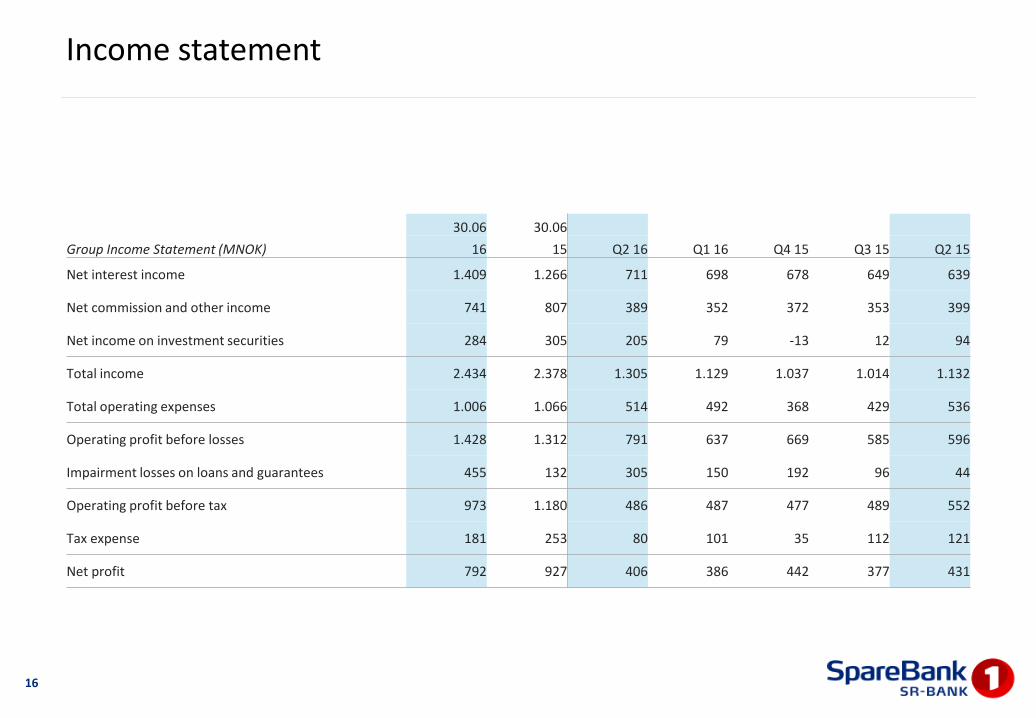
Income statement
16
30.06 30.06
Group Income Statement (MNOK) 16 15 Q2 16 Q1 16 Q4 15 Q3 15 Q2 15
Net interest income 1.409 1.266 711 698 678 649 639
Net commission and other income 741 807 389 352 372 353 399
Net income on investment securities 284 305 205 79 -13 12 94
Total income 2.434 2.378 1.305 1.129 1.037 1.014 1.132
Total operating expenses 1.006 1.066 514 492 368 429 536
Operating profit before losses 1.428 1.312 791 637 669 585 596
Impairment losses on loans and guarantees 455 132 305 150 192 96 44
Operating profit before tax 973 1.180 486 487 477 489 552
Tax expense 181 253 80 101 35 112 121
Net profit 792 927 406 386 442 377 431

Change in profit 30.06.2015 – 30.06.2016
17
1.18077
0- 21
60 - 323
973
0
200
400
600
800
1.000
1.200
1.400
30.0
6.2
01
5
Net
inte
rest
inco
me
incl
.co
mm
issi
on
fro
mco
vere
d b
on
dco
mp
anie
s
Oth
er in
com
e
Net
inco
me
on
inve
stm
ent
secu
riti
es
Tota
l op
erat
ing
exp
ense
s
Imp
airm
ent
loss
es o
nlo
ans
and
gu
aran
tee
s
30.0
6.2
01
6
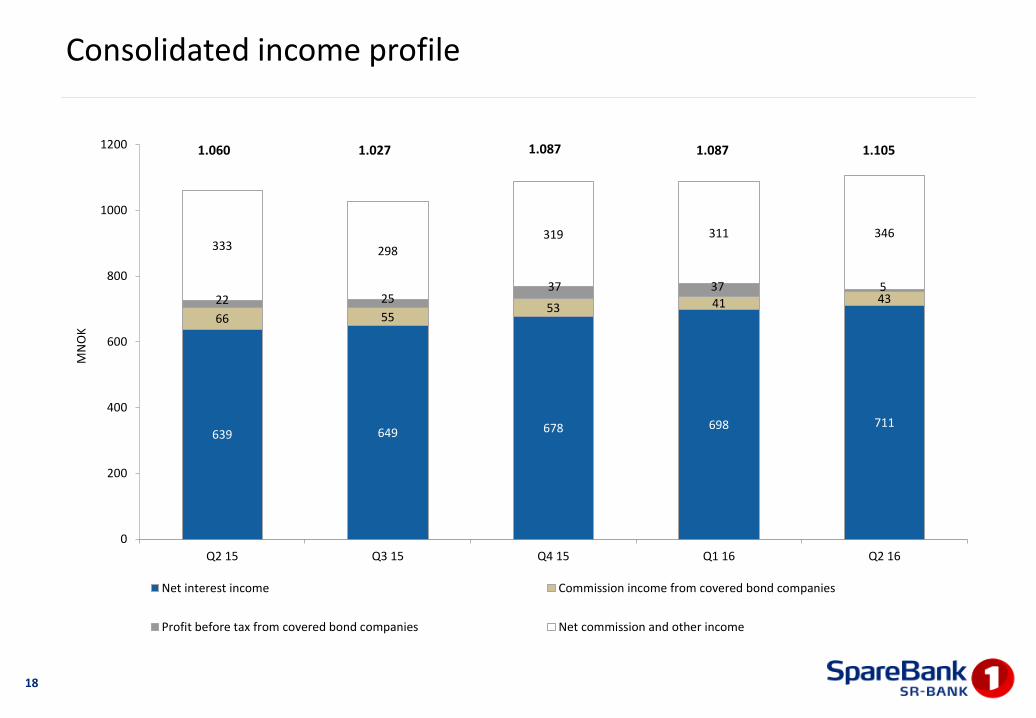
639 649 678 698 711
66 5553 41 4322 2537 37 5
333 298319 311 346
0
200
400
600
800
1000
1200
Q2 15 Q3 15 Q4 15 Q1 16 Q2 16
MN
OK
Net interest income Commission income from covered bond companies
Profit before tax from covered bond companies Net commission and other income
Consolidated income profile
18
1.1051.060 1.027 1.087 1.087

Lending and deposit margins
Lending margins
Deposit margins
19 Definition: Average customer interest rate against 3-month moving average for 3-month NIBOR. Lending margins include loan portfolio in covered bond companies
2,90% 2,89% 2,80% 2,66% 2,59% 2,59% 2,58% 2,68% 2,75%
2,08% 1,97% 1,95% 1,95%1,64% 1,61% 1,56% 1,48% 1,55%
Q2 14 Q3 14 Q4 14 Q1 15 Q2 15 Q3 15 Q4 15 Q1 16 Q2 16Corporate market Retail market
-0,50%
-0,49%
-0,47% -0,46%-0,38%
-0,25%-0,21%
-0,05% -0,12%
-0,64%
-0,45%
-0,48% -0,55%
-0,25%
-0,18%-0,06%
0,11%0,12%
Q2 14 Q3 14 Q4 14 Q1 15 Q2 15 Q3 15 Q4 15 Q1 16 Q2 16
Corporate market Retail market

Corporate Market (incl. Capital Markets)
Retail Market
20Figures incl. loan portfolio in covered bond companies
Lending volume and 12 months growth
1,4% 2,5%
5,6%
12,8% 13,8%12,5%
7,1%
3,0%
-0,5%
-5%
0%
5%
10%
15%
0
10 000
20 000
30 000
40 000
50 000
60 000
Q2 14 Q3 14 Q4 14 Q1 15 Q2 15 Q3 15 Q4 15 Q1 16 Q2 16
MN
OK
Volume Growth %
4,8%3,8% 4,1% 4,6% 4,7% 5,2% 4,6%
3,1%1,8%
0%
5%
10%
15%
0
20 000
40 000
60 000
80 000
100 000
120 000
Q2 14 Q3 14 Q4 14 Q1 15 Q2 15 Q3 15 Q4 15 Q1 16 Q2 16
MN
OK
Volume Growth %

21
• Gross loans as at 30 June 2016 amount
to NOK 183.4 billion compared with NOK
181.4 billion at the same time the year
before.
• 12-month growth in loans of 1.1%.
• Loans to retail customers (incl. covered
bond company) account for 62.8% of
total loans.
Loans before individual write-downs, nominal amounts.
Sector allocation in accordance with the standard categories from Statistics Norway.
Loan portfolio as at 30.06.2016
0,3 %
14,3 %
48,5 %
0,4 %
1,0 %
4,5 %
14,8 %
6,5 %
1,7 %
1,6 %
3,7 %
2,8 %
0,3 %
16,9 %
45,5 %
0,3 %
1,2 %
4,6 %
15,6 %
6,1 %
1,6 %
1,4 %
3,6 %
2,8 %
0,0 % 10,0 % 20,0 % 30,0 % 40,0 % 50,0 % 60,0 %
SB1 Næringskreditt
SB1 Boligkreditt
Retail customers
Other
Pub. mgm., financial services and others
Service industry
Real estate
Offshore/Oil and gas
Shipping
Retail trade, hotels and restaurants
Industry, Power/water supply andconstruction
Agriculture / forestry / fishing
30.06.2015 30.06.2016
22
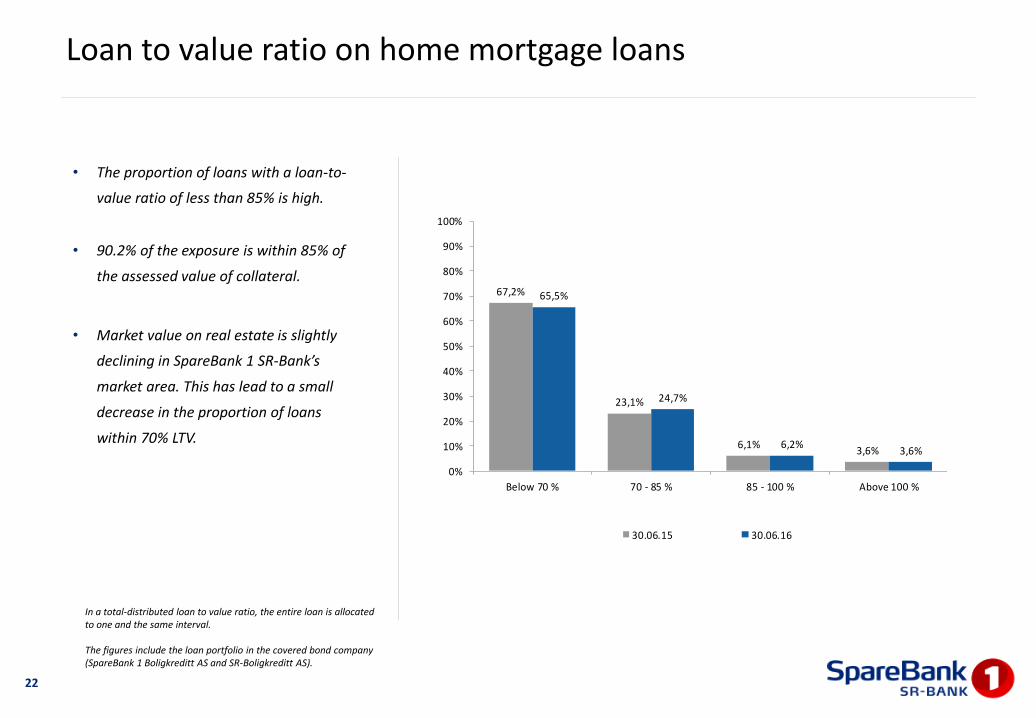
• The proportion of loans with a loan-to-
value ratio of less than 85% is high.
• 90.2% of the exposure is within 85% of
the assessed value of collateral.
• Market value on real estate is slightly
declining in SpareBank 1 SR-Bank’s
market area. This has lead to a small
decrease in the proportion of loans
within 70% LTV.
In a total-distributed loan to value ratio, the entire loan is allocated to one and the same interval.
The figures include the loan portfolio in the covered bond company (SpareBank 1 Boligkreditt AS and SR-Boligkreditt AS).
Loan to value ratio on home mortgage loans
67,2%
23,1%
6,1%3,6%
65,5%
24,7%
6,2%3,6%
0%
10%
20%
30%
40%
50%
60%
70%
80%
90%
100%
Below 70 % 70 - 85 % 85 - 100 % Above 100 %
30.06.15 30.06.16

Lending to the corporate market – risk profile
23
• The quality of the corporate market
portfolio is good.
• The share of customers with PD* below
0.5% is increasing and is now at 23.2 %.
• SpareBank 1 SR-Bank monitors PD above
2.5% continuously, and the development in
this segment has been stable in 2016.
• There is a clearly defined framework that
sets limits on what is funded and conditions
for particular funding purposes. This
ensures a robust portfolio.
*Probability of default (PD) through a full cycle of loss.
Corporate lending portfolio distributed by risk class
Migration in the corporate lending portfolio over the past 12 months
20,8% 20,7% 21,7% 24,2% 23,2%
56,5% 57,5% 54,3% 51,8% 53,3%
22,7% 21,8% 24,0% 24,0% 23,5%
0%
20%
40%
60%
80%
100%
30.06.15 30.09.15 31.12.15 31.03.16 30.06.16
PD % 0.00 - 0.50 PD % 0.50 - 2.50 PD % 2.50 - 99.9
-6.000
-4.000
-2.000
0
2.000
4.000
6.000
8.000
10.000
Exit Additions Change in existing
portfolio
Total change
NO
K M

Deposits volume and 12 month growth
24
• Last 12 months deposits decreased by NOK
1.2 billion to 89.6 billion.
• Corresponds to an decrease in the
period of -1.3%.
• Lower deposit growth in the corporate
market (incl. capital market) is a result of
larger deposits from institutional
customers, held as part of the liquidity
portfolio, having been replaced by other
instruments to protect the group's liquidity.
* Includes also the Capital Markets Division.
Corporate Market*
Retail Market
18,9%24,1% 20,3%
26,1%
17,7%13,9% 15,4%
-2,4%-6,5%
-10%
0%
10%
20%
30%
0
10.000
20.000
30.000
40.000
50.000
Q2 14 Q3 14 Q4 14 Q1 15 Q2 15 Q3 15 Q4 15 Q1 16 Q2 16
MN
OK
Volume Growth %
6,2%7,9% 8,9% 7,8% 5,9% 6,2% 5,0% 4,3% 3,6%
-5%
5%
15%
0
10.000
20.000
30.000
40.000
50.000
Q2 14 Q3 14 Q4 14 Q1 15 Q2 15 Q3 15 Q4 15 Q1 16 Q2 16
MN
OK
Volume Growth %

Operating expenses
25
30.06 30.06
MNOK 16 15 Q2 16 Q1 16 Q4 15 Q3 15 Q2 15
Personnel expenses 592 603 296 296 255 284 300
Restructuring- and non-recurring costs, pensions -1 7 0 -1 -141 -63 0
Total personnel expenses 591 610 296 295 114 221 300
IT expenses 151 145 78 73 86 70 73
Marketing 34 47 20 14 19 24 26
Other administrative expenses 31 49 16 15 20 20 23
Total administrative expenses 216 241 114 102 125 114 122
Depreciation 37 42 19 18 23 20 22
Operating expenses from real estate 17 20 8 9 12 9 10
Other operating expenses 145 153 77 68 94 65 82
Total other operating expenses 199 215 104 95 129 94 114
Total operating expenses 1.006 1.066 514 492 368 429 536

Impairment losses on loans/ Non-performing and doubtful commitments
26
Impairment losses on loans Non-performing and doubtful commitments
2546
141
90
272
19
50
51
60
33
0,12%
0,25%
0,50%
0,39%
0,78%
0,10%
0,21%
0,42%0,33%
0,66%
Q2 15 Q3 15 Q4 15 Q1 16 Q2 16
Collective impairment losses on loans, MNOK
Individual impairment losses on loans, MNOK
Loss ratio in % of average gross loans
Loss ratio in % of average gross loans incl. from coveredbond companies
404 350
853 754 872
716683
548943
1235
0,75% 0,68%0,90%
1,10%1,34%
0,62% 0,56%0,76%
0,92%
1,15%
30.06.15 30.09.15 31.12.15 31.03.16 30.06.16
Doubtful commitments, MNOK
Non-performing loans, MNOK
Non-performing and doubtful commitments in % of gross loans
Non-performing and doubtful commitments in % of gross loansincl. from covered bond companies

Agenda
27
Introduction to SpareBank 1 SR-Bank ASA
Financials
Appendix
Solvency and liquidity position
Financials
Solvency and liquidity position

Funding
28
Deposits to loans ratio
Annual funding maturity
• Well diversified funding.
• Greater share of senior and OMF funding last year.
‒ Euro-benchmarks with due dates in each of the
years 2017- 2021.
‒ 3 outstanding euro covered bonds Level 1B
through SR-Boligkreditt.
• Funding indicator 1* is 108.3% on consolidated
basis.
• Good liquidity
‒ Net refinancing need over the next 12 months is
NOK 14.8 billion.
‒ Liquidity buffer is NOK 26.9 billion for normal
operation in 28 months with closed markets. In
addition to the liquidity buffer, NOK 15.7 billion
of home mortgages are prepared for covered
bond funding.
• SR-Boligkreditt was established in the first quarter of 2015.
‒ Rated Aaa by Moody’s.
‒ Issued 2 covered bonds in the Norwegian
market and 3 Euro-benchmarks.
‒ SR-Boligkreditt will ensure optimal funding mix
and eliminate limitations due to regulatory
limits on large exposures.
*Funding indicator 1 is a ratio of illiquid assets financed by
issued securities with a duration of more than 1 year.
60,4% 59,1% 57,5% 59,4% 60,4% 58,6% 57,6% 56,1% 57,2%
0,0 %
20,0 %
40,0 %
60,0 %
80,0 %
100,0 %
Q2 14 Q3 14 Q4 14 Q1 15 Q2 15 Q3 15 Q4 15 Q1 16 Q2 16
0,02,04,06,08,0
10,012,014,016,0
2016 2017 2018 2019 2020 2021 2022 2023 2024+
NO
K B
illio
n
Funding ex CB Covered Bonds SR-Boligkreditt

An established borrower in the Euromarket
29
Issuer / Ticker Coupon Amount Maturity ISIN
SR-Bank / SRBANK 3,500% EUR500mn 27-March-2017 XS0762421195
SR-Bank / SRBANK 2,000% EUR500mn 14-May-2018 XS0853250271
SR-Bank / SRBANK 2,125% EUR500mn 27-February-2019 XS0965489239
SR-Bank / SRBANK 2,125% EUR500mn 03-February-2020 XS0876758664
SR-Bank / SRBANK 2,125% EUR750mn 14-April-2021' XS1055536251
SR-BOL / SRBANK 0.500% EUR500mn 28-September-2020 XS1297977115
SR-BOL / SRBANK 0,125% EUR750mn 8-September-2021 XS1429577791
SR-BOL / SRBANK 0.750% EUR500mn 18-January-2023 XS1344895450
0
20
40
60
80
100
120
0
20
40
60
80
100
120
Jun-15 Sep-15 Dec-15 Mar-16 Jun-16
Bp
s.
Bp
s.
DNBNO 3⅞ 06/29/2020
NDASS 4 06/29/2020
SRBANK 2⅛ 02/03/2020
0
20
40
60
80
100
120
0
20
40
60
80
100
120
Jun-15 Sep-15 Dec-15 Mar-16 Jun-16
Bp
s.
Bp
s.
SEB 2 02/19/2021
OPBANK 2 03/03/2021
SRBANK 2⅛ 04/14/2021
NDASS 2 02/17/2021

Funding structure
30
• LCR of 173% at the end of June 2016. Average LCR during Q2 2016 was 143%.
Average maturity of long term funding (excl. covered bonds)
0,0
10,0
20,0
30,0
40,0
50,0
60,0
70,0
80,0
0,0
0,5
1,0
1,5
2,0
2,5
3,0
3,5
4,0
4,5
Q1
08
Q2
08
Q3
08
Q4
08
Q1
09
Q2
09
Q3
09
Q4
09
Q1
10
Q2
10
Q3
10
Q4
10
Q1
11
Q2
11
Q3
11
Q4
11
Q1
12
Q2
12
Q3
12
Q4
12
Q1
13
Q2
13
Q3
13
Q4
13
Q1
14
Q2
14
Q3
14
Q4
14
Q1
15
Q2
15
Q3
15
Q4
15
Q1
16
Q2
16
Vo
lum
e N
OK
Bill
ion
Mat
uri
ty (
firs
t ca
ll)
Volume Maturity (first call)

11,4%12,3%
13,5%
0%
2%
4%
6%
8%
10%
12%
14%
16%
18%
30.06.14 30.06.15 30.06.16
CET 1 capital ratio Tier 1 capital ratio Capital ratio
Stronger capital ratio
31
• SpareBank 1 SR-Bank is compliant with
capital requirements as at 30.06.2016.
• SpareBank 1 SR-Bank received IRB Advanced
approval for the corporate market portfolio
in the first quarter of 2015.
• The use of different risk weights in the Nordic
countries makes comparisons of actual
financial strength difficult.
• The Basel I floor is also practised
differently.
• Leverage ratio is 6.4% as at 30.06.2016.
SpareBank 1 SR-Bank exceeds the levels
being discussed internationally.
Due to transitional rules, the minimum capital adequacy requirements
cannot be reduced below 80 per cent of the corresponding figure
calculated according to the Basel I regulations.
13,2%
14,6% 15,3%
13,1%
16,8%
14,4%

32
RWA home mortgages
• RWA on home mortgages reflects a solid
and stable portfolio.
• The Norwegian FSA tightened the
requirements for morgtage models in 2015
imposed by restrictions on PD and LGD.
Probability of default (PD) through a full cycle of loss.
LGD (Loss Given Default): Estimated loss given default of one single loan. The calculation is based on the realisation value of assets pledged as security in an economic downturn.
Home mortgages as defined in the Norwegian IRB framework; residential property must make up at least 30 % of a loan’s security.
Figures include the portfolio sold to the covered bond company (SpareBank 1 Boligkreditt AS and SR-Boligkreditt AS).
22,4 %22,3 %
22,8 % 22,8 %
22,5 %
30.06.15 30.09.15 31.12.15 31.03.16 30.06.16

8,3%10,0%
11,1% 11,5%13,3% 13,5%
4,5%
2,5%
3,0%
1,5%
2,0%
0,00%
2,00%
4,00%
6,00%
8,00%
10,00%
12,00%
14,00%
16,00%
0,00%
2,00%
4,00%
6,00%
8,00%
10,00%
12,00%
14,00%
16,00%
CET 1 capital ratio
ROE 10,8%
ROE 11,2%
ROE 9,3%
Common Equity Tier 1 being strengthened in line with stricter regulatory requirements
• New capital requirements entail a need to
continue increasing common equity tier 1
capital going forward.
• In addition, the Norwegian FSA will during the
2016 determining an individual Pilar 2-
requirements that will be added on the
regulatory minimum requirements for CET 1.
• SpareBank 1 SR-Bank is not defined as a
systemically important financial institution
(SIFI).
• To meet regulatory and market requirements
for solvency, the target CET 1 level is minimum
14.0% in 2016 and 14.5% during 2017. The
target expected to be reached through good
profitability and retained earnings combined
with limited growth in risk-weighted assets.
33
ROE 12,4%
ROE 14,0%
11,5 -13,5%ROE 14,2%
SIFI
Countercyclical buffer
Systemic risk buffer
Capital conservation buffer
The regulatory minimum requirements

Increasing CET 1 – well prepered to reach capital requirements
34
Stronger common equity tier 1 in 2015
• IRB Advanced approval for the corporate market
portfolio
• Changed pension scheme
• Good profitability
• Moderate growth
• Capital efficiency
• Moderate dividend
Guiding 2016
• Good profitability: Target 11% return on equity
• Marginal decline in risk-weighted assets (RWA)
• Runoff of BN Bank’s corporate portfolio
• Moderate dividend
Guiding 2016
13,3% 13,5%0,1% 0,2% 13,8%
0,7% 14,5%
0%
2%
4%
6%
8%
10%
12%
14%
16%
31
.12
.20
15
30
.06
.20
16
Re
gula
tory
Re
bal
anci
ng
Spar
eBan
k 1
Bo
ligkr
edit
t
An
ad
dit
ion
al 2
5%
of
pro
fits
Pro
form
a 3
0.0
6.2
01
6 in
cl. 7
5%
of
pro
fits
an
d r
eb
alan
cin
g Sp
are
Ban
k1
Bo
ligkr
edit
t
Re
tain
ed
pro
fit
and
ch
ange
inR
WA 3
1.1
2.2
01
6 E

Outlook
35
Norwegian exports more competitive due to a weaker exchange rate and interest rates stimulate business and household
spending.
Major infrastructure projects helps to ensure good conditions for the region's business and population growth, with
moderate unemployment.
Uncertainty, especially in the petroleum sector, has increased due to lower oil prices. From record high levels, oil
investments are reduced with approximately 16% in 2015, and continue decreasing with approximately 10% in 2016.
Uncertainty about economic developments may dampen demand for loans, while low interest rates work in the opposite
direction. We expect stable to slightly declining house prices going forward and still strong competition for new home
mortgage customers.
Long-lasting low oil prices may have negative impacts for the construction sector and the retail sector in the region.
SpareBank 1 SR-Bank expects in the coming quarters to make loan loss provisions at the same level as so far in 2016.
Solid earnings from a robust business model indicates SpareBank 1 SR-Bank well positioned to build up the necessary capital
going forward, while ensuring continued competitiveness.
An offensive approach for the future including investing in new technology and focus on accounting services and consulting.

5,4%
-0,2% 0,0% -1,0%
-2,0 %
-1,0 %
0,0 %
1,0 %
2,0 %
3,0 %
4,0 %
5,0 %
6,0 %
2015 30.06.16 Target 2016 Revisedestimate
2016
0,1%
-5,0%
0,0%
-2,0%
-6,00%
-5,00%
-4,00%
-3,00%
-2,00%
-1,00%
0,00%
1,00%
2015 30.06.16 Target2016
Revisedestimate
2016
Financial targets and estimates for 2016
36
Return on equity CET 1 capital ratio Growth in loans
Dividend shareImpairment lossesNormalised growth in costs
NOK 420million
NOK 455million
NOK 500 – 700million
NOK 700 – 900million
2015 30.06.16 Estimate2016
Revisedestimate
2016
22%20% - 25% 20% -25%
2015 Estimate 2016 Revisedestimate 2016
10,8%
9,3%
11,0%
2015 30.06.16 Target 2016
13,3% 13,5% 14,0%
2015 30.06.16 Target 2016

Agenda
37
Introduction to SpareBank 1 SR-Bank ASA
Financials
Appendix
Solvency and liquidity position
Financials
Appendix
SpareBank 1 SR-Bank has a moderate risk profile in which no single event should be capable of seriously harming the bank's financial position
38
• The core purpose of the banking industry is to create value by assuming deliberate and acceptable risk
• SpareBank 1 SR-Bank therefore invests significant resources in developing risk management systems, processes and expertise that are in
line with leading international practice
• The bank's primary market areas are Rogaland, the Agder counties and Hordaland
• Financing outside this market area is based on customers based in the group's market area
• The bank's set clear requirements for loan activities in the corporate market
• The activities that are financed must have a long-term perspective
• The group must be very familiar with the ownership and management of the company
• All financing decisions are based on the customer's debt-servicing capacity and a lack of debt-servicing capacity may not be compensated
for through higher security
• Shipping and offshore related financing (including significant parts of oil-related activities) are handled by centralised expertise
• The bank sets specific limits for the size of commitments as well as requirements concerning industry diversification
• The maximum total exposure to an individual customer must be significantly lower than the regulatory requirements
• The maximum unsecured exposure to an individual customer must not be so great that the potential loss cannot be absorbed without the
group's financial position being significantly affected
• This requires a diversified portfolio. The exposure to specific industries is subject to specific limits.
• The bank sets special requirements for all property financing
• Self-financing requirements apply for all types of property financing - in relation to both residential and commercial property
• Advanced sales requirements also apply for financing housing development projects
• In addition to this, requirements that limit loan size/rent income ratio apply for financing commercial property

SpareBank 1 SR-Bank has a well diversified portfolio 8.6% (8.7%) of total EAD is related to oil operations
39
SpareBank 1 SR-Bank* has total BNOK 202.9 (202.5) EAD per 30.06.2016 BNOK 17.4 (17.6) EAD is related to oil operations
EAD: Exposure at defaultFigures in parentheses as at 31.12.2015.
* Include portfolio in covered bond company.
Retail market; 66.6% (66.1%)
Corporate market excl. oil operations; 24.8%
(25.2%)
Offshore; 5.0%(5.1%)
Oil service; 2.5%(2.5%)
Exploration and production companies; 1.1%
(1.1%)Oil operations; 8.6%
(8.7%)

Oil services - total NOK 5.0 billion(NOK 5.0 billion as at 31.12.2015)
40
Exploration and concept studies
• EAD NOK 0.7 billion
• Average weighted probability of default 1.0%
Field development and start-up drilling
• EAD NOK 1.0 billion
• Average weighted probability of default 1.5%
Operational fields and operational drilling
• EAD NOK 2.6 billion
• Average weighted probability of default 1.8%
On shore facilities
• EAD NOK 0.3 billion
• Average weighted probability of default 1.9%
Other oil services
• EAD NOK 0.4 billion
Oil services
• EAD NOK 5.0 billion, 2.5% of the bank's total EAD
• Average weighted probability of default for the oil services portfolio is 1.6%
• Funding of operating capital through current and fixed assets, as well as
guarantees
EAD: Exposure at defaultFigures in parentheses as at 31.12.2015.
Exploration and concept studies;
MNOK 701(MNOK 755)
Field development and startup
drilling; MNOK 991(MNOK 1.056)
Fields and operation
drilling; MNOK 2.623
(MNOK 1.886)
On shore facilities; MNOK 332(MNOK 925)
Other oil service; MNOK 400(MNOK 400)
Oil and gas - total NOK 2.2 billion(NOK 2.2 billion as at 31.12.2015)
41
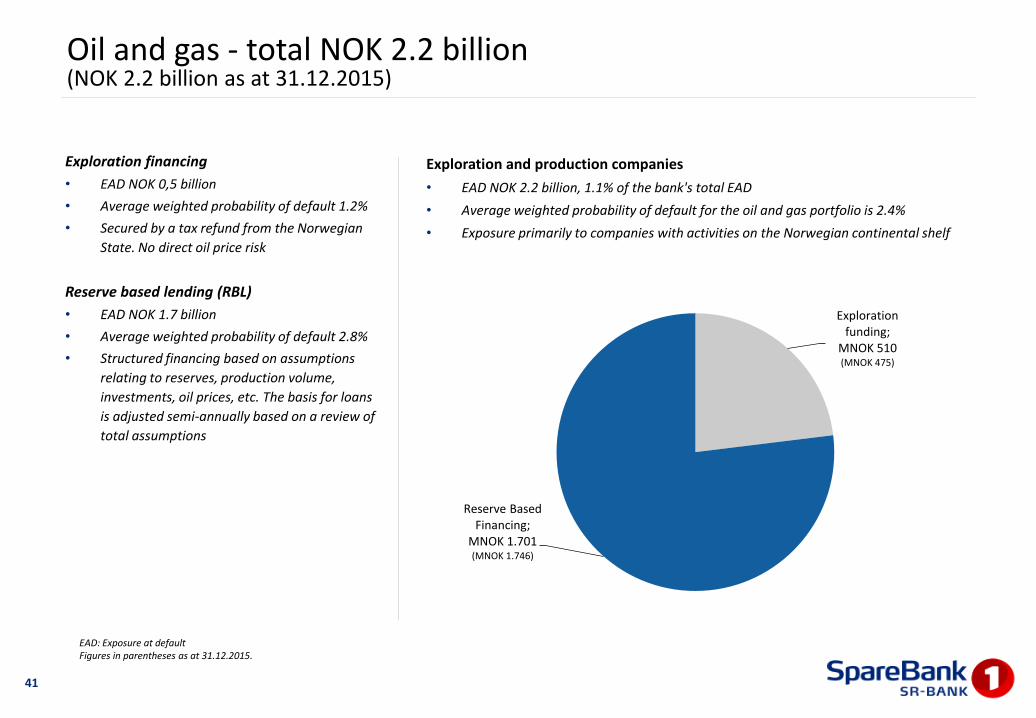
Exploration financing
• EAD NOK 0,5 billion
• Average weighted probability of default 1.2%
• Secured by a tax refund from the Norwegian
State. No direct oil price risk
Reserve based lending (RBL)
• EAD NOK 1.7 billion
• Average weighted probability of default 2.8%
• Structured financing based on assumptions
relating to reserves, production volume,
investments, oil prices, etc. The basis for loans
is adjusted semi-annually based on a review of
total assumptions
Exploration and production companies
• EAD NOK 2.2 billion, 1.1% of the bank's total EAD
• Average weighted probability of default for the oil and gas portfolio is 2.4%
• Exposure primarily to companies with activities on the Norwegian continental shelf
EAD: Exposure at defaultFigures in parentheses as at 31.12.2015.
Exploration funding;
MNOK 510(MNOK 475)
Reserve Based Financing;
MNOK 1.701(MNOK 1.746)

Offshore - total NOK 10.2 billion(NOK 10.4 billion as at 31.12.2015)
42
Offshore Service Vessels
• EAD NOK 7.2 billion, average weighted
probability of default is 1.4%, weighted average
age is 7.7 years, average weighted contract
coverage for 2016 and 2017 of 57% and 46%
respectively, average weighted LTV 67%, 77
vessels
Rigs
• EAD NOK 2.0 billion, average weighted
probability of default is 5.1%, weighted average
age is 9.1 years, average weighted contract
coverage for 2016 and 2017 of 78% and 63%
respectively, average weighted LTV 68%, 17 rigs
Seismiv vessels
• EAD NOK 1.0 billion, average weighted
probability of default is 1.5%, weighted average
age is 11.8 years, average weighted contract
coverage for 2016 and 2017 of 69% and 68%
respectively, average weighted LTV 76%, 7
vessels
• Applies to ship financing, not seismic equipment
Offshore
• EAD NOK 10.2 billion, 5.0% of the bank's total EAD
• Average weighted probability of default for the offshore portfolio is 2.1%
• Exposure primarily to industrial-oriented shipping companies with strong
ownership and integrated organisation
EAD: Exposure at defaultFigures in parentheses as at 31.12.2015.LTV: Loan to Value. Value estimates per 31.12.2015
Rig; MNOK 1.958(MNOK 1.974)
Seismic; MNOK 1.034 (MNOK 1.096)
Offshore Service Vessels;
MNOK 7.243(MNOK 7.320)

Offshore Service Vessels - total NOK 7.2 billion(NOK 7.3 billion as at 31.12.2015)
43
PSV
• EAD NOK 2.6 billion, weighted average age is 4.9
years
AHTS
• EAD NOK 0.6 billion, weighted average age is 8.0
years
Subsea
• EAD NOK 2.6 billion, weighted average age is 7.7
years
Standby/area contingency
• EAD NOK 0.6 billion, weighted average age is 4.8
years
Accommodation
• EAD NOK 0.8 billion, weighted average age is
18.9 years
EAD: Exposure at defaultFigures in parentheses as at 31.12.2015.
Offshore Service Vessels
• Most customers with long history as a borrower in SpareBank 1 SR-Bank
• Most of the companies are listed on stock exchange or family owned
• A major part is industrially focused companies, only a small number of
financially oriented owners
PSV; MNOK 2.621(MNOK 2.722)
Subsea;MNOK 2.621
(MNOK 2.655)
AHTS; MNOK 633(MNOK 586)
Standby; MNOK 565(MNOK 611)
Accommodation; MNOK 803(MNOK 745)

Offshore Service Vessels – largest customer group
44
• Well diversified portfolio. One commitment of
NOK 1.2 billion, rest of NOK 800 million or lower
• Total EAD for the portfolio is NOK 7.2 billion of
which;
• NOK 5.7 billion consists of 9 restructured
commitments
• NOK 1.0 billion consists of 5
commitments under consideration
• NOK 0.5 billion consists of 4
commitments where it is not required
• Financing of 77 vessels, all with 1. priority pledge
• Generally low loan to value (LTV). Valuations
made by 3. party brokerage companies as of
31.12.2015. Value estimates reduced by 20%
from 31.12.2014
0 200 400 600 800 1.000 1.200 1.400
18
17
16
15
14
13
12
11
10
9
8
7
6
5
4
3
2
1
EAD NOK million
Cu
sto
mer
Number of vessels
LTV
9 70 %
8 66 %
8 68 %
4 66 %
8 55 %
2 86 %
2 92 %
10 62 %
5 73 %
6 50 %
1 98 %
3 38 %
2 62 %
2 61 %
4 55 %
1 87 %
1 36 %
1 37 %
Restructured Under consideration Not required

Lending to commercial property
45
Sector allocation in accordance with the standard categories from Statistics Norway.
Figures in parentheses as at 30.06.2015.
Lending to commercial property
• NOK 27.1 billion, 14.8% of the bank’s total
loans.
• The portfolio is characterised by lending to
commercial properties for leasing with long-
term contracts and financially solid tenants.
The vacancy rate is limited. Interest rates for
a significant portion of this portfolio have
been hedged.
Development and sale of real estate;
19,3 % (17,9%)
Purchase and sale of real estate; 11,8 % (8,8%)
Letting of real estate; 61,7 %
(66,9%)
Housing cooperative; 5,2 %
(4,6%)Real estate
management; 2,0 % (1,6%)

SpareBank 1 SR-Bank monitors and follows up pro-actively
• The bank continuously monitors portfolios
• If special incidents occur, special portfolio reviews are conducted
• The customer units continuously and pro-actively follow up the bank's credit customers
• Commitments where the risk of poorer debt-servicing capacity increases significantly are included on the
bank's watch list:
• subject to special follow-up
• use of the bank's total resources
• if necessary resources from the bank's 'work out' unit
• The bank's loan portfolio with individual commitments, where EAD is more than NOK 50 million, has recently
been analysed in order to identify commitments that might be affected by a prolonged fall in oil prices. The
main observations are:
• Good diversification
• The majority of the exposure is related to businesses:• with a clear industrial profile
• linked to exploration and production companies in oil and gas
• where the primary activity is linked to the Norwegian continental shelf
• Low exposure to the most risky part of the value chain that is exploration and development
46

• SpareBank 1 SR-Bank's objectives are to stimulate growth
and development in the region
• To provide a sustainable contribution to the wealth
creation process in the region through:• A sustainable and profitable business model
• An owner-friendly, stable dividend policy
Our vision: the customer's first choice in Southern and Western Norway
Objectives Financial goals
• Return on equity of 11% after tax in 2016. The longer term
target is a minimum of 11%.
• Top 50% return on equity and cost/income in a Nordic
benchmark
• Nearer to people and companies
• We want to be nearer to people and companies than our competitors by understanding the people, companies and markets in the region better than our competitors.
• We want to learn what is important for our customers through a combination of close, personal relationships and the proper utilisation of customer data. We want to be an accessible, long-term partner whom the customers trust.
Strategic goals Strategic focus
• Portfolio quality
• Managed and selective growth, greater product mix
• Risk pricing
• Portfolio management
• Innovation, digitalisation and continuous streamlining - cost effectiveness
• Strengthening capital
• Diversified funding platform
47

SpareBank 1 Alliance
BN Bank(23,5%)
Bank 1 Oslo Akershus
(4,8%)
SpareBank 1Boligkreditt
(16,7%)
SpareBank 1Næringskreditt
(26,8%)
SpareBank 1 Gruppen AS
SpareBank 1Life insurance
(100%)
SpareBank 1Nonlife insurance
(100%)
ODIN Asset Management
(100%)
Collection(100%)
SpareBank 1 Factoring(100%)
Owners of the alliance
Sales, loan portfolios, capitalProducts, commissions, dividends
Banking Cooperation
19,5% 19,5% 19,5% 19,5% 11,0% 9,6%
• All credit decisions are made at the local banks• Economies of scale related to expenses, IT solutions, marketing and branding
Companies directly owned by SR-Bank
1,4%
SpareBank 1 Kredittkort
(18,1%)
Samspar
48
SpareBank 1 Mobilbetaling
(19,7%)
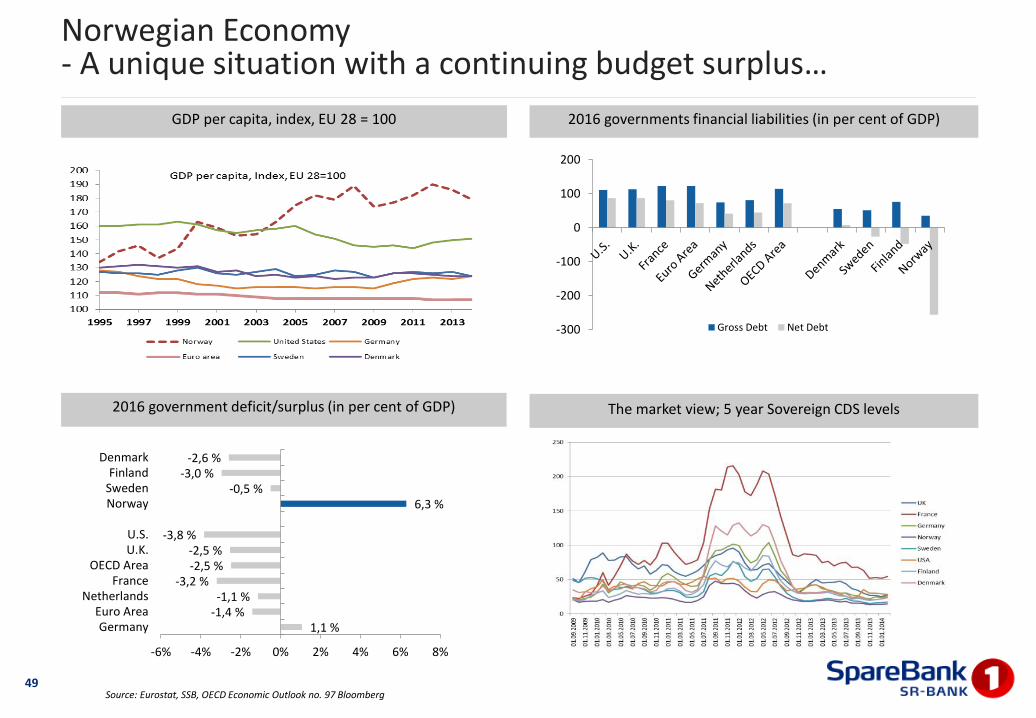
Norwegian Economy- A unique situation with a continuing budget surplus…
49
GDP per capita, index, EU 28 = 100
2016 government deficit/surplus (in per cent of GDP) The market view; 5 year Sovereign CDS levels
2016 governments financial liabilities (in per cent of GDP)
Source: Eurostat, SSB, OECD Economic Outlook no. 97 Bloomberg
-300
-200
-100
0
100
200
Gross Debt Net Debt
1,1 %-1,4 %-1,1 %
-3,2 %-2,5 %-2,5 %
-3,8 %
6,3 %-0,5 %
-3,0 %-2,6 %
-6% -4% -2% 0% 2% 4% 6% 8%
GermanyEuro Area
NetherlandsFrance
OECD AreaU.K.U.S.
NorwaySwedenFinland
Denmark
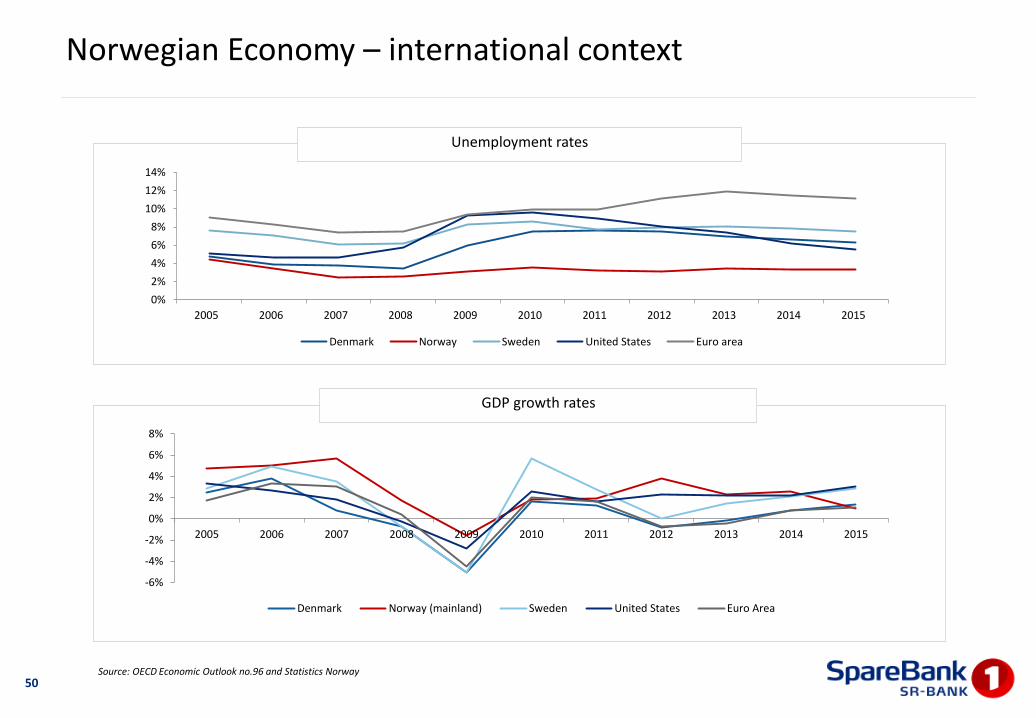
Unemployment rates
GDP growth rates
50Source: OECD Economic Outlook no.96 and Statistics Norway
Norwegian Economy – international context
-6%
-4%
-2%
0%
2%
4%
6%
8%
2005 2006 2007 2008 2009 2010 2011 2012 2013 2014 2015
Denmark Norway (mainland) Sweden United States Euro Area
0%
2%
4%
6%
8%
10%
12%
14%
2005 2006 2007 2008 2009 2010 2011 2012 2013 2014 2015
Denmark Norway Sweden United States Euro area

Household credit growth (12 months growth rate)
Norwegian Mortgages (by type of property)
Housing and mortgage markets – Key characteristics
51
Mortgage Market
• Total size approximately NOK 2,500 billion (USD 320bn, €280bn)
• Private banks (incl. savings banks) are the dominant suppliers of mortgages with over 95% market share
• Scheduled repayment mortgages: 83.4%, flexible: 16.6%
• Typical maturity: 25 years
• First priority security market with high doc. standard
Howe Ownership
• Over 80% of households owner occupied (little buy to let)
• Between 50 and 60% are detached one-family houses
Social security • Generous unemployment benefits
• Unemployment benefit represents ca 60% of final salary for at least 104 weeks
Personal Liability
• Borrowers are personally liable for their debt
• Swift foreclosure regime upon non-payment
• Usually tight relationship borrower - bank
• Transparent information about borrowers
Regulation • Loan to value: 85% (75% legal limit for cover pool)
• Interest only (flexible) mortgages: max 70% LTV
• Required amortization for loans with LTV > 70%
• 5% mortgage interest rate increase as stress test
• Higher risk weighting for mortgages from 2015 (approx. 25%)
Interest Payments
• 90-95% of mortgages are variable rate
• Interest rates can be reset at the lender’s discretion, by giving the debtor 6 weeks notice
Tax Incentives • 25% of interest paid is tax deductible (equal to the basic rate of tax)
• Low effective real estate tax (lower net worth tax on real estate than financial assets)
Source: Statistics Norway and Investor presentation June 2016 from SpareBank 1 Boligkreditt AS
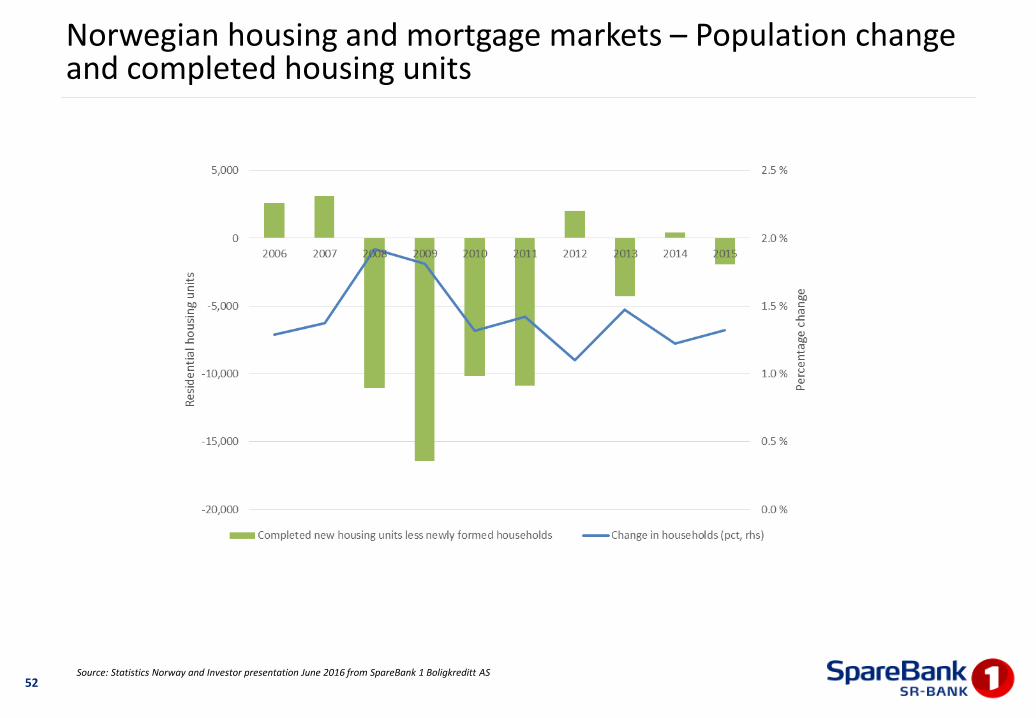
Norwegian housing and mortgage markets – Population change and completed housing units
52Source: Statistics Norway and Investor presentation June 2016 from SpareBank 1 Boligkreditt AS

Source: Eiendomsverdi through May 2016 and SpareBank 1 Boligkreditt AS projections and indexation 53
Norwegian Housing and Mortgage Market- Adjusted price developments
Index of House Prices, Norway, Monthly (Jan 2005 = 100)

Aggregate household indebtednessTotal Debt burden in per cent of household income (after tax)
54
Norway:
• All HH debts included in the statistic, question of int’l comparability
• High home ownership (mortgage debt rather than rent commitments)
• Generous benefits (pensions, healthcare, education, childcare, maternity, unemployment)
• Income growth over the last decades has far outpaced the cost of necessities in the time period shown
• Household savings rate is high: debt reduction possible
Source: Norges Bank (Norwegian Central Bank) Monetary Policy Report 1/2016 and Investor presentation June 2016 from SpareBank 1 Boligkreditt AS

Balance sheet
55
Balance sheet (MNOK) 30.06.2016 30.06.2015
Cash and balances with central banks 910 2.841
Balances with credit institutions 2.188 2.224
Net loans to customers 155.612 149.472
Certificates, bonds and other fixed-income securities 24.814 16.116
Financial derivatives 5.056 4.878
Shares, ownership stakes and other securities 535 523
Business available for sale 22 129
Investment in associates 4.792 4.677
Other 2.834 1.029
Total assets 196.763 181.889
Balances with credit institutions 3.934 3.874
Deposits from customers 89.633 90.788
Listed debt securities 76.830 62.992
Financial derivatives 3.047 2.766
Other liabilities 2.867 2.491
Additional Tier 1 and Tier 2 capital instruments 3.284 2.980
Total liabilities 179.595 165.891
Total equity 17.168 15.998
Total liabilites and equity 196.763 181.889

56
Net commission and other income
*SpareBank 1 Regnskapshuset SR was established in the first quarter of 2015 in connection with the acquisition of the Rogaland branch of SpareBank 1 Regnskapshuset Østlandet AS. The company acquired a number of accounting firms in 2015.
30.06 30.06
MNOK 16 15 Q2 16 Q1 16 Q4 15 Q3 15 Q2 15
Payment facilities 117 114 63 54 56 66 56
Savings/placements 95 97 44 51 48 45 48
Insurance products 100 94 50 50 48 48 47
Commission income real estate broking 176 217 107 69 82 84 113
Guarantee commission 59 67 31 28 34 28 33
Arrangement- and customer fees 54 42 24 30 27 16 26
Accounting services SpareBank 1 Regnskapshuset SR* 47 18 24 23 10 7 8
Other 9 8 3 6 14 4 2
Net commission and other income excl. covered bond companies
657 657 346 311 319 298 333
Commission income SB1 Boligkreditt and SB1 Næringskreditt
84 150 43 41 53 55 66
Net commission and other income incl. covered bond companies
741 807 389 352 372 353 399

57
Net income on investment securities
*Include NOK 94 million for a received cash settlement in connection with the sale of Visa Europe Ltd to Visa Inc.
30.06 30.06
MNOK 16 15 Q2 16 Q1 16 Q4 15 Q3 15 Q2 15
Dividends* 105 15 97 8 1 1 8
Investment income, associates 216 234 112 104 110 78 101
Securities gains/losses -102 -38 -36 -66 -87 -100 -14
- of which capital change in shares and certificates -54 -1 -33 -21 -34 -6 -4
- of which capital change in certificates and bonds -91 -94 -38 -53 -80 -100 -46
- of which derivatives; bonds and certificates 43 57 35 8 27 6 36
Currency/interest gains/loans 65 94 32 33 -37 33 -1
- of which currency customer- and own-account trading 58 48 32 26 25 31 17
- of which value change basis swap spread12 70 -1 13 6 13 2
- of which counterparty risk derivatives including CVA 0 - -1 1 -66 - -
- of which IFRS-effects -5 -24 2 -7 -2 -11 -20
Net income on investment securities 284 305 205 79 -13 12 94

Subsidiaries
58
*SpareBank 1 Regnskapshuset SR was established in the first quarter of 2015 in connection with the acquisition of the Rogaland branch of SpareBank 1 RegnskapshusetØstlandet AS. The company acquired a number of accounting firms in 2015. The result to Regnskapshuset SR includes amortization of intangible assets of NOK 0,8 million.** SR-Boligkreditt AS was established in the second quarter of 2015.
MNOK 30.06.16 30.06.15EiendomsMegler 1 SR-Eiendom ASNumber of sales 3.060 3.723Operating profit before tax 13 30
SpareBank 1 SR-Finans ASTotal assets (BNOK) 7 7Operating profit before tax 45 75
SR-Forvaltning ASTotal assets under management (BNOK) 9 9Operating profit before tax 15 16
SR-Investering ASOperating profit before tax -1 -11
SpareBank 1 Regnskapshuset SR ASOperating profit before tax* 5 2
SR-Boligkreditt ASOperating profit before tax** 72 6
OtherOperating profit before tax -1 -3
Total subsidiariesProfit before tax 148 115

Ownership interests
59
MNOK 30.06.16 30.06.15SpareBank 1 Gruppen ASInterest ownership 19,5 % 19,5 %Profit after tax 135 128Adjusted profit previous years 6 0
SpareBank 1 Boligkreditt AS Interest ownership 16,7 % 20,1 %Profit after tax 16 57Adjusted profit previous years 4 0
SpareBank 1 Næringskreditt AS Interest ownership 26,8 % 26,8 %Profit after tax 12 12
BN Bank ASA Interest ownership 23,5 % 23,5 %Profit after tax 36 25
SpareBank 1 Kredittkort ASEierandel 18,1 % 18,1 %Resultat etter skatt 14 9
OtherProfit after tax -7 3
Total ownership interestsProfit after tax 216 234

Impairment losses on loans and guarantees
60
30.06 30.06
Losses on loans in income statement (MNOK) 16 15 Q2 16 Q1 16 Q4 15 Q3 15 Q2 15
Corporate customers 340 81 258 82 145 40 18
Retail customers 22 12 14 8 -4 6 7
Change in collective impairment losses on loans 93 39 33 60 51 50 19
Net impairment losses on loans 455 132 305 150 192 96 44
30.06 30.06 30.06 31.12 31.12 30.09 30.06
Impairment losses on loans (MNOK) 16 15 16 16 15 15 15
Corporate customers 446 292 446 304 249 301 292
Retail customers 68 64 68 69 66 65 64
Collective impairment losses on loans 612 417 612 578 518 467 417
Total impairment losses on loans 1.126 773 1.126 951 833 833 773

Risk profile of the loan portfolio
61
Distributed by risk class
Distributed by size of loan
*Probability of default (PD) through a full cycle of loss.
The figure includes lending portfolios from covered bond companies.
• SpareBank 1 SR-Bank has a solid loan
portfolio with positive development in risk
profile.
• 61.0% of the bank’s loan exposure has a
PD* below 0.5%.
• Single loan exposures less than NOK 10
million aggregates 68.1% of total loan
portfolio.
• Single loan exposures above NOK 250
million is slightly increasing and aggregates
11.5% of total loan portfolio.
58,0%
31,7%
10,3%
61,0%
29,1%
9,9%
0%
20%
40%
60%
80%
100%
0.00 - 0.50 0.50 - 2.50 2.50 - 99.9
Probability of Default (PD) %
30.06.15 30.06.16
67,1%
13,1% 9,2% 10,6%
68,1%
12,7%7,7% 11,5%
0%
20%
40%
60%
80%
100%
Below MNOK 10 MNOK 10-100 MNOK 100-250 Above MNOK 250
30.06.15 30.06.16

Low concentration of individual LGRs in the lending portfolio
62
• At the end of Q2 2016, SpareBank 1 SR-Bank
had a total of 52 commitments with a loss
potential exceeding NOK 100 million.
• These commitments represent 13.3% of the
loan exposure, which is a reduction from
14.3% in Q2 2015.
• The proportion of loans with loss potential
below NOK 10 million has increased since Q2
2015 and is now 76.1%.
• There is a clearly defined strategy behind
this portfolio composition. The growth and
risk profile are managed, for example,
through special credit strategy limits for
concentration risk.
LGR (Loss Given Realisation). Estimated loss on realising a single loan. Corresponds to LGD without statistical correction for certain non-performing loans being reclassified as recoverable prior to collection. The calculation is based on the realisation value of assets pledged as security in an economic downturn.
The figure includes lending portfolios from covered bond companies.
Distributed by loss given realisation (LGR)
74,0%
11,7% 11,1%
3,2%
76,1%
10,6% 10,1%
3,2%
0%
20%
40%
60%
80%
100%
Below MNOK 10 MNOK 10-100 MNOK 100-250 Above MNOK 250
30.06.15 30.06.16

Risk profile – Lending to the retail market
63
Retail market portfolio distributed by risk class
Migration in the retail market portfolio over the past 12 months
• The quality of the retail market portfolio is
considered to be good and has low
potential losses.
• The proportion of loans with a PD* below
0.5% has increased to 81.4% of the total
retail portfolio.
• The low risk profile is achieved through
prudent customer selection and
requirements for moderate LTV.
• Most of the portfolio is secured against a
mortgage on real estate, and lending is
overall moderate compared to asset value.
*Probability of default (PD) through a full cycle of loss.
Figures include portfolio in covered bond companies (SpareBank 1 Boligkreditt AS and SR-Boligkreditt AS).
80,2% 80,3% 80,3% 80,5% 81,4%
17,2% 17,2% 17,1% 16,9% 16,1%2,6% 2,5% 2,6% 2,6% 2,5%
0%
20%
40%
60%
80%
100%
30.06.15 30.09.15 31.12.15 31.03.16 30.06.16
PD % 0.00 - 0.50 PD % 0.50 - 2.50 PD % 2.50 - 99.9
-6.500
-4.500
-2.500
-500
1.500
3.500
5.500
7.500
Exit Additions Change in existing
portfolio
Total change
NO
K M

Historical LTV development for home mortgage loans
64
Total home mortgages incl. loans in cover pool SpareBank 1 SR-Bank ASA
0%
10%
20%
30%
40%
50%
60%
70%
80%
90%
100%
30.06.2014 31.12.2014 30.06.2015 31.12.2015 30.06.2016
LTV < 70 % LTV 70 - 85 % LTV 85 - 100 % LTV > 100 %
0%
10%
20%
30%
40%
50%
60%
70%
80%
90%
100%
30.06.2014 31.12.2014 30.06.2015 31.12.2015 30.06.2016
LTV < 70 % LTV 70 - 85 % LTV 85 - 100 % LTV > 100 %

Liquidity portfolio
65
Liquidity buffer – survival period Liquidity portfolio
• Liquidity buffer at the end of the quarter: NOK 26.9 billion
• Other liquid assets:
• Home mortgages prepared for transfer to mortgage company: NOK 15.7 billion
• Commercial paper and bonds in the trading portfolio: NOK 0.4 billion
Liquidity buffer: cash, highly liquid bonds.
Providing deposits and lending remain unchanged, with no new borrowing during the period.
CategoryNOK
million Share %
Of which, securities
classified to amortised
cost, MNOK
Norwegian government/municipal 200 2 % 0
SSA/Foreign guaranteed 6.357 26 % 189
Covered bonds (Norwegian/foreign) 17.383 71 % 972
Norwegian bank/finance 497 2 % 0
Foreign bank/finance 0 0 % 0
Industry/Other 0 0 % 0
Total liquidity portfolio 24.437 100 % 0
02468
1012141618202224262830
jun
.16
aug.
16
okt
.16
des
.16
feb
.17
apr.
17
jun
.17
aug.
17
okt
.17
des
.17
feb
.18
apr.
18
jun
.18
aug.
18
NO
K b
illio
n

Investments in bonds and certificates
66All amounts in MNOK.
Risk category Rating NOK Million Share
Very low risk AAA, AA+, AA og AA- 23.939 96,5 %
Low risk A+, A og A- 9 0,0 %
Moderate risk BBB+, BBB og BBB- 599 2,4 %
High risk BB+, BB og BB- 113 0,5 %
Very high risk B+ and lower 139 0,6 %
Total portfolio 24.799 100,0 %
Of which liquidity purposes:
Risk category Rating
Very low risk AAA, AA+, AA og AA- 23.697 98,0 %
Low risk A+, A og A- 0 0,0 %
Moderate risk BBB+, BBB og BBB- 497 2,0 %
High risk BB+, BB og BB- 0 0,0 %
Very high risk B+ and lower 0 0,0 %
Total liquidity purposes 24.437 100,0 %
Of which SR-Bank Markets:
Risk category Rating
Very low risk AAA, AA+, AA og AA- 0 0,0 %
Low risk A+, A og A- 0 0,0 %
Moderate risk BBB+, BBB og BBB- 101 27,9 %
High risk BB+, BB og BB- 113 23,1 %
Very high risk B+ and lower 139 50,1 %
Total trading portfolio 362 100,0 %

Rating
67
Moody’s Fitch
Ratinghistory
Long-term debt A1
Outlook Negative
Updated 7 April 2016
Long-term IDR A-
Outlook Stable
Updated 4 November 2015
AAA/Aaa
AA+/Aa1
AA/Aa2
AA-/Aa3
A+/A1 Moody's
A/A2
A-/A3 Fitch
BBB/Baa
BB/Ba
B
2002 2003 2004 2005 2006 2007 2008 2009 2010 2011 2012 2013 2014 2015 30.06.2016

SRBANK as at June 2016
68
• Trading volume in Q2 2016: 2.5% (5.6%)
• Ownership interests:
• From Rogaland, Agder-counties
and Hordaland: 50.0%
• International: 16.5%
• 10 largest: 55.4%
• 20 largest: 62.4%
• Number of shareholders: 9 820 (10 070)
• Employees owning: 1,9%
30.06.2016 2015 2014 2013 2012 2011
Share price 41,20 39,30 52,50 60,25 37,20 40,70
Stock value (MNOK) 10.537 10.051 13.427 15.409 9.514 5.182
Book value per share, NOK (group) 67,16 66,14 60,28 55,00 49,48 48,75
Earnings per share 3,10 6,83 8,20 7,28 5,33 5,42
Dividend per share n.a 1,50 2,00 1,60 1,50 1,50
P/E 6,65 5,75 6,40 8,28 6,99 7,51
P/BV (group) 0,61 0,59 0,87 1,10 0,75 0,83

“The financial objective of SpareBank 1 SR-Bank ASA is to achieve earnings
that yield adequate, stable returns on the bank’s equity, thereby creating
value for owners through competitive returns in the form of dividends and
share appreciation.
In determining the level of the annual dividend, considerations will be
made towards SpareBank 1 SR-Bank ASA’s future need for capital,
including capital adequacy requirements, and strategic plans and targets.
Unless capital requirements otherwise dictate, the Board of Directors’ aim
is that approximately half of the EPS is paid out.”
Dividend policy
69

Contact DetailsManagement
Arne Austreid
CEO
Tel.: +47 900 77 334
E-mail: [email protected]
Investor Relations
Inge Reinertsen
CFO
Tel.: +47 909 95 033
E-mail: [email protected]
Stian Helgøy
Investor Relations
Tel.: +47 906 52 173
E-mail: [email protected]
Adress
Bjergsted Terrasse 1Postboks 2504066 Stavanger
Tlf: +47 915 02002www.sr-bank.no
Short- /long-term fundingDag HjelleHead of Treasury
Tel.: +47 51 50 94 37E-mail: [email protected]