Embed Size (px)
Citation preview

1st Quarter 2015 Results Albern Murty, CEO 27 April 2015
OPEN
1Q 2015 Results

Disclaimer
This presentation and the following discussion may contain forward looking statements by Digi.Com Berhad (Digi) related to financial trends for future periods. Some of the statements contained in this presentation or arising from this discussion which are not of historical facts are statements of future expectations with respect to financial conditions, results of operations and businesses, and related plans and objectives. Such forward looking statements are based on Digi’s current views and assumptions including, but not limited to, prevailing economic and market conditions and currently available information. These statements involve known and unknown risks and uncertainties that could cause actual results, performance or achievements to differ materially from those in the forward looking statements. Such statements are not and, should not be construed, as a representation as to future performance or achievements of Digi. In particular, such statements should not be regarded as a forecast or projection of future performance of Digi. It should be noted that the actual performance or achievements of Digi may vary significantly from such statements.
2

3 3
• Key highlights • Financial updates • Outlook • Q&A

4
1Q 2015 Steady operational growth amid increased competition
• Continuous y-o-y service revenue growth with stronger trajectory from postpaid
• Successfully captured solid demand for internet
– Smartphone penetration rose to 53.2% – Internet penetration at 56.7% – Internet revenue grew 35.0%
• Continued expansion of 3G and LTE network
with key focus on quality and capacity
• Added 270K subscriber to 11.7 million
• EBITDA margin moderated to 43% to capture service revenue opportunities from higher smartphone bundles
• 99% dividend payout ratio or 6.1 sen dividend per share
1,459 1,476
1,554 1,588
1Q12 1Q13 1Q14 1Q15
CAGR: 2.9% Service revenue (RM mn)

• Well-planned market strategies with customer first focus
– Targeted campaigns with affordable smartphone bundles
– Tactical reload promotions – Postpaid smartplan flexibility with
data and voice centric options – Innovative entry-level pricing for
access to Facebook – Worry-free music streaming access
via Digi Music Freedom
• Strong commitment to drive continuous service quality improvement and data network expansion
• Over 20 years of solid operational track record and strong positioning in digital services innovation
1Q 2015 Relentless focus to drive Internet For All
5
Internet growth opportunities

• Consistent Internet For All focus and data monetisation
– Increased data usage from existing and new internet subscribers
• Steady growth on data traffic volume with
strong data usage on 3G network – Supported by robust data network
coverage and proliferation of affordable smartphones
• Increasing data growth opportunity with the
rapid expansion of LTE network coverage to more than 33% of population
• Well-positioned to deliver consistent high-speed internet experience and support growing data traffic demand
1Q 2015 Strong data usage with 92% of data traffic on 3G network
6
1Q15 data traffic carriage structure
3G Traffic 92%
Other Traffic
8%
Data traffic volume (‘000 TB)
9.9 12.1
14.7 16.3 19.9
1Q14 2Q14 3Q14 4Q14 1Q15
Postpaid Prepaid

1Q 2015 Leverage on smartphone as a strategic enabler
7
102
328
453
200 180
1Q14 2Q14 3Q14 4Q14 1Q15
No. of smartphones & devices sold
Smartphone and internet penetration
‘000
% • Smartphone users formed 53.2% of the
subscriber base, up 3.9 pp from 4Q14 – Of which, 19.4% of smartphone users
with LTE enabled device
• Internet penetration reached 56.7% over a larger subscriber base, driven by bite-size offerings, data pricing, and entry-level smartphone bundles
– More than 65% internet penetration among prepaid Malaysian base
• Strategically tapped on smartphone bundles
demand with higher mix from the affluent/upper price range
• Tactically secured service revenue commitments and data monetisation opportunity into the following quarters
46.6% 49.4% 53.0% 56.5% 56.7%
38.4% 41.9% 47.0% 49.3% 53.2%
1Q14 2Q14 3Q14 4Q14 1Q15
Internet Smartphone

8
1Q 2015 Strategically tap on smartphone bundle opportunities
Revenue RM1,791 million 4.2% Y-o-Y
Service Revenue RM1,588 million 2.2% Y-o-Y
43% EBITDA Margin RM775 million -0.4% Y-o-Y

• Strong subscriber growth with 37K net adds – Fuelled by solid demand for
smartphone bundles – Increased internet centric
subscriptions
• Postpaid internet subscribers rose steadily to 74.9% from 64.8%, a year ago
• ARPU remained resilient at RM81 over a larger base and well-supported with increasing demand for mobile internet
• Postpaid service revenue grew 1.6%, • Led by 14.6% growth on internet
revenue while traditional voice and messaging revenue declined
• Robust data network on both coverage and
performance continued to support stronger positioning in the postpaid market
1Q 2015 Best postpaid net adds momentum in three years
9
Postpaid
1,686 1,696 1,698 1,721 1,758
1,093 1,130 1,170 1,235 1,318
1Q14 2Q14 3Q14 4Q14 1Q15
427
433 431 435 434
81 83 82 83
81
Subscribers (‘000)
Service revenue (RM mn)
ARPU (RM)
Internet
Non-Internet

• Continued to grow prepaid subscribers positively with 233K net adds in a highly competitive market
• Both prepaid service revenue growth and ARPU moderated although usage and subscriber base increased
• Prepaid service revenue grew 2.4%, amid steeper decline on voice revenue at 6.8% as a result of increased competition and MTR revision
• Normalised against the effects from MTR revision, prepaid service revenue growth would be 3.1%
• Prepaid internet revenue continued to register solid growth at 50.0% to RM324 million with increasing demand for affordable internet packages
1Q 2015 Prepaid growth impacted by intensified competition
10
Prepaid
9,199 9,207 9,647 9,700 9,933
3,979 4,254 4,841 5,217 5,306
1Q14 2Q14 3Q14 4Q14 1Q15
1,127 1,135 1,153 1,192
1,154
41 41 41 41 39
Subscribers (‘000)
Service revenue (RM mn)
ARPU (RM)
Internet
Non-Internet

• Successfully retained solid subscriber base and grew additional 270K subscribers although challenged by heightened competition
• Slower service revenue growth to 2.2% despite higher usage and subscribers whilst ARPU moderated
• Service revenue would be at similar level as 4Q14, if normalised for seasonally shorter quarter and MTR revision
• Internet subscribers continued to grow to more than 6.6 million subscribers
– Of which, 44% internet subscribers with data usage above 500MB
• Positive development across all IFA KPIs -
internet penetration, number of active internet subscribers, data usage and smartphone penetration
1Q 2015 Healthy service revenue backed by 11.7 million subscribers
11
10,885 10,903 11,345 11,421 11,691
5,072 5,384 6,011 6,452 6,624
1Q14 2Q14 3Q14 4Q14 1Q15
1,554 1,568 1,584 1,627 1,588
Subscribers (‘000)
Service revenue (RM mn)
47 48 47 47 46 ARPU (RM)
Internet
Blended
Non-Internet

1Q 2015 Modest revenue growth on leveling voice revenue
12
983
(67)
916
571
101
672
164 39 203
1,718 1,791
1Q14 Voice Data Device andothers
1Q15
Voice Data Device and others
+4.2%
Revenue development RM mn
973
(57)
916
654
18
672
172 31 203
1,799 1,791
4Q14 Voice Data Device andothers
1Q15
Voice Data Device and others
-0.4%

1Q 2015 Solid double digit data revenue growth
• MTR revision, price competition and data centric packages contributed to steeper decline on voice revenue
• Whilst voice revenue trended lower, strong growth momentum on data revenue of 17.7% continued to support service revenue growth positively
• Good traction from relevant and affordable innovative internet packages
• Internet revenue rose 35.0% to RM505 million or 31.8% of service revenue
• Increasing demand for digital services, availability of affordable smartphone and internet packages continued to offer significant opportunities for internet growth
13
Voice revenue
784 772 763 777 731
199 198 194 196 185
983 970 957 973 916
1Q14 2Q14 3Q14 4Q14 1Q15Prepaid Postpaid
-6.8% -5.9%
RM mn
374 409 449 480 505 148 142 131 126 119 49 47 47 48 48 571 598 627 654 672
1Q14 2Q14 3Q14 4Q14 1Q15Internet Messaging VAS
Data revenue RM mn
+2.8% +17.7%

7.5% 7.6% 7.6% 7.8% 8.1% 3.5% 3.3% 3.3% 4.0% 3.6% 4.9% 4.6% 4.3% 4.8% 4.8% 6.1% 6.1% 6.1% 6.2% 6.3% 3.4% 3.1% 3.1% 3.5% 3.1%
1Q14 2Q14 3Q14 4Q14 1Q15Sales & Mktg Staff Cost O&M USO Others
24.8% 24.5% 24.5% 26.3% 26.0% 25.4% 24.7% 24.4% 26.3% 25.9%
1Q 2015 Higher COGS driven by increased smartphone bundles
Total cost trend
514 524 536 525 551
436 432 428 473 463
950 956 964 998 1,014
1Q14 2Q14 3Q14 4Q14 1Q15COGS Opex
+1.6% +6.7%
Opex (% of revenue)
14
RM mn • Increased demand for smartphone bundles, compounded with MYR weakness contributed to higher COGS, which rose 7.2% y-o-y and 5.0% q-o-q
• Relatively higher sales and marketing cost to support revenue generating activities
• Opex remained well-managed with opex to revenue ratio improved to 25.9% from 26.3% in 4Q14 despite the marginally lower revenue base
• Strong focus on operational efficiency whilst strategically expand and strengthen data network
[1] Net Opex = Opex + Forex/FV changes + Other Income
Net Opex [1]
Opex

1Q 2015 Sustained absolute EBITDA at 1Q 2014 level
15
576 602 513 568 582
202 193 276 233 193
1Q14 2Q14 3Q14 4Q14 1Q15OpsCF Capex
OCF margin Capex/ Rev
Capex and Ops Cash-Flow (OCF)
778 795 789 801 775
485 499 487 560 479
1Q14 2Q14 3Q14 4Q14 1Q15
EBITDA PAT
EBITDA % PAT %
EBITDA and PAT
45% 46% 45% 45% 43% 28% 29% 28% 31% 27%
RM mn
RM mn
• Maintained absolute EBITDA similar to 1Q 2014 level, or 0.8% higher if normalised against forex loss
• Higher device sales and impact from MYR weakness lowered EBITDA margin to 43%
– service revenue EBITDA margin remained strong at 49%
• PAT margin back to normalised trend in the
absence of prior year tax benefit
• Capex as planned with investments to support network quality and capacity
• Continued 3G and LTE high-speed data network coverage expansion to 86.4% and 33.3% of population backed by 5,200 km of fibre network
• Ops Cash-Flow remained healthy at RM582 million or 32% of revenue
34% 34% 29% 32% 32% 12% 11% 16% 13% 11%
1Q14 2Q14 3Q14 4Q14 1Q15
Total Assets 3,667 3,759 3,785 4,303 4,143
Total Equity 602 619 608 686 606
Interest-bearing debts 853 848 598 1,048 1,048
Cash & cash equivalents 372 403 259 526 357
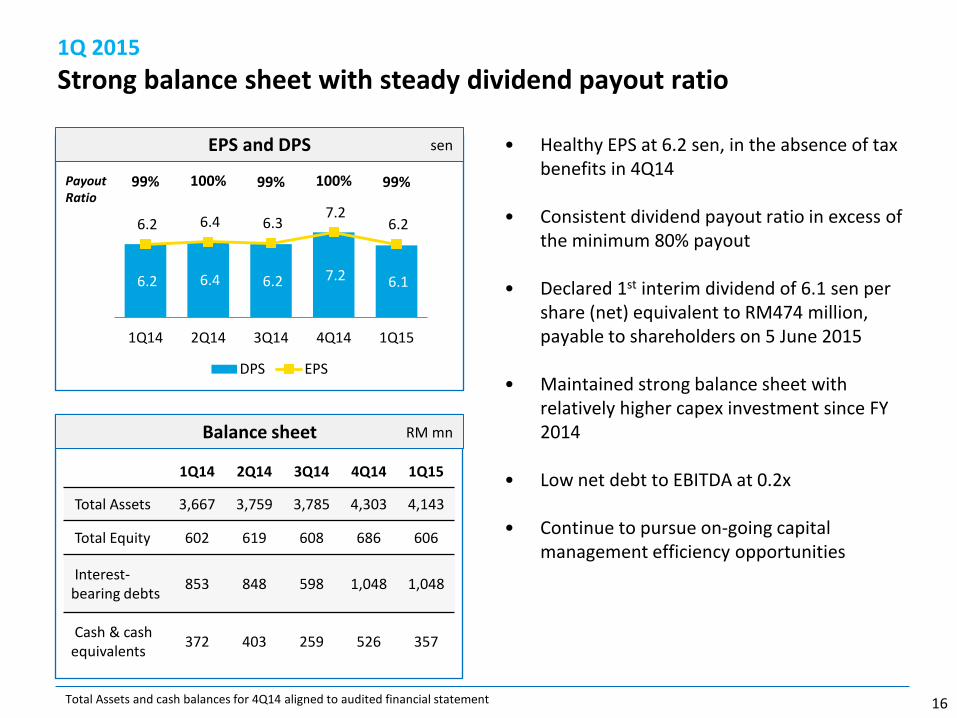
1Q 2015 Strong balance sheet with steady dividend payout ratio
• Healthy EPS at 6.2 sen, in the absence of tax benefits in 4Q14
• Consistent dividend payout ratio in excess of the minimum 80% payout
• Declared 1st interim dividend of 6.1 sen per share (net) equivalent to RM474 million, payable to shareholders on 5 June 2015
• Maintained strong balance sheet with relatively higher capex investment since FY 2014
• Low net debt to EBITDA at 0.2x
• Continue to pursue on-going capital management efficiency opportunities
6.2 6.4 6.2 7.2 6.1
6.2 6.4 6.3 7.2
6.2
99% 100% 99% 100% 99%
0%20%40%60%80%100%120%
- 2.0 4.0 6.0 8.0
10.0 12.0
1Q14 2Q14 3Q14 4Q14 1Q15
DPS EPS
EPS and DPS
16
Balance sheet
Payout Ratio
sen
RM mn
Total Assets and cash balances for 4Q14 aligned to audited financial statement

• Maintain guidance although challenged by increased competition and tougher operating environment
• Strong demand for mobile internet access remained a significant growth opportunity
• Stay focus in delivering the best internet experience for customers with prudent data monetisation and defend stronghold
• Strengthen competitiveness and on-ground execution to deliver continuous growth
• Continuous operational efficiency and performance excellence to be the best mobile internet provider for the mass market
17
1Q 2015 Outlook and strategic priorities
2015 Guidance
YTD 1Q15
Service revenue growth
Low-mid single digit
2.2%
EBITDA margin
Sustain at 2014 level
43%
Capex Sustain at 2014 level
RM193 million

Q&A
18

Appendix
20

1Q 2015 Key operating performance KPIs
21
(RM mn) 1Q15 4Q14 3Q14 2Q14 1Q14 4Q13 3Q13 2Q13 1Q13 Q-o-Q Y-o-Y
Subscribers (‘000) 11,691 11,421 11,345 10,903 10,885 10,995 10,827 10,548 10,372 2% 7%
Internet subscribers (‘000)
6,624 6,452 6,011 5,384 5,072 4,926 4,753 4,349 3,917 3% 31%
MOU 235 248 252 251 249 256 260 267 267 -5% -6%
Revenue 1,791 1,799 1,756 1,746 1,718 1,733 1,700 1,653 1,647 0% 4%
EBITDA 775 801 789 795 778 810 766 747 720 -3% 0%
EBITDA margins 43% 45% 45% 46% 45% 47% 45% 45% 44% -1.3pp -2.0pp
Depreciation & Amortisation
(140) (132) (127) (115) (118) (122) (221) (247) (288) 6% 19%
EBIT 635 669 662 680 660 688 545 500 432 -5% -4%
Net finance (costs)/income
(9) (9) (5) (6) (6) (5) (6) (6) (8) 0% 50%
Profit Before Tax 626 660 657 674 654 683 539 494 424 -5% -4%
Taxation 147 100 170 175 169 135 90 114 95 47% -13%
Profit After Tax 479 560 487 499 485 548 449 380 329 -14% -1%
EPS (sen) 6.2 7.2 6.3 6.4 6.2 7.0 5.8 4.9 4.2 -14% 0%
Prepaid ARPU (RM) 39 41 41 41 41 41 41 42 40 -5% -5%
Postpaid ARPU (RM) 81 83 82 83 81 83 82 83 82 -2% 0%
Blended ARPU (RM) 46 47 47 48 47 48 48 48 47 -2% -2%

1Q 2015 Revenue composition
(RM mn) 1Q15 4Q14 3Q14 2Q14 1Q14 4Q13 3Q13 2Q13 1Q13 Q-o-Q Y-o-Y
REVENUE 1,791 1,799 1,756 1,746 1,718 1,733 1,700 1,653 1,647 0% 4%
Service Revenue 1,588 1,627 1,584 1,568 1,554 1,577 1,553 1,526 1,476 -2% 2%
Voice revenue 916 973 957 970 983 1,020 1,020 1,011 978 -6% -7%
Data revenue 672 654 627 598 571 557 533 515 498 3% 18%
Internet 505 480 449 409 374 348 320 293 265 5% 35%
Messaging 119 126 131 142 148 158 162 172 183 -6% -20%
VAS 48 48 47 47 49 51 51 50 50 0% -2%
Device and other revenue
203 172 172 178 164 156 147 127 171 18% 24%
Prepaid Revenue 1,154 1,192 1,153 1,135 1,127 1,138 1,119 1,093 1,050 -3% 2%
Voice revenue 731 777 763 772 784 806 807 796 768 -6% -7%
Data revenue 423 415 390 363 343 332 312 297 282 2% 23%
Postpaid Revenue 434 435 431 433 427 439 434 433 426 0% 2%
Voice revenue 185 196 194 198 199 214 213 215 210 -6% -7%
Data revenue 249 239 237 235 228 225 221 218 216 4% 9%
22

1Q 2015 Reported COGS and OPEX
23
(RM mn) 1Q15 4Q14 3Q14 2Q14 1Q14 4Q13 3Q13 2Q13 1Q13 Q-o-Q Y-o-Y
COGS 551 525 536 524 514 514 514 493 519 5% 7%
Cost of materials 228 197 177 183 165 151 144 139 182 16% 38%
Traffic charges 323 328 359 341 349 363 370 354 337 -2% -7%
OPEX 463 473 428 432 436 421 420 415 417 -2% 6%
Sales & marketing 145 140 133 133 129 133 130 129 122 4% 12%
Staff costs 64 72 58 58 60 57 57 61 60 -11% 7%
Operations & maintenance 86 85 76 81 84 76 84 81 83 1% 2%
Other expenses 168 176 161 160 163 155 149 145 152 -5% 3%
USP fund and license fees 113 112 107 107 105 104 103 95 96 1% 8%
Credit loss allowances 8 9 10 6 8 7 7 7 6 -11% 0%
Others 47 55 44 47 50 44 39 43 50 -15% -6%
TOTAL 1,014 998 964 956 950 935 934 908 936 2% 7%

1Q 2015 Reported Cash-Flow
(RM mn) 1Q15 4Q14 3Q14 2Q14 1Q14 4Q13 3Q13 2Q13 1Q13 Q-o-Q Y-o-Y
Cash at start 526 259 403 372 411 550 761 579 709 >100% 28%
Cash-flow from operations 551 524 780 770 664 826 616 651 543 5% -17%
Changes in working capital 29 1 93 (65) (68) (197) (248) 9 (142) >100% -143%
Cash-flow used in investing activities (189) (226) (271) (191) (192) (126) (227) (180) (186) -16% -2%
Cash-flow used in financing activities (561) (37) (746) (483) (443) (642) (352) (298) (346) >100% 27%
Net change in cash (170) 262 (144) 31 (39) (139) (211) 182 (130) -165% >100%
Effect of exchange rate changes on cash and cash equivalents
1 5 0 0 0 0 0 0 0 -80% 100%
Cash at end 357 526 259 403 372 411 550 761 579 -32% -4%
Capex 193 233 276 193 202 130 234 186 191 -17% -4%
Ops Cash-Flow (EBITDA – Capex) 582 568 513 602 576 680 532 561 529 2% 1%
Ops Cash-Flow margin 32% 32% 29% 34% 34% 39% 31% 34% 32% 0.9pp -1.0pp
24 Cash balance for 4Q14 aligned to audited financial statement

576 602 513 568 582
1Q14 2Q14 3Q14 4Q14 1Q15
34% 34% 29% 32% 32%
778 795 789 801 775
1Q14 2Q14 3Q14 4Q14 1Q15
45% 46% 45% 45% 43%
485 499 487 560
479
1Q14 2Q14 3Q14 4Q14 1Q15
1,718 1,746 1,756 1,799 1,791
1,554 1,568 1,584 1,627 1,588
1Q14 2Q14 3Q14 4Q14 1Q15Revenue Service Revenue
Revenue development
25
RM mn
1Q 2015 Performance summary
56.7% active internet subscribers ‘000
10,885 10,903 11,345 11,421 11,691
5,072 5,384 6,011 6,452 6,624
1Q14 2Q14 3Q14 4Q14 1Q15Total Subs Internet Subs
27% PAT margin
-14.5% -1.2%
43% EBITDA margin
-3.2% -0.4%
32% Ops Cash-Flow margin
+2.5% +1.0%
-0.4% +4.2%
+2.4% +7.4%


![Presentation1 - UKPHC19 · Presentation1 [Compatibility Mode] Author: Administrator Created Date: 20131105110048Z](https://img.pdfslide.us/doc/110x75/5f052e7f7e708231d411ae53/presentation1-ukphc19-presentation1-compatibility-mode-author-administrator.jpg)