Embed Size (px)
Citation preview

Investor Update
June 25, 2012
Forward Looking Statements
This presentation contains statements that are forward-looking. These statements are made based upon current expectations that are
subject to risk and uncertainty because actual results may differ materially from those contained in the forward-looking statements.
You should not place undue reliance on the forward looking statements when deciding whether to buy, sell or hold the Company’s
securities. Factors that could cause results to differ materially include, but are not limited to: issues or concerns related to the quality
and safety of our products, ingredients or packaging; changes in raw material and other costs; selling price increases, including volume
declines associated with pricing elasticity; market demand for our new and existing products; increased marketplace competition;
disruption to our supply chain; failure to successfully identify, execute and integrate acquisitions, divestitures and joint ventures;
changes in governmental laws and regulations, including taxes; political, economic, and/or financial market conditions; risks and
uncertainties related to our international operations and related growth targets; disruptions, failures or security breaches of our
information technology infrastructure; the impact of future developments related to the investigation by government regulators of
alleged pricing practices by members of the confectionery industry, including risks of subsequent litigation or further government
action; pension cost factors, such as actuarial assumptions, market performance and employee retirement decisions and funding
requirements; the ability to implement our supply chain realignment initiatives within the anticipated timeframe in accordance with
our cost estimates and our ability to achieve the expected ongoing annual savings from these initiatives; and such other matters as
discussed in our Annual Report on Form 10-K for 2011. All information in this presentation is as of June 25, 2012. The Company
undertakes no duty to update any forward-looking statement to conform the statement to actual results or changes in the Company’s
expectations.

J.P. Bilbrey
PRESIDENT & CEO

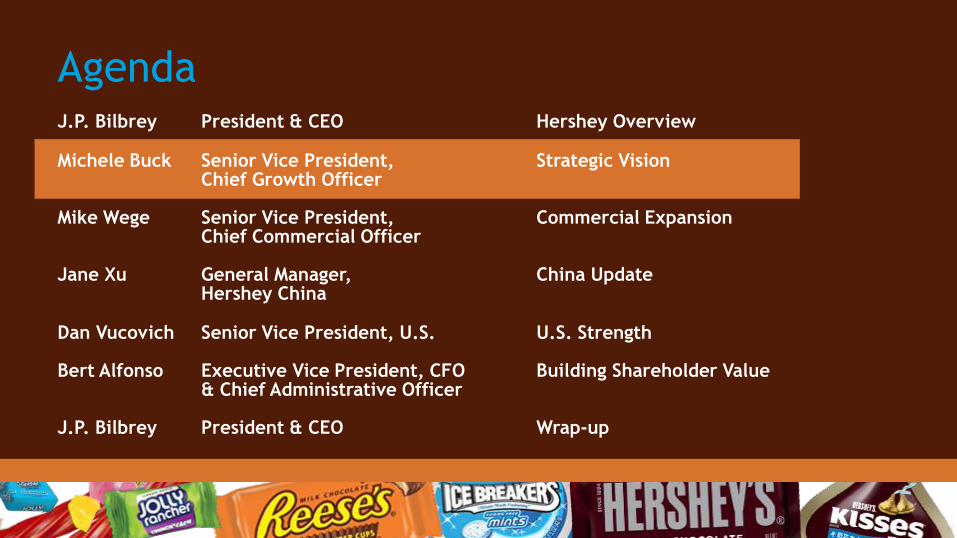
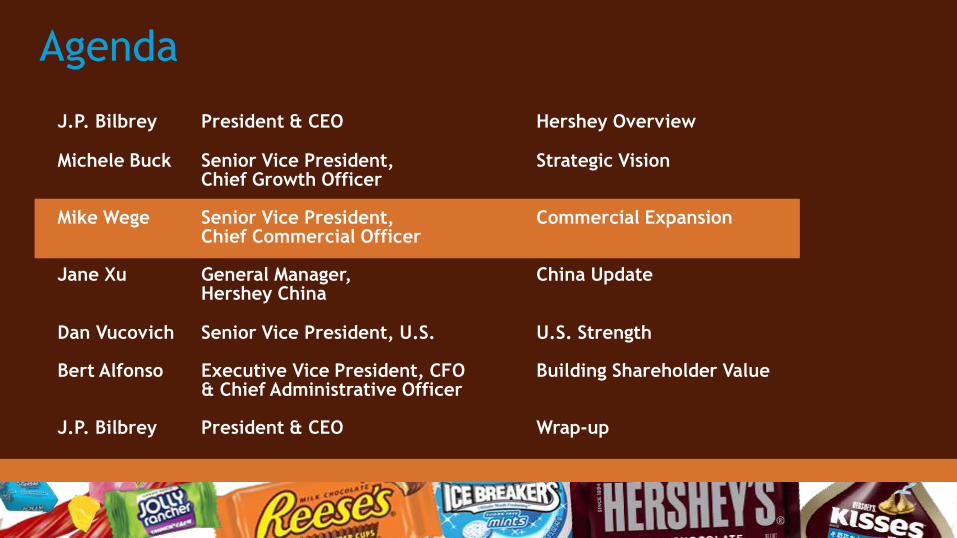
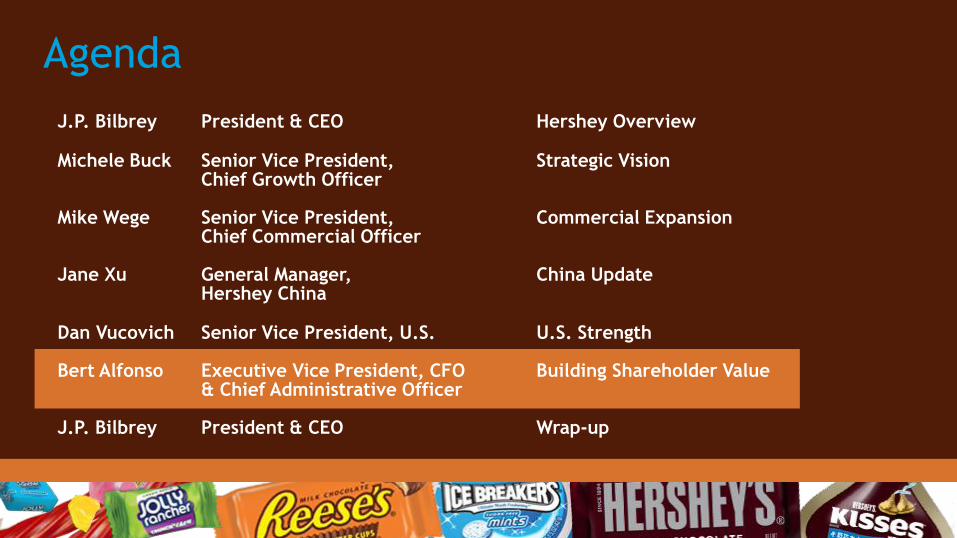
Agenda J.P. Bilbrey President & CEO Hershey Overview
Michele Buck Senior Vice President, Strategic Vision Chief Growth Officer Mike Wege Senior Vice President, Commercial Expansion Chief Commercial Officer Jane Xu General Manager, China Update Hershey China
Dan Vucovich Senior Vice President, U.S. U.S. Strength
Bert Alfonso Executive Vice President, CFO Building Shareholder Value & Chief Administrative Officer J.P. Bilbrey President & CEO Wrap-up
Key Messages Hershey’s business model is fundamentally advantaged
We are leveraging knowledge, intellectual capital, brand building
and innovation capabilities around the world
We are financially disciplined with resources to successfully
compete globally
Well-positioned to capture the opportunities ahead
We are focused on increasing shareholder value… on our aspirational path
to $10 billion in net sales

Hershey, a global company…
$6.1 billion net sales in 2011
~13,000 employees around
the world
Products available in over
70 countries around the world
Hershey products manufactured
in 14 countries

…delivering solid results…
Knowledge and intellectual capital is central to our success
Predictable and consistent net sales and earnings growth
U.S. business profitable for Hershey and retailers
Strong operating cash flow
Disciplined approach to global expansion

…driven by knowledge & intellectual capital
Integrated
Business
Management
IBM
Marketing Sales
Customer
Service
Category
Insights
Innovation
R&D
Finance

Building on our strengths in U.S. and key international markets

Hershey
Overview

Key drivers of increased shareholder value
Deliver predictable, profitable and sustainable N. America business
Expand our geographical footprint in focus markets
Create and expand a consumer-centric portfolio across
key geographies
Win with talent & knowledge to create a capable,
high performance culture
Execute with excellence
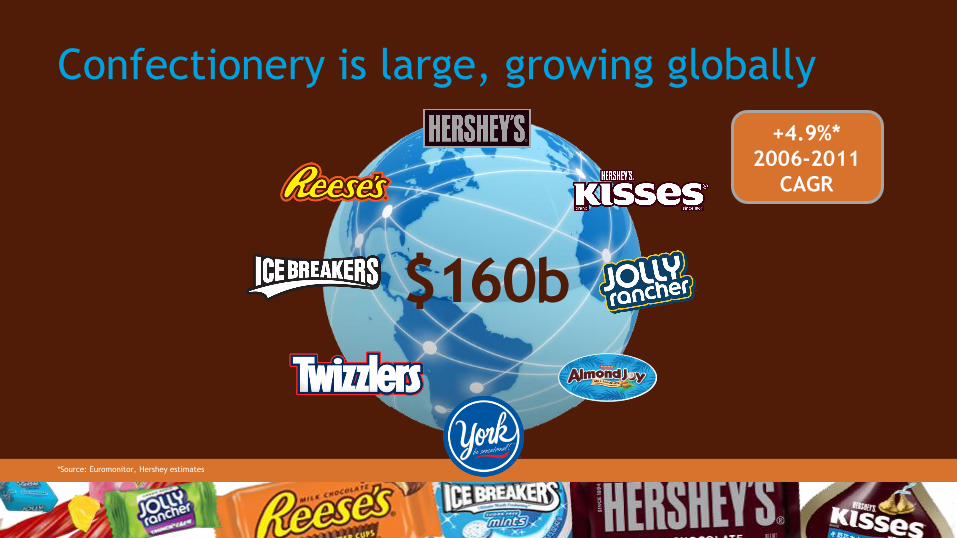
Confectionery is large, growing globally
*Source: Euromonitor, Hershey estimates
+4.9%*
2006-2011
CAGR
$160b

U.S. confectionery is attractive…
$80b Snack Market Confectionery is the largest snack segment
Snacking on trend with consumer behavior
Salty Snacks
26%
Confectionery 41%
16% Cookies/ Crackers
10% Breakfast
Bars
Meat Snacks 1%
Bakery Snacks 6%
Source: Data Monitor 2012 Projections, Hershey estimates

…and has channel ubiquity
Hershey % of Net
Sales by Channel
42%
Specialty Channels
Dollar Stores
15 C-stores
33 Mass
Merchandisers 10
Drug Stores
8 Wholesale
Clubs
25 Supermarkets
5
4
Source: Hershey sales
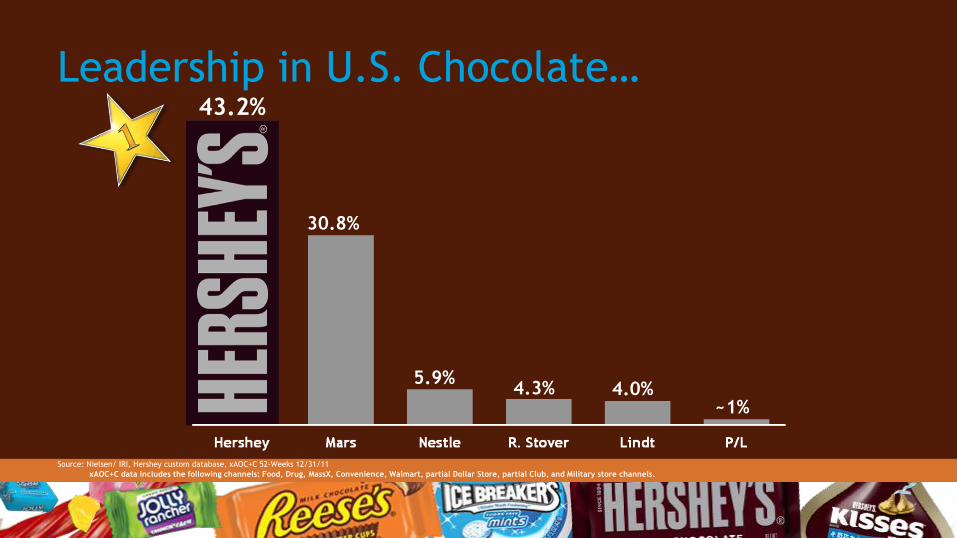
Leadership in U.S. Chocolate…
Source: Nielsen/ IRI, Hershey custom database, xAOC+C 52-Weeks 12/31/11
xAOC+C data includes the following channels: Food, Drug, MassX, Convenience, Walmart, partial Dollar Store, partial Club, and Military store channels.
43.2%
5.9%
30.8%
4.3% 4.0% ~1%

Mars/ Wrigley Hershey Kraft Nestle P/L R. Stover Lindt
… and strong overall category position…
Source: Nielsen/ IRI, Hershey custom database xAOC+C 52-Weeks 1/1/11
xAOC+C data includes the following channels: Food, Drug, MassX, Convenience, Walmart, partial Dollar Store, partial Club, and Military store channels.
31%
29%
6% 5%
3% 2% 2%
In the largest, most
profitable market
in the world

…with great purchasing dynamics
Household penetration
Impulse purchases
Merchandising responsiveness
Checkout conversion rate
Source: IRI Builders

Hershey Channel Growth
Food +4.2% +0.2 pts
Drug +12.2% +1.3 pts
Mass x +5.7% +0.5 pts
Convenience +11.1% +1.4 pts
xAOC+C* +8.3% +0.9 pts
% Chg
2010 vs. 2011
*xAOC+C data includes the following channels: Food, Drug, MassX, Convenience, Walmart, partial Dollar Store, partial Club and Military store channels.
Source: Nielsen, Hershey estimates as of year–end
Market
Share Gain

Consistent category growth…
$12.4
3.6% 5-yr
CAGR $14.8
FDMxC—CMG Retail Sales ($B)
Source: Nielsen/ IRI, Hershey custom database estimates

…driven by solid chocolate performance
$6.5
$8.0
Chocolate—FDMxC Retail Sales ($B) 4.2%
5-yr CAGR
Source: Nielsen/ IRI, Hershey custom database estimates

Hershey has a portfolio of iconic brands
The brands on this slide are registered trademarks® of The Hershey Company
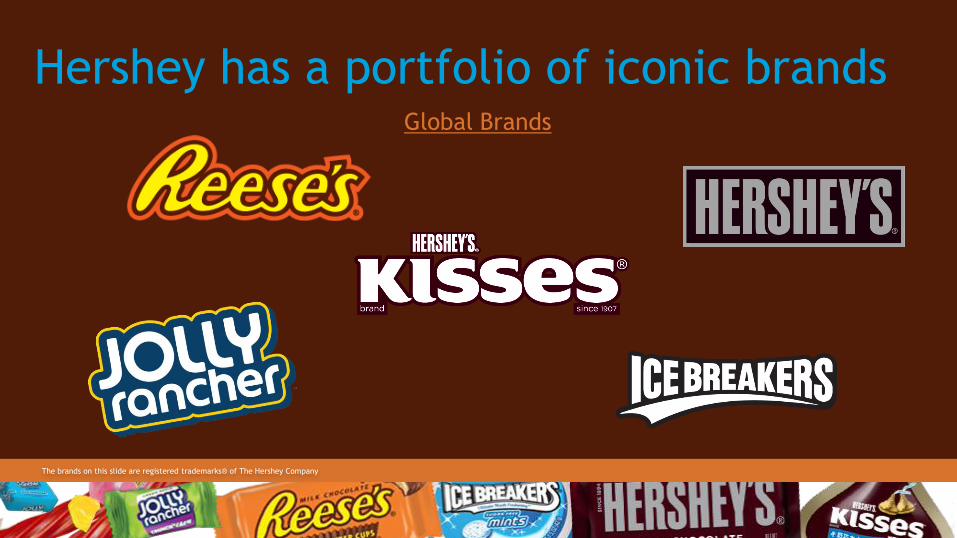
Hershey has a portfolio of iconic brands Global Brands
The brands on this slide are registered trademarks® of The Hershey Company

Hershey Tops Forbes Brand Rankings
Most Ethical Leadership
Honest and Trustworthy Brands
#5 Overall Brand Ranking
Source: Forbes, October 2011

Global footprint increasing…
$1b
Hershey International Net Sales % of Total Company
9.8%
13.8%
14.6% 15.6%

Global footprint increasing…
* Mexico, Brazil, China & India
U.S. (~85%)
The Hershey Company Net Sales
Export & all other
MBCI* U.S. +6%
MBCI* +26%
Canada +1%
Export & all other +20%
Total Hershey +7.2%
% Chg 2011 vs. 2010

…a big opportunity in emerging markets… Chocolate & Non-Chocolate Candy
2011 Estimated Retail Sales ($b)
Non-Chocolate Candy
Chocolate $6.3
$1.5 $0.7
$1.0
$4.3
$15.3
$9.2 $10.3
Source: Euromonitor

…and growing rapidly Chocolate & Non-Chocolate Candy
2006–2011 % CAGR
6.3
11.4
27.0
6.5
10.0 9.1
13.5 12.9
Non-Chocolate Candy
Chocolate
Source: Euromonitor

Knowledge & Intellectual Capital drive results…
IDP Activation
Strategy
Knowledge & Intellectual Capital
Demand Chain
Hershey
Trip Mission
Buyer
Supply Chain
Profitable Transaction
Marketing
Sales
Logistics
Manufacturing
Hershey Customers
The WHY
The WHAT
The HOW
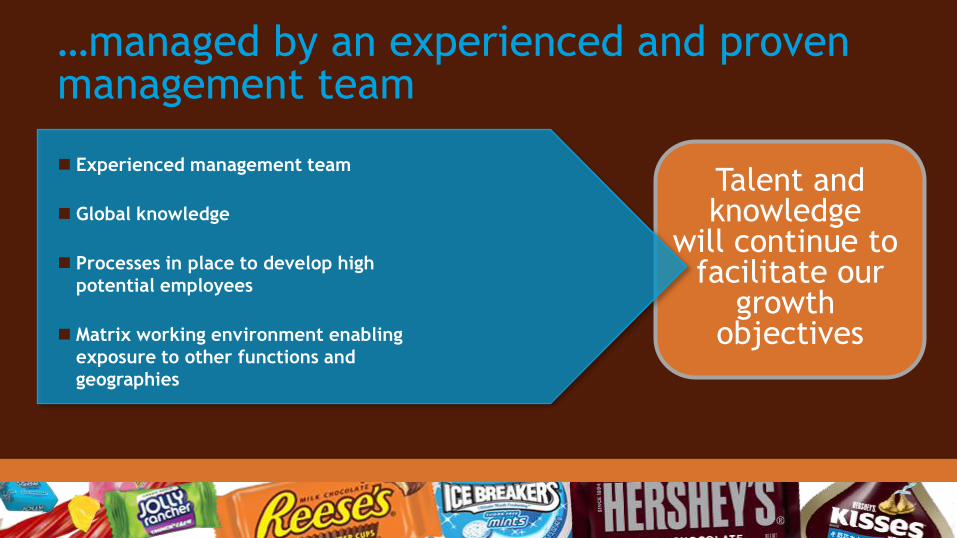
Talent and knowledge
will continue to facilitate our
growth objectives
Experienced management team
Global knowledge
Processes in place to develop high
potential employees
Matrix working environment enabling
exposure to other functions and
geographies
…managed by an experienced and proven management team

“Doing well, by doing good”
“One is only happy in proportion as he
makes others feel happy, and only as
useful as he contributes his influences
for the finer callings in life.”
-Milton S. Hershey
Corporate Social Responsibility…a 100 year legacy:

Hershey’s 2012 CSR Report

• Market Share
• Net Sales
• Margins
• EPS
Our strategy is working
Predictable
Consistent
Achievable

Revenue growth accelerated Net Sales YoY % Increase
+7-9%
+7.2% +7.0%
+3.2% +3.8%

A balanced approach
“Healthy” investment in brand building while growing EBIT margin
Advertising-to-sales ratio
EBIT margin*
*Adjusted, excludes business realignment and impairment charges & NSRPE

Strong EPS growth
$3.11
to $3.17
Adjusted EPS-Diluted*
$2.83 $2.57
$2.23
$1.76
*Adjusted, excludes business realignment and impairment charges & NSRPE
+10% t
o +
12%

International
Opportunities

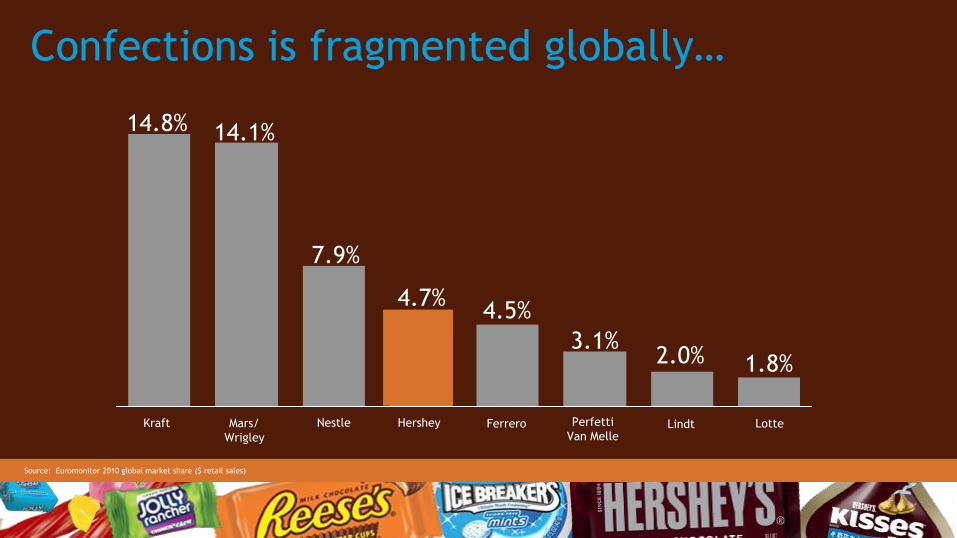
Confections is fragmented globally…
Source: Euromonitor 2010 global market share ($ retail sales)
Kraft Mars/
Wrigley Ferrero Nestle Hershey Perfetti
Van Melle
Lindt Lotte
14.8%
7.9%
4.7% 4.5%
3.1% 2.0% 1.8%
14.1%
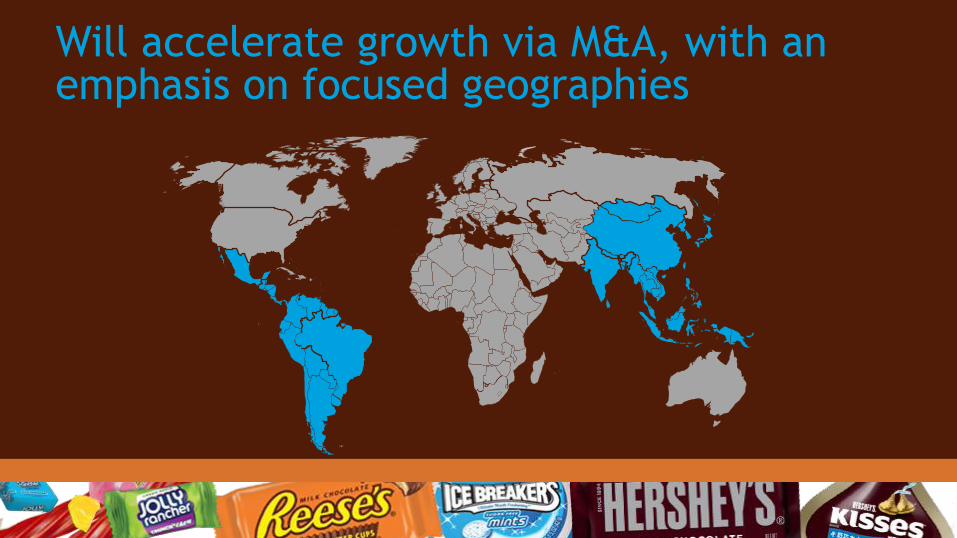
Will accelerate growth via M&A, with an emphasis on focused geographies

Robust global chocolate category growth Expected chocolate category size 2017 ($b)
Brazil China India Mexico Eastern Europe
Latin America
Russia
$10
$1.4
$9 $10
$3
$13
$3
+9% +11% Est. CAGR 2011-2017 +21% +4% +7% +12% +8%
Source: Euromonitor, Hershey estimates

Non-chocolate candy, a large global category Expected NCC category size 2017 ($b)
Brazil China India Mexico Eastern Europe
Latin America
Russia
$7
$3 $3
$7 $9
$3 $2
+6% +8% Est. CAGR 2011-2017 +16% +5% +6% +9% +3%
Source: Euromonitor, Hershey estimates

Outside U.S. & Canada net sales will continue
to accelerate with profitability to follow
Net Sales (organic) ~$700m $1.5b - $2.0b
CAGR (organic) ~20%
M&A -- Additive
Profitability Build out/ Low/
Invest mode Mid-teens %
2012E 2017E

Long-term
Targets
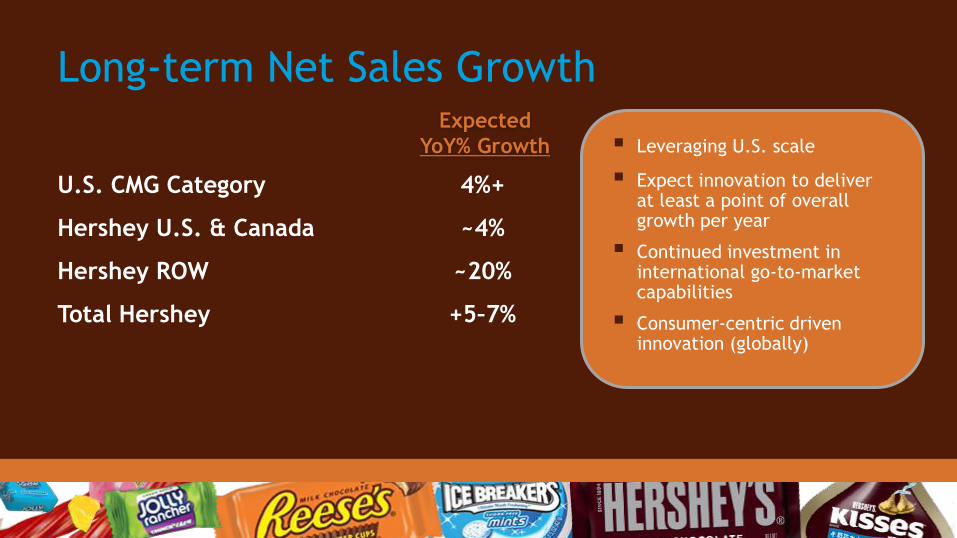
Long-term Net Sales Growth
U.S. CMG Category 4%+
Hershey U.S. & Canada ~4%
Hershey ROW ~20%
Total Hershey +5–7%
Leveraging U.S. scale
Expect innovation to deliver at least a point of overall growth per year
Continued investment in international go-to-market capabilities
Consumer-centric driven innovation (globally)
Expected
YoY% Growth

Long-term Adjusted Earnings Per Share
Previous
+6-8%
As of 6/25/12
+8-10%

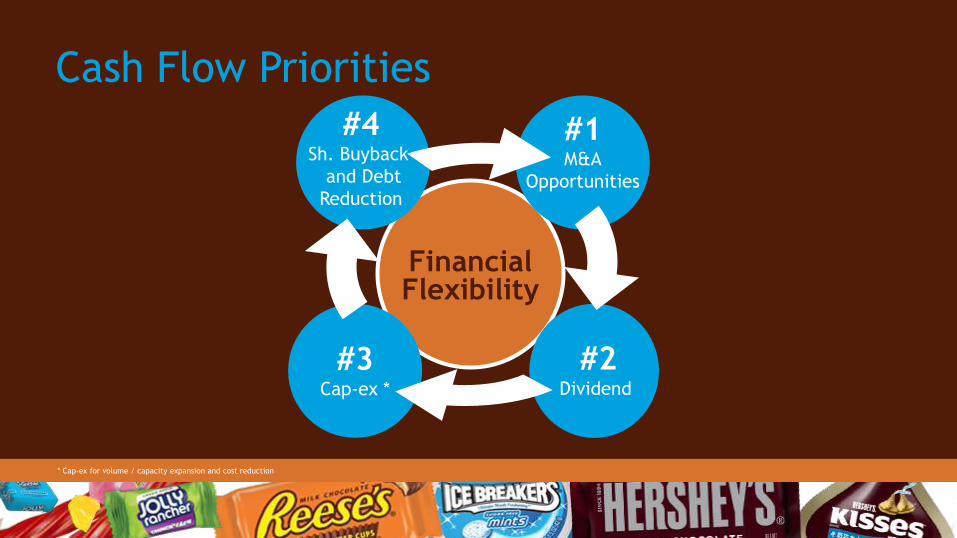
Cash Flow Priorities
* Cap-ex for volume / capacity expansion and cost reduction
#1 M&A
Opportunities
#3 Cap-ex *
#4 Sh. Buyback
and Debt
Reduction
#2 Dividend
Financial Flexibility

Solid Shareholder Returns Total Shareholder Return (%)
December 31, 2007 – May 31, 2012
HSY
S&P Food Group
S&P 500
DJIA

Hershey, a solid business investment
Predictable and consistent top-line growth
Profitable category for both manufacturers and retailers
Strong operating cash flows
Solid balance sheet
Agenda J.P. Bilbrey President & CEO Hershey Overview
Michele Buck Senior Vice President, Strategic Vision Chief Growth Officer Mike Wege Senior Vice President, Commercial Expansion Chief Commercial Officer Jane Xu General Manager, China Update Hershey China
Dan Vucovich Senior Vice President, U.S. U.S. Strength Bert Alfonso Executive Vice President, CFO Building Shareholder Value & Chief Administrative Officer J.P. Bilbrey President & CEO Wrap-up

Michele Buck, SVP Chief Growth Officer
Vision and Strategic Priorities

Key messages
We have built an advantaged business model proven to deliver
sustainable growth
Our vision and 5 year plan will drive accelerated growth
We will seize further US confectionery opportunity
Our brands and capabilities are transferable as we expand our
geographic footprint and portfolio in a disciplined manner
We will win with advantaged knowledge, investment and
continued operational excellence

Advantaged Business Model
IDP Activation
Strategy
Knowledge & Intellectual Capital
Demand Chain
Consumer / Shopper Solutions
Innovation
Retail Execution
Financial Discipline & Operating Excellence
Brand Building

6/25/2012
52
We have transformed… Consumer-Centric

Consumers Hershey’s
Demand Landscape
Shoppers Precision
Shopper Landscape
Brands
Transformed… Insights

Transformed… Advertising
$108M 2.2% of Net Sales ‘06
$414M 6.8% of Net Sales ‘11
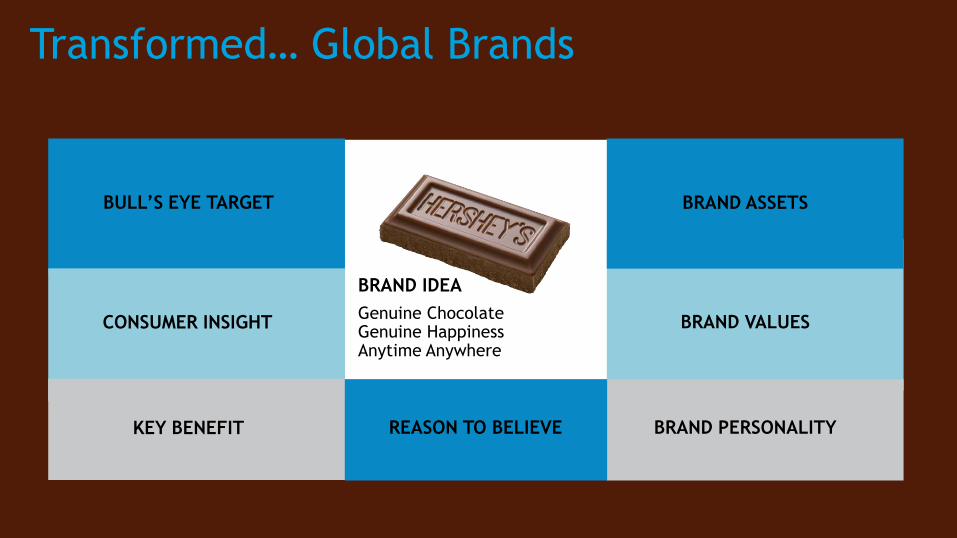
BRAND IDEA
Genuine Chocolate Genuine Happiness Anytime Anywhere
Transformed… Global Brands
BULL’S EYE TARGET
CONSUMER INSIGHT
KEY BENEFIT
BRAND VALUES
BRAND ASSETS
BRAND PERSONALITY REASON TO BELIEVE

ONE-OFF ITEMS
STRATEGIC
PLATFORMS
Transformed… Innovation

Transformed… Customer Relationship
VALUE ADDED,
CONSULTATIVE TRANSACTIONAL
CATEGORY GROWTH FOCUS

2012
EBIT Margin*
Revenue
YoY Revenue Growth and EBIT Margin*
Model has demonstrated results
+7-9%
*Adjusted, excludes business realignment and impairment charges & NSRPE

6/25/2012
59
59
Disciplined, Sustainable Growth
HERSHEY
VISION FOR
GLOBAL GROWTH

6/25/2012
60
CORE BUSINESS: Leadership in North America
GLOBAL EXPANSION: Scale player in select global emerging markets
BEYOND CHOCOLATE: Participate in on-trend consumer segments
M&A
Talent
Consumer
/ shopper
insights /
knowledge
Taste &
nutrition
science
Disciplined, Sustainable Growth
Go-to-
market Brands
Hershey Vision
DIFFERENTIATOR: Advantaged Knowledge & Insights
Supply
chain

Hershey Vision – Destination WHERE TO PLAY HOW TO WIN
CORE CAPABILITIES
Deliver Consumer and Shopper Solutions Through Insights and Knowledge
North America
GEOGRAPHIES
#1
CATEGORIES
Confectionery & Snacking
Convenience Oriented
BFY Indulgence
Snacking Continuum
Emerging Markets Among
the
Top 3

6/25/2012
62
Strong growth aspirations
GROSS MARGIN
~43%
% REVENUE INTERNATIONAL (ex US/Canada)
10% 25%
REVENUE
$6.5B
TODAY 5 Year Goal
+++ $10B
2012 2017
6/25/2012
63
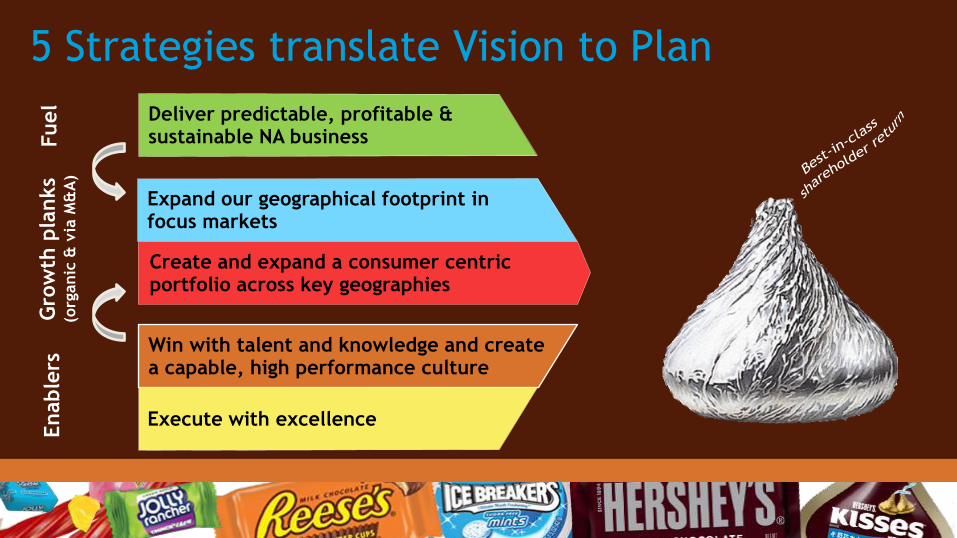
5 Strategies translate Vision to Plan
Deliver predictable, profitable & sustainable NA business
Create and expand a consumer centric portfolio across key geographies
Expand our geographical footprint in focus markets
Win with talent and knowledge and create a capable, high performance culture
Execute with excellence
Gro
wth
pla
nks
(org
anic
& v
ia M
&A
) Enable
rs
Fuel
6/25/2012
64
Create and expand a consumer centric portfolio across key geographies
Expand our geographical footprint in focus markets
Win with talent and knowledge and create a capable, high performance culture
Execute with excellence
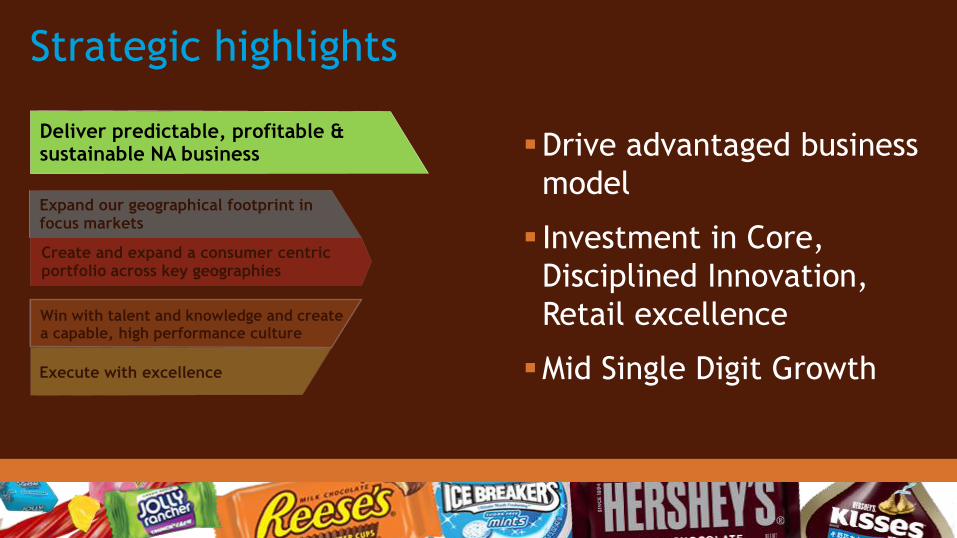
Deliver predictable, profitable & sustainable NA business Drive advantaged business
model
Investment in Core,
Disciplined Innovation,
Retail excellence
Mid Single Digit Growth
Strategic highlights

6/25/2012
65
Create and expand a consumer centric portfolio across key geographies
Win with talent and knowledge and create a capable, high performance culture
Execute with excellence
Deliver predictable, profitable & sustainable NA business
Strategic highlights
Expand our geographical footprint in focus markets
Focused expansion with
transferable, winning
business model
Big Bet in China
M&A as enabler

6/25/2012
66
Strategic highlights
Create and expand a consumer centric portfolio across key geographies
Expand our geographical footprint in focus markets
Win with talent and knowledge and create a capable, high performance culture
Execute with excellence
Deliver predictable, profitable & sustainable NA business 5 global brands
Two $2B Brands;
One $1B Brand;
One $500M Brand
Sweets & Refreshment and
Adjacencies accelerate

6/25/2012
67
Create and expand a consumer centric portfolio across key geographies
Expand our geographical footprint in focus markets
Execute with excellence
Strategic highlights
Deliver predictable, profitable & sustainable NA business
Win with talent and knowledge and create a capable, high performance culture
Grow global talent
Invest in R&D, M&A,
Go-to-market, and IDP
capabilities

6/25/2012
68
Create and expand a consumer centric portfolio across key geographies
Expand our geographical footprint in focus markets
Strategic highlights
Execute with excellence
Win with talent and knowledge and create a capable, high performance culture
Deliver predictable, profitable & sustainable NA business Gross margin expansion
Investment in capital
infrastructure
Supporting processes and
aligned compensation

6/25/2012
69
5 Strategies translate Vision to Plan
Create and expand a consumer centric portfolio across key geographies
Expand our geographical footprint in focus markets
Win with talent and knowledge and create a capable, high performance culture
Execute with excellence
Gro
wth
pla
nks
(org
anic
& v
ia M
&A
) Enable
rs
Deliver predictable, profitable & sustainable NA business F
uel

Mars/ Wrigley Hershey Kraft Nestle P/L R. Stover Lindt
Scale North America is foundation
#1 Chocolate
#2 in CMG
31%
29%
6% 5%
3% 2% 2%
Source: Nielsen/ IRI, Hershey custom database xAOC+C 52-Weeks 1/1/11
xAOC+C data includes the following channels: Food, Drug, MassX, Convenience, Walmart, partial Dollar Store, partial Club, and Military store channels.

6/25/2012
71
Invest in
Brands
Leverage
Capability & Scale
to Control Cost
Build Scale,
Realize Price
6% CAGR Margin Expansion Fuel $
International Expansion
Portfolio Expansion
Capability Building
Focused &
Disciplined Expansion
The “Virtuous Cycle”
Invest in
Knowledge, Insights
& Capabilities
North America sustainability funds growth

6/25/2012
72
Advertising
Innovation
Seasons
Balanced Growth Drivers Fundamentals
Consumer
Core
Customer
Capability
Built around a robust business model
Distribution
Merchandising

6/25/2012
73
Expand replicable US business model globally

6/25/2012
74
Deliver predictable, profitable & sustainable NA business F
uel
5 Strategies translate Vision to Plan
Create and expand a consumer centric portfolio across key geographies
Win with talent and knowledge and create a capable, high performance culture
Execute with excellence
Enable
rs
Expand our geographical footprint in focus markets
Gro
wth
pla
nks
(org
anic
& v
ia M
&A
)
Source: Euromonitor 2010 global market share ($ retail sales)
Kraft Mars/
Wrigley Ferrero Nestle Hershey Perfetti
Van Melle Lindt Lotte
14.8%
7.9%
4.7% 4.5%
3.1% 2.0% 1.8%
14.1%
Confections is fragmented globally…

Focus on high growth emerging markets
High GDP growth 4-10%
Middle Class
2/3 of World Population
High Confectionary growth 5-20%

-3%
-2%
-1%
0%
1%
2%
3%
4%
5%
6%
7%
2000 2001 2002 2003 2004 2005 2006 2007 2008 2009 2010 2011 2012 2013 2014 2015 2016
CMG
Real GDP
GDP vs. CMG Growth YoY % Change - World GDP & World CMG Retail Sales
Source: IMF, Euromonitor

Strong GDP Growth
--- World Avg. 2011 – 2016 CAGR
3.8%
Source: IMF
East

Rest of World
India
China
Mexico Russia
US W Europe Japan
Increasing Wealth from Rising Middle Class
Middle Class People (Million)
Source: Goldman Sachs “The Expanding Middle: The Exploding World Middle Class and Falling Global Inequality”

Highly populous
% of World Population - 2017
Total 70%
of World
Population
Source: IMF

6/25/2012
81
Market
attractiveness
Confectionery
attractiveness
Snack/Beverage
attractiveness
Prioritized by attractiveness & HSY ability to win
Win Now
Expand
Participate
Hig
h
Att
racti
veness
Low
er
Now Hershey Ability to Win Future
Existing market
position/talent
Customer/
cost sharing

6/25/2012
82
Roles and pacing key to profitable growth Win Now – Scale to
profitability Expand
Participate for future
growth
Middle-East &
North Africa
Brazil
South East
Asia
Contiguous
North
America
China India
Emerging West
& S. Africa
Eastern
Europe

6/25/2012
83
Leverage Density Strategy
Pop.
/GDP
Drive
Efficiency
6/25/2012
84
Building momentum in China…
Distribution Density
Advertising
Portfolio Chengdu
Beijing
Guangzhou
Shanghai
#2 Hershey’s Market
6x-7x Revenue Growth
Over Next 5 Years

6/25/2012
85
China experience
has been good
2011 2010 2009 2008 2007
Disciplined media investment
Methodical and aggressive city expansion
Building blocks approach to planning
Building a foundation
in India
2010 2011 2009 2008 2007
Underinvestment in brand building
Lack of differentiated portfolio
Entered with increasing sugar costs
Leveraging learnings to win

6/25/2012
86
Indexed to Current US Gross Margin
Healthy margins allow for profitability

6/25/2012
87
Investing in Infrastructure to support growth
Leverage local talent
Cross-pollinate
innovation between Asia
and US
Location: Shanghai
Asia R&D and Innovation Center

6/25/2012
88 88
Capacity expansion for international growth
Mexico
Brazil
India
China / Asia
North America
Additional Asia
manufacturing
facility
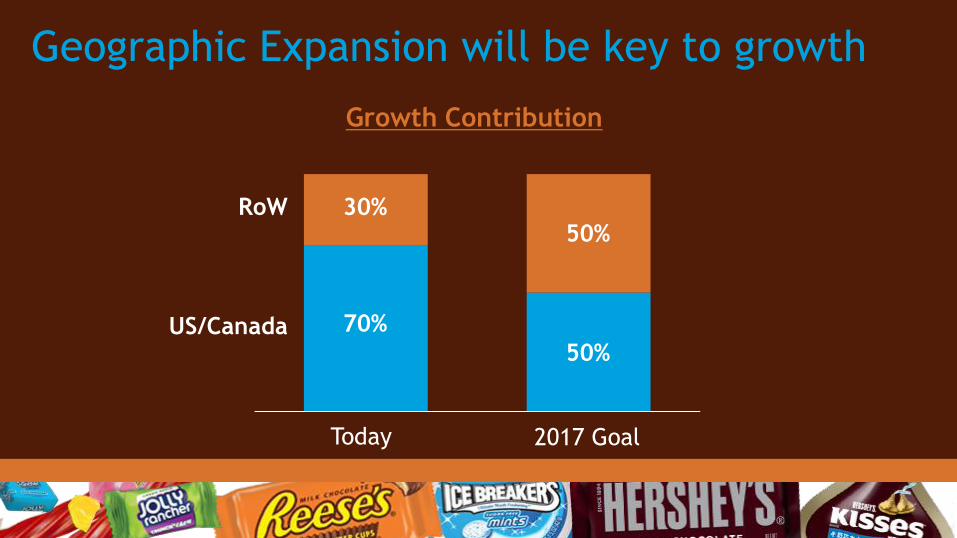
Geographic Expansion will be key to growth
RoW
70%
30%
US/Canada
50%
50%
2017 Goal Today
Growth Contribution

Role of Hershey M&A
Grow internationally
(especially in Win Now markets)
Expand
Portfolio Bolster the core
US business
M&A and Enabler
Build Strength Leverage Strength

6/25/2012
91
…with Financial flexibility to achieve
2012
EBITDA* ($m)
Operating
Cash Flow ($m)
*Adjusted, excludes business realignment and impairment charges & NSRPE

Disciplined approach to M&A opportunity
Mexico
Other
L. America
Brazil China
Eastern
Europe
Total Confectionary
Market Growth %1
Select Size of M&A
Opportunities
Approximate net sales($) of potential acquisition targets in billions
Source: Hershey Estimates, Euromonitor Note: Eastern Europe includes CIS states 1 Market growth rates are chocolate confectionary market nominal 2011-2016E CAGRs at year on year exchange rates
4%
0%
8%
12%

M&A focus on geographical bolt-ons
93
Strategic Preference
Adjacencies
White spaces
Acquisitions,
JVs and alliances Chocolate
Sweets and
Refreshment
Confections Snacks Distribution

6/25/2012
94
Deliver predictable, profitable & sustainable NA business F
uel
5 Strategies translate Vision to Plan
Expand our geographical footprint in focus markets
Win with talent and knowledge and create a capable, high performance culture
Execute with excellence
Enable
rs
Create and expand a consumer centric portfolio across key geographies
Gro
wth
pla
nks
(org
anic
& v
ia M
&A
)

6/25/2012
95
Drive Core Brands
Impulse Category
Expandable Consumption
Highly responsive to advertising
Drives scale profitability
International & Portfolio Expansion
Advertising as % NS
7.0%
High Single
Digit
Today 5 Yr Goal
Top
Quartile of
Peer
Group

6/25/2012
96
Expand 5 Core brands globally
The brands on this slide are registered trademarks® of The Hershey Company

6/25/2012
97
Innovate around Core Chocolate Sweets & Refreshment
Hand to Mouth, Refreshment Hand to Mouth, Better For You
The brands on this slide are registered trademarks® of The Hershey Company
6/25/2012
98
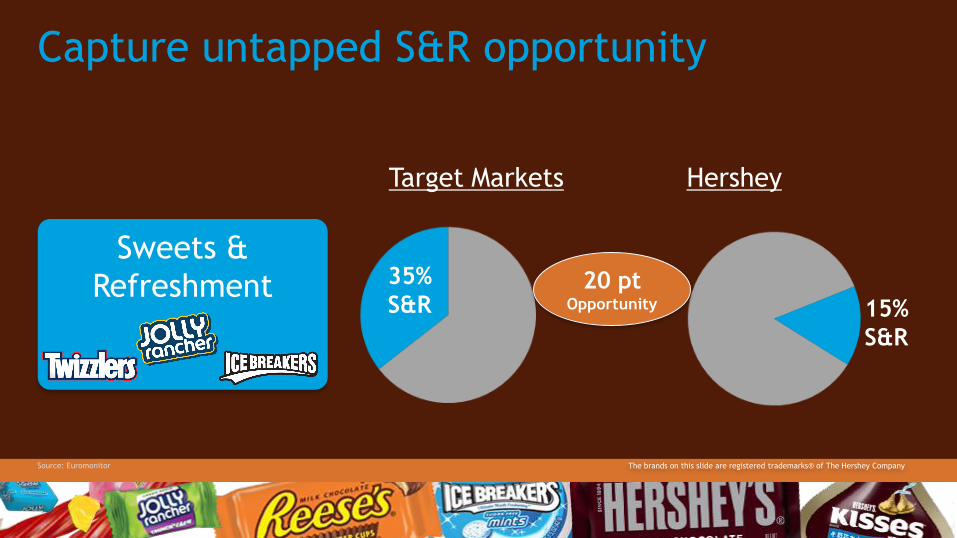
Sweets &
Refreshment
Capture untapped S&R opportunity
Target Markets Hershey
35%
S&R 15%
S&R
Source: Euromonitor
20 pt Opportunity
The brands on this slide are registered trademarks® of The Hershey Company

6/25/2012
99
Deliver predictable, profitable & sustainable NA business F
uel
5 Strategies translate Vision to Plan
Create and expand a consumer centric portfolio across key geographies
Expand our geographical footprint in focus markets
Execute with excellence
Gro
wth
pla
nks
(org
anic
& v
ia M
&A
)
Win with talent and knowledge and create a capable, high performance culture
Enable
rs

6/25/2012
100
US
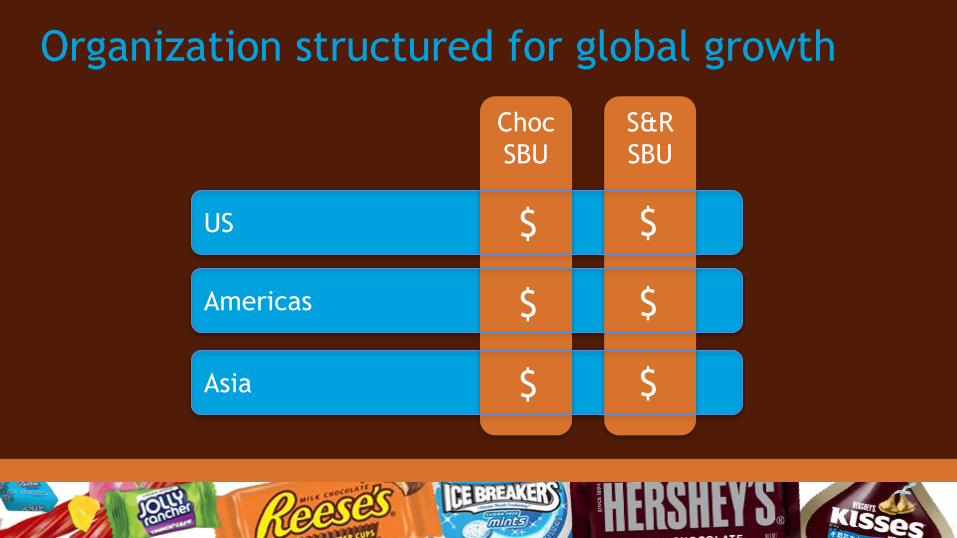
Organization structured for global growth
100
Asia
Americas
Choc
SBU
S&R
SBU New structure implemented
in 2011
SBUs build and leverage Hershey’s global brands
COEs disseminate best practices around the world
SBU
/ R
egio
n M
atr
ix

6/25/2012
101
Growing Global Talent
40%
Critical positions filled with top talent
28%
Today* 5 Yr Goal
+ 30%
* Excludes manufacturing headcount
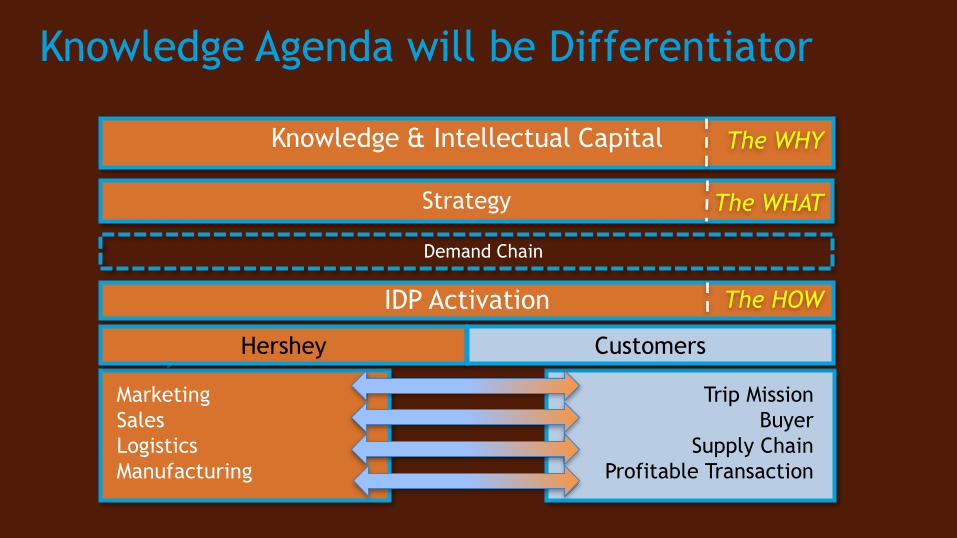
Knowledge Agenda will be Differentiator
IDP Activation
Strategy
Knowledge & Intellectual Capital
Demand Chain
Hershey
Trip Mission
Buyer
Supply Chain
Profitable Transaction
Marketing
Sales
Logistics
Manufacturing
Hershey Customers
The WHY
The WHAT
The HOW

Advantaged Knowledge Tools – Example
Hershey’s Demand
Landscape
Precision Shopper
Landscape IDP
Proprietary
Media Mix
Unmet Portfolio
Demand
Mind
Modeling
Palate
Mapping
Precision
Loyalty
Trip
Missions

6/25/2012
104
IDP Capability applied to optimize formulas
in geographic expansion
Drivers of Liking
Preferred bundle of benefits
Product developed to local taste
Palate Mapping
0
2
4
6
8
10Sweet
Cacao
Roast
Winey
Woody
Sour
Astringent
Resinous
Vanillin
Brown Spice
Cherry-artificial
Carbon
Bitter
Fennel
Flavor Profile of Scharffen Berger 62% Cacao Dark Chocolate

6/25/2012
105
Advancing capabilities to deliver IDP globally
Capability Ladders
Knowledge
Agenda
Retail as a
Competitive
Advantage
Category
Advisor
Shopper
Trip Missions
Building Sales
Competency
Planogram and
Assortments
Consumer
Demand
Landscape
Distributor &
Wholesale
Management
Share of
Shelf
Insights Go-to-Market Category Management

6/25/2012
106
Deliver predictable, profitable & sustainable NA business F
uel
5 Strategies translate Vision to Plan
Create and expand a consumer centric portfolio across key geographies
Expand our geographical footprint in focus markets
Win with talent and knowledge and create a capable, high performance culture
Gro
wth
pla
nks
(org
anic
& v
ia M
&A
) Enable
rs
Execute with excellence

6/25/2012
107
Integrated Business Processes central to success
Growth from Innovation: 1+pts (‘08-’11)
WMAPE : ~7pt improvement vs. ’09
Inventory: ~20% improvement vs.‘08
Case fill: 1+pt improvement vs. YAG
Forecast Accuracy (NS):
Improved to +/- 1.5%
Key Metric Targets
6/25/2012
108
Measure progress against 7 core capabilities
Example Metrics
1+pts of Growth from Innovation
30% Innovation from Tech platforms
5 Scale Global Brands
~65% Utilization
~190k Distribution Points (US)
100% Replicable PMO Capability
80% Critical Roles w/ Top Talent
Consumer/ shopper insights
Taste & nutrition science
Brands
Supply Chain
Go-to-market
M&A
Talent

6/25/2012
109
North
America
Global
Footprint
Portfolio
Expansion
Talent
& Knowledge
Execute with
Excellence
Focused Strategies and Initiatives
Chin
a G
row
th
Mexic
o G
row
th
S&
R E
xpansi
on /
Accele
rati
on
Port
folio
Expansi
on
M&
A P
ipeline &
Executi
on
Tale
nt
Str
ate
gy
Know
ledge /
Inte
llect.
Capit
al
Asi
a T
ech C
ente
r /
R&
D C
apab.
Sourc
ing
Asi
a
N
ext
Centu
ry
Strategic Initiatives
S T
R A
T E
G I E
S
Linked to
Individual
performance
goals
India
Gro
wth
Pro
ject

6/25/2012
110
Hershey will deliver predictable growth
Strong North American Foundation
with Replicable Business Model
Aggressive, yet Disciplined Expansion
Strong Top Line & Cost Management
Deliver Bottom Line Performance
J.P. Bilbrey President & CEO Hershey Overview
Michele Buck Senior Vice President, Strategic Vision Chief Growth Officer Mike Wege Senior Vice President, Commercial Expansion Chief Commercial Officer Jane Xu General Manager, China Update Hershey China
Dan Vucovich Senior Vice President, U.S. U.S. Strength Bert Alfonso Executive Vice President, CFO Building Shareholder Value & Chief Administrative Officer J.P. Bilbrey President & CEO Wrap-up
Agenda

Global Expansion through
Commercial Excellence
Mike Wege, Senior Vice President, Chief Commercial Officer

6/25/2012
113
Commercial Leadership
Strategic Business Units/“SBUs”
Global Chocolate
Global Sweets & Refreshment
Global Centers of Excellence
Selling & Customer
Marketing

Key Messages
Our structure and integrated capabilities are delivering strategic goals and priorities
Our brands are strong and proven, and we have the capability to expand them globally
A disciplined, insights-based approach to innovation is delivering
World-class selling and customer capabilities are accelerating global growth
Our commercial model is working across focus countries with China advancing rapidly

“Transforming our commercial
capabilities into a world-class,
knowledge-driven organization of brand
builders and category leaders…

...who inspire consumers with
uniquely compelling brand experiences,
applications and category innovation

...who partner with customers to
expand category growth and profitability
through industry-leading (IDP)
expertise and tools
...and who consistently deliver
top tier financial performance and
shareholder value.”

Commercial Teams
Knowledge/Insight-Driven
Consumer-Centric
Customer-Connected
Financially Focused
Solutions-Oriented
6/25/2012
120
US
Organization structured for global growth
120
Asia
Americas
Choc
SBU
S&R
SBU
$
$
$
$
$
$


Synchronized 18-month delivery (IBM)

Synchronized 5-year business planning (IBP)
IBP INTEGRATED BUSINESS
PLANNING
Strategic
Plan
Talent
Plan
Annual
Plan
Integrated
Business
Management (IBM)
=

6/25/2012
124
Deliver predictable, profitable & sustainable NA business F
uel
Expand our geographical footprint in focus markets
Win with talent and knowledge and create a capable, high performance culture
Execute with excellence
Enable
rs
Create and expand a consumer centric portfolio across key geographies
Gro
wth
pla
nks
(org
anic
& v
ia M
&A
) Key Strategies drive our 5-year plan

Hershey has iconic brands…
The brands on this slide are registered trademarks® of The Hershey Company
6/25/2012
126
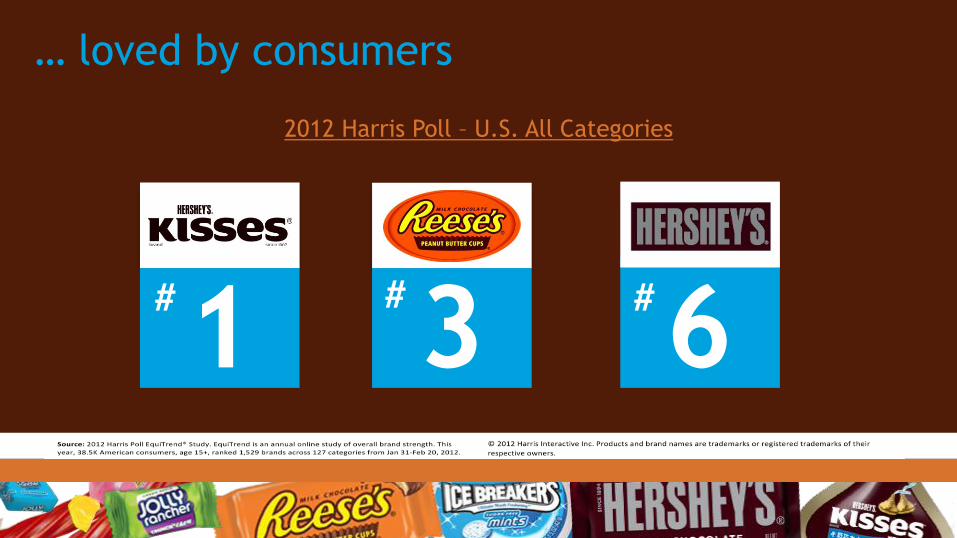
… loved by consumers
2012 Harris Poll – U.S. All Categories
3 #
1 #
6 #
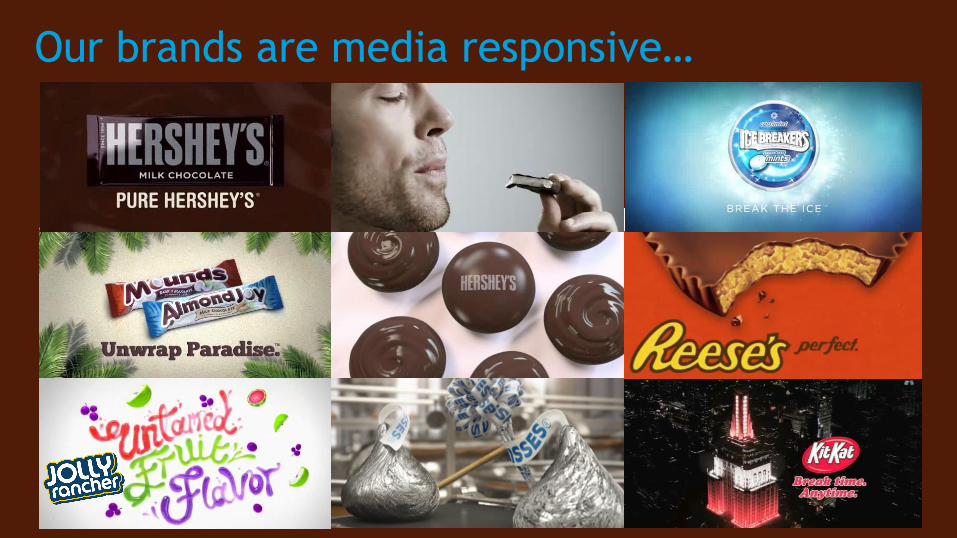
Our brands are media responsive…

Our brands win at retail

U.S. brands driving sustained growth…
US Net Sales Growth
Nine year
average 3.9%
2009 2010 2011

… and expanded market share
Hershey US CMG Share Change (pts) FDMxC
Source: Nielsen/ IRI, Hershey custom database estimates

Opportunity =
Building our brands globally
The brands on this slide are registered trademarks® of The Hershey Company

Insights build “Demand Landscape”
Hershey Demand Landscape
(HDL)
Consumer Insights
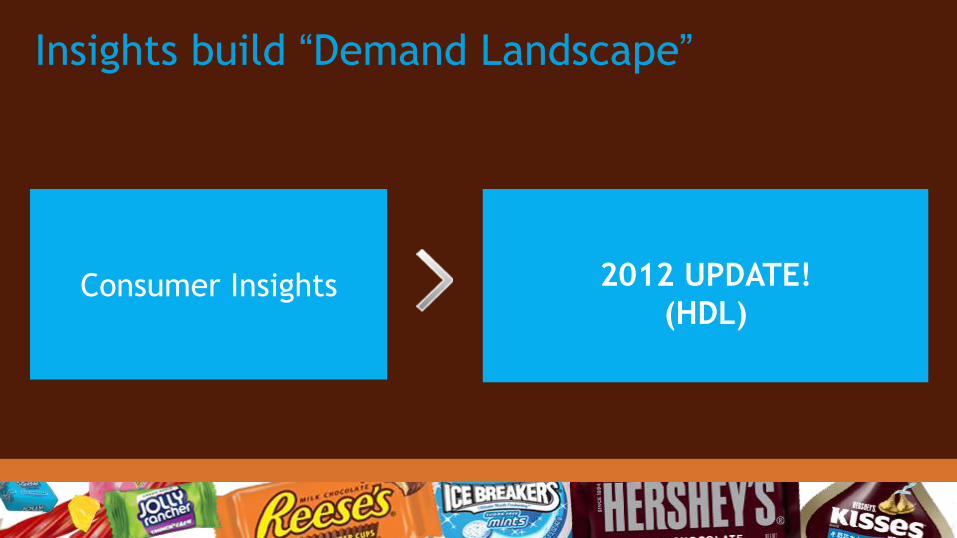
Insights build “Demand Landscape”
2012 UPDATE!
(HDL)
Consumer Insights
6/25/2012
134
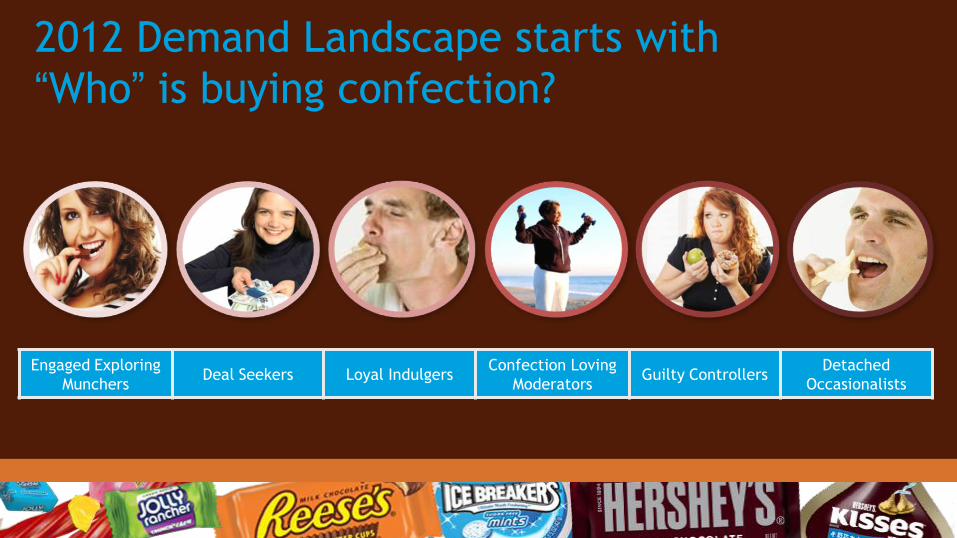
Engaged Exploring
Munchers Deal Seekers Loyal Indulgers
Confection Loving
Moderators Guilty Controllers
Detached
Occasionalists
2012 Demand Landscape starts with
“Who” is buying confection?

Updated Need States drive the “Why”
135
More Emotional More Physical/Functional

Combining “Who” and “Why” together…
Segments
Need
Sta
tes
Total Confection Demand Landscape 6
5
3
2
4
Comfort
Engaged Exploring Munchers
Detached Occasionalists
Loyal Indulgers Deal Seekers Confection
Loving Moderators
Guilty Controllers
Social Confidence
10
8
7
9

6/25/2012
137
…defines economic potential
137
Portfolio Choices
$ Brand A
$$$ Brand B
(Relaunch)
$ Brand D
White Space
White Space
$$ Brand C
$$ Brand E

New 2012 segment landscapes
will sharpen U.S. decisions Chocolate 2012
Pending Pending Pending Pending Pending Pending
6
5
3
2
4
1
Sweets 2012
Pending Pending Pending Pending Pending Pending
6
5
3
2
4
1
Segments
Need
Sta
tes
Total Confectionery 2012
6
5
3
2
4
1
Engaged
Exploring
Munchers
Detached
Occasionalists
Loyal
Indulgers
Deal
Seekers
Confection
Loving
Moderators
Guilty
Controllers
Refreshment 2012
Pending Pending Pending Pending Pending Pending
6
5
3
2
4
1

Expanding advantaged understanding of consumer demand
Chocolate Sweets &
Refreshment
U.S. 2012 (update) 2012
China 2012 2012
Mexico 2014 (update) 2012
Brazil 2012 TBD

Global Tools: Brand Building Framework
C CONNECTIONS
B BRAND
A AUDIENCE

Global Tools: Global Brand Architecture
BRAND PROMISE:
A one-of-a-kind chocolate experience to savor and share everyday
BULL’S EYE TARGET
CONSUMER INSIGHT
KEY BENEFIT
BRAND VALUES
BRAND ASSETS
BRAND PERSONALITY REASON TO BELIEVE

Global Tools: Global Visual Identity System
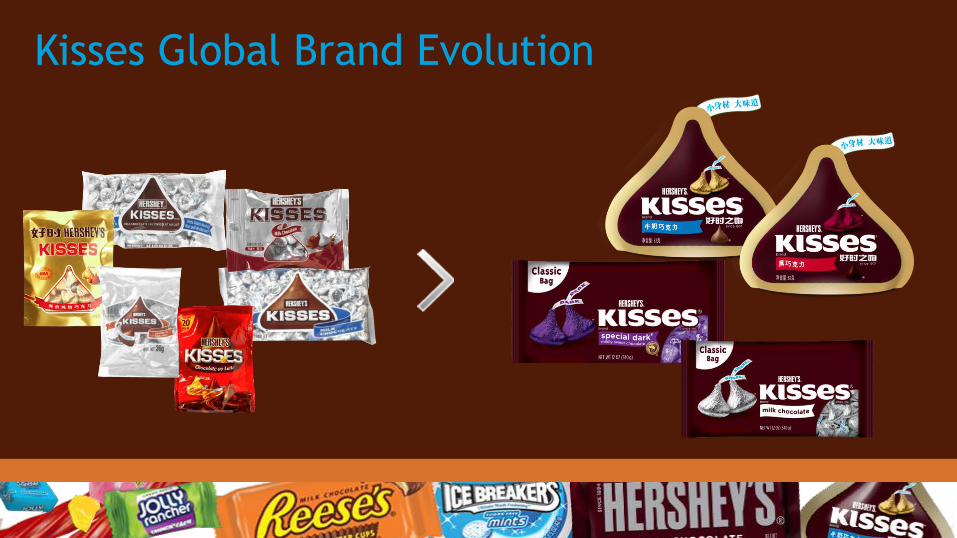
Kisses Global Brand Evolution

Global Tools: Market Mix Modeling
Competition
TV FSI
Radio
Trade
Price
Digital Media
Distribution
Macro Trends
RETAIL SALES
Seasonality Other Mktg

Global Tools: Ad Development System
“5 Steps to Success”
Full Production:
Business
Building
Advertising
Mind Modeling Insights
1 Focused Creative
Brief 2
Creative Tissue Session
3 Animatic Product-ion: 4-5 Ideas
4 Millward Brown Copy
Testing 5
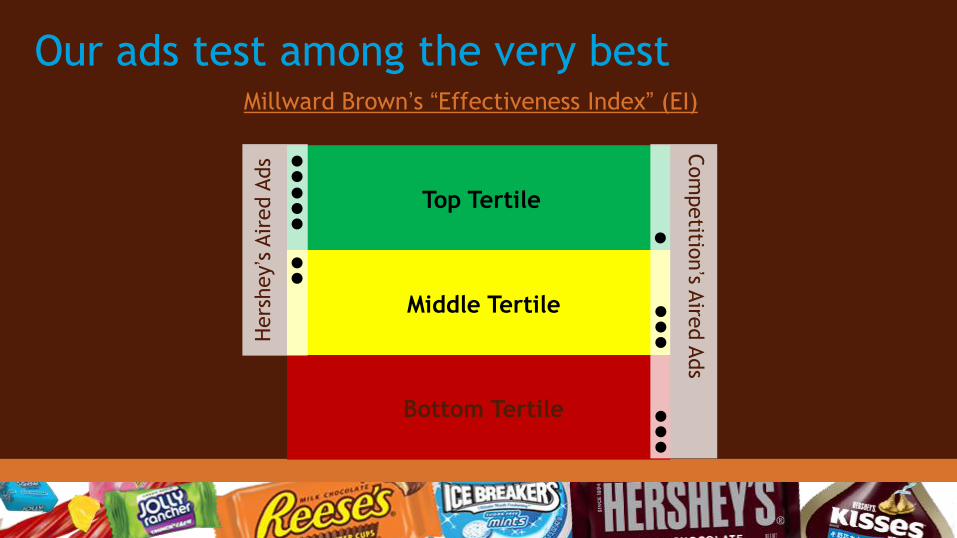
Our ads test among the very best
Top Tertile
Middle Tertile
Bottom Tertile
Millward Brown’s “Effectiveness Index” (EI)
Hers
hey’s
Air
ed A
ds
Com
petitio
n’s A
ired A
ds

6/25/2012
147
Global Tools: Continuity Media Model
Ad Delivery Minimum
Growth Threshold Level
XX GRPs/Wk
Illustrative Graph

6/25/2012
148
Global Tools: Continuity Media Model
Ad Delivery Minimum
Growth Threshold Level
Illustrative Graph
GRPs Media plans – Weeks on Air

6/25/2012
149
Global Tools: Continuity Media Model
Ad Delivery Minimum
Growth Threshold Level
Illustrative Graph
Media plans with dark periods -“Ad Stock” drops to zero- GRPs
Ad Stock (Awareness)

6/25/2012
150
Global Tools: Continuity Media Model
Ad Delivery Minimum
Growth Threshold Level
Illustrative Graph
GRPs
Media delivery above “growth” thresholds

Global Tools: Digital Efficiency
100% Traditional TV
XX% Traditional TV + YY% Digital Media
Equivalized GRPs on TV and Paid Digital
Traditional TV and Digital Media Delivery Curves
Illustrative Graph
% E
ffecti
veness
- S
atu
rati
on

Holistic Digital - Reese’s NCAA
152
Reese’s and NCAA team
up for March Madness in
2013
Paid Owned
Shared Earned

BRAND PROMISE:
A one-of-a-kind chocolate experience to savor and share everyday
Meaningful positioning & great execution

6/25/2012
154
Kisses is delivering as a Global Brand
Kisses 2011 Net Sales Growth %
Source: Hershey Financials
+25% ASEAN +55%
Greater China +120%
Latin America +18%

6/25/2012
155
Hershey’s is also delivering
Hershey’s 2011 Net Sales Growth %
+24% ASEAN +59%
Greater China +45%
Latin America +29%
Source: Hershey Financials

6/25/2012
156
Filling in the geographic landscape
Leadership Growing Growing Launch Growing
Leadership Leadership Launch Launch
Growing Growing Growing Growing
Leadership Growing Growing Launch Launch
Growing Growing Growing Launch
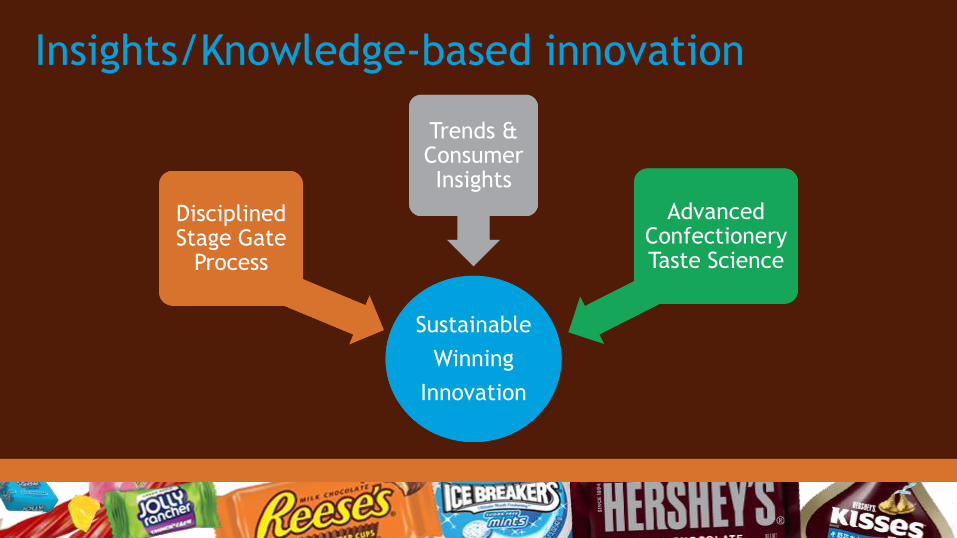
Insights/Knowledge-based innovation
Sustainable
Winning
Innovation
Disciplined Stage Gate
Process
Trends & Consumer Insights
Advanced Confectionery Taste Science

Delivering predictable, sustaining innovation
US Net Innovation Sales Growth
2008 2009 2010 2011
Source: Hershey Financials, Net of cannibalization
HSY Target
= 1pt

Strong innovation ahead

Robust global innovation pipeline
Stage 1 Stage 2 Stage 3
Exploration Commercialization Definition
1
Chocolate
Strategic
Opportunity
B A
15
Projects 34
Projects
12
Projects Chocolate
Strategic
Opportunity
Chocolate
Strategic
Opportunity
Chocolate
Strategic
Opportunity
Sweets &
Refreshment
Strategic
Opportunity
11
Projects 22
Projects
8
Projects Sweets &
Refreshment
Strategic
Opportunity
Sweets &
Refreshment
Strategic
Opportunity
Sweets &
Refreshment
Strategic
Opportunity
Chocolate
Strategic
Opportunity
Sweets &
Refreshment
Strategic
Opportunity
2 3
Launch

6/25/2012
161
Expanding our geographical footprint
Deliver predictable, profitable & sustainable NA business F
uel
Create and expand a consumer centric portfolio across key geographies
Win with talent and knowledge and create a capable, high performance culture
Execute with excellence
Enable
rs
Expand our geographical footprint in focus markets
Gro
wth
pla
nks
(org
anic
& v
ia M
&A
)

Expanding IDP and world-class selling and customer capabilities
Hershey’s Sales Center of Excellence: Focus Capabilities
Market Entry
Modern/
Traditional
Retail Sales
Force Pricing
Category
Management
Customer
Development Trade Funding
Industry
Affairs CAPABILITY

163
Market Entry
Modern/
Traditional
Retail Sales
Force Pricing
Category
Management
Customer
Development Trade Funding
Industry
Affairs
Best In
Class Rapid national
distribution
Rapid city
distribution
Distributor
model
Retail as a
competitive
advantage
Building
Sales Force
competency
Distributor &
wholesale
management
Tradewinds
Trade
managed
annually
Trade managed
Advanced
analytics
Pricing
models
Hershey
indexed
Category
advisor
Planogram &
assortments
Share of
shelf
IDP
Application
Customer
planning
cycle
Top accounts
managed
Affecting
industry
policy
Involved
as leader
Member
Right knowledge, right time, right place
Market Entry
Developed
CAPABILITY

Asia/Middle East region has grown rapidly
Source: Hershey Financials
Region up 85% from 2007
China +100% vs year ago
Kisses and Hershey’s leading
growth
Building regional scale in
supply chain and route to
market

China Update
Jane Xu, General Manager, Hershey China

An exciting time in China

China Key Messages
China ‘s confection market is attractive and expanding
Hershey’s disciplined, insights-based approach to brand building is driving growth
Our “density” route-to-market focus creates scale in high GDP regions
In-country manufacturing has enabled a cost-effective, responsive supply chain
China’s new R&D center will strengthen innovation and cost capability
Strategic investments are aligned to deliver strong growth and a scaled business

China market is large and growing
China CMG ($B)
Source: Euromonitor
Top 5 Global CMG market
by 2016
2007 2008 2009 2010 2011
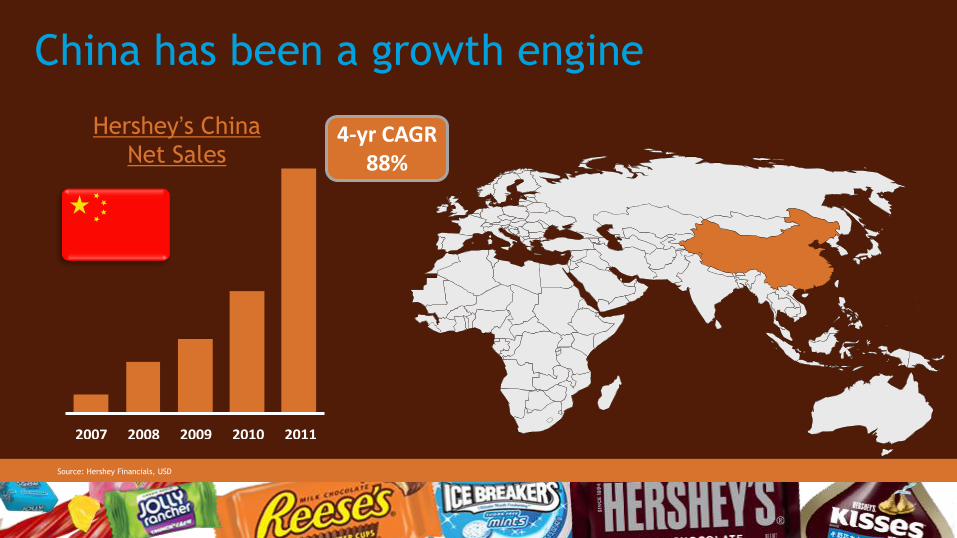
China has been a growth engine
Source: Hershey Financials, USD
Hershey’s China
Net Sales 4-yr CAGR
88%

2007 2008 2009 2010 2011
Focused distribution expansion
In store and seasonal support
Localized media adaptation
China Net Sales - Kisses
Source: Hershey Financials, USD
Consumer-centric brand building
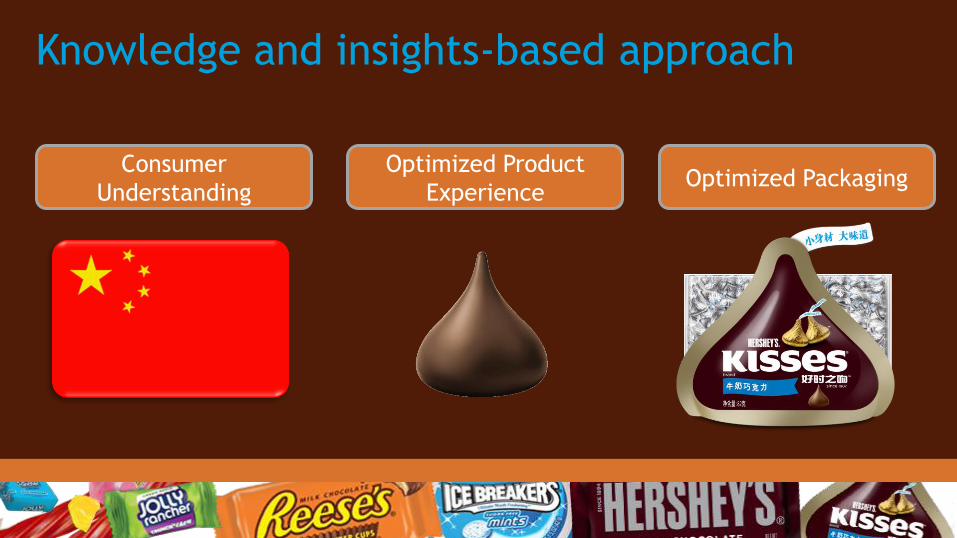
Knowledge and insights-based approach
Consumer
Understanding
Optimized Product
Experience Optimized Packaging
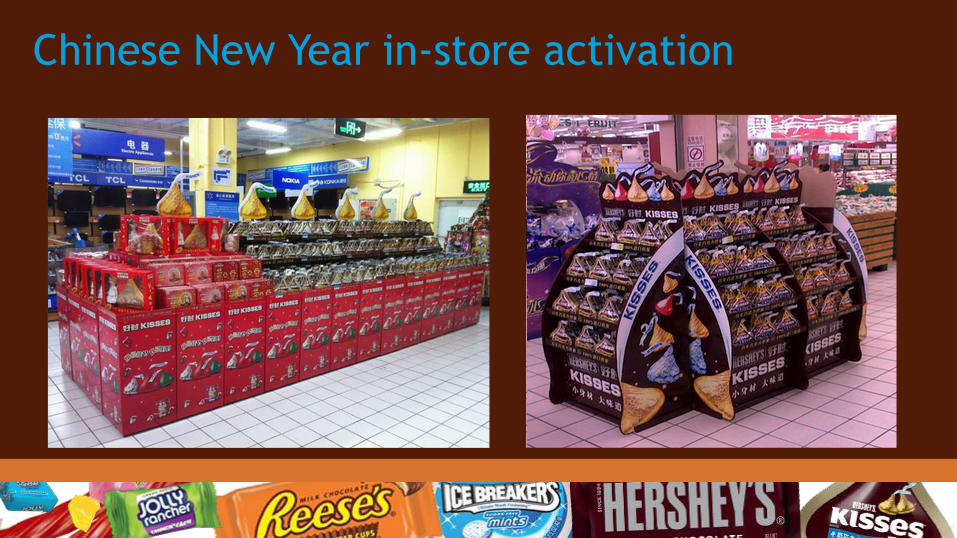
Chinese New Year in-store activation

Density-based distribution model
Driving density of distribution
and media in distribution cities
Prioritizing coverage on highly
productive channels
Beijing
Shanghai
Guangzhou
Chengdu
Focused portfolio by channel
Beijing
Guangzhou
Chengdu Shanghai

174
Building world-class capabilities
Market Entry
Modern/
Traditional
Retail Sales
Force Pricing
Category
Management
Customer
Development Trade Funding
Industry
Affairs
Best In
Class Rapid national
distribution
Rapid city
distribution
Distributor
model
Retail as a
competitive
advantage
Building
Sales Force
competency
Distributor &
wholesale
management
Tradewinds
Trade
managed
annually
Trade managed
Advanced
analytics
Pricing
models
Hershey
indexed
Category
advisor
Planogram &
assortments
Share of
shelf
IDP
Application
Customer
planning
cycle
Top accounts
managed
Affecting
industry
policy
Involved
as leader
Member
Market Entry
Developed
CAPABILITY

Local investments for growth
Established Manufacturing Adding China R&D

Expanding Knowledge Capability
China Chocolate Demand
Landscape 2012
China S&R Demand
Landscape 2012
S&R 2012
Pending Pending Pending Pending Pending Pending
6
5
3
2
4
1
Chocolate 2012
Pending Pending Pending Pending Pending Pending
6
5
3
2
4
1

Expanding success to fuel growth
The brands on this slide are registered trademarks® of The Hershey Company

An exciting time in China

Model in action – Americas progress
Mexico and Central/South America
+12% CAGR since 2007
Kisses and Hershey’s leading growth
Sweets & Refreshment gaining in
Canada and Mexico
Mexico and Brazil accelerating to
scale

6/25/2012
180
Mexico and Brazil are driving growth
for the region
2007 2008 2009 2010 2011 2007 2008 2009 2010 2011
BRAZIL MEXICO
Local Currency

Core brand portfolio fueling growth
MEXICO BRAZIL
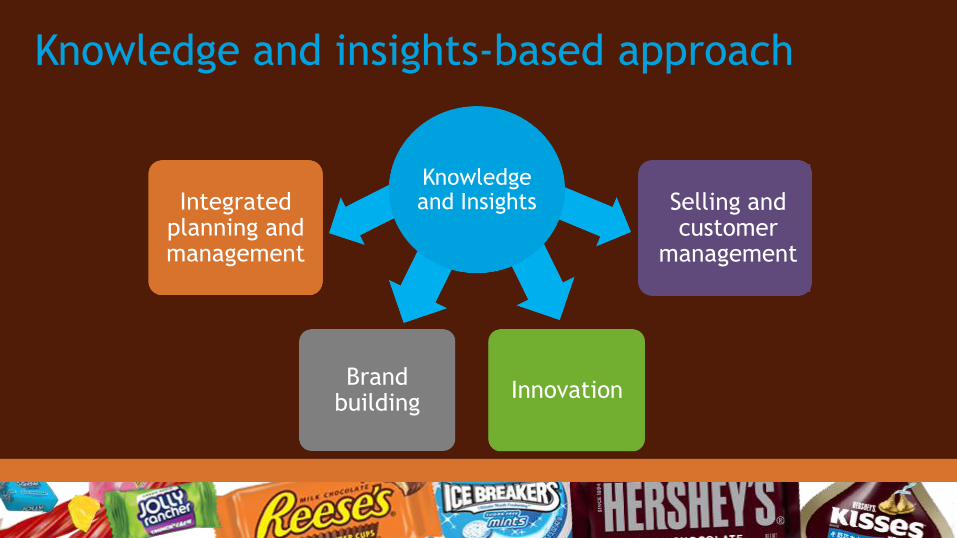
Knowledge and insights-based approach
Knowledge and Insights Integrated
planning and management
Brand building
Innovation
Selling and customer
management

6/25/2012
183
Commercial model delivering strategies
Deliver predictable, profitable & sustainable NA business F
uel
Win with talent and knowledge and create a capable, high performance culture
Execute with excellence
Enable
rs
Create and expand a consumer centric portfolio across key geographies
Gro
wth
pla
nks
(org
anic
& v
ia M
&A
)
Expand our geographical footprint in focus markets

Agenda
J.P. Bilbrey President & CEO Hershey Overview
Michele Buck Senior Vice President, Strategic Vision Chief Growth Officer Mike Wege Senior Vice President, Commercial Expansion Chief Commercial Officer Jane Xu General Manager, China Update Hershey China
Dan Vucovich Senior Vice President, U.S. U.S. Strength Bert Alfonso Executive Vice President, CFO Building Shareholder Value & Chief Administrative Officer J.P. Bilbrey President & CEO Wrap-up

U.S. Strength
Dan Vucovich, SVP, President U.S. Region

In a challenging economy, confection has grown above its historical average and
performed better than other “center of store” categories
Hershey’s investments in Knowledge, Insights and Customer Solutions have helped
accelerate confection’s growth
Insights Driven Performance is a systematic and repeatable model that has produced
balanced growth across our Strategic Business Units and Channels
Exciting opportunities across our brands, customers, acquisitions and adjacencies have
been identified and are being aggressively worked
Key messages

US is foundational to Hershey’s growth strategy
187
Gro
wth
pla
nks
(org
anic
& v
ia M
&A
) Enable
rs
Fuel
Create and expand a consumer centric portfolio across key geographies
Expand our geographical footprint in focus markets
Win with talent and knowledge and create a capable, high performance culture
Execute with excellence
Deliver predictable, profitable & sustainable NA business

6/25/2012
188
CMG is a Top 10 food and drink category…
Retail Sales ($b)
Carb Bev Bread / Bkd
Goods
Snacks CMG Pkgd Meat Milk Cheese Prepared
Frzn Foods
Beer Juice
Source: Nielsen xAOC Syndicated Database (52 Weeks Ending 5/12/2012)

6/25/2012
189
…enjoyed by just about every US household
Source: Nielsen US Homescan Panel
Household Penetration
Salty
Snacks
CMG Carb Bev Cereal Soup Crackers Juice Cookies Snack
Bars

…helped in part by its broad availability
Source: Nielsen Hershey Custom Database xAOC+C (52 Weeks Ending 5/19/2012)
Food
Club
C-Store
Drug
Mass
Dollar
% CMG Sales By Channel

6/25/2012
191
In addition to being big, Confection is growing
2 Yr CAGR
Milk Cheese Snacks Pkgd Meat CMG Beer Bread / Bkd
Goods
Prepared
Frzn Foods
Juice Carb Bev
Source: Nielsen xAOC Syndicated Database (52 Weeks Ending 5/15/2010, 5/14/2011, 5/12/2012)
6/25/2012
192
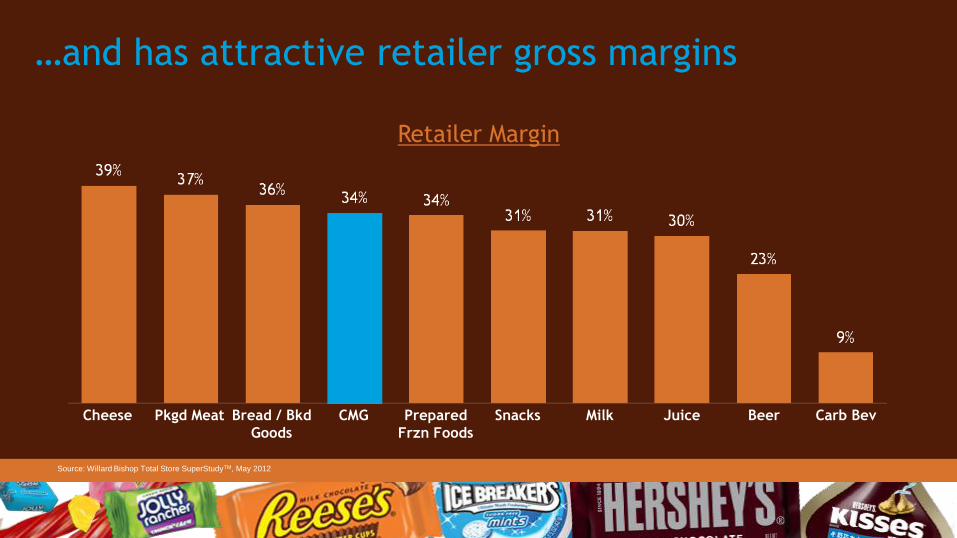
…and has attractive retailer gross margins
Retailer Margin
Source: Willard Bishop Total Store SuperStudyTM, May 2012
Cheese Pkgd Meat Bread / Bkd
Goods
CMG Prepared
Frzn Foods
Snacks Milk Juice Beer Carb Bev

6/25/2012
193
Hershey’s outpaced category and channel growth
Growth by Channel - 2 Yr CAGR C
MG
He
rsh
ey C
MG
Source: Nielsen Hershey Custom Database xAOC+C (52 Weeks Ending 12/31/2009, 12/31/2010, 12/31/2011)

…by leveraging Insights Driven Performance
Consumers Hershey’s
Demand Landscape
Shoppers Precision
Shopper Landscape
Execution Excellence
Insights Driven Performance
Merchandising Distribution Seasons Innovation Advertising

…to create & satisfy demand for our iconic brands
The brands on this slide are registered trademarks® of The Hershey Company

IDP’s disciplined investment approach
Brand Growth Potential
Bra
nd
Econom
ics
High
Low
Protect and Maintain Fuel Strategic Growth Engines
Manage for Margin
Review Role
Build High Potential Brands
Learn and Prove
High

6/25/2012
197
197
…and deep consumer Insights
Consumer Segments
Need States
Demographics
Benefits/Attributes
Usage Occasions
“Perfect
Combination”
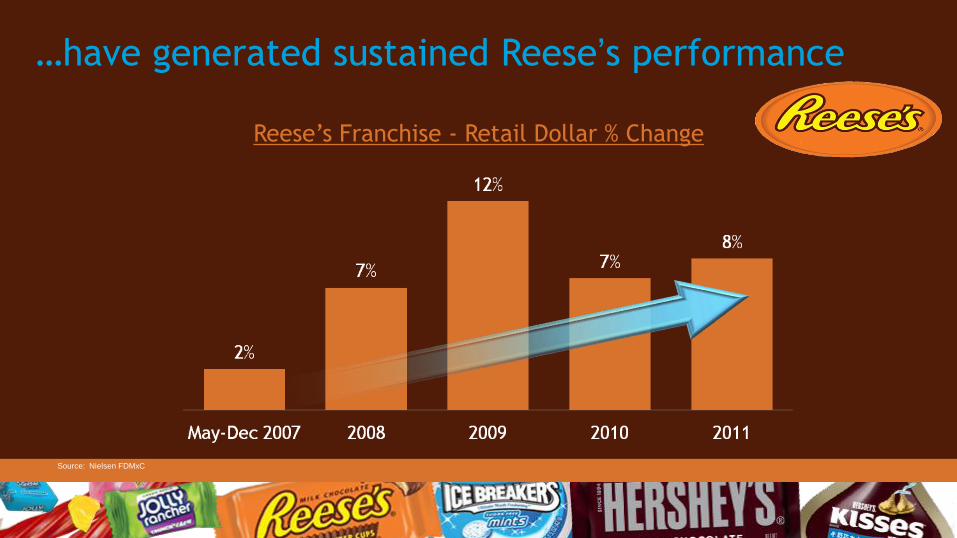
…have generated sustained Reese’s performance
Source: Nielsen FDMxC
Reese’s Franchise - Retail Dollar % Change

“Perfect” was activated across the marketing mix
. Merchandising Distribution Seasons Innovation Advertising
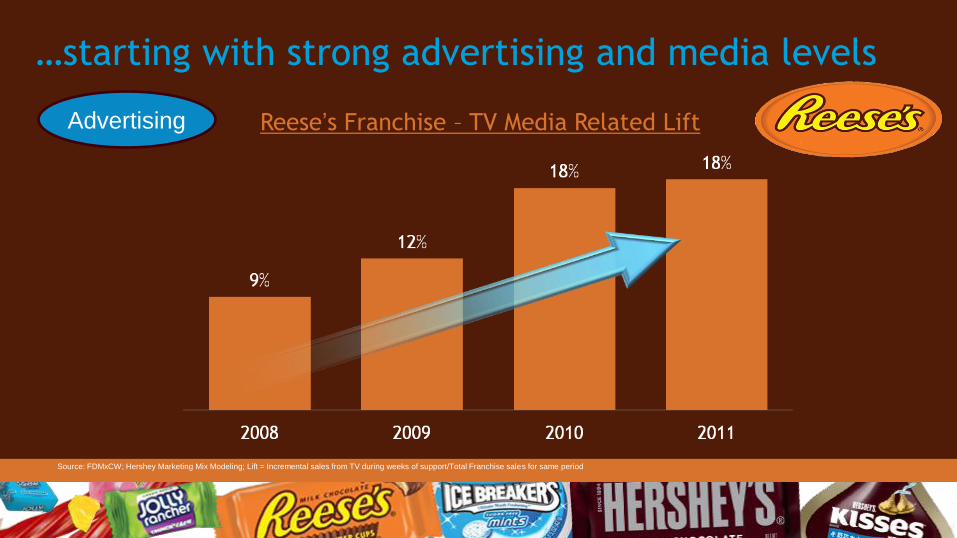
…starting with strong advertising and media levels
Reese’s Franchise – TV Media Related Lift
Source: FDMxCW; Hershey Marketing Mix Modeling; Lift = Incremental sales from TV during weeks of support/Total Franchise sales for same period
Advertising

…then activated across Hershey’s growth levers
. Merchandising Distribution
Seasons
Innovation Advertising
Reese’s Franchise - Easter Example
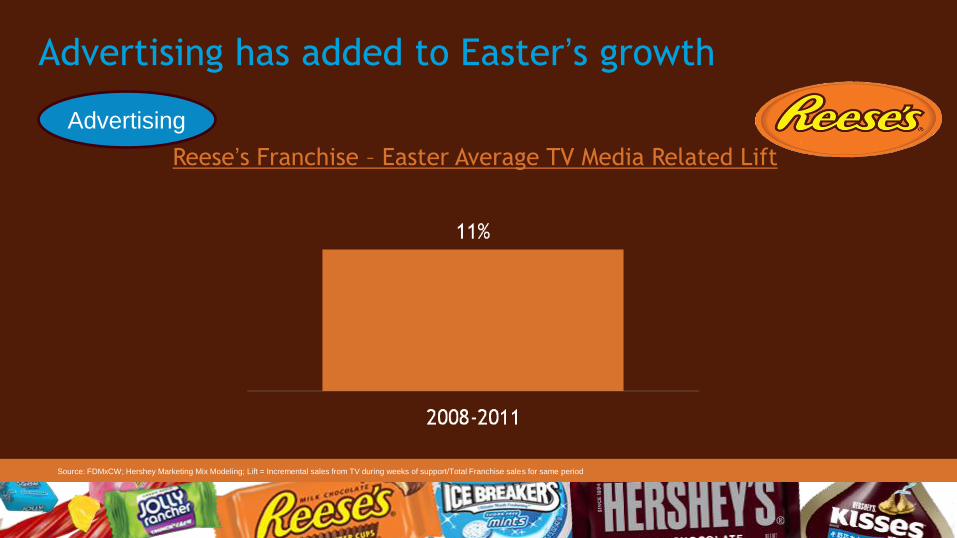
Advertising has added to Easter’s growth
Source: FDMxCW; Hershey Marketing Mix Modeling; Lift = Incremental sales from TV during weeks of support/Total Franchise sales for same period
Reese’s Franchise – Easter Average TV Media Related Lift
Advertising

…customization became a source of innovation
Reese’s Franchise – Easter Innovation
Seasonally
wrapped/shaped items in
consumer’s favorite brands
are important for the
Easter Hunt & Party
Core Insight 2012 Innovation
Reese Bunny
All Other HSY Easter Sales
2012 Easter Growth
28%
72%
Source: Nielsen FDMx 9 Weeks Ending 04/14/12
Innovation

…distribution expanded seasons in c-stores
Reese’s Franchise – Easter ACV
Source: MSA
Distribution
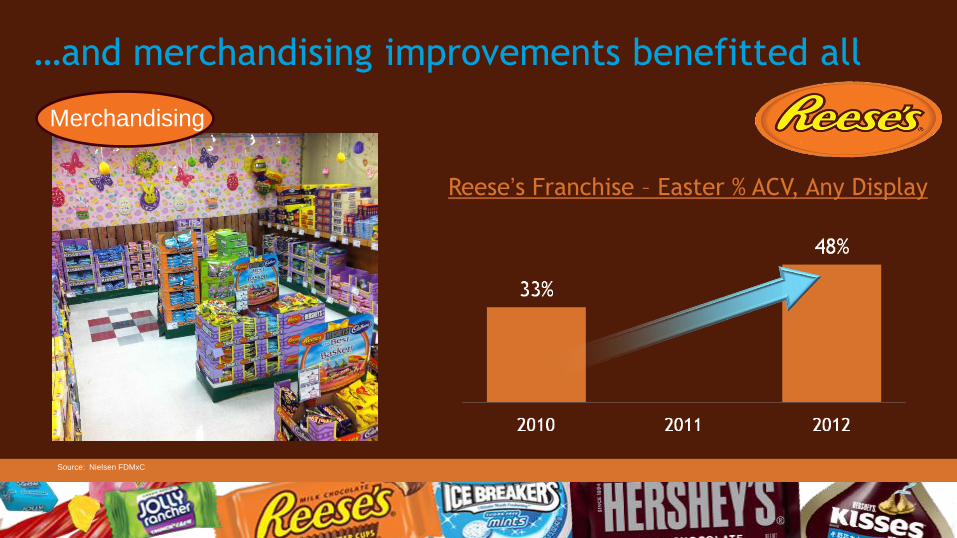
…and merchandising improvements benefitted all
Source: Nielsen FDMxC
Reese’s Franchise – Easter % ACV, Any Display
Merchandising

…today 10 Chocolate Brands are being advertised
2012 2011 2010 2009 2008
Advertising

…with impressive advertising lifts
Lift = Incremental sales from TV during weeks of support/Total
Franchise sales for same period
*HSY Chocolate Advertised Brands = Overall Lift across advertised
Chocolate Segment Franchises in the given year
i.e. 2008: RSE, HSY, Kisses, Bliss
2009: RSE, HSY, Kisses, Bliss, Kit Kat, Cadbury
2010: RSE, HSY, Kisses, Bliss, Kit Kat, Cadbury, York, MAJ
2011: RSE, HSY, Kisses, Bliss, Kit Kat, Cadbury, York, MAJ
HSY Chocolate Advertised Brands* - TV Media Related Lift
Source: FDMxCW; Hershey Marketing Mix Modeling
Advertising

Insights also led to successful chocolate innovation
2010 2009 2011 2012 2013
Hand-to-
Mouth
Platform
Brand
Extension
Functional
Benefit
Innovation

Next, we applied IDP to Sweets & Refreshment
CORE Additional
Chocolate
Brands
Sweets & Refreshment

Segments
Ne
ed
S
tate
s
6
5
3
2
4
Comfort
Social Confidence
10
8
7
9
New Landscape revealed unique Twizzler insights
Pending Pending Pending Pending Pending Pending

…which shaped the activation plan
Merchandising Distribution . Innovation Advertising

…producing strong lifts on Twizzlers advertising
Twizzlers Franchise - Average TV Media Related Lift
Source: FDMxCW; Hershey Marketing Mix Modeling; Lift = Incremental sales from TV during weeks of support/Total Franchise sales for same period
Advertising

…significant C-Store distribution gains
Twizzlers Franchise - King Size C-Store ACV Distribution
Source: Nielsen 5/19/12

…and robust growth during summer
Twizzlers Franchise – Summer Retail Dollar % Change Merchandising
Source: Nielsen xAOC

IDP model is also being leveraged with acquisitions
CORE Additional
Chocolate
Brands
Sweets &
Refreshment
Adjacencies &
Acquisitions
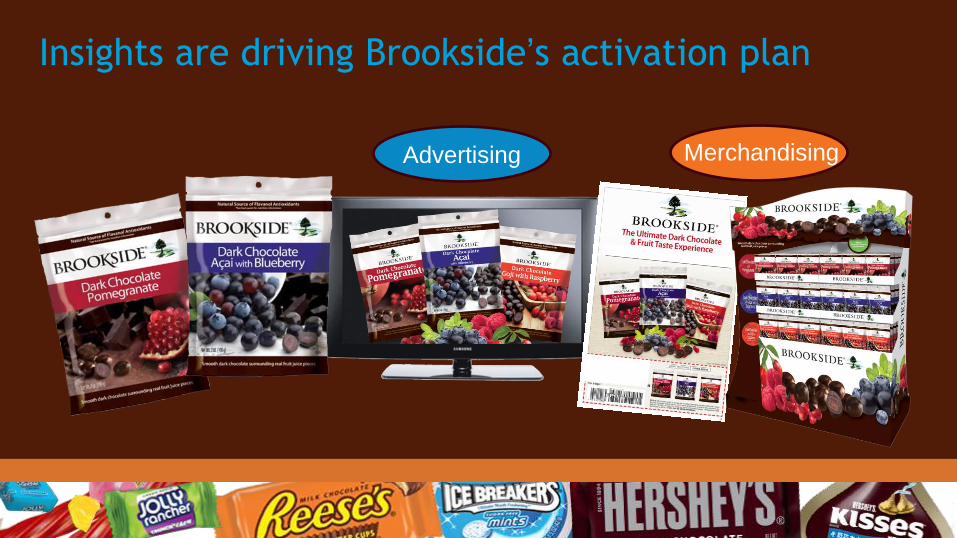
Insights are driving Brookside’s activation plan
Merchandising Advertising

…to introduce Brookside to new US consumers
TODAY
2017
Club
Club
Food
Drug
Mass
C-Store
Specialty
6/25/2012
218
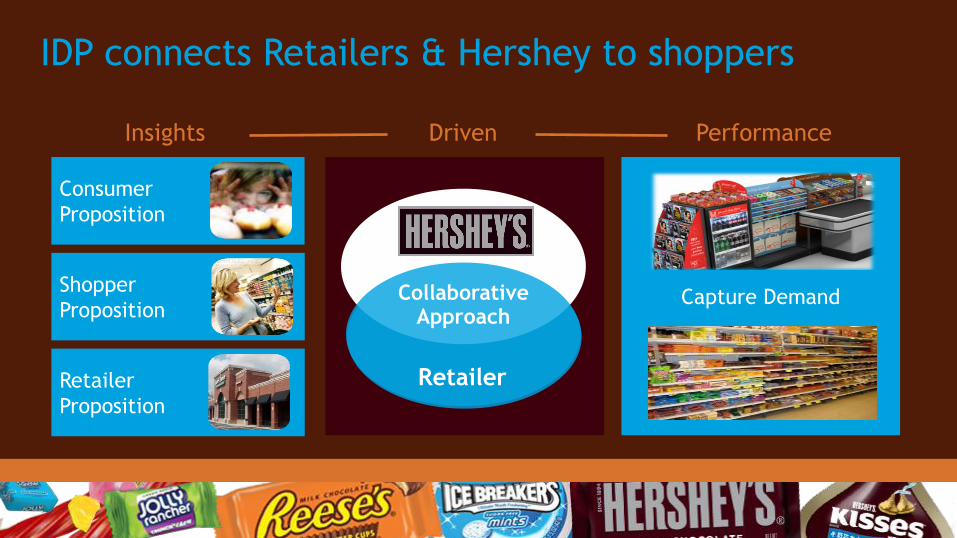
Capture Demand
Retailer
Collaborative Approach
Retailer
Proposition
Shopper
Proposition
Consumer
Proposition
Insights Driven Performance
IDP connects Retailers & Hershey to shoppers

6/25/2012
219
Engaged Exploring Munchers
Deal Seekers
Loyal Indulgers
Expertise Tools
Confection Loving Moderators
Guilty Controllers
Insight
…leveraging Hershey’s proprietary Insights & Tools
Detached Occasionalists
6/25/2012
220
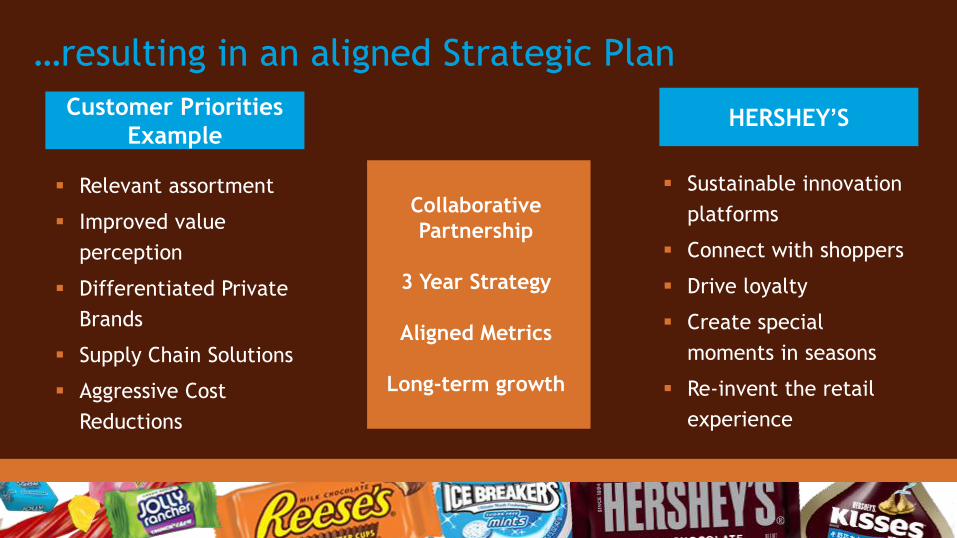
…resulting in an aligned Strategic Plan
Sustainable innovation
platforms
Connect with shoppers
Drive loyalty
Create special
moments in seasons
Re-invent the retail
experience
Collaborative
Partnership
3 Year Strategy
Aligned Metrics
Long-term growth
Relevant assortment
Improved value
perception
Differentiated Private
Brands
Supply Chain Solutions
Aggressive Cost
Reductions
Customer Priorities
Example HERSHEY’S
6/25/2012
221
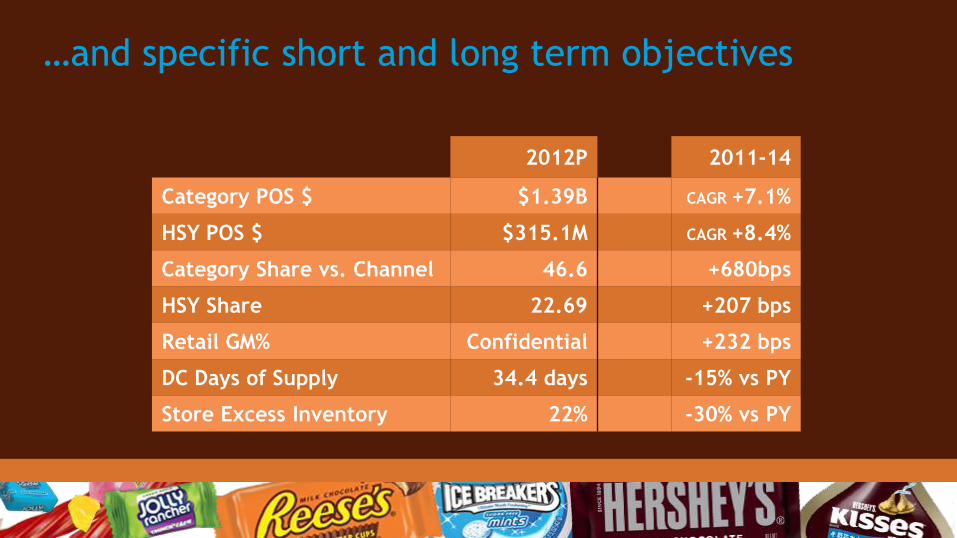
…and specific short and long term objectives
2012P 2011-14
Category POS $ $1.39B CAGR +7.1%
HSY POS $ $315.1M CAGR +8.4%
Category Share vs. Channel 46.6 +680bps
HSY Share 22.69 +207 bps
Retail GM% Confidential +232 bps
DC Days of Supply 34.4 days -15% vs PY
Store Excess Inventory 22% -30% vs PY
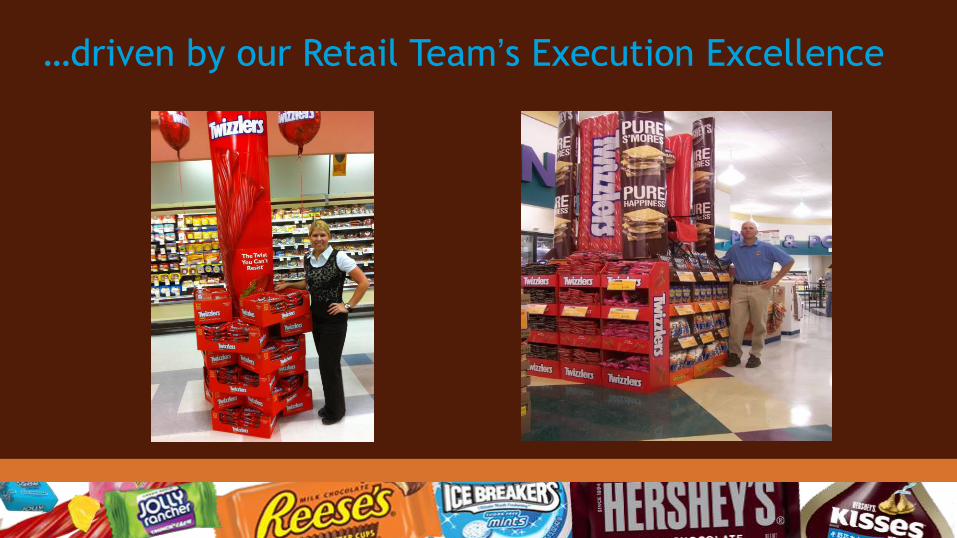
…driven by our Retail Team’s Execution Excellence

6/25/2012
223
Resulting in superior performance
2011 Gross Dollar Sales % Change vs YA
Source: Hershey Financials

6/25/2012
224
…and many exciting opportunities remain for IDP
Continuous Improvement New Opportunity Areas
Robust Innovation Pipeline
Sweets & Refreshment Roadmap to $1.5B
Brookside Expansion
Fair Share with Hispanic Consumers
Expand IDP Customers
Execution Excellence – Summer Season
Precision Shopper Marketing -
“Social/Local/Mobile”
E-Commerce Space
Create New Usage Occasions

6/25/2012
225
Sweets & Refreshment plan adds $450m by 2016
Sweets
BRAND 1 # MINT 1 # in
GROWTH 1 #

6/25/2012
226
...Hispanic consumer fair share potential is $400m
$400M Hershey
Opportunity
CMG Buy
Rate Index CMG Buy
Rate Index
Hershey
Buy Rate
Index
CMG Buy
Rate Index Hershey
Buy Rate
Index
Source: Nielsen US Homescan Panels; The Cambridge Group Assessment

Key Messages
In a challenging economy, confection has grown above its historical average and
performed better than other “center of store” categories
Hershey’s investments in Knowledge, Insights and Customer Solutions have helped
accelerate confection’s growth
Insights Driven Performance is a systematic and repeatable model that has produced
balanced growth across our Strategic Business Units and Channels
We’ve built a robust pipeline of future growth opportunities
Agenda
J.P. Bilbrey President & CEO Hershey Overview
Michele Buck Senior Vice President, Strategic Vision Chief Growth Officer Mike Wege Senior Vice President, Commercial Expansion Chief Commercial Officer Jane Xu General Manager, China Update Hershey China
Dan Vucovich Senior Vice President, U.S. U.S. Strength Bert Alfonso Executive Vice President, CFO Building Shareholder Value & Chief Administrative Officer J.P. Bilbrey President & CEO Wrap-up

Bert Alfonso, Executive Vice President, CFO & Chief Administrative Officer
Building Shareholder Value

Key Messages
Solid overall financial position
Focused on gross margin and productivity
Disciplined approach to global expansion (organic and M&A)
Balanced approach to cash usage

Drivers of financial success
Price realization
Aggressive productivity
Investment in brand building initiatives
Expanding go-to-market capabilities

Net Sales drivers: Balanced growth between volume and pricing
Net Sales Volume Price Fx
2008
2008
2008
2008
2009
2009
2009
2009
2010
2010
2010
2010
2011
2011
2011
2011

Focused on gross margin
*Adjusted, excludes business realignment and impairment charges & NSRPE
~43.4%
Gross Margin*
+42.4% +42.8%
+39.2%
+35.1%
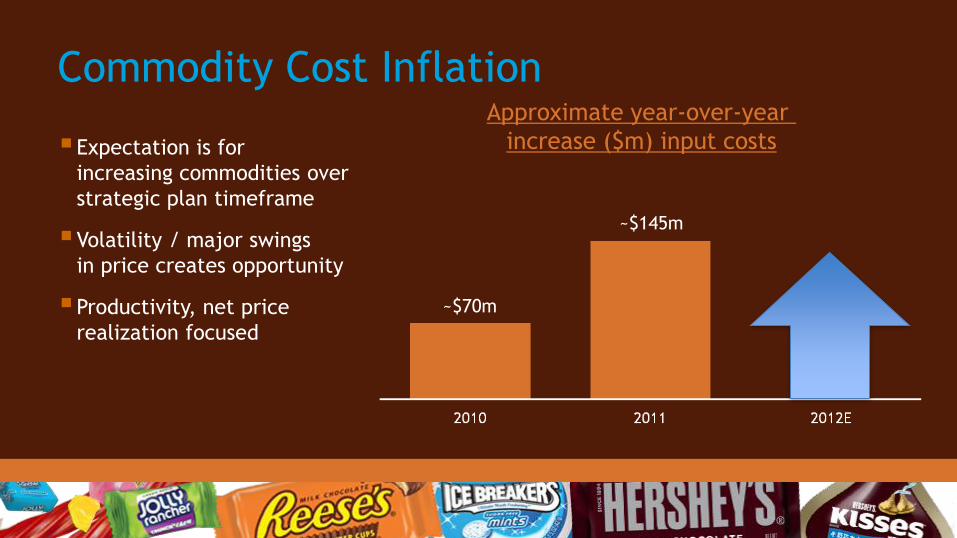
Commodity Cost Inflation Approximate year-over-year
increase ($m) input costs
~$145m
Expectation is for
increasing commodities over
strategic plan timeframe
Volatility / major swings
in price creates opportunity
Productivity, net price
realization focused
~$70m

Supply chain optimization
North American Confectionery Facilities
Distribution Centers
2007 2010
5 4
17 11
2012*
3
10
GSCT delivered ~$185m in savings Project Next Century to deliver~$65-$80m in savings
*Excludes Brookside Facilities and Distribution Centers

Next Century of Chocolate in Hershey
Next Century
Milk Receiving
Processing
Original Plant-1992
Bulk Rail Receiving
Utilities

Productivity visibility exists beyond Project Next Century Manufacturing OVHD & Distribution ~$1.3 billion. Productivity/continuous
improvement, historically, about 3-4% of manufacturing overhead and distribution

Productivity targets
Annual productivity target ~$40 to $50 million, primarily driven by improvements in COGS
Opportunities exist outside normal “4 walls” in strategic partnerships
Goal is for gross margin to increase over the next few years

Mid-West
Ferrero
Ogden
Mississauga
EDC - III
Hershey & Ferrero distribution on track
Ferre
ro H
ers
hey
Hershey Distribution Center
Ferrero Distribution Center

Solid pipeline of cost savings & productivity
Normal Productivity
2011 2012 2013 2014
Increm. GSCT Productivity
Project Next Century
Strategic Procurement Partnerships
SG&A Leverage
WIP WIP

Net debt to EBITDA LTD refinanced to “fixed” at favorable rates
A / A2 debt rating
$1.1b (unused) credit revolver in place
No outstanding commercial paper
0.9x 0.8x
1.2x
2.1x

Targeted Capital Structure
Target range 1.5x to 2.0x debt/EBITDA
For “right” strategic acquisition would
consider debt/EBITDA of 2.0x to 2.5x
Investment grade rating preferred at
all times
“A” is preferred rating
1.5x
Debt to EBITDA
2011
Cash Flow Priorities
* Cap-ex for volume / capacity expansion and cost reduction
#1 M&A
Opportunities
#3 Cap-ex *
#4 Sh. Buyback
and Debt
Reduction
#2 Dividend
Financial Flexibility

M&A focus on geographical bolt-ons
Accelerating top-line growth
Preference to be EPS accretive by year 2. For “right” strategic acquisition would accept EPS accretion by year 3.
Bolt-ons with low integration risk
Experience and disciplined • Lotte (2007)
• Bauducco (2008)
• Brookside (2012)
• SAP IT upgrades / installation
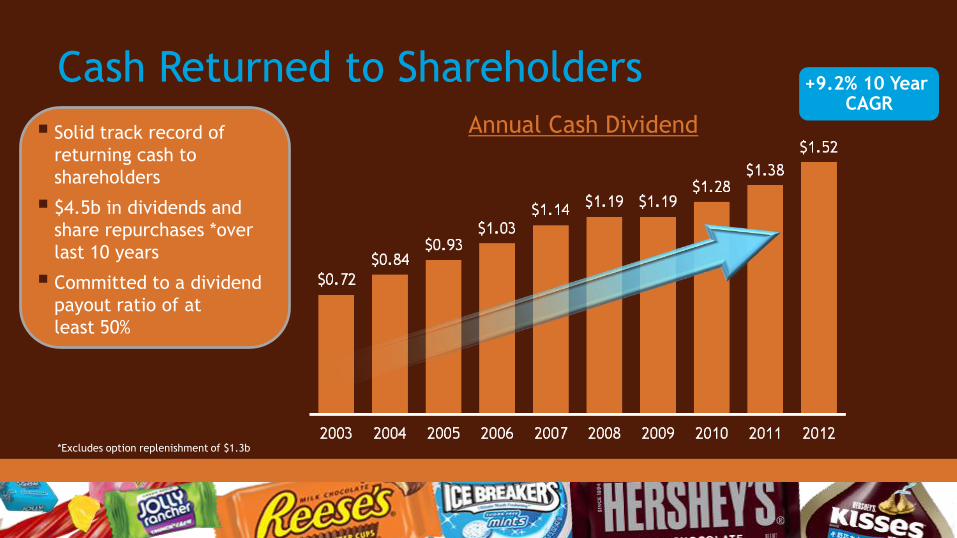
Cash Returned to Shareholders
Annual Cash Dividend Solid track record of
returning cash to
shareholders
$4.5b in dividends and
share repurchases *over
last 10 years
Committed to a dividend
payout ratio of at
least 50%
*Excludes option replenishment of $1.3b
+9.2% 10 Year CAGR
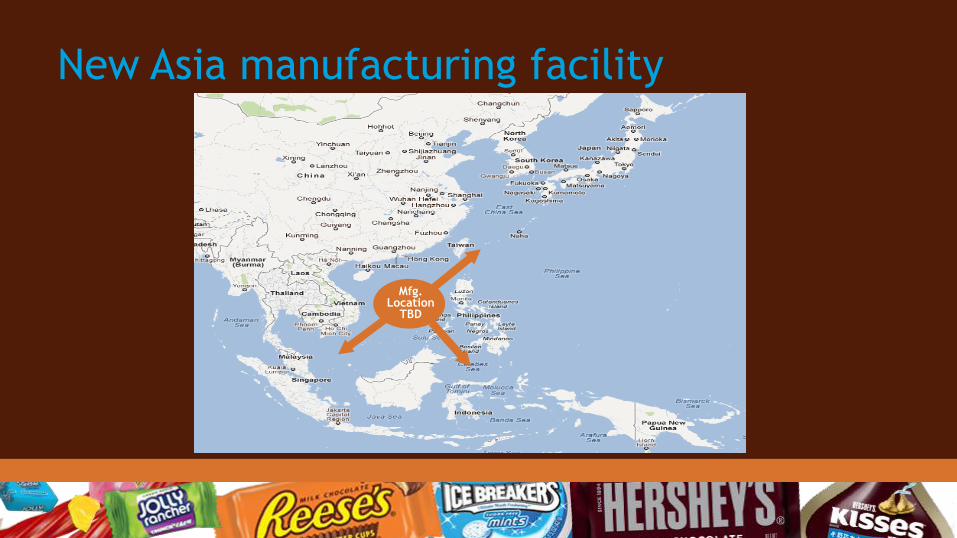
New Asia manufacturing facility
Mfg. Location
TBD
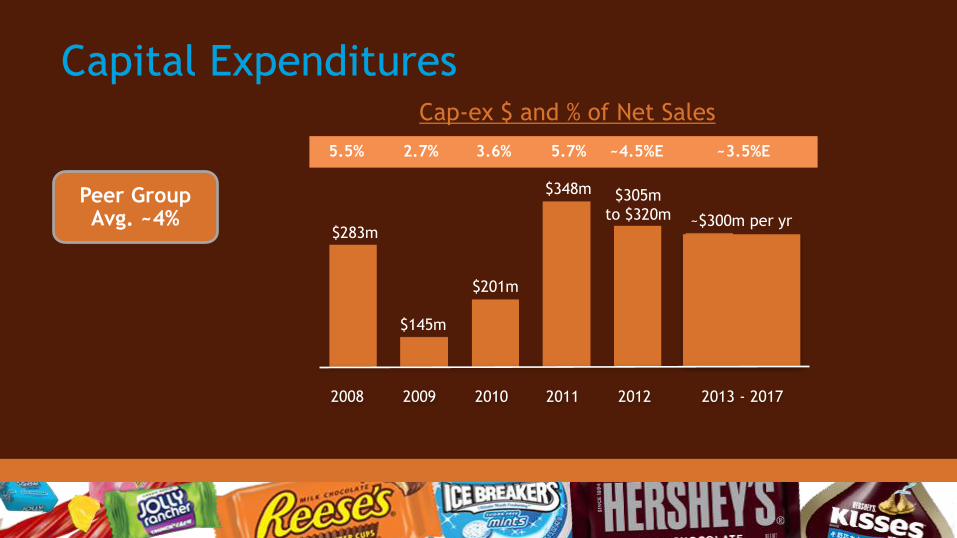
Capital Expenditures Cap-ex $ and % of Net Sales
2.7% 5.5% 3.6% 5.7% ~4.5%E ~3.5%E
$305m
to $320m
$201m
$145m
$283m
$348m
~$300m per yr
Peer Group Avg. ~4%
2008 2009 2010 2011 2012 2013 - 2017

Long-term growth rates
Achievable, consistent and
predictable, while allowing
for growth and investment +5-7%
Long-term Objectives
+8-10%

A path for continued growth
Visible Growth Opportunities
Operational Excellence
Financial Strength
+
+
Visible Growth Opportunities

Agenda J.P. Bilbrey President & CEO Hershey Overview
Michele Buck Senior Vice President, Strategic Vision Chief Growth Officer Mike Wege Senior Vice President, Commercial Expansion Chief Commercial Officer Jane Xu General Manager, China Update Hershey China
Dan Vucovich Senior Vice President, U.S. U.S. Strength Bert Alfonso Executive Vice President, CFO Building Shareholder Value & Chief Administrative Officer J.P. Bilbrey President & CEO Wrap-up
Summary
Hershey has great brands and our U.S. business is fundamentally
advantaged
Gaining traction in international markets…and will remain disciplined in
our approach to global expansion
New long-term targets achievable and allow us to deliver predictable and
consistent results
Will continue to create shareholder value…
…on the path to our aspirational goal of $10 billion in net sales
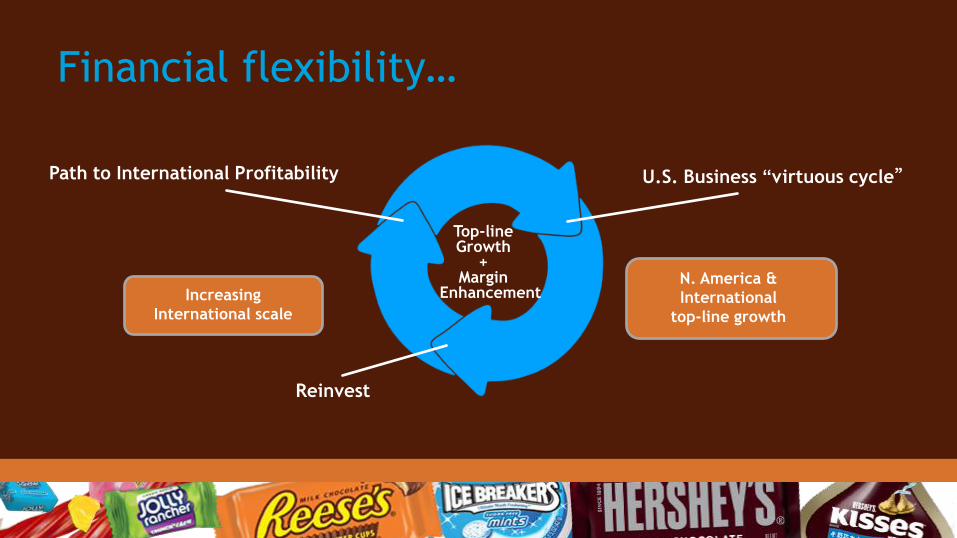
Financial flexibility…
Path to International Profitability
N. America &
International
top-line growth
Increasing
International scale
Top-line Growth
+ Margin
Enhancement
U.S. Business “virtuous cycle”
Reinvest

Business model with multiple levers for continued success…
Net Sales
List price
Vol/mix shifts
Exposure to multiple
fast-growing channels
Supply Chain SG&A
Continuous productivity (inside)
Outside “4 wall” productivity
U.S. sales force
Trade promotion effectiveness (globally)
Insights Driven Performance

…that will deliver low double digit TSR returns
Long–term Targets
Net Sales +5 – 7%
Adjusted EPS-diluted +8 – 10%
Dividend Payout Ratio ~50%
Total Shareholder Return +10 – 12%

Year is on track
Food +1.5% +0.1pts
Drug +3.0% +0.3 pts
Mass x +3.8% +0.1 pts
Convenience +10.4% +0.4 pts
FDMxC +4.9% +0.3 pts
xAOC+C* +5.8% +0.2pts
% Chg
5/19/12 YTD
* Food, Drug, Mass X, Convenience, Walmart, Sam’s, BJ’s, partial Dollar Channel, partial Club channel and Military Source: Nielsen, Hershey estimates
Market
Share Gain
Hershey U.S. Retail Takeaway (CMG)
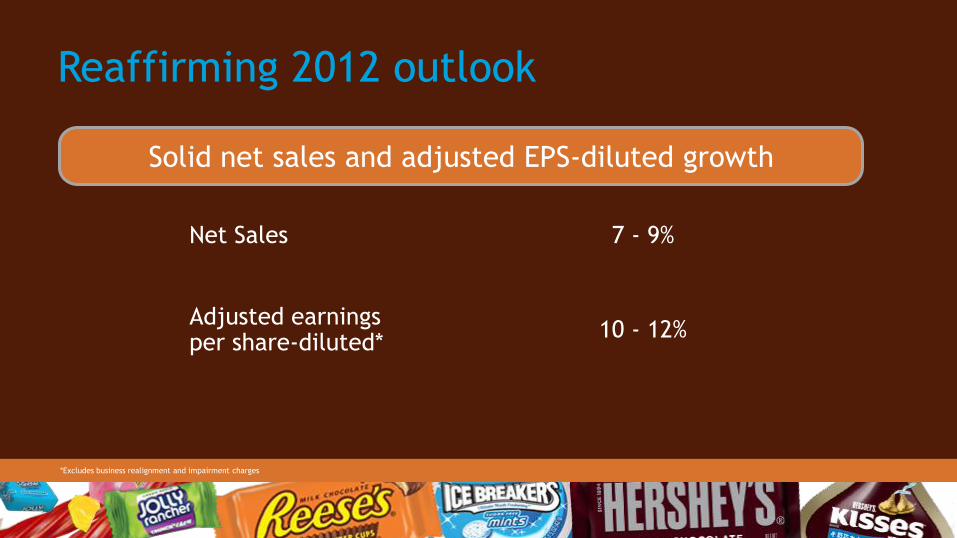
Reaffirming 2012 outlook
Net Sales 7 - 9%
Adjusted earnings per share-diluted*
10 - 12%
Solid net sales and adjusted EPS-diluted growth
*Excludes business realignment and impairment charges

Q & A

Non-GAAP Income Measures In this presentation, Hershey references income measures that are not in accordance with U.S. generally accepted accounting
principles (GAAP) because they exclude business realignment and impairment charges, business acquisition closing and integration
costs, certain gains and losses, and non-service related pension costs. These non-GAAP financial measures are used in evaluating results
of operations for internal purposes. These non-GAAP measures are not intended to replace the presentation of financial results in
accordance with GAAP. Rather, the Company believes exclusion of such items provides additional information to investors to facilitate
the comparison of past and present operations.
On June 25, 2012, the Company reaffirmed its outlook for full year 2012 net sales growth of about 7 to 9 percent, including the
expected impact of foreign currency exchange rates, and full year adjusted earnings per share-diluted growth of 10 to 12 percent. In
2011, the Company recorded GAAP charges of $43.4 million, or $0.11 per share-diluted, attributable to Project Next Century and $5.8
million, or $0.02 per share-diluted related to the Global Supply Chain Transformation (GSCT) program and $1.3 million, or $0.01 per
share-diluted of NSRPE. Additionally, in the third quarter of 2011, the Company recorded a pre-tax gain on the sale of certain
trademark licensing rights of $17.0 million, or $0.05 per share-diluted. In 2012, acquisition closing and integration costs related to the
Brookside acquisition are expected to be $0.04 to $0.05 per share-diluted. Additionally, the Company expects to record total GAAP
charges of about $55 million to $65 million, or $0.16 to $0.19 per share-diluted, attributable to Project Next Century and $19.0
million, or $0.05 per share-diluted, of NSRPE. Below is a reconciliation of GAAP and non-GAAP items to the Company’s 2011 adjusted
earnings per share-diluted and projected adjusted earnings per share-diluted for 2012:
2008 2009 2010 2011 2012 (Projected)
Reported EPS-Diluted $1.36 $1.90 $2.21 $2.74 $2.82 - $2.92
Acquisition closing & integration charges — — — — 0.04 - 0.05
Gain on sale of trademark licensing rights — — — (0.05) —
Total Business Realignment and Impairment Charges, net 0.52 0.27 0.34 0.13 0.16 - 0.19
NSRPE (0.12) 0.06 0.02 0.01 0.05
Adjusted EPS-Diluted $1.76 $2.23 $2.57 $2.83 $3.11 - $3.17

Reconciliation of GAAP & Non-GAAP Information Appendix I
Reconciliation of GAAP and Non-GAAP Information
For the years ended December 31,
Income
Gross Net Per Share-
In millions of dollars except per share amounts Profit EBIT Income Diluted
Results in accordance with GAAP $2,531.9 $1,055.0 $628.9 $2.74
Adjustments:
Business realignment charges included in
cost of sales 45.1 45.1 45.1 0.12
Non-service related pension expense included
in cost of sales - - - -
Business realignment charges included in selling,
marketing and administrative ("SM&A") - 5.0 5.0 0.01
Non-service related pension expense included
in SM&A - 2.8 2.8 0.01
Gain on sale of trademark rights included in SM&A - (17.0) (17.0) (0.05)
Business realignment and impairment charges/
(credits), net - (0.9) (0.9) -
Tax impact of credits/(charges) - - (13.2)
Adjusted Non-GAAP results $2,577.0 $1,090.0 $650.6 $2.83
2011

Reconciliation of GAAP & Non-GAAP Information Appendix I
Reconciliation of GAAP and Non-GAAP Information
For the years ended December 31,
Income
Gross Net Per Share-
In millions of dollars except per share amounts Profit EBIT Income Diluted
Results in accordance with GAAP $2,415.2 $905.3 $509.8 $2.21
Adjustments:
Business realignment charges included in
cost of sales 13.7 13.7 13.7 0.04
Non-service related pension expense included
in cost of sales 0.9 0.9 0.9 -
Business realignment charges included in selling,
marketing and administrative ("SM&A") - 1.5 1.5 -
Non-service related pension expense included
in SM&A - 5.0 5.0 0.02
Gain on sale of trademark rights included in SM&A - - - -
Business realignment and impairment charges/
(credits), net - 83.4 83.4 0.30
Tax impact of credits/(charges) - - (22.8)
Adjusted Non-GAAP results $2,429.8 $1,009.8 $591.5 $2.57
2010

Reconciliation of GAAP & Non-GAAP Information
Appendix I
Reconciliation of GAAP and Non-GAAP Information
For the years ended December 31,
Income
Gross Net Per Share-
In millions of dollars except per share amounts Profit EBIT Income Diluted
Results in accordance with GAAP $2,053.2 $761.6 $436.0 $1.90
Adjustments:
Business realignment charges/(credits) included in
cost of sales 10.1 10.1 10.1 0.03
Non-service related pension expense/(credit) included
in cost of sales 14.7 14.7 14.7 0.04
Business realignment charges included in SM&A - 6.1 6.1 0.02
Non-service related pension expense/(credit) included
in SM&A - 6.8 6.8 0.02
Business realignment and impairment charges, net - 82.9 82.9 0.22
Tax impact of credits/(charges) - - (46.5)
Adjusted Non-GAAP results $2,078.0 $882.2 $510.1 $2.23
2009

Reconciliation of GAAP & Non-GAAP Information
Appendix I
Reconciliation of GAAP and Non-GAAP Information
For the years ended December 31,
Income
Gross Net Per Share-
In millions of dollars except per share amounts Profit EBIT Income Diluted
Results in accordance with GAAP $1,757.7 $589.9 $311.4 $1.36
Adjustments:
Business realignment charges/(credits) included in
cost of sales 77.8 77.8 77.8 0.23
Non-service related pension expense/(credit) included
in cost of sales (35.6) (35.6) (35.6) (0.09)
Business realignment charges included in SM&A - 8.1 8.1 0.02
Non-service related pension expense/(credit) included
in SM&A (10.3) (10.3) (0.03)
Business realignment and impairment charges, net - 94.8 94.8 0.27
Tax impact of credits/(charges) - - (43.9)
Adjusted Non-GAAP results $1,799.9 $724.7 $402.3 $1.76
2008


![Financial Results, Investor Update & Limited Review for June 30, 2014 (Standalone) [Result]](https://img.pdfslide.us/doc/110x75/577cb13b1a28aba7118b936a/financial-results-investor-update-limited-review-for-june-30-2014-standalone.jpg)


![Updates on Investor Update [Company Update]](https://img.pdfslide.us/doc/110x75/577cb4961a28aba7118c90ad/updates-on-investor-update-company-update.jpg)


![Investor Update [Company Update]](https://img.pdfslide.us/doc/110x75/577c7caa1a28abe0549b8763/investor-update-company-update-578043b3b5bc3.jpg)


![Q4 & FY16 Investor Update [Company Update]](https://img.pdfslide.us/doc/110x75/577c7fc91a28abe054a60c7a/q4-fy16-investor-update-company-update.jpg)
![Financial Results with Results Press Release, Investor Update & Limited Review Report for June 30, 2015 [Company Update]](https://img.pdfslide.us/doc/110x75/577cb40d1a28aba7118c46c3/financial-results-with-results-press-release-investor-update-limited-review.jpg)